
Int J App Pharm, Vol 17, Issue 2, 2025, 384-392Original Article
FORMULATION OPTIMIZATION AND EVALUATION OF MOUTH-DISSOLVING TABLETS OF FENOPROFEN CALCIUM DIHYDRATE BY SUBLIMATION PROCESS
SHAILENDRA SINGH NARWARIYA1*, SUMAN JAIN2, ALAGUSUNDARAM MUTHUMANICKAM3
1Department of Pharmaceutics, School of Pharmacy, ITM University Gwalior, Madhya Pradesh-474001, India. 2Department of Pharmaceutics, Jiwaji University, Gwalior, Madhya Pradesh-474001, India. 3Department of Pharmaceutics, RVS College of Pharmaceutical Sciences, Sulur, Coimbatore, Tamil Nadu-641402, India
*Corresponding author: Shailendra Singh Narwariya; *Email: shailugsp@gmail.com
Received: 01 Jan 2024, Revised and Accepted: 13 Dec 2024
ABSTRACT
Objective: An anti-inflammatory analgesic called Fenoprofen Calcium Dihydrate (FCD) is used to treat mild to moderate pain as well as the symptoms of osteoarthritis and rheumatoid arthritis. The goal of the current study was to formulate, optimize, and assess FCD Mouth Dissolving Tablets (MDT).
Methods: The sublimation process was used to create the MDT of FCD using a variety of superdisintegrants, including as Indian-414, Croscarmellose Sodium (CCS), and Sodium Starch Glycolate (SSG). Skimmed milk powder serves as an excipient, solubility enhancer, and taste-masking ingredient. One subliming substance used in the sublimation process is camphor. The design can be generated with three center points per block with 15 runs. The formulas were optimized using the Box-Bhenken Design (BBD) with three independent variables (X1, X2, X3) at three levels (-1, 0,+1) with a minimum to maximum range. R1, R2, and R3, whose titles were wetting time, drug content, and disintegration time, respectively, were the response or dependent variables.
Results: Fifteen MDTs of FCD formulations with independent and dependent variables are optimized using BBD. The smooth flow is demonstrated by the micrometric study. All compositions, including powder blends, have flow abilities that vary from good to exceptional, with values between 25.11 and 32.87. The hardness of the tablet ranged from 2.3±0.19 to 2.9±0.13 kg/cm2. The findings indicated that the wetting duration was between 32±1.38 and 39±1.72 sec, and the water absorption ratio ranged from 65±1.58 to 83±1.8%. All produced formulations had drug contents ranging from 94.5±0.74 to 99.69±0.59. The range of the disintegration time was 39±2.38 to 47±1.46 sec. The proportion of FCD from the formulations S3, S8, and S13 was 99.57, 99.64, and 99.98 after 90 min. At the p0.05 level, the formulations S3, S8, and S13 demonstrated good stability and statistical significance.
Conclusion: Sublimation was used to successfully construct FCD MDTs using a range of superdisintegrants, and the outcomes were good in every way.
Keywords: FCD, Sublimation, Mouth-dissolving tablets, BBD, Skimmed milk powder
© 2025 The Authors. Published by Innovare Academic Sciences Pvt Ltd. This is an open access article under the CC BY license (https://creativecommons.org/licenses/by/4.0/)
DOI: https://dx.doi.org/10.22159/ijap.2025v17i2.50283 Journal homepage: https://innovareacademics.in/journals/index.php/ijap
INTRODUCTION
Oral administration of drugs is thought to be the most traditional method for treating illnesses. Because of their solidity, ease of development, and self-administration accessibility, tablets are a frequently prescribed dose type [1]. Patients frequently have difficulty swallowing traditional medications, especially younger and older patients. This issue may worsen when travelling because water is either scarce or unavailable [2]. The creation of tablets that dissolve in the mouth offers a solution to these issues with traditional dose forms. Drugs contained in mouth-dissolving tablets are solid dosage forms that dissolve in the mouth in less than a minute [3, 4]. Despite a number of drawbacks, oral drug delivery is still the preferred method of medication distribution; therefore, ease of administration and increased patient compliance are significant design considerations [5]. One way to address this issue with the innovative drug delivery system is to formulate MDTs that, when dissolved in the mouth, dissolve rapidly and waterless in a matter of seconds owing to the action of a superdisintegrant or by optimizing the pore structure within the formulation [6]. These dosage forms are put in the mouth and given time to dissolve or spread throughout the saliva [7]. They do not require water to be administered because they release the medication as soon as they come into contact with saliva. There is a significant prevalence of non-compliance with prescriptions because many patients, particularly the elderly, have difficulty swallowing tablets, capsules, and fluids. As a result, many do not follow their doctors' orders. Research focused on compliance has produced a number of innovative and safer drug delivery devices. One such example would be tablets that dissolve or disintegrate quickly, either due to their rapid disintegration or because they dissolve in saliva [8]. Most efforts have been on making medications easier to use while keeping quality of life in mind. Of all the dosage forms created to facilitate administration, the MDT is the most popular commercial product. Because it is so simple to administer, the oral cavity is a popular location for medication delivery. One typical way to administer different dose forms, including as tablets, capsules, and liquid formulations, is by oral administration. In the past ten years, there has been a lot of interest in MDT technologies that cause tablets to dissolve in the mouth without needing to be chewed and that need more water consumption. A fast-melting, fast-dispersing, rapid-dissolve, rapid-melt, or quick-disintegrating tablet are other names for the MDT [9]. All MDTs approved by the Food and Drug Administration (FDA) fall into the category of oral disintegrating tablets. The term "orodispersible tablet" was recently introduced by the European Pharmacopoeia to describe a tablet that dissolves or disperses in the mouth in less than three minutes before swallowing. Patients can easily swallow such a tablet since it dissolves into tiny grains or melts in the mouth from a hard solid to a gel-like structure [10]. High porosity was obtained in the sublimation process because numerous pores were created where camphor particles had previously been present in the compressed tablets before the camphor was sublimated [11]. These compressed pills quickly dissolved in saliva after 15 sec despite having a high porosity of about 30%.
An anti-inflammatory analgesic called fenoprofen calcium dihydrate is used to treat mild to moderate pain as well as the symptoms of osteoarthritis and rheumatoid arthritis [12]. The current study focuses on the sublimation process's formulation optimization and assessment of FCD mouth dissolving tablets.
MATERIALS AND METHODS
Materials
FCD is an anti-inflammatory analgesic used to treat mild to moderate pain in addition to the signs and symptoms of rheumatoid arthritis was procured from Balpharma ltd (Bangalore, India); DMSO (dimethyl sulfoxide) (Solvent for FCD) was brought from Qualigens chemicals (Maharashtra, India); Skimmed Milk Powder (SMP) used as an excipient and calcium supplement were purchased from local market (Gwalior, India); Indion414, SSG, and CCS were used as a superdisintegrants and obtained from Drugs India (Hyderabad, India); Aspartame (Sweetener), Magnesium stearate (Lubricant), Methylcellulose (Binder and disintegrant) was procured from SD fine chemicals (Mumbai, India); D-mannitol (Bulking agent) is supplied from Chemkart (Mumbai, India). The remaining substances and reagents used were analytical grade.
Formulation of mouth-dissolving tablets by sublimation method
Camphor was used as a subliming agent in the sublimation procedure used to create FCD MDTs [13, 14]. The fundamental method for creating MDTs using the sublimation approach is to combine inert solid substances (such as urea, urethane, ammonium carbonate, camphor, and naphthalene) with other tablet excipients before compressing the mixture into a tablet. A porous structure was produced by sublimating the volatile substance. The tablets have enough mechanical strength for practical application and disintegrate in 10–20 sec. A total of fifteen formulations were created by adjusting the amount of camphor, the subliming agent. Fig. 1 displays the schematic images of the sublimation procedure. Magnesium stearate and other ingredients were added to the blend and well mixed after precisely weighed ingredients according to formulation table 1 were sifted through sieve no. 44 and thoroughly mixed for 10 min. A tablet punching machine made by Rimek was used to compress the tablets. After that, the crushed tablets were sublimated for 30 min at 80 °C. The tablets were evaluated for various evaluation characteristics.
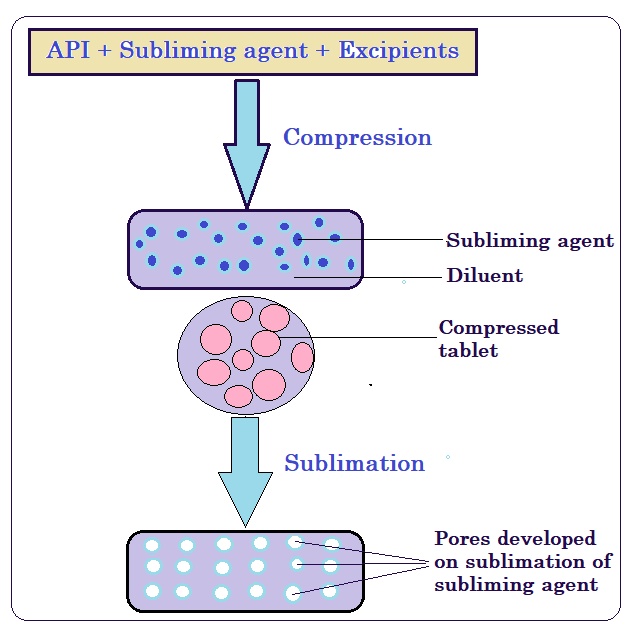
Fig. 1: Illustrations of sublimation method for MDT
Table 1: Optimized formulations of Fenoprofen calcium dehydrate MDT by sublimation method
| Ingredients in mg | S1 | S2 | S3 | S4 | S5 | S6 | S7 | S8 | S9 | S10 | S11 | S12 | S13 | S14 | S15 | Controlled tablet |
| FCD | 200 | 200 | 200 | 200 | 200 | 200 | 200 | 200 | 200 | 200 | 200 | 200 | 200 | 200 | 200 | 200 |
| Indion414 | 7.5 | 12.5 | 17.5 | 22.5 | 30 | -- | -- | -- | -- | -- | -- | -- | -- | -- | -- | -- |
| CCS | -- | -- | -- | -- | -- | 7.5 | 12.5 | 17.5 | 22.5 | 30 | -- | -- | -- | -- | -- | -- |
| SSG | -- | -- | -- | -- | -- | -- | -- | -- | -- | -- | 7.5 | 12.5 | 17.5 | 22.5 | 30 | -- |
| Camphor | 20 | 17.5 | 15 | 12.5 | 10 | 20 | 17.5 | 15 | 12.5 | 10 | 20 | 17.5 | 15 | 12.5 | 10 | 20 |
| SMP | 133.5 | 131 | 128.5 | 126 | 121 | 133.5 | 131 | 128.5 | 126 | 121 | 133.5 | 131 | 128.5 | 126 | 121 | 136 |
| Aspartame | 4 | 4 | 4 | 4 | 4 | 4 | 4 | 4 | 4 | 4 | 4 | 4 | 4 | 4 | 4 | 4 |
| Mg stearate | 2 | 2 | 2 | 2 | 2 | 2 | 2 | 2 | 2 | 2 | 2 | 2 | 2 | 2 | 2 | 2 |
| Methyl cellulose | 3 | 3 | 3 | 3 | 3 | 3 | 3 | 3 | 3 | 3 | 3 | 3 | 3 | 3 | 3 | 3 |
| D-Mannitol | 30 | 30 | 30 | 30 | 30 | 30 | 30 | 30 | 30 | 30 | 30 | 30 | 30 | 30 | 30 | 35 |
| Vanilla flavour | q. s. | q. s. | q. s. | q. s. | q. s. | q. s. | q. s. | q. s. | q. s. | q. s. | q. s. | q. s. | q. s. | q. s. | q. s. | q. s. |
| Total weight in mg | 400 | 400 | 400 | 400 | 400 | 400 | 400 | 400 | 400 | 400 | 400 | 400 | 400 | 400 | 400 | 400 |
FCD-Fenoprofen calcium dihydrate, CCS-Croscarmellose sodium, SSG-Sodium starch glycolate, SMP-Skimmed milk powder
Optimization of formulation by design expert
BBD: This optimisation technique uses three independent variables (X1, X2, X3) at three different levels (-1, 0,+1) with a minimum to maximum range. Three centre points per block with fifteen runs can be employed to construct the design [15, 16]. Three components, or independent variables, X1, X2, and X3 are the focus of this study. The variables' names are Super disintegrants, SMP as a nutritional excipient, and camphor as a subliming agent. The variables that made up the response, or dependent variables, were R1, R2, and R3. Their respective names are wetting time, drug content, and disintegration time [17, 18].
Micromeritic properties evaluation
The prepared powder blends were evaluated for the micromeritic properties such as derived properties as bulk and tapped densities, flow properties include angle of repose, compressibility index and Hausner’s ratio [19].
Post-compression parameters evaluation
The MDT prepared by sublimation method was evaluated for the post-compressional parameters such as hardness, friability, uniformity of thickness, weight variation, in vitro dispersion time, wetting time, water absorption ratio and drug content [20].
In vitro disintegration time
The disintegration time is performed using disintegration test apparatus [21].
In vitro drug release study
In vitro dissolution studies of the MDTs of Fenoprofen calcium dihydrate formulations and controlled tablets prepared without super disintegrants were performed according to USP XXIII Type-II dissolution apparatus (Electrolab, model TDT-06N) employing a paddle stirrer at 50 rpm using 900 ml of pH 6.8 phosphate buffer at 37±0.5 °C as dissolution medium [22, 23].
Stability studies
Stability of a drug has been defined as the ability of a particular formulation in a specific container to remain within its physical, chemical, therapeutic and toxicological specifications [24, 25]. International Conference on Harmonization (ICH) specifies the duration of study and storage conditions: In the present study, accelerated stability studies were carried out at accelerated condition of 40±2 °C, 75±5 % RH for a specific time period up to 6 mo for the selected formulations S3, S8 and S13. The tablets were analysed for physical appearance, wetting time, drug content and disintegration time at the regular interval. The obtained values were treated to one way Anova followed by Dunnet’s test. Differences were considered statistically significant at p<0.05.
RESULTS AND DISCUSSION
BBD used for optimization with three independent variables (X1, X2, X3) at three levels (-1, 0,+1) with minimum to maximum range and the design can be developed by using 3 center points per block with 15 runs [26, 27]. The present research consists of three factors or independent variables X1, X2 and X3 and the name of the variables as Super disintegrants, camphor as a subliming agent SMP as a nutritive excipient respectively. The response or dependent variables was R1, R2 and R3 and the name of these variables are given as wetting time, drug content and disintegration time, respectively. The experimental trials was run by 15 times with all maximum possible combination of both independent and dependent variables using minimum of 3 center points per block. The selected level of variables was shown in table 2 and the responses obtained from 15 runs were presented in the table 3.
Table 2: Selected level of independent and dependent variables used for BBD for the formulation of FCD MDTs
| Factors/Independent variables | Name of the variables | Minimum | Maximum |
| X1 | Superdisintegrants | 7.5 | 30 |
| X2 | Camphor | 10 | 20 |
| X3 | SMP | 121 | 133.5 |
| Responses/Dependent variables: Constraints, R1 Wetting time (Sec): Minimum, R2 Drug content (%): Maximum, R3 Disintegration time (%): Minimum |
Table 3: Observed responses in BBD for optimization of MDT using various superdisintegrants
| Run | Factor 1 super disintegrants | Factor 2 camphor | Factor 3 SMP | Response 1 wetting time |
Response 2 drug content |
Response 3 disintegration time |
| 1 | 7.5 | 10 | 127.25 | 42 | 97.25 | 47 |
| 2 | 30 | 10 | 127.25 | 43 | 98.54 | 42 |
| 3 | 30 | 20 | 127.25 | 47 | 94.25 | 44 |
| 4 | 18.75 | 20 | 133.5 | 48 | 97.25 | 47 |
| 5 | 18.75 | 10 | 133.5 | 47 | 95.48 | 42 |
| 6 | 30 | 15 | 133.5 | 44 | 99.85 | 39 |
| 7 | 18.75 | 15 | 127.25 | 45 | 94.24 | 45 |
| 8 | 18.75 | 15 | 127.25 | 46 | 96.37 | 38 |
| 9 | 18.75 | 20 | 121 | 49 | 97.46 | 42 |
| 10 | 18.75 | 15 | 127.25 | 42 | 95.84 | 38 |
| 11 | 7.5 | 15 | 133.5 | 47 | 98.45 | 47 |
| 12 | 30 | 15 | 121 | 45 | 98.75 | 40 |
| 13 | 7.5 | 20 | 127.25 | 46 | 95.49 | 46 |
| 14 | 7.5 | 15 | 121 | 44 | 97.56 | 42 |
| 15 | 18.75 | 10 | 121 | 47 | 99.75 | 43 |
Response 1 (Y1): Effect of independent variables on wetting time
The Model F-value of 1.82 implies the model is not significant relative to the noise. There is a 26.44% chance that an F-value this large could occur due to noise. P-values less than 0.0500 indicate model terms are significant. In this case, there are no significant model terms. Value greater than 0.1000 indicate the model terms are not significant. If there are many insignificant model terms (not counting those required to support hierarchy), model reduction may improve your model. The Lack of Fit F-value of 0.48 implies the Lack of Fit is not significant relative to the pure error. There is a 72.88% chance that a Lack of Fit F-value this large could occur due to noise. Non-significant lack of fit is good and the model to fit. The 3D surface plot showing the effect of independent variables on wetting time is shown in the fig. 2 (A). Moreover over the comparison of responses of independent variables of linear correlation plots between predicted vs actual and residual vs run was represented in the fig. 3 (a, b).
Wetting time (Sec) =+44.33+0.0000 X1+1.37 X2+0.1250 X3+0.0000 X1X2-1.0000 X1X3-0.2500 X2X3-1.29 X12+1.146 X22+1.96X32
The equation in terms of coded factors can be used to make predictions about the response for given levels of each factor. By default, the high levels of the factors are coded as+1 and the low levels are coded as-1. The coded equation is useful for identifying the relative impact of the factors by comparing the factor coefficients.
Response 2 (Y2): Effect of independent variables on drug content
The Model F-value of 1.48 implies the model is not significant relative to the noise. There is a 34.62% chance that an F-value this large could occur due to noise. P-values less than 0.0500 indicate model terms are significant. In this case C² is a significant model term. Value greater than 0.1000 indicate the model terms are not significant. If there are many insignificant model terms (not counting those required to support hierarchy), model reduction may improve your model. The Lack of Fit F-value of 2.67 implies the Lack of Fit is not significant relative to the pure error. There is a 28.39% chance that a Lack of Fit F-value this large could occur due to noise. Non-significant lack of fit is good and the model to fit. The 3D surface plot showingthe effect of independent variables on drug content is shown in the fig. 2 (B). More over the comparison of responses of independent variables of linear correlation plots between predicted vs actual and residual vs run was represented in the fig. 3(c, d).
Drug content (%)=+95.48+0.3300 X1-0.8213 X2-0.3112 X3-0.6325 X1X2+0.0525 X1X3+1.02 X2X3+1.03 X12-0.1342 X22+2.14X32
The equation in terms of coded factors can be used to make predictions about the response for given levels of each factor. By default, the high levels of the factors are coded as+1 and the low levels are coded as-1. The coded equation is useful for identifying the relative impact of the factors by comparing the factor coefficients.
Response 3 (Y3): Effect of independent variables on disintegration time
The Model F-value of 1.68 implies the model is not significant relative to the noise. There is a 29.51% chance that an F-value this large could occur due to noise. P-values less than 0.0500 indicate model terms are significant. In this case, there are no significant model terms. Value greater than 0.1000 indicate the model terms are not significant. If there are many insignificant model terms (not counting those required to support hierarchy), model reduction may improve your model. The Lack of Fit F-value of 0.05 implies the Lack of Fit is not significant relative to the pure error. There is a 98.36% chance that a Lack of Fit F-value this large could occur due to noise. Non-significant lack of fit is good and the model to fit. The 3D surface plot showing the effect of independent variables on disintegration time is shown in the fig. 2(C). More over the comparison of responses of independent variables of linear correlation plots between predicted vs actual and residual vs run was represented in the fig. 3 (e,f).
Disintegration time (Sec) =+40.33-2.13 X1+0.6250 X2+1.0000 X3+0.7500 X1X2-1.50 X1X3+1.50 X2X3+1.46 X12+2.96 X22+0.2083X32
The equation in terms of coded factors can be used to make predictions about the response for given levels of each factor. By default, the high levels of the factors are coded as+1 and the low levels are coded as-1. The coded equation is useful for identifying the relative impact of the factors by comparing the factor coefficients.
Regression analysis
A Predicted R² implies that the overall mean may be a better predictor of your response than the current model. In some cases, a higher-order model may also predict better. Adequate Precision measures the signal-to-noise ratio. A ratio greater than 4 is desirable. Your ratio of 4.343 indicates an adequate signal. This model can be used to navigate the design space.
A Predicted R² implies that the overall mean may be a better predictor of your response than the current model. In some cases, a higher-order model may also predict better. Adequate Precision measures the signal-to-noise ratio. A ratio of 3.41 indicates an inadequate signal and you should not use this model to navigate the design space.
The Predicted R² of 0.8201 is in reasonable agreement with the Adjusted R² of 0.9037; i. e. the difference is less than 0.2. Adequate Precision measures the signal-to-noise ratio. A ratio of 3.53 indicates an inadequate signal and you should not use this model to navigate the design space. The summary results of regression analysis, SD, and % CV with responses Y1, Y2, and Y3 for the quadratic model equation was given in the table 4.
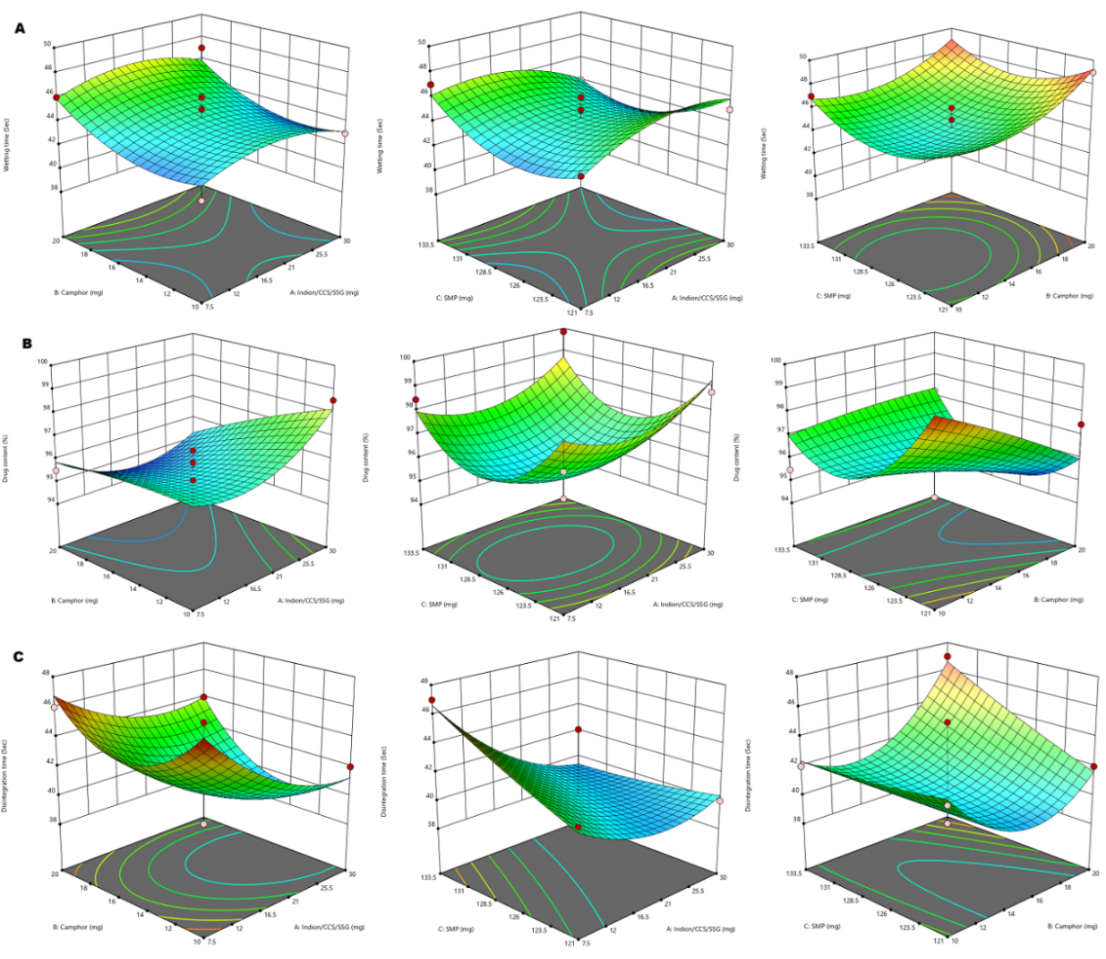
Fig. 2: 3D-response surface plot showing the effect of independent variables on wetting time (A), drug content (B) and disintegration time (C)
Table 4: Summary results of regression analysis, SD, and %CV with responses Y1, Y2, and Y3 for the quadratic model equation
| Quadratic model | SD | CV % | R2 | Adjusted R | Predicted R |
| Wetting time (Sec) | 1.73 | 1.80 | 0.8660 | 0.9447 | 0.8750 |
| Drug Content (%) | 1.57 | 1.62 | 0.8276 | 0.9372 | 0.8110 |
| Disintegration time (Sec) | 1.64 | 1.17 | 0.8513 | 0.9037 | 0.8201 |
SD-Standard Devaition, CV-Co-efficient of Variation, R-Regression co-efficient
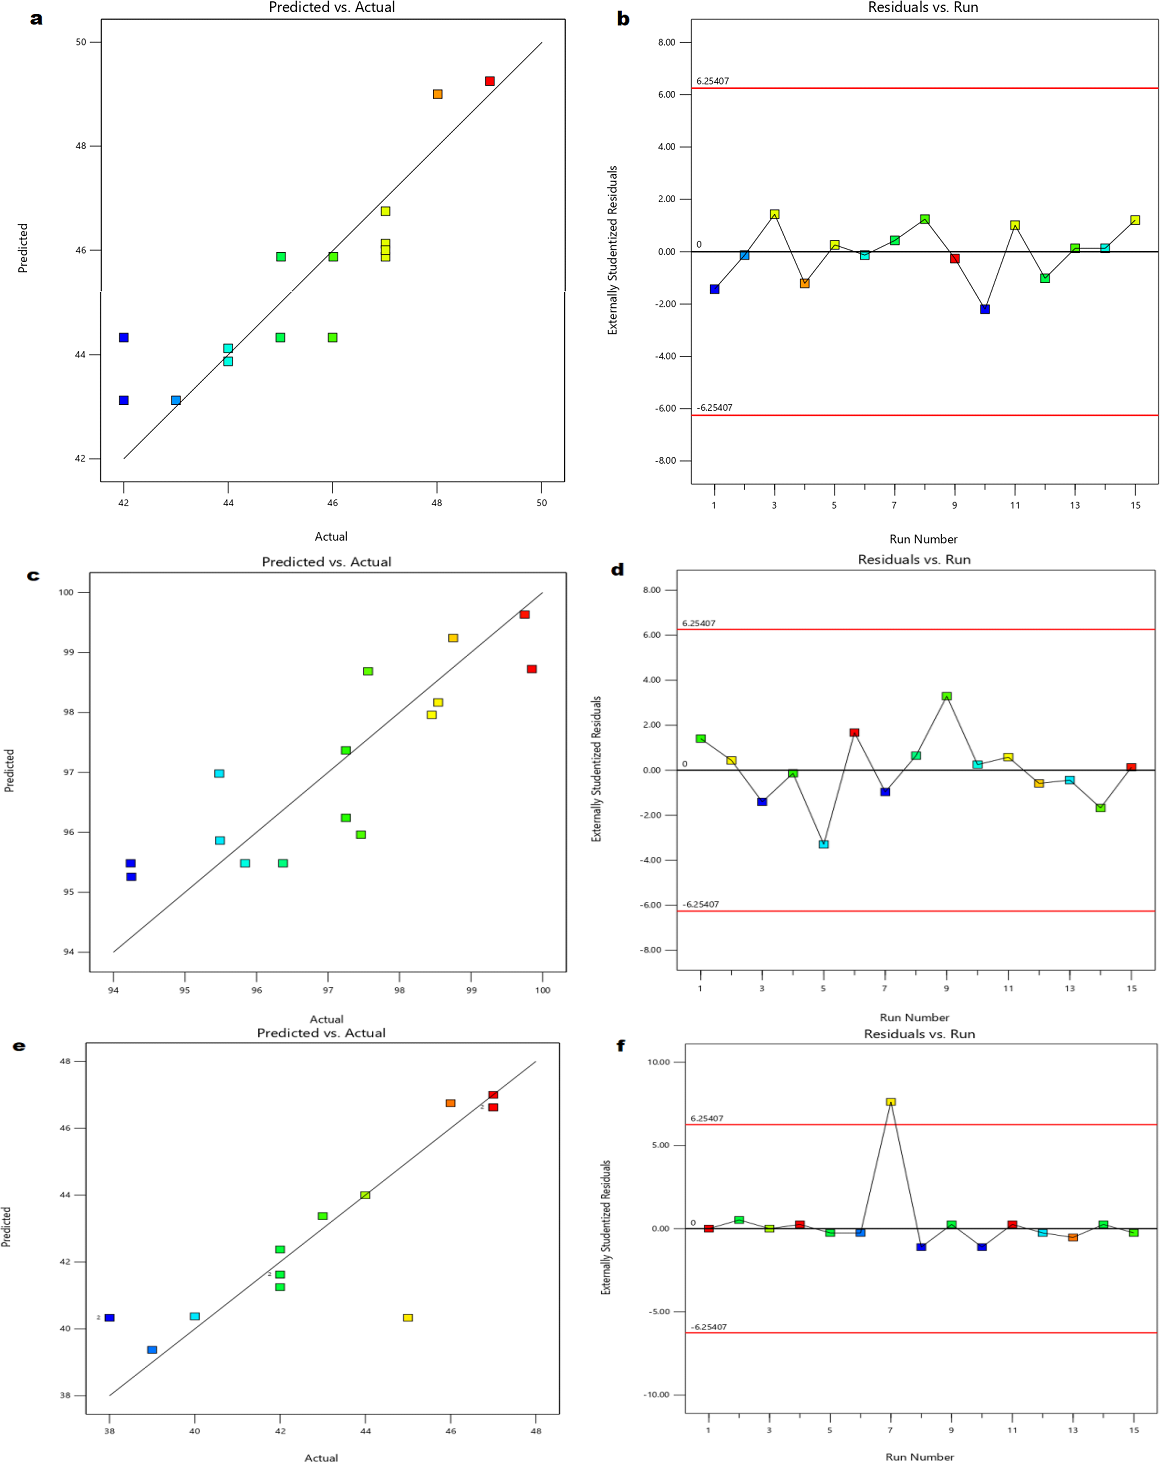
Fig. 3: Linear correlation plots (a, c, e) between actual and predicted values and the corresponding residual plots (b, d, f) for wetting time, drug content and disintegration time, respectively
Micromeritic properties
The prepared powder blends of all fifteen formulations were evaluated for their pre-compressional micromeritic properties, such as derived and flow properties. Bulk density is a crucial factor in the development of processes and the production of solid dosages. It is used to calculate how much powder will fit in a container, like a blender or hopper on a tablet press. All of the prepared formulations had bulk densities between 0.52 and 0.57 gm/cc. Due to its ease of use and speed of measurement, the tapped density is a widely used metric for characterizing powders. A measure of a powder sample's cohesiveness, which is related to its flow ability, is how well it packs under taps and the values of tapped density were found to be 0.63 to 0.69 gm/cc. The angle of repose is a measure of the flow ability of bulk solids, and this quick process allows one to assess the flow properties of powder materials. The flow ability of all compositions, including powder mixes ranges from good to excellent, with values between 25.11 and 32.87. By using the values of bulk and tapped densities the Carr’s index and Hausner’s ratio was found out. The results obtained from the above properties are presented in table 5.
Post compressional parameters
The formulated tablets were characterised for post-compressional parameters such as hardness, friability, weight variation, thickness, in vitro dispersion time, wetting time, water absorption ratio, and drug content. It was discovered that the tablets' hardness varied between 2.3±0.19 and 2.9±0.13 kg/cm2. It was discovered that all tablets were sufficiently sturdy to endure handling and storage conditions without breaking. Since none of the tested batches had percentage friability more than 1%, all of the tablets shown acceptable friability by the accredited pharmacopoeia, all batches percentage of friability was found to be between 0.38 to 0.86%, showing that the tablets' mechanical resistance was good. Tablets ability to tolerate pressure and mechanical shocks during handling, shipping, storage, and manufacturing processes was thus demonstrated. In the pharmaceutical industry, the term "weight variation" is often used when describing tablet compression operations. Weight variation, as the name suggests, is a fault where weight deviates from the official pharmacopoeias specified ranges. The test may also be high if the weight of the tablets is more than the advised range. Decreased tablet weights than those within the advised range can additionally result in decreased content consistency. Thus, it is important to pay close attention to the tablets weight before compressing them. According to the British Pharmacopoeia, the outcome of weight variation is passes. Since thickness affects disintegration and dissolving behaviour, a tablet's thickness is essential to its therapeutic efficacy. Furthermore, thickness can serve as a helpful predictor of the tablet weight consistency, which is regulated to guarantee dose constancy. Even though a contemporary tablet press ought to offer a high degree of consistency, there are a few possible reasons of variance. The most significant one is powder flow, which can alter how uniformly the die is filled prior to compaction. Variability can also be brought about by defects in the pressing or tooling, mechanical wear, and material accumulation on the die wall or punch face during a run. The physical consistency and weight of produced tablets can be influenced by any of these factors. Regularly measuring the thickness of tablets enables the early detection and effective diagnosis of possible issues related to tablet weight and, consequently, content homogeneity. It was discovered that the tablet's thickness ranged from 5.57±0.19 to 5.98±016 mm. The wetting time and in vitro dispersion time are very important for the tablet disintegration, and fig. 4 depicts the wetting and water dispersion results graphically. The wetting time depends on the inner surface of MDT. The tablet is placed in the oral cavity and comes into intimate contact with saliva. The wetting of the tablet begins, and then water dispersion takes place. Tablet disintegration is influenced by the duration of wetness and water dispersion. The results showed that the water absorption ratio ranged from 65±1.58 to 83±1.8% and wetting time was between 32±1.38 and 39±1.72 sec. The results indicated that the maximum drug content and optimal values for all prepared formulations fell between 94.5±0.74 and 99.69±0.59. Table 6 displayed the outcomes of the aforementioned post-compressional parameters.
Disintegration time
A disintegration test device is used to determine the disintegration time. Each tube in the basket held one tablet. This basket was submerged in a 37+0.5ºC water bath. The process was repeated with a different set of designed tablets, and the amount of time needed for complete disintegration was measured. Disintegration time FDT has at least a disintegration time of less than 1 min. During extended mixing, magnesium stearate can develop films on other tablet excipients, which can lengthen the time it takes for the medicine to release, reduction in hardness, and increase in disintegration time. It was discovered that the disintegration time varied between 39±2.38 and 47±1.46 sec. Even though the disintegration test provides minimal basic information regarding the drug release behaviour of the dosage form, the results are still utilized to determine if the dosage form satisfies the requirements of the relevant pharmacopoeia. Fig. 5 shows the values of the disintegration time.
Table 5: Pre-compression parameters of powder blend
| Formulation code | Bulk density (gm/cc)±SD, n=3* |
tapped density (gm/cc)±SD, n=3* |
Angle of repose (θ) ±SD, n=3* | Carr’s index (%) ±SD, n=3* | Hausner’s ratio ±SD, n=3* |
| S1 | 0.53±0.008 | 0.68±0.01 | 29.25±1.98 | 22.05±1.53 | 1.28±0.02 |
| S2 | 0.52±0.008 | 0.63±0.01 | 31.02±1.76 | 17.46±1.43 | 1.21±0.06 |
| S3 | 0.54±0.007 | 0.68±0.01 | 25.11±1.67 | 20.58±1.27 | 1.25±0.03 |
| S4 | 0.57±0.009 | 0.68±0.01 | 27.20±1.43 | 16.17±2.56 | 1.19±0.04 |
| S5 | 0.53±0.005 | 0.69±0.01 | 29.43±1.74 | 23.18±1.67 | 1.30±0.03 |
| S6 | 0.52±0.008 | 0.63±0.01 | 32.72±1.98 | 17.46±1.88 | 1.21±0.04 |
| S7 | 0.54±0.009 | 0.65±0.01 | 32.87±1.27 | 16.92±1.57 | 1.20±0.04 |
| S8 | 0.52±0.006 | 0.64±0.01 | 31.04±1.76 | 18.75±2.87 | 1.23±0.02 |
| S9 | 0.54±0.005 | 0.65±0.01 | 29.08±1.39 | 16.92±2.03 | 1.20±0.02 |
| S10 | 0.53±0.005 | 0.69±0.01 | 29.52±1.73 | 23.18±2.56 | 1.30±0.05 |
| S11 | 0.53±0.006 | 0.68±0.01 | 31.16±1.23 | 22.05±1.35 | 1.28±0.03 |
| S12 | 0.54±0.003 | 0.67±0.01 | 26.26±1.93 | 19.40±1.67 | 1.24±0.06 |
| S13 | 0.54±0.004 | 0.65±0.01 | 27.03±1.29 | 16.42±1.35 | 1.20±0.06 |
| S14 | 0.54±0.005 | 0.66±0.01 | 28.72±1.53 | 18.18±1.46 | 1.22±0.05 |
| S15 | 0.54±0.008 | 0.67±0.01 | 25.58±1.20 | 19.40±2.45 | 1.24±0.03 |
*n=3 Triplicate measurements
In vitro dissolution
Studies on the dissolving of drugs in vitro revealed that within 20 min, over 50% of the medication was liberated from the formulation. The facile particle breakdown caused by superdisintegrant activity may be the cause of the drug's quick dissolution. Significant variations were noted in the dissolving profiles of various batches. Every batch was contrasted with a control batch that didn't contain any superdisintegrants. After 90 min, 99.57, 99.64, and 99.98 percentage of FCD from the formulations S3, S8, and S13 were observed. After one and a half hours, the control batch was only able to release roughly 57.89% of the medication. It was discovered from the in vitro dissolution data that the drug release increased in tandem with the superdisintegrant concentration. The in vitro drug release statistics for each formulation are displayed in fig. 6.
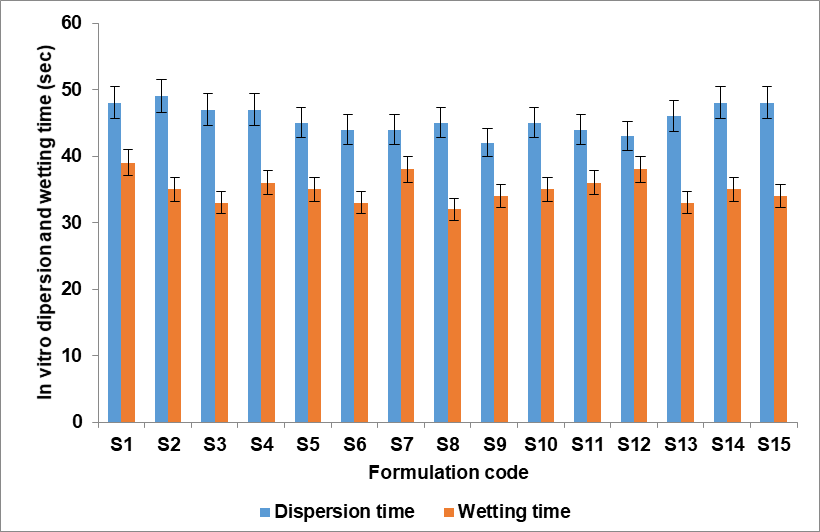
Fig. 4: In vitro dispersion and wetting time of S1-S15 (n=3 with ±SD)
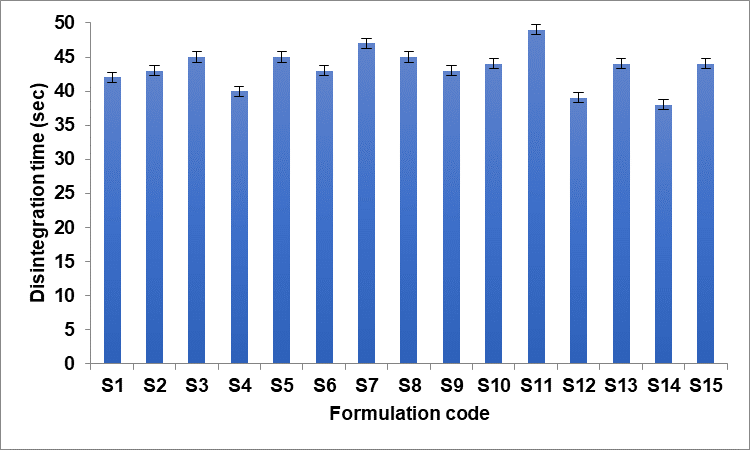
Fig. 5: In vitro disintegration time of S1-S15 (n=3 with±SD)
Table 6: Post-compressional evaluation parameters of FCD MDTs
| Formulation code | Hardness (kg/cm2)± SD, n=3* | Friability (%) | Thickness (mm)±SD, n=3* | Weight variation (mg)±SD, n=3* | In vitro dispersion time (sec) ±SD, n=3* | Wetting time (sec) ±SD, n=3* |
Water absorption ratio±SD, n=3* | Drug content (%) ±SD, n=3* |
| S1 | 2.5±0.13 | 0.55 | 5.68±0.12 | 398±1.75 | 48±2.68 | 39±1.72 | 74±1.88 | 96.87±0.67 |
| S2 | 2.6±0.14 | 0.56 | 5.59±0.15 | 401±1.78 | 49±1.02 | 35±1.46 | 74±1.98 | 95.98±1.55 |
| S3 | 2.5±0.16 | 0.58 | 5.76±0.15 | 398±0.78 | 47±1.09 | 33±1.73 | 73±1.44 | 99.65±0.76 |
| S4 | 2.6±0.16 | 0.55 | 5.68±0.14 | 402±1.86 | 47±2.45 | 36±1.64 | 83±1.66 | 96.72±0.77 |
| S5 | 2.7±0.15 | 0.67 | 5.98±0.16 | 402±0.77 | 45±1.56 | 35±1.56 | 83±1.76 | 94.70±0.98 |
| S6 | 2.8±0.14 | 0.69 | 5.98±0.12 | 403±1.87 | 44±2.45 | 33±1.63 | 83±1.80 | 98.63±0.96 |
| S7 | 2.6±0.13 | 0.59 | 5.87±0.13 | 399±1.78 | 44±1.56 | 38±1.82 | 74±1.32 | 96.35±1.49 |
| S8 | 2.7±0.18 | 0.86 | 5.57±0.19 | 398±1.98 | 45±1.27 | 32±1.38 | 75±1.05 | 99.68±0.55 |
| S9 | 2.3±0.19 | 0.58 | 5.87±0.20 | 399±0.49 | 42±1.24 | 34±1.52 | 73±1.60 | 94.50±0.74 |
| S10 | 2.4±0.13 | 0.73 | 5.87±0.23 | 405±0.58 | 45±2.47 | 35±1.76 | 65 ±1.58 | 97.46±0.76 |
| S11 | 2.9±0.13 | 0.46 | 5.60±0.21 | 404±1.59 | 44±1.65 | 36±1.67 | 82±1.69 | 98.96±0.43 |
| S12 | 2.2±0.18 | 0.38 | 5.78±0.26 | 397±0.89 | 43±2.26 | 38±1.34 | 83±1.30 | 96.29±0.87 |
| S13 | 2.4±0.15 | 0.77 | 5.58±0.24 | 399±1.59 | 46±1.77 | 33±1.65 | 79±1.43 | 99.69±0.59 |
| S14 | 2.4±0.18 | 0.79 | 5.69±0.27 | 405±1.85 | 48±1.68 | 35±1.59 | 75±1.03 | 97.65±2.59 |
| S15 | 2.3±0.14 | 0.87 | 5.76±0.28 | 401±1.48 | 48±1.39 | 34±1.65 | 78±1.09 | 99.64±0.37 |
*n=3 Triplicate measurements
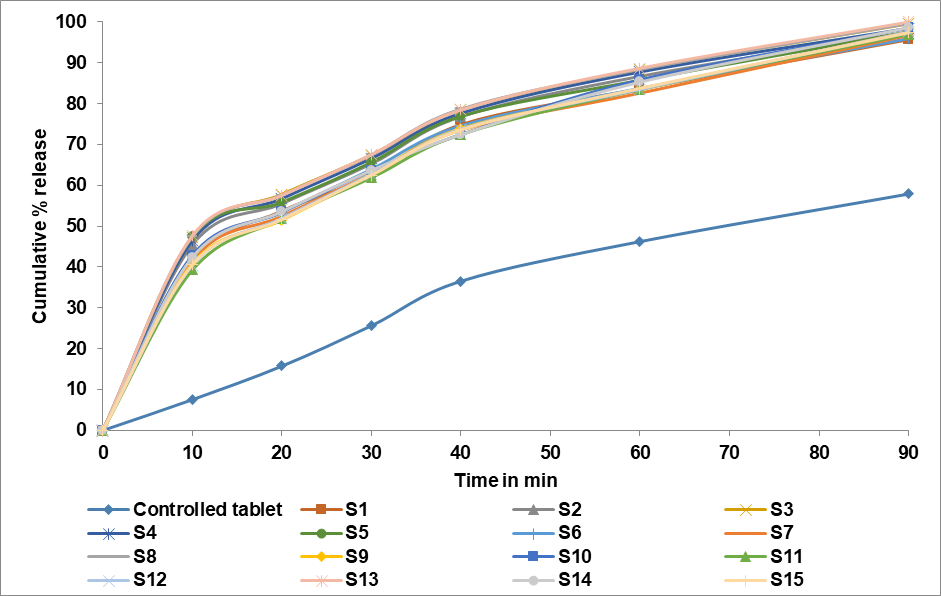
Fig. 6: In vitro drug release profile of S1-S15
Stability analysis
The stability of a drug has been defined as the ability of a particular formulation in a specific container to remain within its physical, chemical, therapeutic and toxicological specifications [28]. ICH specifies the duration of study and storage conditions: In the present study, accelerated stability studies were carried out at an accelerated condition of 40±2 °C, 75±5 % RH for a specific time period of up to 6 mo for the selected formulations S3, S8 and S13. The tablets were analysed for physical appearance, wetting time, drug content and disintegration time at a regular interval. The obtained values were treated to a one-way ANOVA followed by Dunnett’s test. Differences were considered statistically significant at p<0.05.
CONCLUSION
FCD MDTs have been produced successfully using the sublimation process with a variety of superdisintegrants, including Indian-414, CCS, and SSG. Powdered skim milk is used as an excipient, flavour enhancer, and solubility enhancer. Camphor is one subliming agent. The formulas were optimized using Box-Bhenken Design with three independent variables (X1, X2, X3) at three levels (-1, 0,+1) with a minimum to maximum range. The physicochemical and micromeritic properties of all fifteen formulations showed only slight differences in findings. The optimal formulations were identified by analysing the results acquired and interpreting them. The stability studies are followed by routine evaluations of the selected formulations S3, S8, and S13 for physical characteristics, wetting time, drug content, and disintegration time. The acquired data were subjected to Dunnet's test and a one-way ANOVA before being considered statistically significant at p0.05.
ACKNOWLEDGEMENT
The authors are highly thankful to the management, vice chancellor, pro-vice chancellor, and other administrative authorities of ITM University Gwalior and Jiwaji University to provide all the facilities to carry out this research work.
FUNDING
No funding support
AUTHORS CONTRIBUTIONS
Conceptualization and research design, S. S-N and S-J; writing original draft, S. S-N and M. A; review and editing, S-J and M. A.
CONFLICT OF INTERESTS
Declared none
REFERENCES
Chein YW. Novel drug delivery systems. Marcel Jekker Inc, New York; 1992. p. 13.
Pandey P, Dahiya M. Oral disintegrating tablets: a review. Int J Pharm Res Rev. 2016 Jan;5(1):50-62.
Khanna K, Xavier G, Joshi SK, Patel A, Khanna S, Goel B. Fast dissolving tablets a novel approach. Int J Pharm Res Allied Sci. 2016 Jan 1;5(2):311-22.
Allam A, Fetih G. Sublingual fast dissolving niosomal films for enhanced bioavailability and prolonged effect of metoprolol tartrate. Drug Des Devel Ther. 2016 Aug 2;10:2421-33. doi: 10.2147/DDDT.S113775, PMID 27536063.
Dungarwal UN, Patil SB. Development of orodispersible tablets of taste-masked rizatriptan benzoate using hydroxypropyl β-cyclodextrin. J Pharm Investig. 2016 Oct;46(6):537-45. doi: 10.1007/s40005-016-0240-5.
Ganesh NS, Deshpande KB. Orodispersible tablets: an overview of formulation and technology. Int J Pharm Bio Sci. 2011;2(1):726-34.
Irfan M, Rabel S, Bukhtar Q, Qadir MI, Jabeen F, Khan A. Orally disintegrating films: a modern expansion in drug delivery system. Saudi Pharm J. 2016 Sep 1;24(5):537-46. doi: 10.1016/j.jsps.2015.02.024, PMID 27752225.
Hannan PA, Khan JA, Khan A, Safiullah S. Oral dispersible system: a new approach in drug delivery system. Indian J Pharm Sci. 2016 Jan-Feb;78(1):2-7. doi: 10.4103/0250-474x.180244, PMID 27168675.
Parkash V, Maan S, Yadav SK, Jogpal V. Fast disintegrating tablets: opportunity in drug delivery system. J Adv Pharm Technol Res. 2011 Oct;2(4):223-35. doi: 10.4103/2231-4040.90877, PMID 22247889.
Schiermeier S, Schmidt PC. Fast dispersible ibuprofen tablets. Eur J Pharm Sci. 2002 Feb 1;15(3):295-305. doi: 10.1016/s0928-0987(02)00011-8, PMID 11923062.
Koizumi KI, Watanabe Y, Morita K, Utoguchi N, Matsumoto M. New method of preparing high porosity rapidly saliva soluble compressed tablets using mannitol with camphor a subliming material. International Journal of Pharmaceutics. 1997 Jun 13;152(1):127-31. doi: 10.1016/S0378-5173(97)04924-7.
Ammar HO, Makram TS, Mosallam S. Effect of polymers on the physicochemical properties and biological performance of fenoprofen calcium dehydrate triacetyl β-cyclodextrin complex. Pharmaceutics. 2017 Jul 3;9(3):23. doi: 10.3390/pharmaceutics9030023, PMID 28671624.
Kumar R, Patil S, Patil MB, Patil SR, Paschapur MS. Formulation evaluation of mouth dissolving tablets of fenofibrate using sublimation technique. Int J Chem Tech Res. 2009;1(4):840-50.
Patel DM, Patel MM. Optimization of fast-dissolving etoricoxib tablets prepared by sublimation technique. Indian J Pharm Sci. 2008 Jan-Feb;70(1):71-6. doi: 10.4103/0250-474X.40335, PMID 20390084.
Londhe V, Shirsat R. Formulation and characterization of fast dissolving sublingual film of iloperidone using box-Behnken design for enhancement of oral bioavailability. AAPS Pharm Sci Tech. 2018 Apr;19(3):1392-400. doi: 10.1208/s12249-018-0954-y, PMID 29396734.
Alagusundaram M, Chandra Sekhar KB, Vani GN. Nanosized liposomes for nose-to-brain delivery of carmustine formulation optimization by box-behnken design. J Medical Pharmaceutical and Allied Sci. 2022;11(2):4518-26. doi: 10.55522/jmpas.V11I2.2159.
Vani GN, Alagusundaram M, Chandrasekar KB. Formulation and optimization and in vitro characterization of olanzapine liposome. Int J App Pharm. 2021;13(5):109-14. doi: 10.22159/ijap.2021v13i5.42085.
Nair HA, Gadhiraju G, Sunny G. Development of orodispersible tablets of loratadine containing an amorphous solid dispersion of the drug in soluplus® using design of experiments. Int J Pharm Pharm Sci. 2023 Aug;15(8):19-27. doi: 10.22159/ijpps.2023v15i8.47750.
Purushothaman M, Battu S, Devi KJ, Chetty CM, Alagusundaram M, Rao KM. Formulation and characterization of ofloxacin microspheres prepared by ionotropic gelation technique. Res J Pharm Technol. 2010;3(4):1265-9.
Patil T, Pawar A, Korake S, Patil R, Pawar A, Kamble R. Green synthesis of polyacrylamide grafted neem gum for gastro retentive floating drug delivery of ciprofloxacin hydrochloride: in vitro and in vivo evaluation. J Drug Deliv Sci Technol. 2022 Jun 1;72:103417. doi: 10.1016/j.jddst.2022.103417.
Preeti AV, Agarwal V, Agarwal A. An overview on mouth dissolving tablet: from manufacturing and patented technique to quality control test. Asian J Pharm Clin Res. 2022 Nov;15(11):7-13. doi: 10.22159/ajpcr.2022.v15i11.46555.
Incecayir T, Demir ME. In vivo relevance of a biphasic in vitro dissolution test for the immediate release tablet formulations of lamotrigine. Pharmaceutics. 2023 Oct 17;15(10):2474. doi: 10.3390/pharmaceutics15102474, PMID 37896234.
Singh S, Khare E, Srivastava S, Rajput HS, Singh LK. Design formulation and optimization of novel mouth-dissolving tablet of drug ketorolac using special super disintegrate. Asian J Pharm. 2022 Jul;16(3):371. doi: 10.22377/ajp.v16i3.4491.
Bhagwat GA, Kamble P, Porwal A, Barge V. To evaluate accelerated stability study of a polyherbal formulation turmocin plus tablet. IJPR. 2021 Jul;13(3):946-53. doi: 10.31838/ijpr/2021.13.03.146.
Shruthi BK, Chandrakala V, Srinivasan S. Formulation and evaluation of mouth dissolving film of an H1 antihistamine drug. Int J Curr Pharm. 2022 Nov;14(6):55-66. doi: 10.22159/ijcpr.2022v14i6.2062.
Rajput SS, Marothia D. Preparation and optimization of bilayer orodispersible tablets of fenoprofen calcium by using quality by design approach. J Pharm Neg Results. 2022 Nov;13(9):10954-66. doi: 10.47750/pnr.2022.13.
Pragallapati P, Lakshmi Ponnuri RN, Murthy Kollapalli VR. Quality by design approach for development and optimization of chitosan-based floating microspheres for topotecan hcl. Int J App Pharm. 2023;15(6):153-62. doi: 10.22159/ijap.2023v15i6.48850.
Singh Narwariya SS, Jain S. Physicochemical in vivo anti-inflammatory effect of tablet containing fenoprofen. Res J Pharm Technol. 2022;15(10):4413-5. doi: 10.52711/0974-360X.2022.00739.