
Int J App Pharm, Vol 17, Issue 4, 2025, 166-177Original Article
SCREENING, DESIGN AND CHARACTERIZATION OF ALGAE-BASED TOPICAL DOSAGE FORM AS A REMEDY FOR DIGITAL AGEING
FATIMA SANJERI DASANKOPPA1, REVATI DHARAMPAL SAGARE2*, MEGHA N. SUREBAN3, HASANPASHA N. SHOLAPUR4, ARUNKUMAR GUNDAIAH RAMESH5, VIJAYAKUMAR MURUGESAN6
1,2*,3Department of Pharmaceutics, KLE College of Pharmacy, Hubballi, Karnataka, India. 4Department of Pharmacognosy, KLE College of Pharmac, Hubballi, Karnataka, India. 5Formulation Development, Novitium Pharma LLC, New Jersey, USA, East Windsor. 6Technology Transfer, Novitium Pharma LLC, New Jersey, USA, East Windsor
*Corresponding author: Revati Dharampal Sagare; *Email: revatisagare47@gmail.com
Received: 16 Jun 2024, Revised and Accepted: 21 May 2025
ABSTRACT
Objective: To design and characterize algae-based topical dosage forms as a remedy for digital aging and to assess the compatibility and safety of the developed topical formulation through in vitro studies.
Methods: A Central Composite Design (CCD) was employed to systematically investigate the impact of stabilizer concentration, sonication amplitude, and time on the particle size and zeta potential of the formulations. Fourier Transform Infrared Spectroscopy (FTIR), Sun Protection Factor (SPF), and antioxidant activity of the drug were initially assessed. Different concentrations of phospholipid and ethanol were used to create the ethosomes. Size, surface charge, shape, and Entrapment Efficiency (EE) were used to develop and characterize the drug-containing ethosomes. After that, the improved ethosomes were added to create a topical gel formulation. It was tested for stability over three months by looking at its organoleptic, pH, viscosity, and Sun Protection Factor (SPF) activity.
Results: The drug showed 78.94% efficacy in scavenging free radicals. The optimized ethosomes had a spherical form, particle size of 221.8 nm, surface charge is-28.21 mV, and a notable 99.36 % entrapment efficiency. The maximum Sun Protection Factor (SPF) activity was observed in the ethosomal gel EG2. Furthermore, the chosen topical gel held up well during the investigation.
Conclusion: The objective of the study was to develop a stable and functionally effective gel by using suitable ingredients. The evaluation study of the developed gel showed good pH, antioxidant activity, and sun protection activity.
Keywords: Digital aging, Marine algae, Phycocyanin, Ethosomes, Antioxidant activity
© 2025 The Authors. Published by Innovare Academic Sciences Pvt Ltd. This is an open access article under the CC BY license (https://creativecommons.org/licenses/by/4.0/)
DOI: https://dx.doi.org/10.22159/ijap.2025v17i4.51784 Journal homepage: https://innovareacademics.in/journals/index.php/ijap
INTRODUCTION
Nowadays, the term "Digital Ageing" is most commonly used to describe the accelerated aging of the skin due to exposure to dangerous blue light that comes from the sun or, more commonly, our electronic devices, such as desktop computers, laptop screens, and cell phones [1].
Exposure to blue light can cause DNA damage, Reactive Oxygen Species (ROS) production, and skin cell malfunction. Overexposure of ROS to skin cells can cause melasma, hyperpigmentation, aging, and damage to the skin barrier [2].
Free radicals are important contributing factors to the development of a number of skin conditions, such as skin cancers, wrinkles, and aging of the skin. Ultra-violet (UV) light primarily generates Free Radicals (FR/ROS) by interacting with endogenous photosensitizers. This process results in cumulative physiological and structural changes, as well as progressive alterations in each layer of the skin and changes in the look of the skin [3]. Reference added from Asian Journal of Pharmaceutical and Clinical Research.
Certain cosmetic products, such as gels, creams, sprays, lotions, and ointments, have been proven to be effective in either avoiding or lowering the skin's production of free ROS [1]. Natural ingredients are being used as nanoformulations and act as an efficient delivery system for the skin [4]. Algae are the naturally occurring component that provides photoprotection. It is produced by secondary metabolites of living organisms that exist spontaneously [5]. One interesting photoprotective molecule is phycocyanin. The blue color of this pigment protein combination is a characteristic of cyanobacteria. Strong anti-inflammatory and antioxidant qualities as well as defence against Ultra-Violet B (UVB) induced apoptosis have been reported for phycocyanin. Due to its low toxicity profile, it is suitable for cosmetics, but its ability to absorb light makes it an excellent sunscreen candidate [6]. Cosmetics containing nanotechnology is the newest field of study. Nanomaterials are used by cosmetic businesses to promote skin penetration, texture, and UV protection [4]. As a non-invasive drug delivery technique, ethosomes are designed. These are flexible, soft vesicles [7]. The novel application of spirulina as an ingredient in dermo-cosmetic products. They demonstrated how the microalgae enhances the structure of the epidermis and functions as a moisture booster, improving the function of the skin barrier, especially in terms of skin protection and antiaging [8]. Reference added from International Journal of Applied Pharmaceutics.
Certain bioactive materials in the environment absorb UV radiation, shielding the skin from their damaging effects. Biologically active chemicals have gained popularity in cosmetic formulations recently due to their safety, lack of unpleasant reactions, absence of hazardous chemical components, and environmental integrity. The antimutagenic, anticancerous, and non-toxic properties of phytoconstituents are making them more popular in cosmetics than synthetic photoprotective compounds, which are more potentially harmful [9].
A novel approach was developed to address the shortcomings of the conventional formulation method, including the optimization technique known as experimental design, also referred to as experimental design. In order to determine the best formula based on the evaluation data of the prepared product, optimization is necessary during the preparation and formulation process. In certain circumstances, optimization can be defined as a technique for achieving the ideal combination of process or product features [10].
As novel photoprotective agents, a variety of systemic agents, including antioxidants, vitamins, and minerals, have been dubbed "systemic sunscreens." Sunscreens' primary objective is to scavenge ROS. The main goal of sunscreen is to protect against UVB and UVA radiation at long wavelengths, activate cellular repair systems, and repair DNA [11]. Subheadings in introduction are removed; sunscreens are primarily used to shield skin from the immediate and long-term impacts of UV radiation. A minimum of 30 SPF, is considered to be the best sunscreen. Unlike traditional sunscreens, which leave a typical white, chalky film on the skin, sunscreen cosmeceuticals' nanoparticles work differently [12]. Numerous external factors can impact the skin and cause premature aging, such as UV radiation, weather, air, and environmental pollutants (like tobacco smoke). Prolonged exposure to these factors can result in oxidative stress, which is a result of an imbalance between antioxidants and oxidants and affects the health of the skin. In biological systems, ROS and nitric oxide (NO2) are by-products of regular cellular metabolism. They can function as both harmful and helpful species. Proteins, DNA, lipids and membranes, and other cell components can sustain major damage as a result of oxidative stress, which is brought on by an excess of ROS.
Skin cancer is caused by UV radiation, which is extremely hazardous to the skin. Sunburn, photoaging, and even skin cancer can all be avoided and protected against by using photoprotective products containing UV filters. UV-absorbing bioactive substances can prevent UV-induced skin aging and shield human cells from UV-induced cell death. Macroalgae have evolved defense against UVB and UVA radiation, such as the production of phenolic or carotenoids, which are screen pigments [13].
Thus, the goal of the current study was to formulate an ethosomal formulation of Phycocyanin algae that would allow for transdermal distribution. The study compares the UV radiation absorption capacities of phycocyanin and phycocyanin ethosomes and looks at the size and appearance of the resulting phycocyanin ethosomes. Furthermore, a xanthan gum gel containing phycocyanin-containing ethosomes was developed and its capacity to absorb UV light at various UVB wavelengths was evaluated. Sunscreen chemicals must stay on the skin's surface without penetrating or absorbing into the underlying tissues to be safe.
MATERIALS AND METHODS
Materials
Phycocyanin was purchased from HM Phytochem, and Soya phosphatidylcholine (L alpha phosphatidylcholine) was purchased from Sisco Research Laboratories Pvt. Ltd. Taloja, Maharashtra, India. Propylene glycol and Ethanol were used as analytical reagents. (S. D. finechem. Pvt. Ltd. Mumbai, India.) Xanthum gum was collected from Molychem.
Methods
Pre-formulation studies
Absorption maxima for phycocyanin
An accurately weighed quantity of Phycocyanin (100 mg) was dissolved in 100 ml of distilled water in a 100 ml volumetric flask. This yielded a stock solution I with a concentration of 1000 µg/ml.
From the above stock solution (SS I) 10 ml of the sample was withdrawn and the volume was made up to 100 ml with distilled water in a volumetric flask (SS II) to obtain a concentration of 100 µg/ml. This sample (SS II) was scanned in the range of 200-800 nm using a UV Spectrophotometer (Shimadzu 1900i) [14].
Standard calibration curve of pure drug phycocyanin
100 mg of pure phycocyanin was accurately weighed and dissolved in 100 ml of distilled water in a volumetric flask, which is given as the stock solution I (SSI).
From SSI, different volumes (1 ml, 2 ml, 3 ml, 4 ml, and 5 ml) were withdrawn and brought up to a volume of 10 ml with distilled water, resulting in concentrations of 100 μg/ml, 200 μg/ml, 300 μg/ml, 400 μg/ml and 500 μg/ml respectively. These solutions' absorbance was measured at 615.5 nm using a UV Spectrophotometer. The Beer’s range was found to be 100-500 µg/ml. The readings were taken in triplicate, and the average absorbance values were used to plot the calibration curve [14].
Fourier transform infrared spectroscopy
The pure drug was stored in an amber-colored bottle and placed in a stability chamber set to 40 ℃ with a tolerance of ±2 ℃ and relative humidity of 75 % with a tolerance of ±5 ℃ and relative humidity of 75 % with a tolerance of ±5 ℃ for a month. Dried samples were grounded in an agitate mortar (Shimadzu, Japan). Using a Fourier Transform Infrared Spectroscopy (FT-IR) was used to identify the active functional groups of the drug. The spectrum was scanned over a range of 4,000–400 cm−1 [15, 16].
Differential scanning calorimetry (DSC)
The DSC was performed to check for the thermal behavior of the pure drug (Phycocyanin). It was carried out by using the instrument Shimadzu DSC-60 calorimeter. The pure drug was (4-6 mg) crimped in an aluminum pan and the melting point was determined [17].
In vitro screening of sun protection factor determination of drug
Phycocyanin was screened for its absorbance spectra in the range of 290 to 400 nm, using a UV Spectrophotometer. The 50 mg/10 ml, 75 mg/10 ml, and 100 mg/10 ml stock solution of the drug were scanned from 290-320 nm to check absorbance [6].
SPF =  (1)
(1)
Where CF = 10 (Correction factor),
EE (λ) = Erythemogenic effect of radiation at wavelength λ,
I (λ) = Intensity of solar light at wavelength λ and
abs (λ) = Absorbance of wavelength λ by a solution of the preparation.
The values for the term “EE x I” are constants.
In vitro antioxidant activity
DPPH method: 2, 2-diphenyl picrylhydrazyl (DPPH) free radical scavenging assay was used to measure the antioxidant activity of a drug.
Preparation of DPPH solution: DPPH (4 mg) was dissolved in 100 ml phosphate buffer in a conical flask. The conical flask containing the DPPH solution was covered with aluminum foil and kept for 30 min at room temperature. Dissolved 10 mg of ascorbic acid and phycocyanin (API) in 100 ml phosphate buffer to obtain 100 µg/ml concentration. This standard solution was diluted serially to make various concentrations of 20 µg/ml, 40 µg/ml, 60 µg/ml, 80 µg/ml and 100 µg/ml. Pipetted out 1 ml from each concentration in a 10 ml volumetric flask. To this solution, 3 ml of DPPH solution was added and the volume was made up to 10 ml using phosphate buffer and the absorbance was measured using UV Spectrophotometer at 517 nm [18]. The expression of in vitro antioxidant activity is shown in Equation No. 2.
 X 100 .. (2)
Optimization of phycocyanin-loaded ethosomal formulation using a central composite design
The two levels, two factorial central composite designs, were selected using design expert software, and the experimental design was developed by considering dependent and independent variables. The selected independent variables include X1=Concentration phosphatidylcholine (%) and X2=Concentration of ethanol (%) with one center point as shown in table 1.
A total of 9 formulations were obtained from the experimental design. Particle size (Y1) and zeta potential values (Y2) were chosen as dependent variables [19].
Formulation of drug-loaded ethosomal dispersion
The preparation of phycocyanin-containing ethosomes was achieved through the cold method. Soyaphosphotidylcholine (1-4 % w/v) was dissolved in ethanol (20-50 % v/v) and heated in a closed vessel over a water bath to 30±1 °C. Then, propylene glycol (20 %) was added to the above solution. After heating the distilled water (1 % w/v solution) to 30±1 °C, the drug was dissolved in distilled water and gradually added in a fine stream to the ethanolic lipid solution. The mixture was continuously mixed using a magnetic stirrer operating at 900 rpm. The resulting vesicular dispersions were then allowed to cool for 45 min at room temperature (25±1 °C) after another five minutes of mixing [20]. As shown in table 2, nine batches (F1–F9) of ethosomes were prepared by varying the concentrations of phospholipid and ethanol.
Table 1: List of the independent and dependent variables that were used in central composite design to formulate phycocyanin ethosomes
| Factor | Levels used | |
| Independent variables | Low (-1) | High (+1) |
| X1=Phosphatidylcholine | 1 | 4 |
| X2=Ethanol | 20 | 50 |
| Dependent variables | ||
| Y1 = Particle size | In range | |
| Y2 = Zeta potential | In range |
Table 2: Composition of ethosomes formulation
| Formulation code | Drug (%) | SPC (%) | Ethanol (%) | Propylene glycol (%) | Water (%) |
| PE1 | 0.2 | 1 | 50 | 20 | 28 |
| PE2 | 0.2 | 4 | 50 | 20 | 25 |
| PE3 | 0.2 | 4 | 20 | 20 | 55 |
| PE4 | 0.2 | 4.62 | 35 | 20 | 40 |
| PE5 | 0.2 | 2.5 | 35 | 20 | 42 |
| PE6 | 0.2 | 2.5 | 56.21 | 20 | 21 |
| PE7 | 0.2 | 1 | 20 | 20 | 58 |
| PE8 | 0.2 | 0.3 | 35 | 20 | 44 |
| PE9 | 0.2 | 2.5 | 13.78 | 20 | 63 |
Characterization of ethosomes
Microscopic examination of particle size and shape
Through microscopic inspection, the average size of ethosomes was calculated. To examine individual vesicles, distilled water was used to dilute a sample of ethosomes adequately. After applying a coverslip to a glass slide containing a drop of the diluted solution, the sample was examined under a microscope with a magnification of 15 x 45. All measurements were taken in triplicate, and the final vesicles had a spherical shape [21].
Determination of vesicle size and size distribution measurements
Vesicle size and size distribution of drug-loaded ethosomal vesicular dispersion were determined by using a zeta sizer (Malvern instrument) [18]. A clear, disposable zeta cell was used to hold the sample after a few drops of the formulation were diluted in distilled water, and measurements were made [22].
Determination of zeta potential measurements
Zeta potential (ζ) measurements were performed by using a zeta sizer and the drug-loaded vesicular ethosomes were analyzed [18]. After diluting ethosomes with distilled water, the samples were put in an electrophoretic cell with a potential of 150 mV, and analysis was carried out [22].
Determination of entrapment efficiency (EE)
The ultracentrifuge method was utilized to determine the ethosome's entrapment efficiency. The prepared ethosomes were centrifuged in an ultracentrifuge for 30 min at 10,000 rpm after being stored overnight at 4 °C. After that, the liquid supernatant was collected, diluted with water, and its EE was measured at 615.5 nm using a UV Spectrophotometer [14]. In the end, the entrapment efficiency was determined using Equation No. 3.
 .. (3)
Scanning electron microscopy (SEM)
After the ethosomal dispersion was suitably diluted, it was sonicated. A few drops of the dispersion were applied to the grid, and then they were left to dry. The samples were fully dried before the images were captured using a scanning electron microscope at a temperature of 25±2 °C, an accelerating voltage of 12.0 kV, and a magnification of 60x [21, 23].
Formulation of ethosomal topical gel
Xanthum gum was mixed with glycerine (2 ml and 1 ml) and soaked in distilled water (7 ml and 3 ml) for overnight. Then, the optimal formulation of 10 g and 15 g of ethosomes were added to the gel base, respectively (EG1 and EG2), and the mixture was continuously agitated in a closed jar at 700 rpm and 30 °C until a homogenous gel was formed. Finally, citric acid was added gradually to the gel to correct its pH [15].
Evaluation of topical ethosomal gel
Homogeneity
The formulations were tested for homogeneity by visual appearance and by touching [24].
Viscosity
Using a Brookfield viscometer (DV 2PL), the viscosity for different gel designs were measured at a temperature of 25.0±0.5 °C. In the 10-100 % range, the spindle speeds have been changed to yield the maximum torque values. Spindle TL6 was used to measure viscosity at 10 rpm [5].
pH
The pH of the gel was measured using a calibrated digital pH meter that was standardized using standard buffers with a pH of 7.4 before using 1 g of gel, precisely weighed and dispersed in 100 ml distilled water and its pH was measured [5].
Spreadability
A 20 by 20 cm glass plate was covered with about 1 g of gel in the shape of a circle with a diameter of 1 cm, and another glass plate was placed on top of it. After five minutes of resting a 500 g weight on the upper glass plate, it was discovered that the cream had spread, increasing in diameter [5].
 (4)
(4)
Where, S-Spread ability
M-Weight coupled to the upper slide
L-Length of the glass slide
T-Time is taken to separate the slides in seconds.
Table 3: Composition of optimized formulation
| Formulation | Drug (%) | SPC (%) | Ethanol (%) | Propylene glycol (%) | Water (%) |
| OF1 | 0.2 | 1.85 | 39.32 | 20 | 38 |
SPC: Soya phosphatidylcholine
Table 4: Formulation of ethosomal gel (20g)
| Formulation code | Xanthum gum | Phycocyanin ethosomes |
| EG1 | 1 g | 10 g |
| EG2 | 0.5 | 15 g |
Drug content
Using spectrophotometry, the drug content was determined. 100 mg of the formulation was diluted with distilled water and filtered. Distilled water was added to make the volume up to 10 ml. After properly diluting the resulting solution with water, the absorbance was measured at 615.5 nm using Shimadzu1900i UV Spectrophotometer [25].
SPF activity of the formulation
1g of gel was placed in a 25 ml volumetric flask along with 25 ml of water. A Whatman filter paper was used to filter the contents after the flask was placed on the sonicator for fifteen minutes. A 1 ml aliquot was put into a 10 ml volumetric flask, and the volume was then brought down to 10 ml by adding distilled water. Samples in solution yielded absorption spectra in the 290–320 nm wavelength region. Using a UV Spectrophotometer, the produced aliquots were scanned between 290 and 320 nm. The absorbance readings were acquired and multiplied by the corresponding EE (λ) and I (λ) values. They then took their aggregate and increased it by the Correction Factor (CF) [26]. The expression to determine sun protection activity is shown in Equation No. 1.
Anti-oxidant activity
1 ml of various quantities of formulations was taken in 10 ml volumetric flasks. To this 3 ml of DPPH phosphate buffer solution was added and the volume made up to 10 ml and incubated for 20 min at 37 ᵒ. The absorbance was measured at 517 nm using phosphate buffer as a blank. As a control, the DPPH absorbance was employed [9]. Using Equation No.2, the percentage of anti-radical action was determined.
Stability studies
The ethosomal gel formulations were subjected to accelerated stability testing at 40 ºC±2 º/75%±5 % RH for 3 mo following ICH recommendations. The gels were stored in accelerated stability chambers with controlled relative humidity and temperature, and they were packaged in amber-colored jars. The formulations underwent rapid stability testing at room temperature and 40 °C. The parameter readings were taken on 1, 30, and 90 days. The physical characteristics, color shift, pH, viscosity, and sun protection factors of the formulations were evaluated [11].
RESULTS
Absorption maxima for phycocianin
The absorption maxima for phycocyanin was determined by using a UV Spectrophotometer in the colorimetric measurement range of 200-800 nm. The absorption maximum for phycocyanin was found to be 615.5 nm. The linear equation of standard calibration for phycocyanin was estimated.
Compatibility study using FTIR spectroscopy
The data obtained from FTIR studies is shown in table 5. It indicates that the drug and the excipients present in the formulations were compatible with each other no signs of any interactions. The FTIR spectra of phycocyanin and formulation are shown in fig. 1 and 2.

Fig. 1: FTIR spectra of phycocyanin (API) (Caption, Centered)
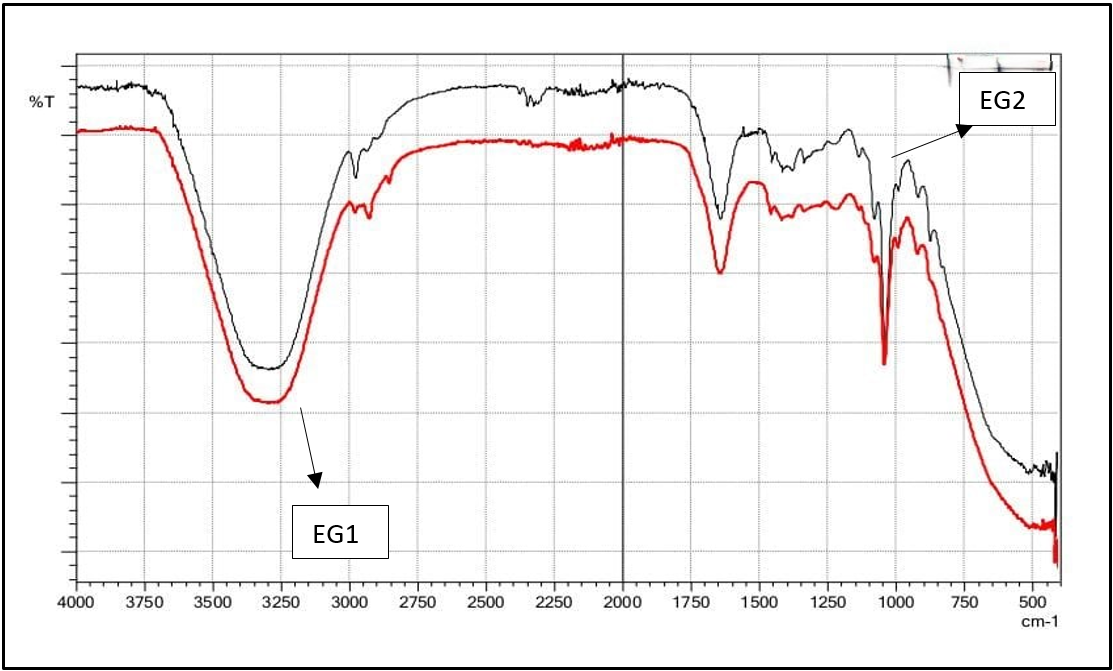
Fig. 2: FTIR spectra of formulations (EG1and EG2)
Table 5: Data obtained from FTIR spectral peaks
| Functional groups | Vibrational mode | Wave number (cm-1) literature value | Frequency range cm-1 | ||
| Drug | EG1 | EG2 | |||
| Phenol | O-H stretch | 3400-3200 | 3278.76 | 3307.92 | 3298.28 |
| Ketone | Amide I (C=O stretch) | 1650-1550 | 1647.24 | 1643.35 | 1643.35 |
| Aromatic | Amide II (N-H bend, C-N stretch) | 1550-1450 | 1541.52 | 1456.26 | 1456.26 |
| Fingerprints region | 1250-1000 | 1241.50 | 1043.49 | 1041.56 | |
The compatibility between the phycocyanin and the added excipients was evaluated by Fourier-transform infrared spectroscopy (FTIR) analysis, both in its pure form and inside a gel formulation. Key functional groups were detected in the FTIR spectrum: a broad O-H stretching vibration in the 3400–3200 cm-1 range suggested the presence of hydroxyl groups; the amide I band, which reflects peptide bonds and is characterized by C=O stretching, within 1650–1550 cm-1; and the amide II band, which appears between 1550–1450 cm-1 and is linked to C–N stretching and N–H bending. These functional groups attest to phycocyanin’s proteinaceous state and the stability of its structural framework within the gel. Because hydroxyl groups and amide bonds can donate hydrogen atoms to eliminate free radicals, they are essential to phycocyanin’s antioxidant activity. Thus, the appearance of these functional groups indicates that phycocyanin may be effective in gel formulations for antioxidant activity.
Differential scanning calorimetry (DSC)
According to the literature search, the melting point of phycocyanin ranges from 60 to 80 °C. The phycocyanin sample demonstrated an endothermic peak at 83.23 °C, indicating that the substance is amorphous. The DSC thermogram of phycocyanin is depicted in fig. 3.
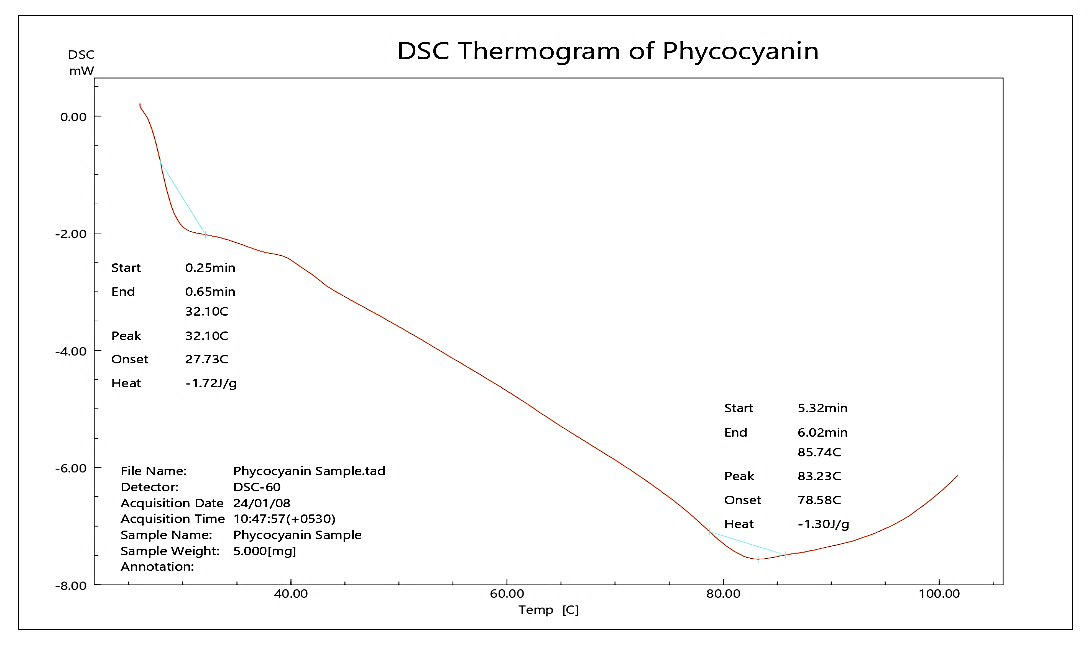
Fig. 3: DSC thermogram of phycocyanin (API)
In vitro antioxidant activity of the drug
At a dosage of 100 mg/ml, the phycocyanin exhibited a 78.94 % radical scavenging activity. Phycocyanin's capacity to scavenge DPPH radicals was demonstrated and presented in table 6.
All formulations exhibited a higher percentage of DPPH radical inhibition than the phycocyanin (API) when taken alone, indicating a verified scavenging effect of DPPH radicals.
The sun protection factor values for different drug sample concentrations are displayed in table 7 and the graphical representation of sun protection factor activity is illustrated in fig. 4. The maximum sun protection factor value in this study was achieved by diluting 100 mg of phycocyanin with 10 ml of water. As the wavenumber increased the UV transmittance value also increased. As the concentration of the medication (Phycocyanin) increased, the sun protection factor value demonstrated a significant enhancement in UV protection.
Therefore, 100 mg/10 ml exhibited a sun protection factor of more than 30. Therefore, 100 mg of the drug was considered an optimized concentration, which was further loaded into ethosomal vesicles.
Table 6: In vitro antioxidant activity for standard and drug
| S. No. | Concentration(µg/ml) | Standard ascorbic acid (% inhibition) | Drug (%) |
| 1 | 20 | 56.89±0.027 | 38.44±0.01 |
| 2 | 40 | 68.39±0.035 | 46.31±0.04 |
| 3 | 60 | 77.87±0.03 | 55.86±0.03 |
| 4 | 80 | 89.63±0.012 | 66.35±0.01 |
| 5 | 100 | 96.33±0.024 | 78.94±0.02 |
All data are given in mean±SD, n=3; n is the number of observations.
Table 7: In vitro SPF values of various concentrations of drug
| WL | EE*I | 50 mg/10 ml | 75 mg/10 ml | 100 mg/10 ml |
| Abs | SPF | Abs | ||
| 290 | 0.015 | 3.135 | 0.047025 | 3.297 |
| 295 | 0.0817 | 2.43 | 0.198531 | 3.456 |
| 300 | 0.2874 | 2.165 | 0.622221 | 2.319 |
| 305 | 0.3278 | 1.991 | 0.6526498 | 2.395 |
| 310 | 0.1864 | 1.934 | 0.3604976 | 2.700 |
| 315 | 0.0839 | 1.953 | 0.1638567 | 2.458 |
| 320 | 0.0180 | 2.026 | 0.036468 | 2.240 |
| Total SPF | 20.81 |
WL: Wavelength, EE: Erythemogenic effect, I: Intensity, SPF: Sun protection factor, Abs: Absorbance
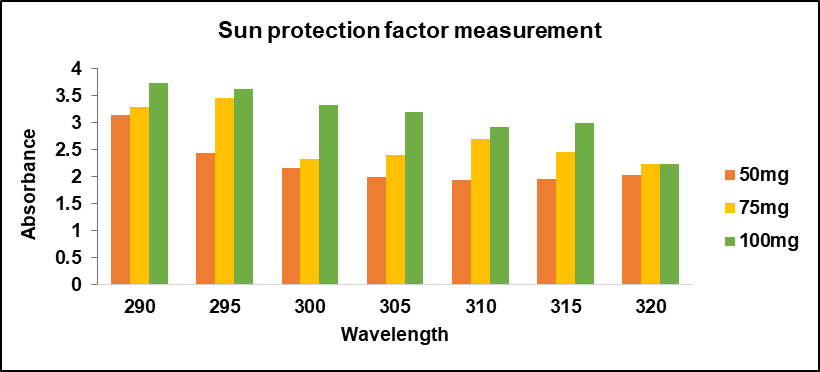
Fig. 4: In vitro sun protection factor activity of drug phycocyanin
Central composite design’s optimization of ethosomes
The Central composite design yielded a total of nine experimental runs to generate an optimized ethosomal formulation. The data values obtained from the experimental study design are shown in table 8. The response variables particle size (Y1) and zeta potential (Y2) exhibited data values that ranged between 161.6 to 492.3 nm and-34.6 to-75.43 mV, respectively. The results from all 9 formulations indicated that the quadratic polynomial equations were found to be the best fit for the data obtained. The contour and 3D surface plots (fig. 5 and 6) illustrated the relationship between the independent variables and the selected response variables particle size and zeta potential.
Table 11 indicates R2, standard deviation, and percentage coefficient variation values for both the response variables.
The statistical analysis for particle size and zeta potential is shown in table no 9 and 10.
Table 8: Observed responses for the phycocyanin-loaded ethosomal formulations during the development
| Formulation code | SPC (X1) (%) | Ethanol (X2) (%) | Particle size (Y1) (nm) | Zeta potential (Y2) (mV) |
| PE1 | 1 | 50 | 161.6 | -34.6 |
| PE2 | 4 | 50 | 472.3 | -51.09 |
| PE3 | 4 | 20 | 339.5 | -59.14 |
| PE4 | 4.62 | 35 | 492.3 | -75.43 |
| PE5 | 2.5 | 35 | 304 | -46.98 |
| PE6 | 2.5 | 56.21 | 283.7 | -38.51 |
| PE7 | 1 | 20 | 188.3 | -36.38 |
| PE8 | 0.37 | 35 | 79.03 | -28.08 |
| PE9 | 2.5 | 13.78 | 223 | -44.26 |
Table 9: Statistical analysis for particle size (ANOVA)
| Source | Sum of squares | df | mean Square | F – value | p-value | |
| Model | 1.478E+05 | 3 | 49273.96 | 56.49 | 0.0003 | significant |
| A-Phospholipid | 1.369E+05 | 1 | 1.369E+05 | 156.89 | <0.0001 | |
| B-Ethanol | 4605.25 | 1 | 4605.25 | 5.28 | 0.0700 | |
| AB | 6360.06 | 1 | 6360.06 | 7.29 | 0.0428 | |
| Residual | 4361.45 | 5 | 872.29 | |||
| Cor Total | 1.522E+05 | 8 |
Table 10: Statistical analysis for zeta potential (ANOVA)
| Source | Sum of squares | df | Mean square | F – value | p-value | |
| Model | 1450.41 | 2 | 725.21 | 19.96 | 0.0022 | significant |
| A-Phospholipid | 1410.15 | 1 | 1410.15 | 38.81 | 0.0008 | |
| B-Ethanol | 40.26 | 1 | 40.26 | 1.11 | 0.3330 | |
| Residual | 218.01 | 6 | 36.33 | |||
| Cor Total | 1668.42 | 8 |
Response 1 (Y1): The effect of independent variables on particle size,
Particle size (Y1) =+282.76 130.69 *X1+23.99 *X2+39.88*X1X2
By the above quadratic polynomial equation, soya phosphatidylcholine (X1) and ethanol (X2) have exhibited synergistic effects on response variable (Y1) particle size. It was observed that as the concentration of soya phosphatidylcholine was increased, the particle size of ethosomes was also increased. Furthermore, when the concentration of soya phosphatidylcholine was increased from 1% to 4%, it was observed that the particle size of the ethosomes increased from 79.03 nm to 492.3 nm. Similarly, it was noticed that an increased concentration of ethanol from (20 % to 50%) has shown a positive effect on particle size.
Zeta potential (Y2) =-46.06-13.26*X1+2.24 X2
According to the above quadratic polynomial equation, soya phosphatidylcholine (X1) has shown a negative effect on the response variable (Y2) zeta potential. It was observed that, with an increased concentration of soyaphosphotidylcholine, the zeta potential value was found to be decreased. Similarly, it was proved that ethanol exhibited a reciprocal impact on the zeta potential of the ethosomes. As the concentration of ethanol in ethosomal formulation increases, the zeta potential value of the ethosomes increased from -28.08 mV to-75.43 mV.
Negative zeta potential results in improved permeability. The ethosomes vesicle is stable, as indicated by the negative zeta potential values of all formulations.
Table 11: Projected values produced by design expert
| Quadratic model | R2 | Adjusted R2 | Predicted R2 | SD | % CV |
| Y1 | 0.9714 | 0.9543 | 0.9012 | 29.49 | 10.43 |
| Y2 | 0.8692 | 0.8255 | 0.6803 | 6.03 | 13.10 |
SD: Standard deviation, %CV: Percentage co-efficient variance
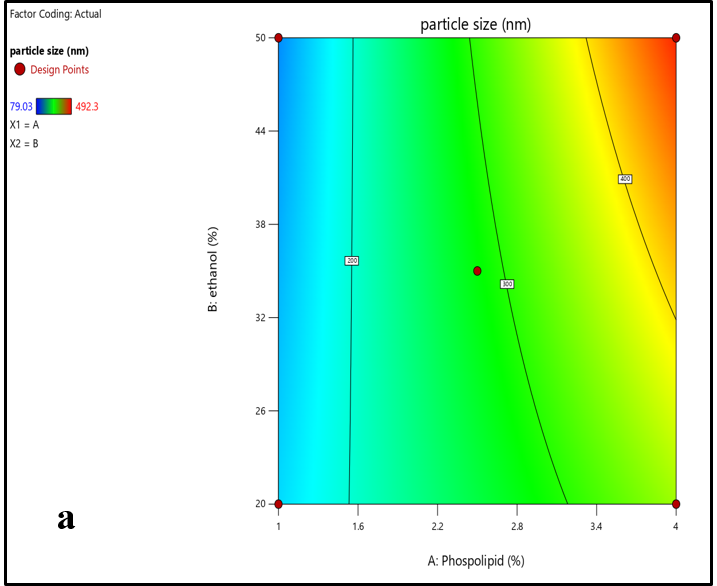

Fig. 5: An illustration of a) Contour plot and b) 3D surface plots showing the correlation between the particle size and independent variables
Optimization of ethosomal formulation
The phycocyanin-loaded ethosomal formulation was optimized from central composite design using design expert software, in consideration with soya phosphatidylcholine (1.85 %) and ethanol (39.32 %). The optimized formulation was further characterized for different parameters particle size, zeta potential, polydispersity index, and entrapment efficiency. The data obtained for the optimized formulation is shown in table 13. The overlay plot for optimized ethosomal formulation is shown in fig. 7.
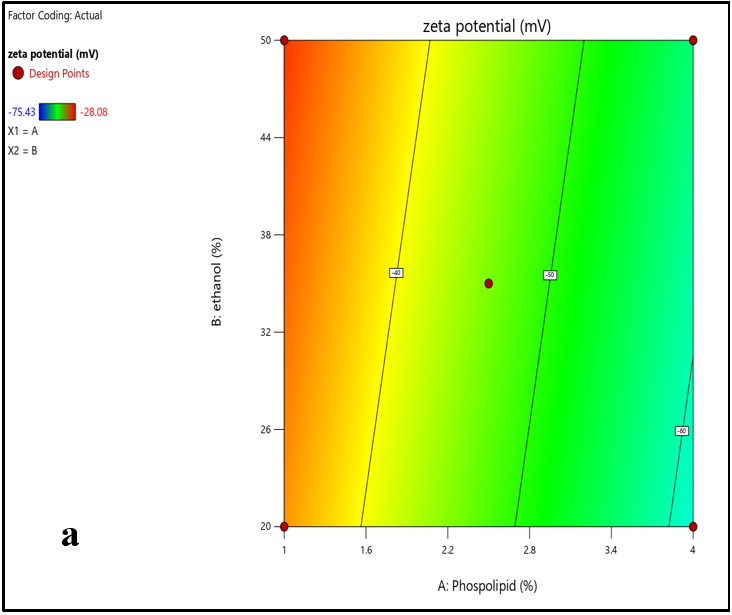

Fig. 6: An illustration of a) Contour plot and b) 3D surface plots showing the correlation between the zeta potential and independent variables
Table 12: Physicochemical characterization of different batches of ethosomes
| S. No. | Formulation code | Particle size (nm) | Zeta potential (mV) | PDI | Entrapment efficiency (%)* |
| 1 | PE1 | 161.6 | -34.6 | 0.518 | 98.39±0.015 |
| 2 | PE2 | 472.3 | -51.09 | 0.402 | 99.82±0.021 |
| 3 | PE3 | 339.5 | -59.14 | 0.179 | 99.64±0.026 |
| 4 | PE4 | 492.3 | -75.43 | 0.519 | 99.84±0.012 |
| 5 | PE5 | 304 | -46.98 | 0.015 | 99.56±0.017 |
| 6 | PE6 | 283.7 | -38.51 | 0.191 | 99.43±0.032 |
| 7 | PE7 | 188.3 | -36.38 | 0.342 | 98.57±0.045 |
| 8 | PE8 | 79.03 | -28.08 | 0.470 | 98.05±0.023 |
| 9 | PE9 | 223 | -44.26 | 0.283 | 99.29±0.011 |
*The data is expressed in terms of mean±SD, n=3; n is the number of observations, PDI: Polydispersity index

Fig. 7: Overlay plot for optimized ethosomal formulation
Table 13: Optimized formulation of ethosomes
| S. No. | Formulation code | Particle size (nm) | Zeta potential (mV) | Polydispersity index | Entrapment efficiency (%)* |
| 1 | OF1 | 221.8 | -28.21 | 0.747 | 99.36±0.027 |
*The data is expressed in terms of mean±SD, n=3; n is the number of observations.


A b
Fig. 8: a) Particle size b) Zeta potential for optimized ethosomal formulation
Concerning the values presented by central composite design, phycocyanin-loaded ethosomes optimized formulations were designed and developed by considering the criteria of reaching the minimum particle size and zeta potential. Particle size distribution was 221.8 nm with a zeta potential value of -28.21 mV. The particle size distribution and zeta potential curve for optimized ethosome formulation is depicted in fig. 8.
Scanning electron microscopy (SEM)
The spheres in the phycocyanin ethosomal dispersion were clustered together and displayed (fig. 9) an irregularly spherical structure. The smooth, spherical surface of ethosomes was uniform. Scanning electron microscopy test results also show that ethosomal dispersions with smooth surfaces are less likely to undergo oxidation reactions, but because of their larger surface area, those with rough surfaces are more susceptible to these processes. Therefore, it is assumed that the aggregated spheres may also increase stability due to the reduction of surface area.
Evaluation of topical dosage form
Appearance
The color, homogeneity, and consistency of the prepared formulations were visually inspected. The topical formulation is pale blue with good consistency. The physicochemical characterization of ethosomal gel is shown in table 14.
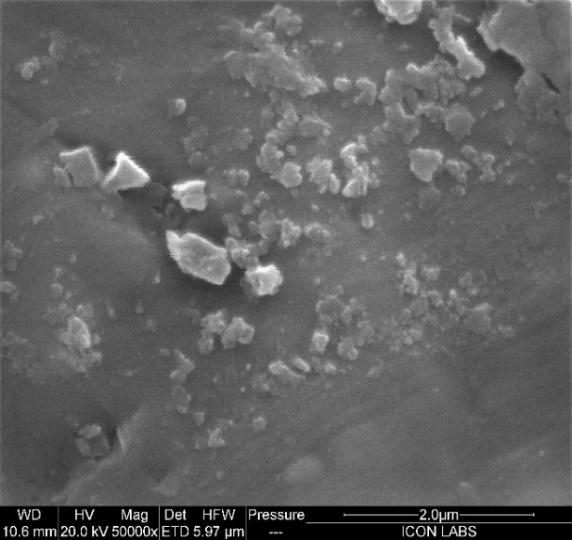
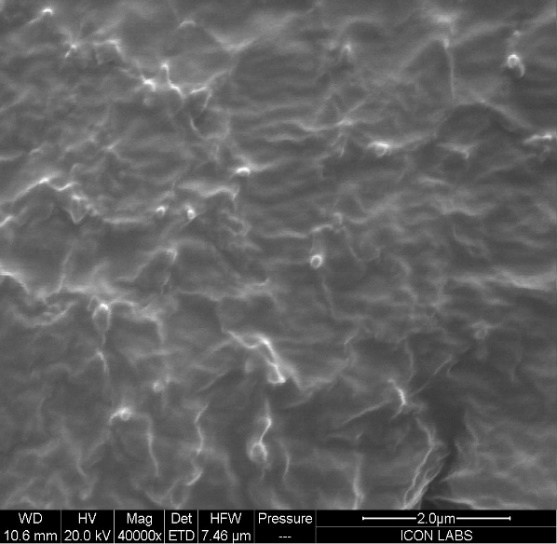
Fig. 9: SEM study of optimized ethosome formulation
Table 14: Physicochemical characterization of ethosomal gel
| Formulation code | Appearance | Consistency | Homogeneity |
| EG1 | Pale blue | Good | Homogenous |
| EG2 | Pale blue | Good | Homogenous |
EG: Ethosomal gel
Determination of pH
A digital pH meter was used to measure the pH of the gel. The pH of the formulation ranged from 6.0-7.0. Hence, it resulted in being non-irritant to the skin. The data obtained for pH values were tabulated in table 15.
Readings were taken in triplicate and data was presented as mean±SD.
Spreadability
Spreadability values contribute to the efficacy of a formulation. The values of spreadability were found to be 7.8±0.1 cm and 8.3±0.05 cm as shown in table 15. Spreadability was found to be decreased with an increased concentration of the xanthum gum.
Viscosity
The viscosity of the gel was found to be in the range of 4500 cps to 5000 cps and the viscosity was increased with the increased in concentration of the xanthum gum as expressed in formulation table 4. The data obtained for viscosity values are tabulated in table 15.
Drug content
The percent drug content of gel formulations EG1 and EG2 was found to be 96.18 % ±0.35 and 98.75 % ± 0.12, respectively. Where EG2 formulation has exhibited greater drug content as compared to EG1 ethosomal formulation. The drug content analysis is tabulated in table 15.
In vitro antioxidant activity of gel
Using the DPPH technique, the anti-radical activity of ethosomal formulations (EG1 and EG2) was determined. It was shown that the antioxidant activity of EG1 and EG2 was 85.48% and 88.49 % respectively. However, the EG2 formulation has exhibited the highest antioxidant activity as compared to the EG1 formulation and standard ascorbic acid. The data values for the antioxidant activity of the gels are shown in fig. 10.
Table 15: Evaluation of ethosomal gel formulation
| Formulation code | pH | Spreadability (cm) | Viscosity (cps) | Drug content (%) |
| EG1 | 6.45±0.05 | 7.8±0.1 | 4910±5.50 | 96.18±0.35 |
| EG2 | 6.76±0.04 | 8.3±0.05 | 4570±4.04 | 98.75±0.12 |
All data are given in mean±SD, n=3; n is the number of observations.
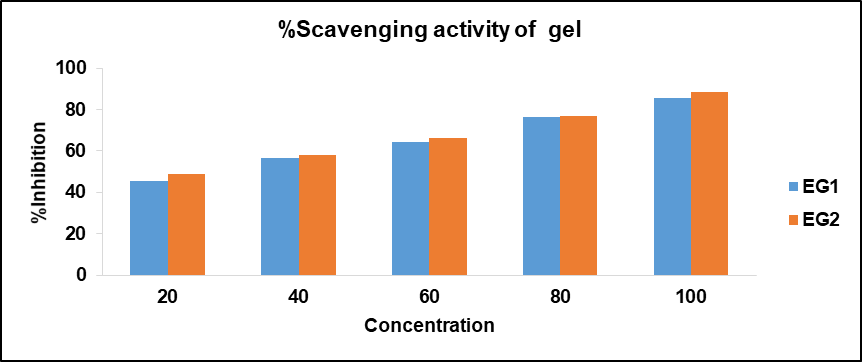
Fig. 10: Antioxidant activity of ethosomal gel
EG1: Ethosomal Gel 1
Ethosomal Gel 2
Determination of sun protection factor values of formulations
In comparison to ethosomal formulations, the EG2 formulation has a higher sun protection factor rating than the EG1 formulation. The data obtained for sun protection factor values for both formulations are tabulated in table 16. The graphical representation of sun protection factor values for both the ethosomal formulations are depicted in fig. 11.
The stability analysis of the formulated gel was conducted as per the ICH guidelines for 3 mo. The results shown in table 17 indicate no visible changes in appearance with good consistency. However, there were slight changes in pH and viscosity, and the sun protection factor of the formulations was increased with the increase in days. Overall, the formulations demonstrated stability throughout the study period, with only minor variations in some parameters. Notably, formulation EG2 exhibited the highest sun protection factor activity, maintaining its effectiveness over time.
Table 16: Sun protection factor values of ethosomal gel formulations
| Wavelength (nm) | EE*I | EG1 | EG2 |
| Absorbance | SPF | ||
| 290 | 0.015 | 4.000 | 0.06 |
| 295 | 0.0817 | 3.792 | 0.3098064 |
| 300 | 0.2874 | 3.566 | 1.0248684 |
| 305 | 0.3278 | 3.304 | 1.0830512 |
| 310 | 0.1864 | 3.297 | 0.6145608 |
| 315 | 0.0839 | 3.112 | 0.2610968 |
| 320 | 0.0180 | 2.959 | 0.053262 |
| SPF | 34.06 |
SPF: Sun protection factor
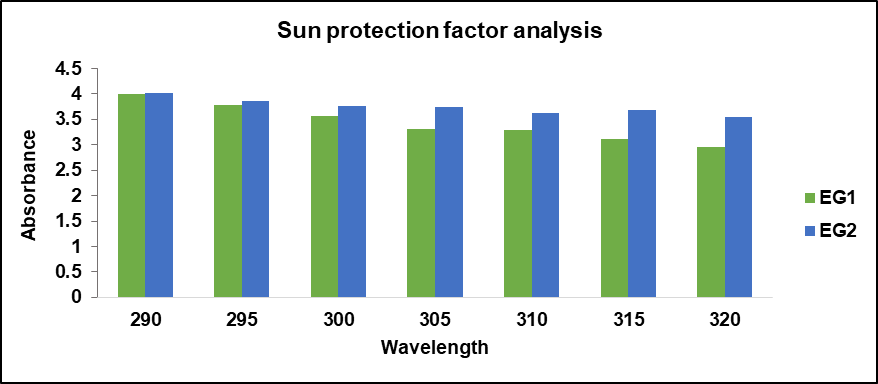
Fig. 11: In vitro SPF analysis of ethosomal gel
Table 17: Accelerated stability for ethosomal gel
| Formulation code | No of days | Evaluation parameters at 30 ℃ and 65.5 % RH | ||||
| Color | Homogeneity | pH | Viscosity | SPF | ||
| EG1 | 1 | Pale blue | Homogenous | 6.5±0.025 | 4908±7.0 | 35.11±0.02 |
| 15 | Pale blue | Homogenous | 6.6±0.037 | 4881±4.16 | 36.18±0.03 | |
| 30 | Pale blue | Homogenous | 6.7±0.045 | 4805±5.50 | 37.10±0.04 | |
| 45 | Pale blue | Homogenous | 6.8±0.051 | 4783±5.03 | 38.04±0.04 | |
| 60 | Pale blue | Homogenous | 6.6±0.032 | 4694±5.56 | 39.01±0.05 | |
| 75 | Pale blue | Homogenous | 6.7±0.047 | 4609±6.0 | 40.03±0.06 | |
| 90 | Pale blue | Homogenous | 6.8±0.045 | 4615±5.50 | 41.03±0.05 | |
| EG2 | 1 | Pale blue | Homogenous | 6.7±0.035 | 4565±5.50 | 38.27±0.03 |
| 15 | Pale blue | Homogenous | 6.8±0.045 | 4505±5.68 | 39.20±0.04 | |
| 30 | Pale blue | Homogenous | 6.9±0.055 | 4474±4.50 | 40.03±0.05 | |
| 45 | Pale blue | Homogenous | 7.0±0.03 | 4406±7.63 | 41.02±0.05 | |
| 60 | Pale blue | Homogenous | 6.8±0.025 | 4386±4.58 | 42.01±0.04 | |
| 75 | Pale blue | Homogenous | 6.9±0.02 | 4304±4.50 | 43.02±0.06 | |
| 90 | Pale blue | Homogenous | 7.0±0.03 | 4314±4.00 | 44.02±0.05 | |
All data are given in mean±SD, n=3; n is the number of observations, SPF: Sun protection factor.
DISCUSSION
Using the Central Composite Design statistical model, the current study intended to develop and optimize a phycocyanin-loaded ethosomes formulation [18]. In the present study, phycocyanin algae was scanned for its UV protectant activity. Phycocyanin algae exhibited an SPF of 30 and this concentration was used to develop ethosomal transdermal delivery [6].
The analysis of FTIR demonstrated no chemical interactions [14, 15]. The detection of the melting point of the drug by using DSC was found to be amorphous [16].
The optimized ethosome formulation (OF1) has a particle size of 221.8 nm, which is comparable to previous reports of Phycocyanin loaded ethosome formulations sizes ranging from 79.03 nm to 492.3 nm. Zeta potential of optimized ethosome formulation (OF1) of -28.21 mV, which is comparable to previous reports of phycocyanin-loaded ethosome formulations ranging from-28.08 mV to-75.43 mV [18].
The optimized formulation gel EG2 exhibited good antioxidant activity with UV protection which can be used as a remedy for digital ageing.
The study investigated the potential of phycocyanin ethosomes for sunscreen formulations.
Using the Central Composite Design statistical model, the current study intended to develop and optimize a phycocyanin-loaded ethosomes formulation [18]. In the present study, phycocyanin algae was scanned for its UV protectant activity. Phycocyanin algae exhibited an SPF of 30 and this concentration was used to develop ethosomal transdermal delivery [6].
FTIR studies confirmed the compatibility of phycocyanin with other formulation components [14, 15]. The DSC study showed a lack of a distinct melting peak, suggesting an amorphous structure [16]. Phycocyanin demonstrated 78.94% radical scavenging activity at 100 µg/ml, indicating strong antioxidant properties. In vitro SPF screening revealed that 100 mg of phycocyanin in 10 ml of water yielded the highest SPF value.
Ethosomes were prepared using a cold method, with increased phospholipid and ethanol concentrations resulting in larger particle sizes and decreased zeta potential. Entrapment efficiency increased with higher phospholipid concentrations. SEM analysis showed uniform, smooth spherical ethosomes. The optimized ethosomes were incorporated into xanthan gum gel bases.
The optimized ethosome formulation (OF1) has a particle size of 221.8 nm, which is comparable to previous reports of Phycocyanin loaded ethosome formulations sizes ranging from 79.03 nm to 492.3 nm. Zeta potential of optimized ethosome formulation (OF1) of -28.21 mV, which is comparable to previous reports of phycocyanin-loaded ethosome formulations ranging from-28.08 mV to-75.43 mV [18].
The gel formulations were pale blue with good consistency and acceptable pH. Spreadability values were 7.8±0.1 cm and 8.3±0.05 cm, and viscosity was 4910 and 4570 cps, respectively. Drug content in gel formulations EG1 and EG2 was 96.57±0.35% and 98.71±0.12%, respectively. Antioxidant activity was 85.48% for EG1 and 88.49% for EG2, with EG2 showing better results. Both formulations exhibited good SPF activity, with EG2 having a higher SPF rating. Stability studies over three months showed minor changes in pH and viscosity, with an increase in SPF over time, confirming the stability and effectiveness of the formulations, particularly EG2.
The optimized formulation gel EG2 exhibited good antioxidant activity with UV protection, which can be used as a remedy for digital ageing.
CONCLUSION
The study aimed to evaluate ethosomes containing phycocyanin for their potential in sunscreen formulations. Fourier-transform infrared spectroscopy confirmed the proteinaceous nature and structural stability of phycocyanin in gel formulations. The substance demonstrated significant antioxidant potential, which, when incorporated into gel formulations, enhanced antioxidant and skin-protective properties, reflected in higher SPF values at increased drug concentrations. The ethosomal dispersion's structure suggested sensitivity to oxidation, highlighting the importance of surface morphology for stability and performance. The ethosomal gel with a pH compatible with skin physiology showed good spreadability and viscosity, with better drug content and antioxidant activity in one formulation compared to another. An ethosome formulation containing phycocyanin displayed especially high stability and SPF against UV radiation. Conclusion is written in short and specific
FUNDING
Nil
AUTHORS CONTRIBUTIONS
All the authors have equal contribution and participation in the proposed research work. Fatima Sanjeri Dasankoppa: Conceptualization, Methodology, Writing-Reviewing and Editing, Supervision. Revati Dharampal Sagare: Methodology and Data analysis. Megha N Sureban: Conceptualization, Data curation, Investigation, Writing – Original draft preparation. Hasanpasha N Sholapur: Software, Methodology and Visualization. Arunkumar Gundaiah Ramesh: Reviewing and Data Analysis. Vijayakumar Murugesan: Software and Reviewing.
CONFLICT OF INTERESTS
Declared none
REFERENCES
Panda P, Mohanty S, Pal A, Mukkamala S. Blue light protective cosmetics: demand of the digital era. Res J Pharm Life Sci. 2021 May;2(2):43-58.
Panda P, Mohanty S, Pal A, Mukkamala S. Blue light protective cosmetics: demand of the digital era. Res J Pharm Life Sci. 2021 May;2(2):43-58.
Mahawar V, Patidar K, Joshi N. Development and evaluation of herbal antiaging cream formulation containing Annona squamosa leaf extract. Asian J Pharm Clin Res. 2019;12(2):210-4. doi: 10.22159/ajpcr.2019.v12i2.29026.
Dwivedi S, Ahmad IZ. A review of the emerging role of cyanobacteria-based nanoformulations for skin care: opportunities and challenges. J Appl Biol Biotechnol. 2022 Apr 10;10(3):210-8. doi: 10.7324/JABB.2022.100324.
Amrutkar MP, Badgujar MN, Bhamre MR, Chaudhari MV, Borikar MS. Formulation and evaluation of photoaging face gel by using algae powder extract (chlorella vulgaris). Int J All Res. 2020 May 10;2(12):17-24.
Cao J, Zheng X, Li Z, Zheng M, Qian C, Shen S. Exploring marine algae derived phycocyanin nanoparticles as a safe and effective adjuvant for sunscreen systems. Discov Appl Sci. 2024 Jan;6(1):24. doi: 10.1007/s42452-024-05665-z.
David SR, Hui MS, Pin CF, Ci FY, Rajabalaya R. Formulation and in vitro evaluation of ethosomes as a vesicular carrier for enhanced topical delivery of isotretinoin. Int J Drug Deliv. 2013 Jan 1;5(1):28-34.
Ragusa I, Nardone GN, Zanatta S, Bertin W, Amadio E. Spirulina for skin care: a bright blue future. Cosmetics. 2021 Jan;8(1):7. doi: 10.3390/cosmetics8010007.
Tiwari R, Singh I, Gupta M, Singh LP, Tiwari G. Formulation and evaluation of herbal sunscreens: an assessment towards skin protection from ultraviolet radiation. Pharmacophore. 2022;13(3):41-9. doi: 10.51847/svzLRFMP5F.
Sopyan I, Gozali D, Sriwidodo IS, Guntina RK. Design expert software (DOE): an application tool for optimization in pharmaceutical preparations formulation. Int J App Pharm. 2022;14(4):55-63. doi: 10.22159/ijap.2022v14i4.45144.
Ilomuanya MO, Ekerebe Z, Cardoso Daodu I, Sowemimo A. Formulation and evaluation of sunscreen cream using Detarium senegalense oil as base. TJNPR. 2020 Apr;4(4):141-5. doi: 10.26538/tjnpr/v4i4.5.
Dhapte PV, Kadam S, Saptarsi S, Kenjale PP. Nanocosmeceuticals: facets and aspects. Future Sci OA. 2020 Aug 6;6(10):FSO613. doi: 10.2144/fsoa-2019-0109.
Singh S, Purwar V. Role of algae in cosmetics. Int J Creat Res Thoughts. 2022 Jun;10(6):73-8.
El Naggar NE, Hussein MH, El Sawah AA. Bio-fabrication of silver nanoparticles by phycocyanin characterization in vitro anticancer activity against breast cancer cell line and in vivo cytotxicity. Sci Rep. 2017 Sep 7;7(1):10844. doi: 10.1038/s41598-017-11121-3, PMID 28883419.
Andleeb M, Shoaib Khan HM, Daniyal M. Development characterization and stability evaluation of topical gel loaded with ethosomes containing Achillea millefolium L. extract. Front Pharmacol. 2021 Apr 12;12:603227. doi: 10.3389/fphar.2021.603227, PMID 33912036.
Al Malki AL. In vitro cytotoxicity and pro-apoptotic activity of phycocyanin nanoparticles from Ulva lactuca (Chlorophyta) algae. Saudi J Biol Sci. 2020 Mar;27(3):894-8. doi: 10.1016/j.sjbs.2019.12.037, PMID 32127768.
Pez Jaeschke D, Rocha Teixeira I, Damasceno Ferreira Marczak L, Domeneghini Mercali G. Phycocyanin from spirulina: a review of extraction methods and stability. Food Res Int. 2021 May;143:110314. doi: 10.1016/j.foodres.2021.110314, PMID 33992333.
Mishra K, Ojha H, Chaudhury NK. Estimation of antiradical properties of antioxidants using DPPH assay: a critical review and results. Food Chem. 2012 Feb 15;130(4):1036-43. doi: 10.1016/j.foodchem.2011.07.127.
Aodah AH, Hashmi S, Akhtar N, Ullah Z, Zafar A, Zaki RM. Formulation development optimization by box behnken design and in vitro and ex vivo characterization of hexatriacontane loaded transethosomal gel for antimicrobial treatment for skin infections. Gels. 2023 Apr 11;9(4):322. doi: 10.3390/gels9040322, PMID 37102934.
Rakesh R, Anoop KR. Formulation and optimization of nano-sized ethosomes for enhanced transdermal delivery of cromolyn sodium. J Pharm Bioallied Sci. 2012 Oct;4(4):333-40. doi: 10.4103/0975-7406.103274, PMID 23248569.
Sujatha S, Sowmya G, Chaitanya M, Reddy VK, Monica M, Kumar KK. Preparation characterization and evaluation of finasteride ethosomes. Int J Drug Deliv. 2016;8(1):1-11.
Venugopal V. Formulation development and characterization of tea tree oil-loaded ethosomes. Indonesian J Pharm. 2016;27(1):44. doi: 10.14499/indonesianjpharm27iss1pp44.
Qiao BW, Liu XT, Wang CX, Song S, Ai CQ, Fu YH. Preparation characterization and antioxidant properties of phycocyanin complexes based on sodium alginate and lysozyme. Front Nutr. 2022 May 24;9:890942. doi: 10.3389/fnut.2022.890942, PMID 35685875.
Ahmed AA, Nath B. Formulation and in vitro evaluation of polyherbal anti-aging face cream of coriandrum sativum and rose hip oil. Int J Curr Pharm Sci. 2017 Apr;9(4):75. doi: 10.22159/ijcpr.2017v9i4.20961.
Sundari BT, Rao PS, Sireesha K, Sai YK. Formulation and evaluation of ethosomal gels of Mangifera indica leaf extract. Indo Am JP Sci. 2017;4(6):1755-61. doi: 10.5281/zenodo.823248.
Shreya S, Akshatha N, Reema N. Formulation and evaluation of sunscreen cream using deuterium senegalese oil as a base. Trop J Nat Prod Res. 2019;9(3):141-5. doi: 10.26538/tjnpr/v4i4.5.