
Int J App Pharm, Vol 17, Issue 1, 2025, 365-379Original Article
DESIGN AND CHARACTERIZATION OF GLIBENCLAMIDE-CAFFEIC ACID COCRYSTALS VIA CRYSTAL ENGINEERING
JYOTI MALIK1,2, HIMANSHU SACHDEVA1, ANURAG KHATKAR1, ARUN NANDA1*
1Department of Pharmaceutical Sciences, Maharshi Dayanand University, Rohtak (Haryana), India. 2School of Pharmaceutical Sciences, Apeejay Stya University, Sohna Gurugram, (Haryana), India
*Corresponding author: Arun Nanda; *Email: an_mdu@rediffmail.com
Received: 06 Jul 2024, Revised and Accepted: 04 Dec 2024
ABSTRACT
Objective: The present work aims to prepare and characterize glibenclamide cocrystals.
Methods: Glibenclamide was chosen as a model drug due to its low solubility and classification as a Biopharmaceutical Classification System (BCS) class II drug. Among the various methods for selecting appropriate coformers, the pKa and thermal methods were employed. Using these approaches, a formulation with caffeic acid, prepared through the solvent evaporation method, demonstrated the best results as evaluated by parameters such as dissolution rate, X-ray diffraction (XRD), Fourier Transform Infrared Spectroscopy (FTIR), Differential Scanning Calorimetry (DSC), Hot Stage Microscopy (HSM), Scanning Electron Microscopy (SEM).
Results: In the FTIR spectra, the sulfonamide group of the drug formed hydrogen bonds with the hydroxyl groups of the coformer, suggesting the presence of hydrogen bonding interactions between the components. HSM and DSC revealed that the melting point of the cocrystals occurred at a different temperature for the pure drug and coformer. This significant change in the melting point indicates the formation of a new crystalline phase in the cocrystals, suggesting that the drug and coformer interact at the molecular level to form a unique solid structure. XRD analysis showed diffraction peaks at distinct points with higher intensity in the cocrystals, indicating a new crystalline structure. SEM images of the cocrystals revealed a well-defined crystalline morphology, which differed from the irregular shapes of the pure drug and coformer. The cocrystals demonstrated a significantly improved dissolution rate compared to the pure drug and marketed formulation. In animal studies conducted on male Wistar rats, cocrystals reduced blood glucose levels more rapidly than pure glibenclamide. This enhanced antidiabetic efficacy suggests that the cocrystal formulation not only improves dissolution but also accelerates the therapeutic onset of action.
Conclusion: These findings confirmed that the glibenclamide cocrystals prepared with caffeic acid help effectively improve the drug’s low solubility.
Keywords: Cocrystals, Glibenclamide, Caffeic acid, Solubility, Co-former, Solvent evaporation method
© 2025 The Authors. Published by Innovare Academic Sciences Pvt Ltd. This is an open access article under the CC BY license (https://creativecommons.org/licenses/by/4.0/)
DOI: https://dx.doi.org/10.22159/ijap.2025v17i1.51992 Journal homepage: https://innovareacademics.in/journals/index.php/ijap
INTRODUCTION
After oral administration, the drug's solubility and dissolution rate are important factors in determining its rate and degree of absorption. This challenge poses a substantial hurdle for the pharmaceutical industry in developing and producing effective drugs [1]. Cocrystal technology has emerged as an innovative approach to enhance the solubility, dissolution rate, and bioavailability of Active Pharmaceutical Ingredients (APIs) while maintaining a stable crystalline form without modifying the API’s covalent bonds [2]. Cocrystals are crystalline complexes of active or neutral substances held together by non-covalent bonds, particularly hydrogen bonds, to create a defined crystalline lattice. The primary benefit of cocrystallization is that it preserves the essential medicinal properties of the active components while modifying certain physicochemical properties, such as melting point, solubility, and dissolution rate [3]. Cocrystal formation largely depends on two types of intermolecular interactions: heteromeric and homomeric combinations of components, with complementary functional groups, which likely explains the formation of supramolecular synthons in cocrystals.
The selection of coformers is crucial in determining the final properties of cocrystals. In cocrystal preparation, coformers can enhance the stability and solubility of the API by altering its crystal structure. Coformer selection relies on two primary methods: experimental and knowledge-based approaches. The experimental method is largely trial and error [4], involving crystallization of the API with selected coformers and verifying cocrystal formation through analytical techniques such as Differential Scanning Calorimetry (DSC) and Powder X-Ray Diffraction (PXRD). Consequently, this approach can be very time and resource-intensive. Alternatively, knowledge-based strategies like hydrogen bonding, pKa considerations, supramolecular synthons, and Hansen solubility parameters provide a more systemic approach to coformer selection [5]. Glibenclamide (GLB) as shown in fig. 1, is GLB an oral sulfonylurea antidiabetic medication commonly used to manage type-2 diabetes by controlling blood glucose levels [6]. However, GLB has limited water solubility and its oral bioavailability is low, around 40-45%. Additionally, GLB has a relatively short biological half-life of 3-5 h and undergoes extensive first-pass metabolism in the liver, resulting in metabolites with minimal hypoglycemic effects [7].
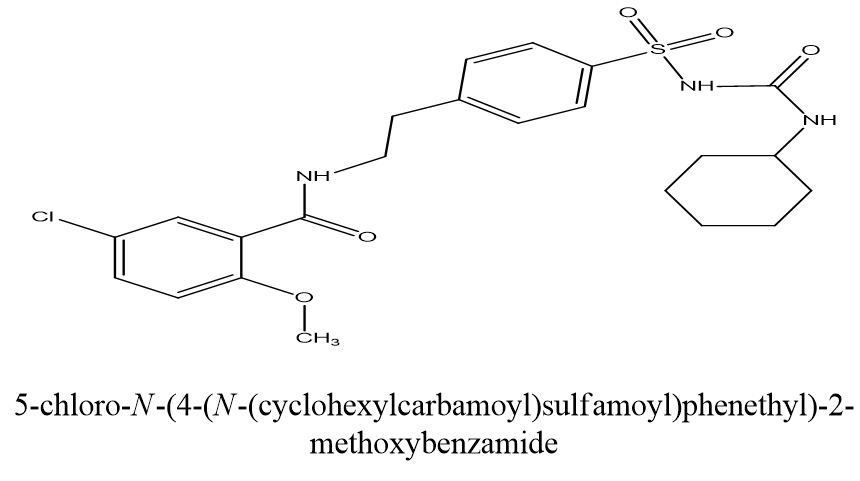
Fig. 1: Structure of glibenclamide (drawn in ChemDraw software)
Glibenclamide is classified as a BCS (Biopharmaceutical Classification System) class-II drug because of its high permeability but low solubility [8]. Enhancing its dissolution rate can therefore accelerate drug absorption [9]. Various methods, such as solid dispersion [10], nanoparticles [11], and nanoemulsion techniques [12], have been explored to improve GLB’s solubility. However, these approaches have not consistently yielded reliable results [6]. Co-crystallization provides several advantages over conventional methods for enhancing solubility, dissolution rate, and other physicochemical properties (such as flow rate and solubility) of poorly water-soluble drug while maintaining the therapeutic efficacy of the API. Cocrystals are multi-component solid crystalline complexes consisting of two or more molecules bound by non-covalent interactions within the same crystal lattice, typically in a defined stoichiometric ratio [13]. Various Glibenclamide cocrystals have been reported by researchers using different methods and co-formers. Oxalic acid was used in the solvent drop grinding method [9], while hippuric acid, nicotinic acid, theophylline, and succinic acid were utilized through solvent-assisted grinding [14]. Saccharin was employed using both solvent drop grinding [15] and solvent evaporation [16] methods. Aspartame was also incorporated using solvent evaporation [8], and tromethamine was prepared through slow solvent evaporation [17]. Ascorbic acid [18], as well as a combination of nicotinamide and sodium saccharin [19], was both used with evaporation technique. Additionally, nicotinamide alone was employed using solvent evaporation [20], oxalic acid through dry grinding [21], and malonic acid was prepared by solution crystallization [22]. These methods highlight the versatility in selecting co-formers and techniques to enhance the properties of glibenclamide through cocrystal formation. A coformer used in cocrystal development can include a polymer, amino acid, nutraceutical, another pharmaceutical compound, and more [23]. However, glibenclamide cocrystals prepared with caffeic acid have not been reported.
This study used the solvent evaporation method to prepare glibenclamide cocrystals with the selected coformer in 1:1 ratio. After identifying the appropriate coformer, the resulting cocrystals were characterized through Hot Stage Microscopy (HSM), Differential Scanning Calorimetry (DSC), Fourier Transform Infrared (FTIR) Spectroscopy, X-Ray Diffraction (XRD) analysis, and Scanning Electron Microscopy (SEM). Additionally, in vivo studies were conducted on male Wistar rats to evaluate the cocrystals efficacy.
MATERIALS AND METHODS
Material
A complimentary sample of glibenclamide (50 gm) was obtained from Sun Pharma Industry Pvt. Ltd., Gurugram, and Haryana. Various coformers and additional chemicals were sourced from CDH Pvt. Ltd., while solvents used in co-crystal preparation and sodium carbonate for the desiccator were purchased from Research Lab Pvt. Ltd.
Preparation of calibration curve in acidic and basic media
A 100 mg sample of glibenclamide was weighed and placed in a 100 ml volumetric flask with a small amount of methanol. After gently shaking to ensure dissolution, the solution was brought to 100 ml with methanol, yielding a stock solution (1 mg/ml), labeled as solution A. From this solution, 10 ml was transferred to another volumetric flask and diluted to 100 ml with methanol to create a 100 mcg/ml solution, designated as stock solution B. Using solution B, concentrations of 4, 8, 12, 16, 20, and 24 mcg/ml were prepared in triplicate by taking 2, 4, 6, 8, 10, and 12 ml, respectively, and diluting each to 50 ml with 0.5% Sodium Lauryl Sulfate (SLS) in 0.1 N Hydrochloric Acid (HCl). These solutions were then analyzed using Ultraviolet (UV)-Visible Spectrophotometry, measuring absorbance at 229 nm with methanolic 0.5% SLS in 0.1 N HCl as the blank. Each absorbance value represents the mean of three readings. The procedure was repeated to prepare dilutions in a phosphate buffer at pH 7.4.
Screening of coformers
Initial screening of suitable coformers was conducted using the pka technique and thermal methods such as DSC. Several potential coformers from the generally recognized as safe (GRAS) database were assessed, leading to the selection of an appropriate coformer for the development, characterization, and pharmaceutical evaluation of cocrystals. Coformers, including gallic acid, caffeic acid, ferulic acid, and syringic acid were screened using these methods.
Preparation of glibenclamide cocrystals
Glibenclamide cocrystals were prepared using the solvent evaporation technique with methanol as a solvent. Glibenclamide and coformer weighed in a 1:1 molar ratio [24], were added to a beaker with 100 ml of methanol and stirred continuously until fully dissolved.
The mixtures were then allowed to evaporate at room temperature. The resulting solids were collected, scraped, and placed in air-tight containers for further characterization.
Fourier transforms infrared spectrophotometer (FTIR)
FTIR spectroscopy was conducted using an FTIR Alpha Bruker 12060280 (Germany) spectrophotometer to investigate potential interactions among the components used. Initially, background scanning was performed. A small amount of the sample was then blended with IR-grade Potassium Bromide (KBr), and this mixture was placed in the sample cell. The FTIR spectrophotometer was employed to analyze the sample over a range of 400-4000 cm-1 at room temperature [24, 25]. Baseline correction was carried out following scanning, and the spectrum was smoothed twice to achieve clear peak values.
Differential scanning calorimetry (DSC)
DSC analysis was utilized to assess the thermochemical properties of cocrystals. The DSC thermogram for the samples was obtained using a Q-10 (TA Instruments Waters). Samples were placed in a sealed aluminum pan and heated from 0 to 300 °C at a rate of 10 °C per minute under a nitrogen atmosphere (20 ml/min) [25] with an empty pan used as the reference.
Hot stage microscopy (HSM)
Cocrystal analysis was conducted using the LINKAM DSE 600 model with LINK software, which enables the generation of microscopic data. Melting points of prepared cocrystals were measured using hot-stage microscopy. According to report data, the melting point of cocrystals should lie between or below the melting point of the drug and coformer [26].
Powder X-ray diffraction (PXRD)
Powder X-ray diffraction and single-crystal X-ray diffraction provide insights into structural details, levels of crystallinity, and crystal dimensions [27]. XRD analysis of samples was conducted using a Rigaku (MiniFlex) 600 model to assess crystallinity. Diffractograms were obtained with Cu Kα radiation at a tube voltage of 40 kV and a current of 40 mA. Data were collected continuously over a 10-70 C range at a scanning rate of 5 C/min. Sharper diffraction peaks indicated higher crystallinity, whereas broad peaks suggested an amorphous form.
The optimized cocrystal formulation was subjected to X-ray diffraction analysis.
Scanning electron microscopy (SEM)
SEM analysis of samples was performed using a JEOL 7610F Plus instrument to examine surface morphology. The scanning electron microscope operated at 10 kV while the sample was placed in the chamber, and images were captured at varying magnifications.
Dissolution analysis
The dissolution rate of pure drug (GLB), its physical mixture, and cocrystals were assessed using a USP type II (Paddle Type) dissolution apparatus (Lab India DS 8000) at 37 °C in 900 ml of 0.5% SLS in 0.1N HCl (pH 1.2) and phosphate buffer (pH 7.4) with a rotation speed of 75 rpm. Samples equivalent to 10 mg of glibenclamide were used. At set intervals, 10 ml samples of the dissolution medium were collected, filtered through a 0.45-micron filter, and analyzed for drug concentration at 229 nm using a UV spectrophotometer. For each withdrawal, 10 ml of fresh dissolution media (0.5% SLS in 0.1N HCl and phosphate buffer) were added to the flask to maintain the solvent consistency.
Animal study
For the pharmacodynamics study, male Wistar rats (150-200g) were purchased and housed in the central animal house of Maharshi Dayanand University, Rohtak (Haryana) for environmental adaptation. The animals were provided with regular pellet meals and unlimited water. The animal protocol was approved by the Institutional Animal Ethical Committee (IAEC) under approval no. CAH/2023/46-60. The animals were sourced from the “Disease-free small animal house, Hisar (Reg. No.-1669/GO/abc/12/CPCSEA [Committee for the purpose of control and supervision of experiments on animals])”
For the in vivo studies, three groups were formed, with five animals in each group (n = 5), fasting overnight before the experiment. To induce diabetes in the rats, a single dose of streptozotocin (45 mg/kg) with nicotinamide (50 mg/kg) in citrate buffer (0.1 M, pH 4.5) was administered intraperitoneally [28]. After 48 h of the injection, the rats were considered diabetic if their blood glucose levels were above 200 mg/dl. To assess the antidiabetic activity, glibenclamide (GLB) (5 mg/kg body weight) and its cocrystals were dissolved in 0.5% w/v sodium Carboxy Methyl Cellulose (CMC) and administered orally to the diabetic rats, and reductions in the blood glucose levels were measured at various time intervals.
Group 1: Diabetic control group administered with 0.5% w/v sodium CMC
Group 2: Diabetic standard group administered with glibenclamide dispersed in 0.5% w/v sodium CMC
Group 3: Diabetic test group administered with GLB-Caffeic Acid (CA) cocrystals dissolved in 0.5% w/v sodium CMC
The effect of cocrystals on blood glucose levels was measured using a glucometer and compared with the standard group and control group, which received the pure drug and vehicle, respectively.
No animals were anesthetized, rendered unconscious, or euthanized during the experiment. After completing the study, the animals were returned to the central animal house of Maharshi Dayanand University, Rohtak, Haryana (India).
Statistical analysis
Blood glucose levels were measured at 30 min, 1 h, 4 h, 8 h, and 24 h post-treatment using a standard glucometer on blood samples collected from tail veins. For each time point, blood glucose levels were expressed as Mean±SEM. Data were analyzed using one-way Analysis Of Variance (ANOVA) followed by Tukey's post-hoc test to compare differences between groups at each time point. A p-value of<0.05 was considered statistically significant.
RESULTS AND DISCUSSION
Preparation of calibration curve in acidic and basic media
The calibration curve of glibenclamide in 0.5% SLS in 0.1 N HCl and phosphate buffer showed good linearity with regression coefficient value 0.994 and 0.998, respectively, confirming that it follows the Beer-Lambert’s law [29] as seen in fig. 2 and fig. 3.
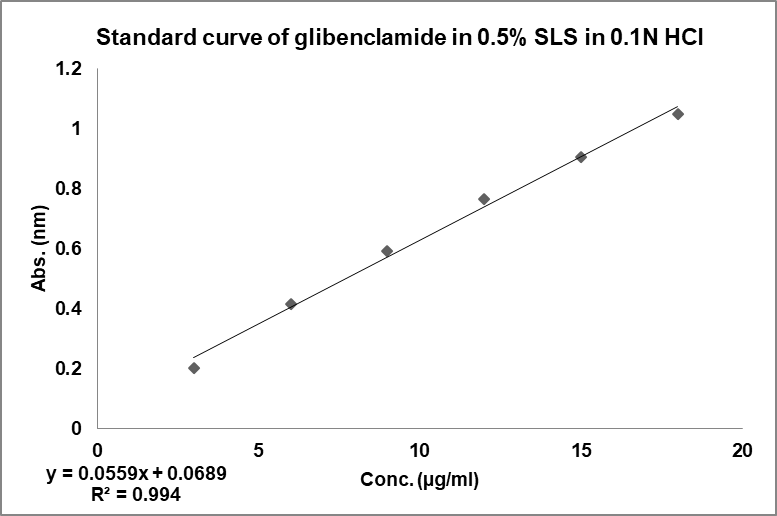
Fig. 2: Calibration curve of GLB in acidic media
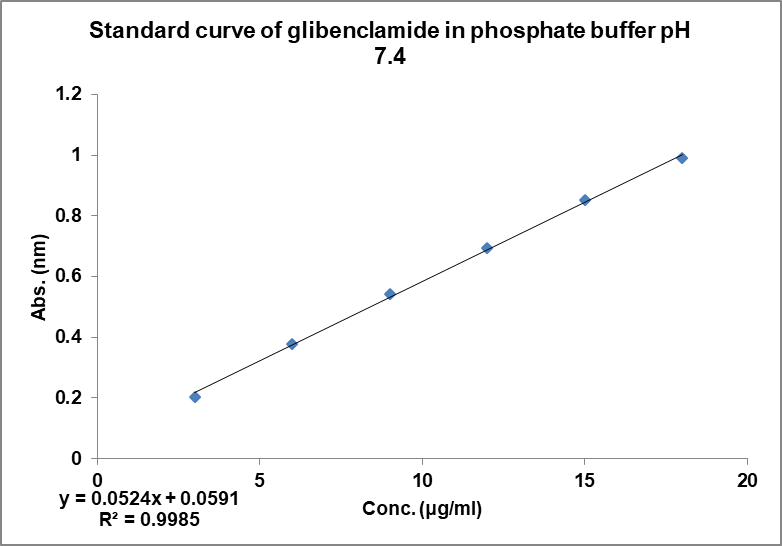
Fig. 3: Calibration curve of GLB in basic media
Screening of coformers
Δpka method
Δpka is an effective and straightforward method of determining whether the formed solid material is a salt or cocrystals. Δpka is calculated by subtracting the pka value of the acid from the pka value of the base. Using the Δpka method, a value between 0 and 1 indicates the formation of cocrystals, while a value between 2 and 3 suggests salt formation [27, 30]. The pka values of the drug and coformers, along with their calculated Δpka values, are shown in table 2.
Table 2: Calculated Δpka value of some selected coformers
| Coformer | Pka of glibenclamide | Pka of coformer | Δpka |
| Gallic acid | 5.3 | 4.4 | 0.9 |
| Caffeic acid | 5.3 | 4.5 | 0.8 |
| Syringic acid | 5.3 | 4.3 | 1 |
| Ferulic acid | 5.3 | 4.6 | 0.7 |
These values demonstrate that each coformer falls within the Δpka range indicative of cocrystal formation (0-1).
Thermal method
DSC analysis is used to screen potential coformers. In this method, a binary mixture of the drug and coformer is heated, and if the binary mixture has the potential to form cocrystals, no peaks near the melting points of the drug and coformer will be observed. Thus, DSC analysis is a useful technique for selecting a suitable coformer, for cocrystal preparation [31]. DSC thermograms of the drug with various coformers are shown in fig. 4. In the binary mixture of the drug (glibenclamide) with different coformers; glibenclamide showed an endothermic peak at 177.08 °C and 222.04 °C with syringic acid (SA) in fig. 4(a); at 129.63 °C and 160.52 °C with gallic acid (GA) in fig. 4(b); at 168.79 °C and 244.27 °C with ferulic acid (FA) in fig. 4(c), at 157.18 °C and 235.39 °C with caffeic acid (CA) in fig. 4(d). Based on the DSC thermogram, it was concluded that the binary mixture with caffeic acid showed a sharp peak compared to those prepared with other coformers, which indicates that the binary mixture with caffeic acid had the potential to form cocrystals.
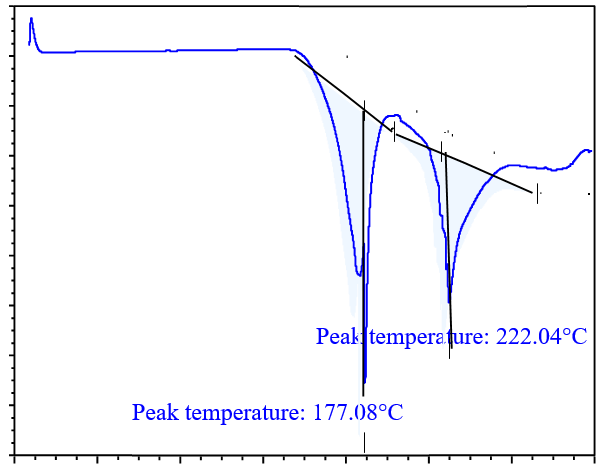
Fig. 4(a): DSC analysis of drug with SA
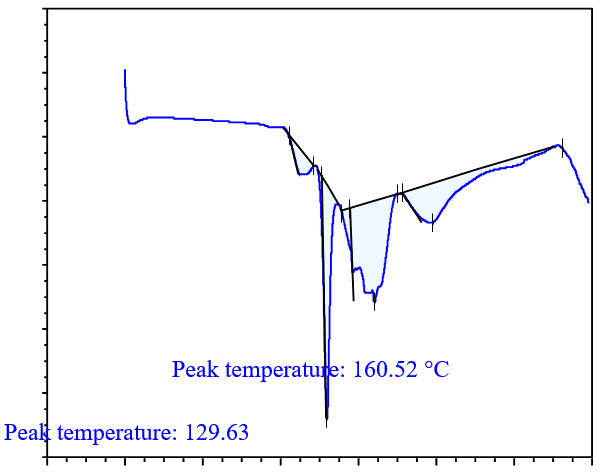
Fig. 4(b): DSC analysis of drug with GA
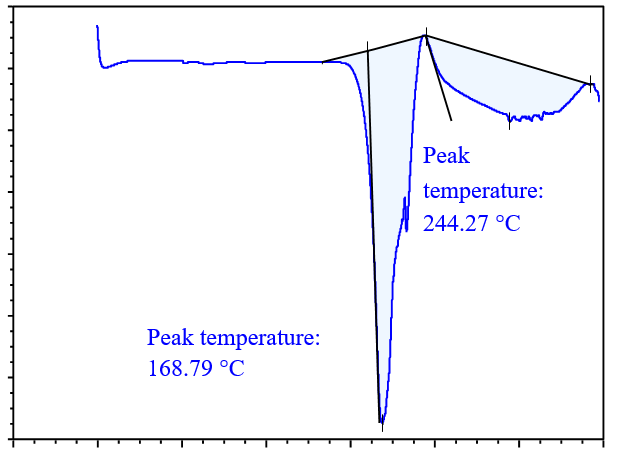
Fig. 4(c): DSC analysis of drug with FA
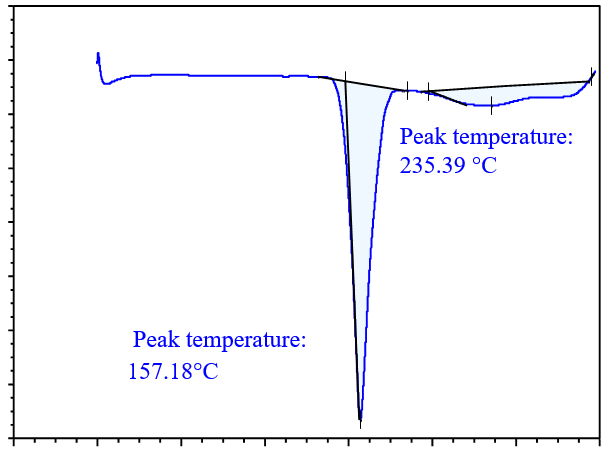
Fig. 4(d): DSC analysis of drug with CA
Fourier transform infrared spectrophotometer (FTIR)
FTIR is an important technique for the evaluation of cocrystals [2]. FTIR spectra of GLB, coformer, physical mixture, and cocrystals were analyzed. All characteristic peaks in the FTIR spectra of the cocrystals were compared with those of the drug and coformer. The peaks observed during FTIR analysis indicated that some interaction occurred between the drug and coformer during cocrystal preparation [32]. Upon comparison, a noticeable change was observed in the S=O stretch of the drug and the O=H stretch of the coformer in the cocrystals.
In FTIR analysis, a spectrum was observed in the regions of 400-4000 cm-1, as shown in fig. 5. The characteristics peaks of the functional groups in glibenclamide were observed at 1341 cm-1and 1157 cm-1for S=O stretch, 1714 cm-1 for C=O stretch, 1616 cm-1 for C=C stretch, 3366 cm-1 and 3314 cm-1 for N-H stretch, 2929 cm-1 and 2849 cm-1 for C-H stretch and 3117 cm-1 for O-H stretch [32]. The characteristic peaks of the functional group present in caffeic acid were observed at 3417 cm-1 for the O-H stretch, 1645 cm-1 for the C=O stretch, and 1448 cm-1 for the C-C stretch.
The characteristics peaks at 1157 cm-1 in GLB and 3417 cm-1 in caffeic acid were observed to shift to 1145 cm-1 and 3425 cm-1 respectively, in the cocrystals of GLB with caffeic acid prepared by solvent evaporation method in 1:1 ratio. Filho et al. (2018) confirmed that the sulfonyl group of glibenclamide forms hydrogen bonds with coformer [17]. The peaks of the cocrystal changed slightly and broadened, indicating the formation of a cocrystal. The cocrystal spectra showed numerous additional peaks, supporting the cocrystal development. Similar changes in the infrared spectra of other medications, such as hydrochlorothiazide, have been documented and interpreted as signs of cocrystal formation. Therefore, modifications observed in this study may indicate that the medication and coformers are beginning to form a cocrystals [1, 33].
Some peaks were also shifted in the physical mixture of the drug and coformer for example, the 3417 cm-1 of the coformer and 1716 cm-1 of the drug shifted to 3446 cm-1 and 1700 cm-1, respectively. The intensity of these peaks was lower than that of the drug and coformer.
Differential scanning calorimetry (DSC)
DSC analysis was also carried out for GLB, caffeic acid, the physical mixture, and the cocrystals, as shown in fig. 6. The drug (GLB) and coformer (caffeic acid) showed sharp peaks a 166.73 °C and 218.47 °C, respectively. The Physical Mixture (PM) exhibited an endothermic peak at 162.889 °C, while the cocrystals had a sharp endothermic peak at 157.18 °C, which was lower than those observed in GLB and the coformer [16]. The peaks observed in the physical mixture were not very sharp and resembled those of the cocrystals. This could occur as a result of minimal or partial contact between the coformer and API in the physical mixture [34]. As a result, a peak of lower intensity in the physical mixture might have formed close to that of the cocrystals. During the analysis, the sharp peak observed in the DSC confirmed the formation of cocrystals.
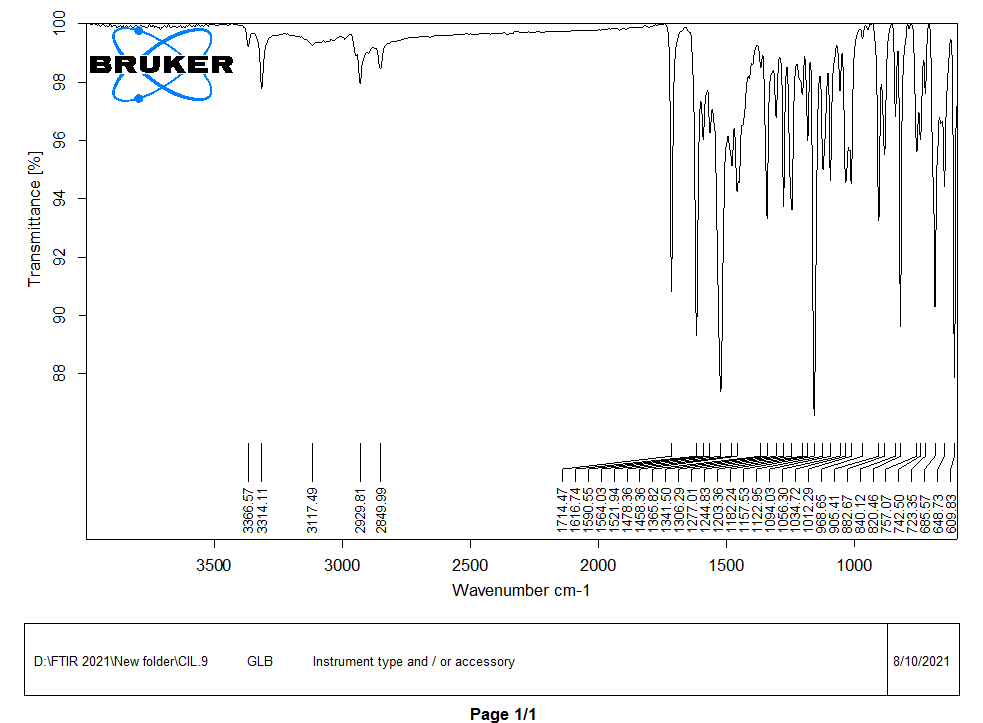
Fig. 5(a): FTIR spectra of drug (GLB)
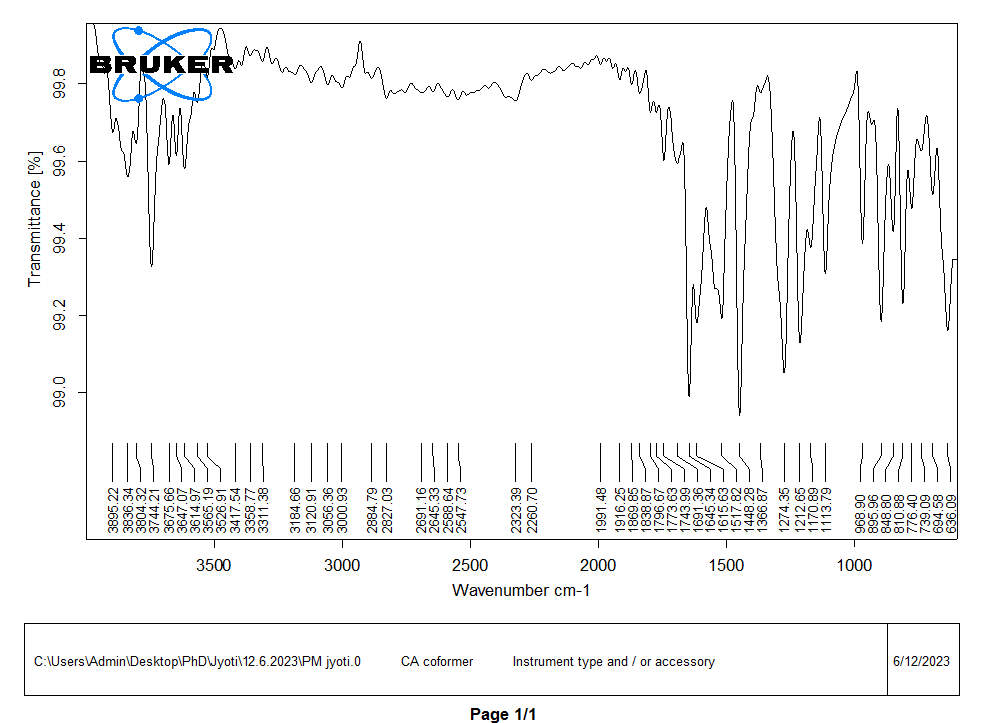
Fig. 5(b): FTIR spectra of coformer (CA)

Fig. 5(c): FTIR spectra of physical mixture
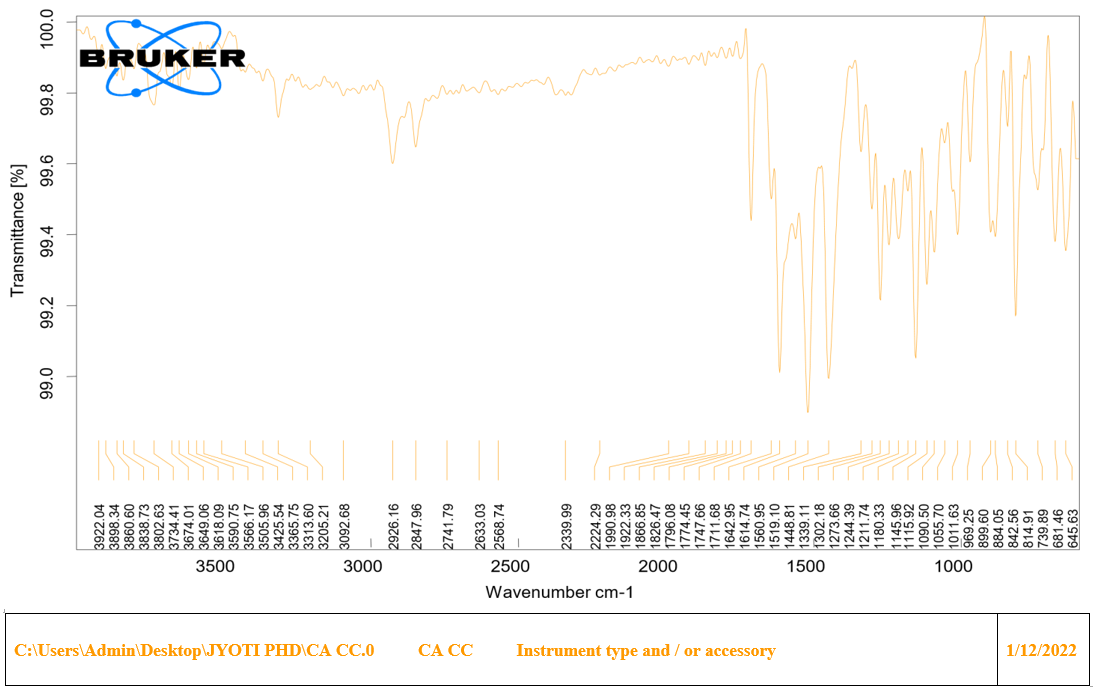
Fig. 5(d): FTIR spectra of cocrystals (GLB-CA)
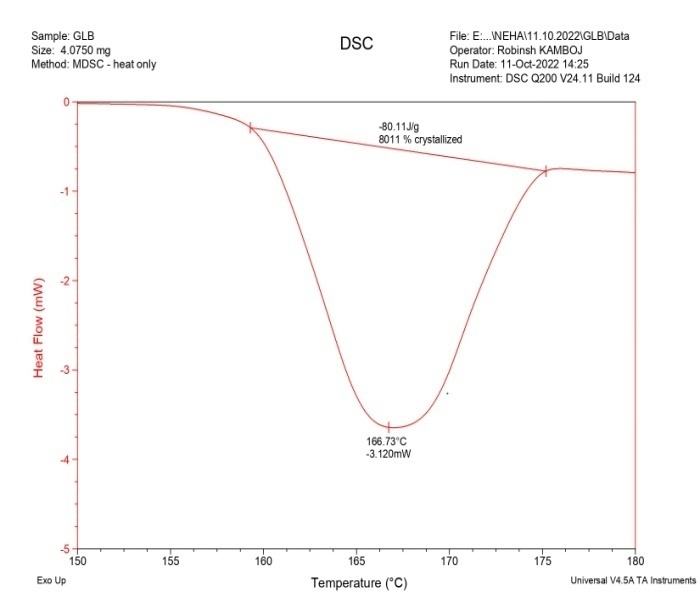
Fig. 6(a): DSC thermgram of GLB
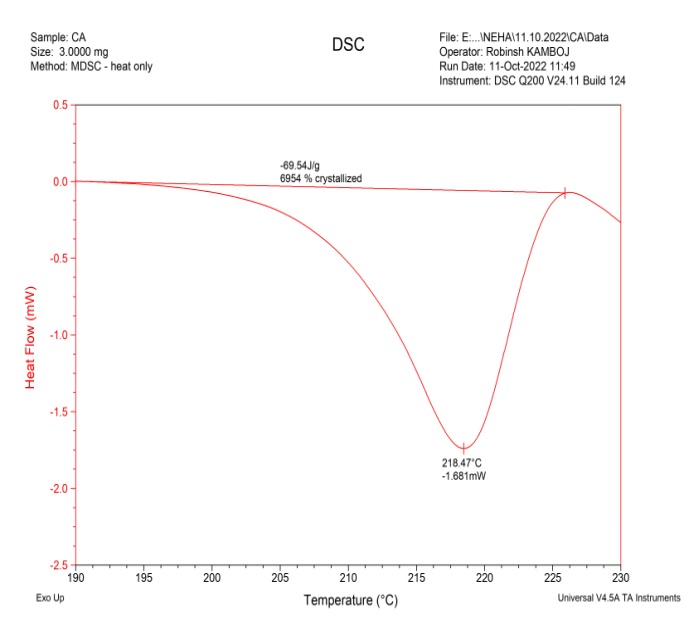
Fig. 6(b): DSC thermogram of coformer (CA)
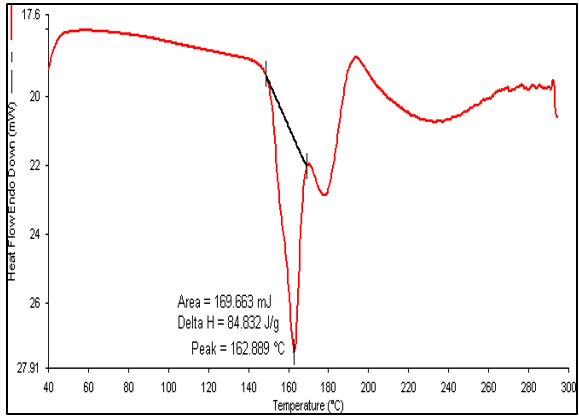
Fig. 6(c): DSC thermogram of PM
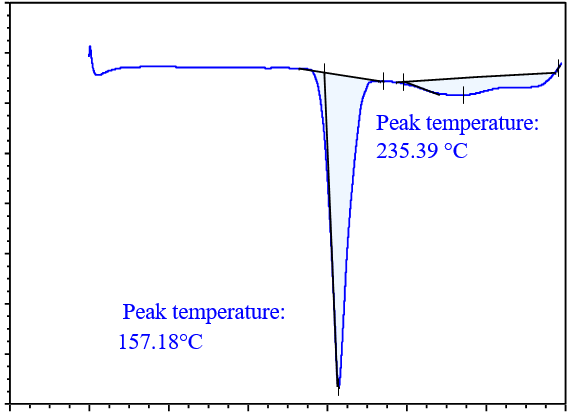
Fig. 6(d): DSC thermogram of cocrystal
Hot stage microscopy
HSM is a practical screening method that frequently examines variations in sample temperature. In this technique, the API and prospective coformer are placed on a glass slide and heated until they melt. The coverslip of the glass slide aids in blending the two melts. At the intersection of the two melts, a molecular complex develops, which can be observed under a microscope [2]. Fig. 7 shows the images of GLB and caffeic acid cocrystals produced by the solvent evaporation method. The cocrystals of GLB prepared with caffeic acid exhibit a complete melting point at 175 C, which differs from the melting points of pure forms of the drug (GLB) and coformer (caffeic acid), indicating that some interaction has occurred. HSM demonstrates the potential for glibenclamide and caffeic acid to interact and form cocrystals.
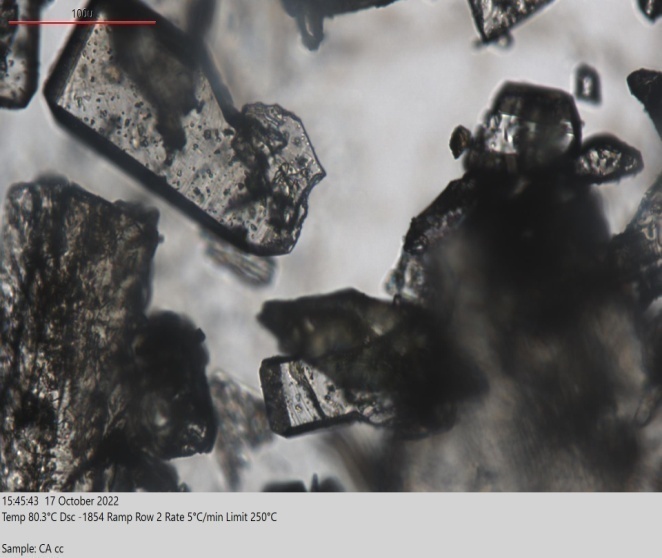
Fig. 7(a): Melting of cocrystals at 80 C (100M)
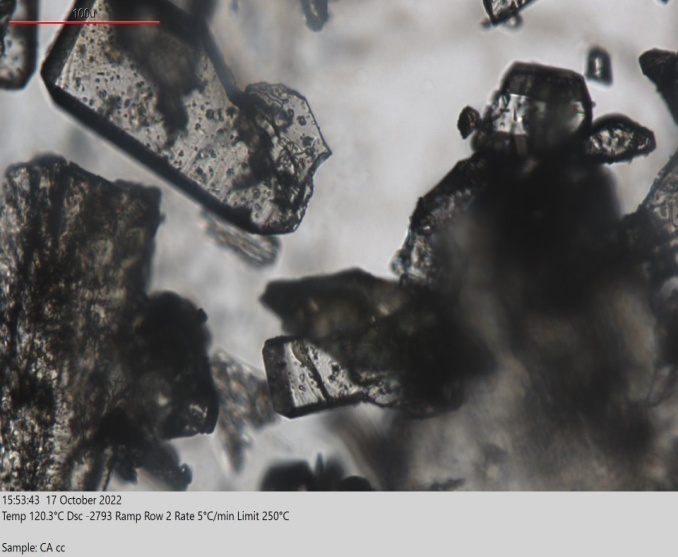
Fig. 7(b): Melting of cocrystals at 120 C (1OOM)
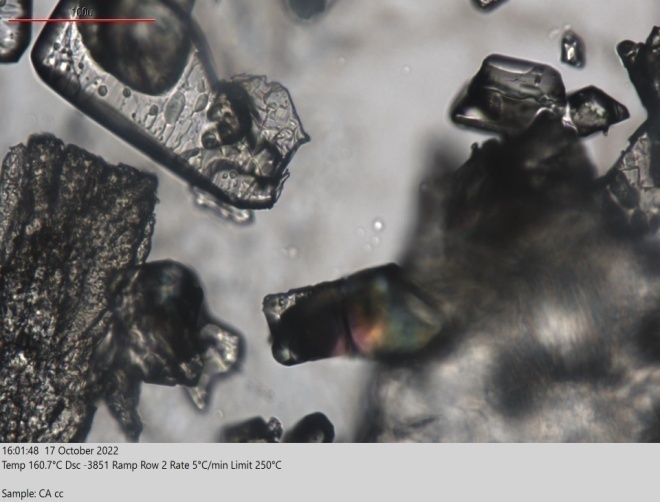
Fig. 7(c): Melting of cocrystals at 160 C (100M)

Fig. 7(d): Melting of cocrystals at 175 C (100M)
X-ray diffraction (XRD)
Crystallographic analysis was performed using the XRD analytical process to define the crystalline nature of the glibenclamide-caffeic acid cocrystals. The XRD analysis of the synthesized GLB-CA cocrystals showed prominent peaks at various 2Ɵ values, indicating the crystalline nature of the particles. The respective peaks of glibenclamide were found at 2Ɵ values of 11.6, 18.86, 20.9, 23.1 [35]. These observed peaks of glibenclamide confirm the crystalline nature of the drug. In the coformer, diffraction peaks were found at 2Ɵ values 9.36, 12.84, 16.52, and 17.18, which confirm the crystalline nature of the coformer. In XRD analysis of the cocrystals, new peaks were observed, or existing peaks were shifted to different positions. The XRD pattern of the cocrystals showed peaks at 2Ɵ values of 15.96, 30.4, and 30.38. The observed peaks of the drug and coformer were absent in the cocrystals. Additionally, the intensity of the observed peaks in the XRD pattern of the cocrystals was higher compared to the peaks observed for the drug and coformer [31]. This suggests the preparation of a new compound with a crystalline nature. Fig. 8 shows the XRD patterns of the drug (GLB), coformer (CA), and cocrystals.
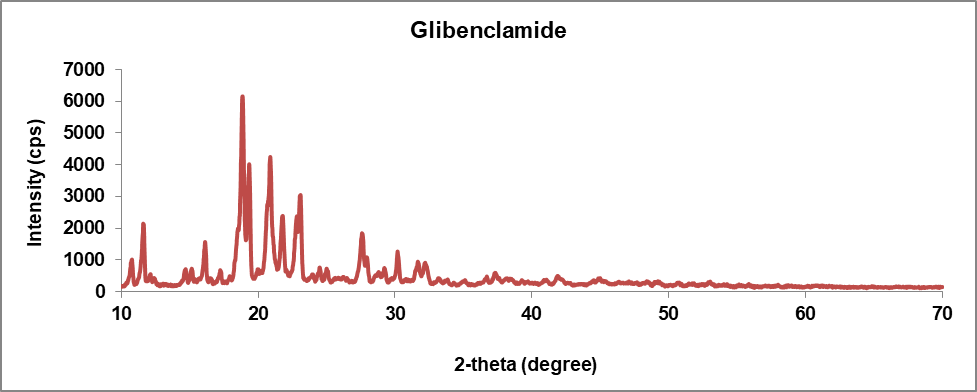
Fig. 8(a): XRD pattern of drug (Glibenclamide)
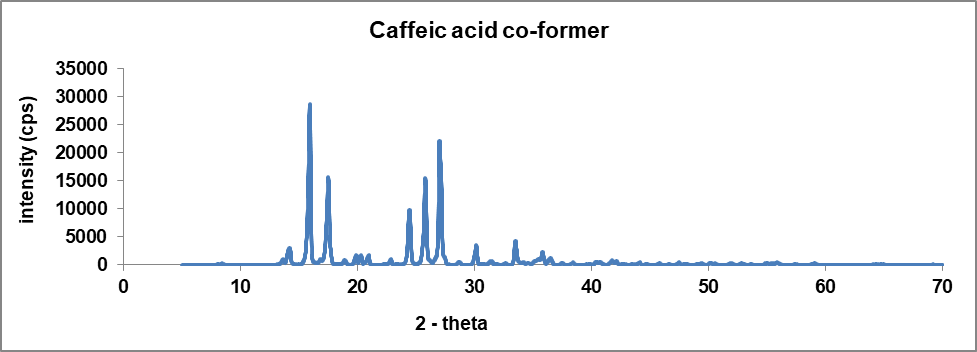
Fig. 8(b): XRD pattern of coformer (caffeic acid)
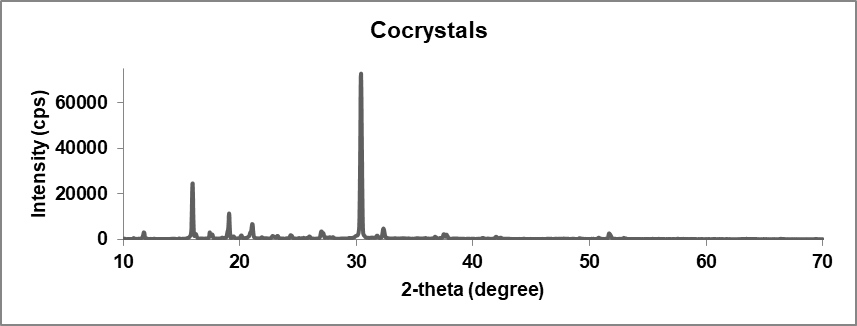
Fig. 8(c): XRD pattern of cocrystals
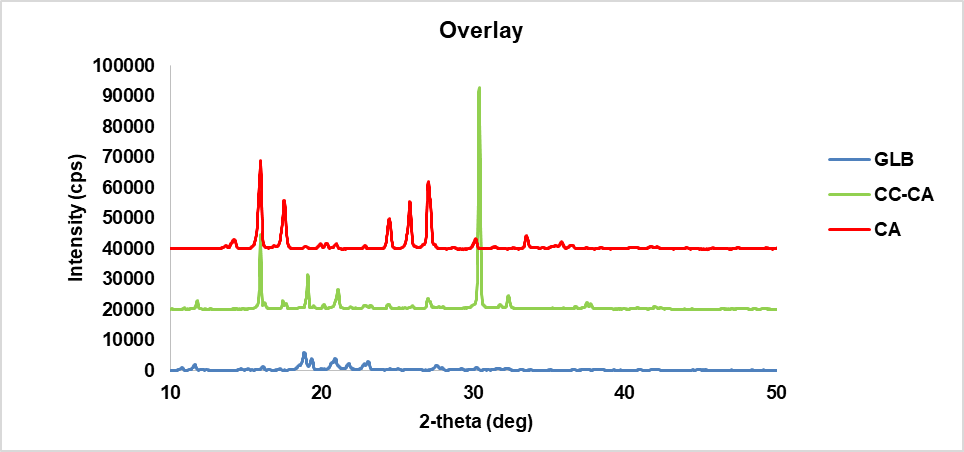
Fig. 8(d): XRD overlay graph of drug, coformer, and cocrystal
Scanning electron microscopy (SEM)
SEM analysis helps to determine the surface morphology of the final formulation. The images obtained during scanning electron microscopy of glibenclamide cocrystals prepared with caffeic acid exhibit a crystal-shaped geometry [36]. In HSM, glibenclamide cocrystals also appeared crystalline. These results confirm that the final formulation is also crystalline. Fig. 9 shows the SEM images of GLB-CA cocrystals at different magnifications.
Dissolution studies
In vitro dissolution studies were conducted using 0.1N HCl (pH 1.2) and Phosphate Buffer (PBS) (pH 7.4) at 37±0.5 C in a USP type II apparatus. The release profile was evaluated for glibenclamide alone, a marketed formulation, a physical mixture, and cocrystals in both media. The dissolution profiles were determined at 10, 20, 30, 45, and 60 min in the dissolution media. The percentage of Cumulative Drug Release (% CDR) at different time intervals is shown in fig. 10 and 11. The % CDR values indicate that the dissolution profile of the cocrystals increased as compared to the pure drug, marketed formulation, and physical mixture in both acidic and basic media. The increased dissolution rate of the drug from the cocrystals is believed to be due to the coformer’s presence, which alters the solvation and lattice energies [37]. Cocrystals have a crystalline nature and weak hydrogen bonds formed between the functional groups of the drug and coformer are also a reason for the improved dissolution profile of the cocrystals.
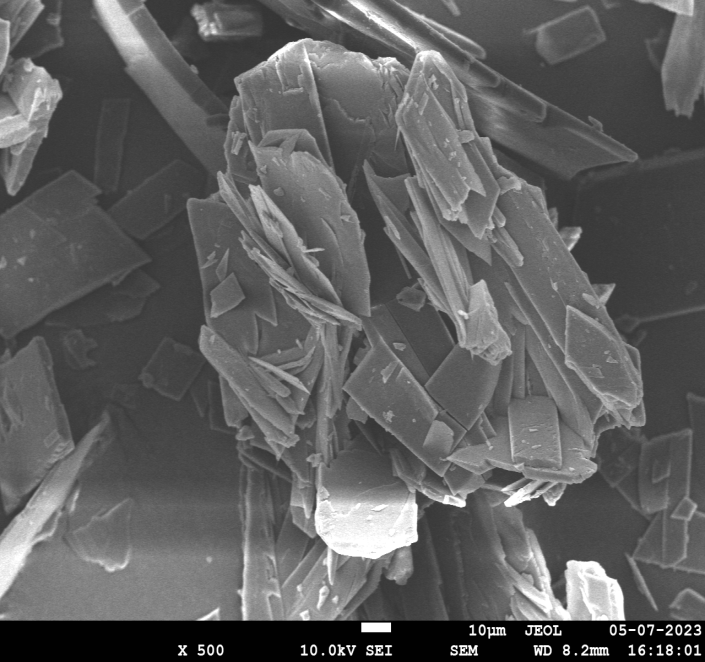
Fig. 9(a): SEM image at 500 magnification
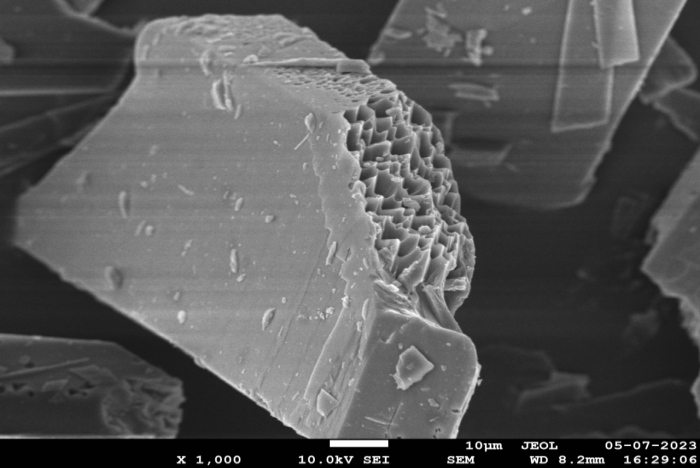
Fig. 9(b): SEM image at 1000 magnification
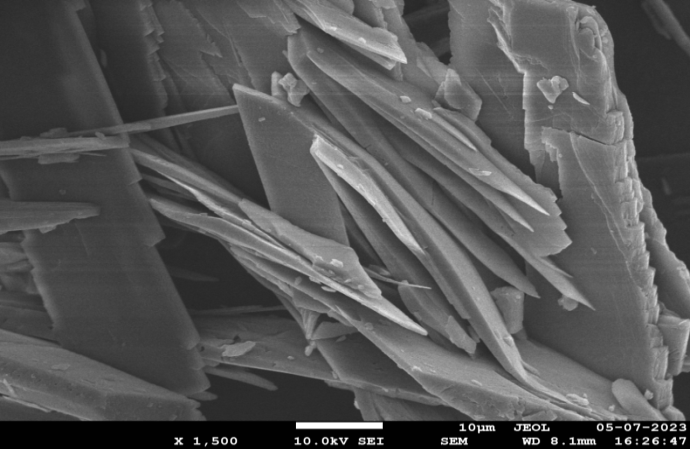
Fig. 9(c): SEM image at 1500 magnification
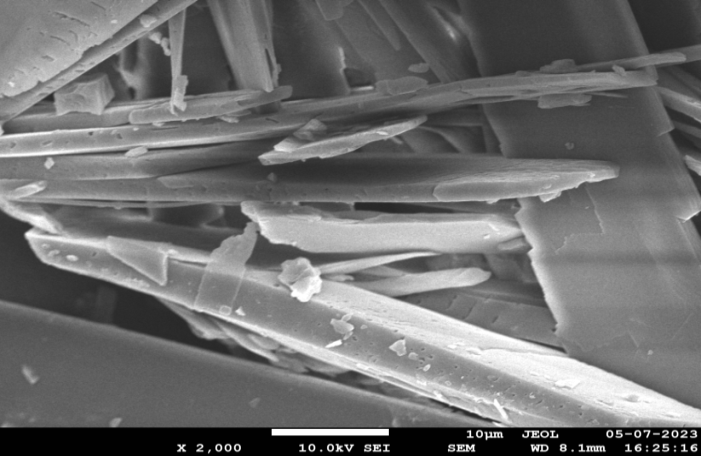
Fig. 9(d): SEM image at 2000 magnification
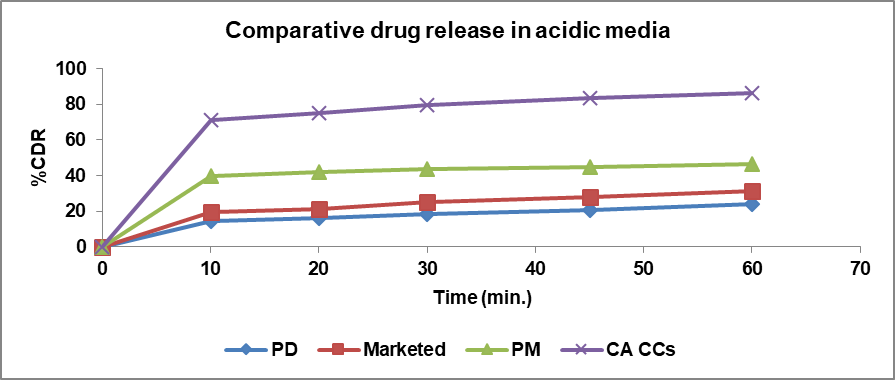
Fig. 10: %CDR of pure drug (PD), marketed, PM and cocrystals (CCs) in 0.5 %SLS in 0.1 N HCl
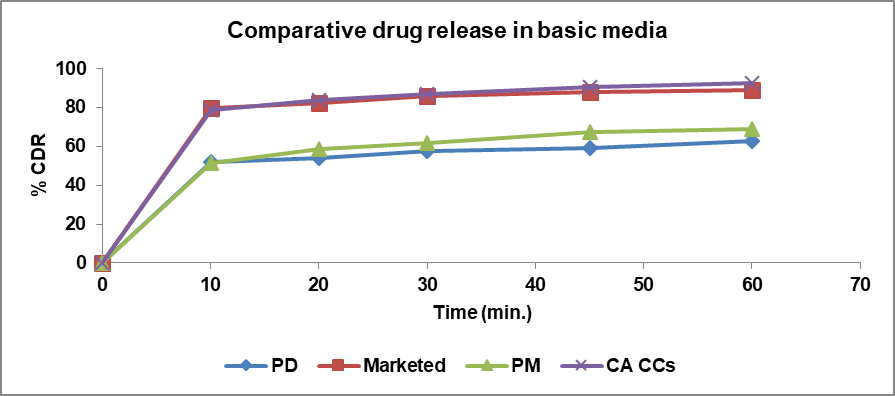
Fig. 11: % CDR of pure drug, marketed, PM and cocrystals in phosphate buffer pH 7.4
Table 3: Comparison of dissolution profile using f1 and f2 factors
| Dissolution profile comparison | F1 factor (difference factor) | F2 factor (similarity factor) | Comments |
| Pure drug vs. cocrystals (in HCl) | 77 | 11 | Cocrystals show better dissolution profile in acidic media. |
| Physical mixture vs. cocrystals (in HCl) | 46 | 22 | Dissolution profile of cocrystals in acidic media is better than that of physical mixture. |
| Marketed vs. cocrystals (in HCl) | 69 | 13 | Cocrystals show better dissolution in acidic media than marketed formulation. |
| Pure drug vs. cocrystals (in PBS) | 34 | 27 | In alkaline media, pure drug has good solubility. Therefore, no advantage of solubility is apparent. |
| Physical mixture vs. cocrystals (in PBS) | 29 | 30 | Dissolution profile of cocrystals in alkaline media is better than that of physical mixture. |
| Marketed vs. cocrystals (in PBS) | 2 | 82 | It is significant that cocrystals have better solubility than marketed formulation in acidic media, while cocrystals and marketed formulation have similar profile in alkaline media. |
Comparison of dissolution profile using statistical method
Determination of the dissolution profile using f1 and f2 factors is most suitable for differentiation dissolution profiles when three or more dissolution time points are present. F1 is the average difference in percent dissolved between the reference and test formulations at various time intervals. F2 depends on the comparison of the closeness of the test formulation to the comparative formulation. The f1 difference factor should be in the range of 0-15, while the f2 similarity factor should be between 50 and 100. The f1 and f2 factors were applied to the dissolution profiles of the pure drug and cocrystals, the physical mixture and cocrystals, and the marketed formulation and cocrystals in both acidic and basic dissolution media [38]. Based on the results obtained using the f1 and f2 factors, the cocrystals showed greater differences and less similarity with the pure drug, physical mixture, and marketed formulation. A comparison of the dissolution profiles using the f1 and f2 factors is discussed in table 3.
Animal study
To determine the antidiabetic effect of the pure drug (GLB) and its cocrystals, blood glucose levels were measured at different time intervals (30 min., 1 h, 4 h, 8 h, and 24 h) after the oral administration of a solution of the drug and cocrystals solutions in diabetic rats. Group 1 served as the diabetic control group, where diabetes was induced through streptozotocin injection. The animals were left untreated with any antidiabetic agent and received only the vehicle during the experiment. Animals in Group 1 did not show any significant reduction in blood glucose levels when compared to the groups treated with antidiabetic drugs (Group 2 and Group 3) at any of the time intervals. The maximum reduction in blood glucose levels was observed in group 3 (treated with cocrystals) compared to group 2 (treated with pure drug). In the cocrystals, the maximum reduction in blood glucose levels was observed within 4-8 h [39]. Group 2, treated with pure drug, also showed a reduction in blood glucose levels, but to a lesser extent compared to group 3, which was treated with cocrystals loaded with the drug. Blood glucose levels significantly decreased in all treatment groups compared to the control group at all time points (p<0.05). The maximum reduction in blood glucose was observed in the GLB-CA group, with the most pronounced effect noted at the 24 h time point.
Blood glucose levels at various time points
30 min: Control: 395.9±10.06, GLB: 357.8±12.15, GLB-CA: 334.8±12.26
1 h: Control: 375.2±10.02, GLB: 334.4±8.07, GLB-CA: 320.2±8.65
4 h: Control: 278.2±11.22, GLB: 263±14.65, GLB-CA: 131.6±11.29
8 h: Control: 238.4±8.57, GLB: 218±9.24, GLB-CA: 117.8±8.43
24 h: Control: 174.2±14.01, GLB: 134.8±5.35, GLB-CA: 105.5±5.91
The results suggest that GLB-CA provides superior efficacy in lowering blood glucose levels over time compared to GLB alone, with the most significant effect observed at the 24 h time point. Fig. 12 shows a comparative reduction in blood glucose levels at various time intervals in different groups.
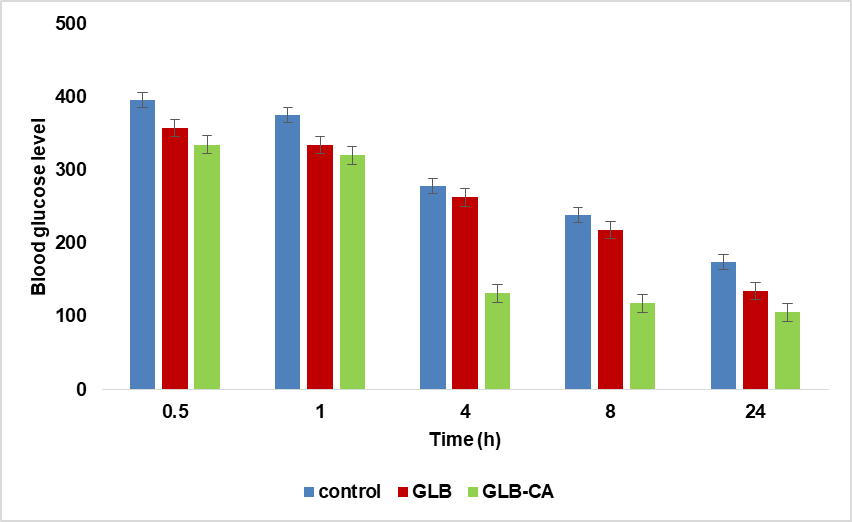
Fig. 12: Comparative glucose reduction in different groups (Data are expressed as mean±SD, n=5)
CONCLUSION
New cocrystals of glibenclamide and caffeic acid were prepared using the solvent evaporation method and evaluated by various analytical techniques. With the help of the pka method, coformers with a Δpka value between 0 and 1 were selected. In the FTIR spectra, the peak shifts of S=O in the drug and OH in the coformer indicated the formation of hydrogen bonds. In DSC and HSM, the melting point of the cocrystals was observed at a different point compared to the melting points of the drug and coformer, indicating that a new solid phase has been produced. XRD results showed that the intensity of the observed peaks is high, indicating that a new crystalline phase (different from the pure drug or coformer) has formed. SEM analysis confirmed the crystalline morphology of the glibenclamide cocrystals. The dissolution profile of the formulation showed an improved dissolution rate compared to the drug and marketed formulation in both acidic and basic media, suggesting that the cocrystals could overcome the problem of poor solubility. In vivo studies also confirmed that the prepared formulation showed better results in the reduction of blood glucose levels compared to the pure drug at different time intervals. The results obtained from various characterization techniques indicate that the formulation prepared by the cocrystallization technique helps to improve the dissolution rate of the glibenclamide drug.
ETHICS APPROVAL
The animal protocol was accepted by the Institutional Animal Ethical Committee (IAEC) under approval no CAH/2023/46-60. Our study complies with the guidelines of CPCSEA (Committee for the Purpose of Control and Supervision of Experiments on Animals). It is an Indian government-authorized institute providing guidelines for animals.
ACKNOWLEDGEMENT
The authors are thankful to the Department of Pharmaceutical Sciences, Maharshi Dayanand University, Rohtak, Haryana (India) for providing research support as part of Ph. D program
FUNDING
Nil
AUTHORS CONTRIBUTIONS
JM: writing, review, methodology, preparation of formulation, characterization, and analysis of data. HS: experimental animal studies and analysis of animal data. AK: review, editing, data analysis and supervision. AN: review, editing, data analysis, and supervision. All authors carefully read, reviewed and authorized the final manuscript.
CONFLICT OF INTERESTS
Declare none
REFERENCES
Panzade P, Shendarkar G, Shaikh S, Balmukund Rathi PB. Pharmaceutical cocrystal of piroxicam: design formulation and evaluation. Adv Pharm Bull. 2017;7(3):399-408. doi: 10.15171/apb.2017.048, PMID 29071222.
Nanda A. Co-crystals of ezetimibe: design formulation and evaluation. JMPAS. 2022;11(4):5172-83. doi: 10.55522/jmpas.V11I4.4016.
Nicolov M, Ghiulai RM, Voicu M, Mioc M, Duse AO, Roman R. Cocrystal formation of betulinic acid and ascorbic acid: synthesis physico-chemical assessment antioxidant and antiproliferative activity. Front Chem. 2019;7:92. doi: 10.3389/fchem.2019.00092, PMID 30847340.
Budiman A, Megantara S, Saraswati P. Synthesize glibenclamide ascorbic acid cocrystal using solvent evaporation method to increase solubility and dissolution rate of glibenclamide. Res J Pharm Technol. 2019;12(12):5805-10. doi: 10.5958/0974-360X.2019.01005.9.
Koranne S, Krzyzaniak JF, Luthra S, Arora KK, Suryanarayanan R. Role of coformer and excipient properties on the solid-state stability of theophylline cocrystals. Cryst Growth Des. 2019;19(2):868-75. doi: 10.1021/acs.cgd.8b01430.
Singh M, Barua H, Jyothi VG, Dhondale MR, Nambiar AG, Agrawal AK. Cocrystals by design: a rational coformer selection approach for tackling the API problems. Pharmaceutics. 2023;15(4):1161. doi: 10.3390/pharmaceutics15041161, PMID 37111646.
Raghavendra HL, Kumar GP. Development and evaluation of polymer-bound glibenclamide oral thin film. J Bioequivalence Bioavailab. 2017;9(1):324-30.
Budiman A, Megantara S, Apriliani A. Solid dosage form development of glibenclamide aspartame cocrystal using the solvent evaporation method to increase the solubility of glibenclamide. Int J App Pharm. 2019;11(3):150-4. doi: 10.22159/ijap.2019v11i3.32121.
Budiman A, Nurlatifah E, Amin S. Enhancement of solubility and dissolution rate of glibenclamide by cocrystal approach with solvent drop grinding method. Int J Curr Pharm Rev Res. 2016;7(5):248-50.
Kumar R, Singh A, Salwan R, Bhanot R, Rahar S, Dhawan RK. An informative review on solid dispersion. GSC Biol Pharm Sci. 2023;22(1):114-21. doi: 10.30574/gscbps.2023.22.1.0498.
Joudeh N, Linke D. Nanoparticle classification physiocochemical properties characterization and applications: a comprehensive review for biologists. J Nanobiotechnol. 2022;20(262):1-29.
Nemade SM, Kakad SP, Kshirsagar SJ, Padole TR. Development of nanoemulsion of antiviral drug for brain targeting in the treatment of neuro AIDS. Beni Suef Univ J Basic Appl Sci. 2022;11(1):1-10. doi: 10.1186/s43088-022-00319-8.
Eesam S, Bhandaru JS, Akkinepally RR, Bobbala RK. Cocrystallization of gliclazide with improved physicochemical properties. Futur J Pharm Sci. 2021;7(1):1-13. doi: 10.1186/s43094-021-00261-z.
Batisai E. Solubility enhancement of antidiabetic drugs using a co-crystallization approach. Chemistry Open. 2021;10(12):1260-8. doi: 10.1002/open.202100246, PMID 34921592.
Budiman A, Husni P, Shafira ATQ, Alfauziah TQ. The development of glibenclamide saccharin cocrystal tablet formulations to increase the dissolution rate of the drug. Int J App Pharm. 2019;11(4):359-64. doi: 10.22159/ijap.2019v11i4.33802.
Budiman A, Megantara S, Raraswati P, Qoriah TA. Solid dosage form development of glibenclamide with increasing the solubility and dissolution rate using co-crystallization. Int J App Pharm. 2018;10(6):181-6. doi: 10.22159/ijap.2018v10i6.29257.
Silva Filho SF, Pereira AC, Sarraguca JM, Sarraguca MC, Lopes J, Facanha Filho PF. Synthesis of a glibenclamide cocrystal: full spectroscopic and thermal characterization. J Pharm Sci. 2018;107(6):1597-604. doi: 10.1016/j.xphs.2018.01.029, PMID 29432762.
Budiman A, Megantara S, Saraswati P. Synthesize glibenclamide ascorbic acid cocrystal using solvent evaporation method to increase solubility and dissolution rate of glibenclamide. Res J Pharm Technol. 2019;12(12):5805-10. doi: 10.5958/0974-360X.2019.01005.9.
Ambekar AW, Chavan R, Sabale AS. Development and evaluation of nicotinamide and saccharin glibenclamide cocrystal mouth dissolving tablet. J Emerg Technol Innov Res. 2021;8(2):456-64.
Budiman A, Apriliani A, Qoriah TQ, Megantara S. Glibenclamide nicotinamide cocrystals synthesized by the solvent evaporation method to enhance solubility and dissolution rate of glibenclamide. Int J Drug Deliv Technol. 2019;9(1):21-6. doi: 10.25258/ijddt.9.1.4.
Budiman A, Megantara S, Apriliani A. Virtual screening of coformers and solubility test for glibenclamide cocrystallization. Natl J Physiol Pharm Pharmacol. 2017;8(1):124-9. doi: 10.5455/njppp.2017.7.0833229092017.
Srivastava D, Fatima Z, Kaur CD, Mishra A, Nashik SS, Rizvi DA. Glibenclamide-malonic acid cocrystal with enhanced solubility and bioavailability. Drug Dev Ind Pharm. 2022;48(8):417-24. doi: 10.1080/03639045.2022.2122987, PMID 36073946.
Saraf GJ, Burade KK, Gonjari ID, Hosmani AH, Pawar AA. Review on advances in pharmaceutical cocrystal preparation routes intellectual property perspective and regulatory aspects. Int J Curr Pharm Res. 2022;14(5):4-12. doi: 10.22159/ijcpr.2022v14i5.2038.
Winantari AN, Setyawan D, Siswodihardjo S, Soewandhi SN. Cocrystallization acyclovir succinic acid using solvent evaporation methods. Asian J Pharm Clin Res. 2017;10(6):91-4. doi: 10.22159/ajpcr.2017.v10i6.16369.
Rahman F, Winantari AN, Setyawan D, Siswandono. Comparison study of grinding and slurry method on physicochemical characterstic of acyclovir succinic acid cocrystal. Asian J Pharm Clin Res. 2017;10(3):153-8. doi: 10.22159/ajpcr.2017.v10i3.15925.
Kumar A, Singh P, Nanda A. Hot stage microscopy and its applications in pharmaceutical characterization. Appl Microsc. 2020;50(1):12. doi: 10.1186/s42649-020-00032-9, PMID 33580349.
Kumar DS, Chavda N. Spectrophotometric first order derivative method for simultaneous determination of rosuvastatin and fimsartan in synthetic mixture. Int J Pharm Pharm Sci. 2024;6(2):27-31. doi: 10.33545/26647222.2024.v6.i2a.121.
Zafar M, Naeem-ul-Hassan Naqvi SN, Ahmed M, Kaimkhani ZA. Altered kidney morphology and enzymes in streptozotocin induced diabetic rats. Int J Morphol. 2009;27(3):783-90. doi: 10.4067/S0717-95022009000300024.
Reddy MN, Anusha P. Development and characterization of gliclazide cocrystals. Int J Pharm Biol Sci. 2018;8(1):22-32.
Malik J, Khatkar A, Nanda A. A comprehensive insight on pharmaceutical co-crystals for improvement of aqueous solubility. Curr Drug Targets. 2023;24(2):157-70. doi: 10.2174/1389450124666221114095400, PMID 36380409.
Zhang H, Zeng H, LI M, Song Y, Tian S, Xiong J. Novel ascorbic acid co-crystal formulations for improved stability. Molecules. 2022;27(22):1-13. doi: 10.3390/molecules27227998, PMID 36432100.
Raghavendra HL, Kumar PG. Development and evaluation of polymer bound glibenclamide oral film. J Bioequiv Availab. 2017;9(1):324-30.
Sanphui P, Rajput L. Tuning solubility and stability of hydrochlorothiazide co-crystals. Acta Crystallogr B Struct Sci Cryst Eng Mater. 2014;70(1):81-90. doi: 10.1107/S2052520613026917, PMID 24441131.
DU Y, Cai Q, Xue J, Zhang Q. Raman and terahertz spectroscopic investigation of cocrystal formation involving antibiotic nitrofurantoin drug and coformer 4-aminobenzoic acid. Crystals. 2016;6(12):164. doi: 10.3390/cryst6120164.
Kadhim ZJ, Rajab NA. Formulation and characterization of glibenclamide nanoparticles as an oral film. Int J Drug Deliv Technol. 2022;12(1):387-94.
Verma S, Nanda A, Basu SP. Screening preparation and characterization of aceclofenac cocrystals. Drug Inven Today. 2018;11(1):81-7.
Moradiya HG, Islam MT, Halsey S, Maniruzzaman M, Chowdhry BZ, Snowden MJ. Continuous cocrystallisation of carbamazepine and trans cinnamic acid via melt extrusion processing. Cryst Eng Comm. 2014;16(17):3573-83. doi: 10.1039/C3CE42457J.
Xie F, JI S, Cheng Z. In vitro dissolution similarity factor (f2) and in vivo bioequivalence criteria how and when do they match? Using a BCS class II drug as a simulation example. Eur J Pharm Sci. 2015;66:163-72. doi: 10.1016/j.ejps.2014.10.002, PMID 25315411.
Goyal P, Rani D, Chadha R. Crystal engineering: a remedy to tailor the biopharmaceutical aspects of glibenclamide. Cryst Growth Des. 2018;18(1):105-18. doi: 10.1021/acs.cgd.7b00933.