
Int J App Pharm, Vol 17, Issue 2, 2025, 321-328Original Article
EVALUATION OF CARBOXYMETHYL MILLET STARCH AND PREGELATINIZED MILLET STARCH AS PHARMACEUTICAL EXCIPIENTS USING FACTORIAL EXPERIMENTAL DESIGNS
YUSRA AHMED1*, ABDULLAH H. MAAD2, HASSAN ALI HASSAN1, DAUD BARAKA ABDALLAH4, MALAZ YOUSEF1, ABDUL AMIR H. KADHUM3, ZUHEIR OSMAN1
1Department of Pharmaceutics, Faculty of Pharmacy, University of Khartoum, Khartoum, Sudan. 2Department of Pharmaceutics, College of Pharmacy, University of Al-Ameed, Karbala, Iraq. 3College of medicine, University of Al-Ameed, Karbala, Iraq. 4Department of Pharmaceutics, Faculty of Pharmacy, Al Ribat University, Khartoum, Sudan
*Corresponding author: Yusra Ahmed; *Email: yousrabakri@gmail.com
Received: 26 Jul 2024, Revised and Accepted: 08 Feb 2025
ABSTRACT
Objective: This study aimed to evaluate and optimize modified millet starches as pharmaceutical excipients in paracetamol tablet formulations, using factorial experimental designs to compare them against commonly used excipients in the industry.
Methods: Paracetamol tablets containing Carboxymethyl Millet Starch (CMMS) and Pregelatinized Millet Starch (PGMS) were evaluated through official quality control tests such as hardness, friability, disintegration time, and dissolution profile. Compatibility studies were performed using Fourier-Transform Infrared Spectroscopy (FTIR). The formulations were optimized based on statistical analysis using design expert V8.0.6.
Results: Tablets formulated with Carboxymethyl Millet Starch (CMMS) and Pregelatinized Millet Starch (PGMS) as excipients demonstrated a hardness range of 6.1–8.8 kg/cm² and disintegration times of 1.0–7.5 min. CMMS-based tablets showed slower drug release, reaching 80% release within 60 min. Statistical optimization indicated optimal binder concentrations of 6% for CMMS, resulting in a friability of 0.7%, hardness of 8.8 kg/cm², and disintegration time of 2.3 min, and 11% for PGMS, with a friability of 0.75%, hardness of 7.7 kg/cm², and disintegration time of 5.9 min. The optimized dissolution profile for PGMS formulations showed a similarity factor (f2) of 62, while CMMS tablets had an f2 value of 38 compared to Humadol.
Conclusion: The modified millet starches, CMMS and PGMS, can serve as potential alternatives to conventional excipients in immediate-release formulations and show promising results in optimizing tablet properties.
Keywords: Millet starch, Factorial designs, Modification, Optimization, Paracetamol
© 2025 The Authors. Published by Innovare Academic Sciences Pvt Ltd. This is an open access article under the CC BY license (https://creativecommons.org/licenses/by/4.0/)
DOI: https://dx.doi.org/10.22159/ijap.2025v17i2.52161 Journal homepage: https://innovareacademics.in/journals/index.php/ijap
INTRODUCTION
All substances required for the production and administration of the dosage form, excluding the active drug or prodrug, are referred to as pharmaceutical excipients. Pharmaceutical diluents adjust the dosage form's weight; binders hold powders together, while disintegrants aid in dosage form fragmentation for drug absorption and dissolution [1]. The essential roles that excipients play in formulations have made them a key focus of study in both the industry and academia [2]. Excipients not only help with drug delivery but also add to the expense of medications. On-going research on pharmaceutical excipients aims to improve existing options or discover new ones [3].
Due to its enormous molecular size, insolubility in water, instability of the viscous solution, and susceptibility to microorganisms, native starch has a limited range of applications [4]. By using physical and chemical modification methods; these natural properties can be improved to make functional starch with a variety of functional capabilities to suit different application needs [5].
It is possible to define experimentation as the research of a predetermined region with a clear purpose, the use of suitable tools, and the coming to conclusions supported by the experimental results. Most experiments focus on assessing the impact of one or more factors on the results. The outcome is the response or dependent variable, whereas the factors are the independent variables. The Quality by Design (QbD) initiative from the Food and Drug Administration (FDA), promotes the use of statistical methods for enhancing the development of high-quality medications. The experimental design, often known as the Design of Experiments (DoE), is one of these techniques [6].
Experimental design offers a valuable advantage in pharmaceutical product development by facilitating a systematic and simultaneous assessment of all relevant factors. Through statistical analysis, it becomes possible to identify key factors and evaluate their impact on various responses, including potential interactions between factors. By employing experimental design, the optimal formulation can be pinpointed, allowing for the characterization and optimization of critical factors [7]. Modern optimization techniques further streamline this process, enabling the creation of the most effective formulation for specific conditions while significantly reducing time, costs, and development efforts [8]. Factorial design, introduced by Fisher in 1926, is a method that involves examining the effects of multiple conditions or factors on experimental outcomes simultaneously. Its core principle is to determine the relative importance of these factors and assess if they interact with each other. By exploring all possible combinations of variables and levels, factorial design enables the evaluation of primary effects and interactions, distinguishing between significant and insignificant factors. This approach is widely applicable in pharmaceutical research, providing a foundation for various experiments aimed at identifying optimal solutions to a range of issues [9].
Paracetamol, known as N-(4-hydroxyphenyl) acetamide, is a white crystalline powder with limited flow and compressibility properties. Its chemical formula is C8H9NO2. This compound serves as both an analgesic and antipyretic medication [10]. When taken orally, its bioavailability typically falls between 85% and 98%. In adults, its biological half-life spans approximately 2 to 3 h, with the liver being the primary site of metabolism [11].
The objectives of this study were formulation, comparative evaluation, and optimization of Carboxymethylated Millet Starch (CMMS) and Pregelatinized Millet Starch (PGMS) as pharmaceutical excipients in the formulations of paracetamol tablets and compared their dissolution profiles with those of marketed brands.
MATERIALS AND METHODS
Chemicals and reagents
Millet grains were purchased from Abnaa Sayed Elobied Agro Export Company, Khartoum, Sudan. Samples of paracetamol powder, Polyvinyl Pyrrolidone (PVP), Sodium Starch Glycolate (SSG), and Fully Gelatinized Maize Starch (FGS) were obtained from (Azal Co. Ltd., Sudan). Sodium hydroxide and potassium dihydrogen orthophosphate were purchased from (sd fine-chem Limited, India). Magnesium Stearate (Mg. st) and talc were purchased from (Techno Pharmchem, India).
Drug-excipients compatibility study
The drug-excipients compatibility studies were carried out using Fourier-transform infrared spectroscopy (FTIR) (Shimadzu, Japan), according to the method described in reference [12].
Formulation
Firstly, CMMS was compared to PVP and FGS as a binder at three different concentrations 3%, 4.5%, and 6% in 32 full factorial experimental designs.
Secondly, a general factorial design was used to compare PGMS against a combination of PVP and SSG as a binder and a disintegrant. PGMS was used at 8%, 10%, and 12% intragranularly as a binder, with a fixed 2% added to the dried granules to act as a disintegrant. While PVP was incorporated as a granulation solution at 8%, 10% and 12% as a binder, alongside a fixed 2% SSG added extragranularly as a disintegrant.
Using the wet granulation technique [13], various binder solutions were prepared by dispersing them in cold water to achieve a concentration of 25% w/w as per the specified formula. These solutions were then added to a predetermined amount of paracetamol in a mortar and pestle, where they were mixed for 5 min. Subsequently, the resulting wet mass was passed through sieve number 12 (1400 μm) and dried at 60 °C in a hot air oven (Schwach FRG, Germany) until the loss on drying reached approximately 2% w/w. The dried granules were screened again through sieve number 18 (850 μm). Finally, disintegrants were added extra granularly and mixed for 5 min. The mixture was lubricated with 1 % magnesium stearate and 2% talc for 3 min and then compressed into tablets using a single punch tableting machine (Erweka, Germany) with a punch diameter of 12 mm and a compression force of 4-8 kilopond (kp).
Evaluation of micromeritic properties
The bulk and tapped densities, along with the angle of repose (θ) of the granule samples, were assessed using the approach described in reference [11]. Carr's index and Hausner's ratio were subsequently calculated using the equations provided below.
Evaluation of tablet properties
Weight uniformity, hardness, friability, and disintegration time were assessed according to the USP method [14].
In vitro drug release study
The in vitro drug release study of optimized formulations and two marketed brands was carried out following the USP method for paracetamol tablets [14].
Dissolution efficiency (DE) % and kinetics of drug release
A comparison of dissolution profiles obtained was conducted following a model-independent approach using similarity factor (f2) and difference factor (f1) according to the method described in reference [15]. Finally, to determine the mechanism of drug release, in vitro drug release data were analysed using various mathematical models; including zero-order, first-order, Higuchi, Korsmeyer–Peppas, and Hixson-Crowell models [16].
Statistical analysis and optimization
Statistical analysis was performed using design experts V8.0.6. Friability %, hardness, and disintegration time were tested as responses. The results obtained from the preliminary batches were used to generate new formulations and then optimization [17].
RESULTS
Drug-excipient compatibility study
Fig. 1, 2, and 3 present the FTIR spectra for paracetamol, the paracetamol and CMMS mixture, and the paracetamol and PGMS mixture, respectively.
Formulation
The results of formulations using different binder types and concentrations, analyzed by a 32 full factorial design, are presented in table 1. Additionally, the results of formulations using PGMS and a combination of PVP and SSG at varying concentrations, evaluated using a general factorial design, are listed in table 2.
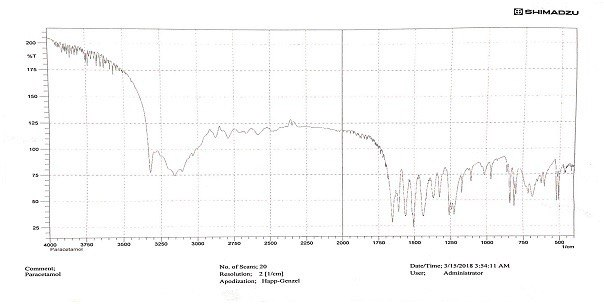
Fig. 1: FTIR spectrum of paracetamol
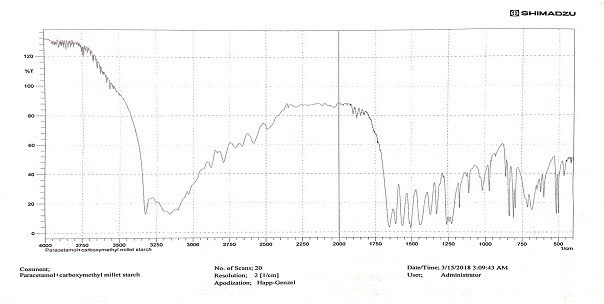
Fig. 2: FTIR spectrum of paracetamol and CMMS mixture
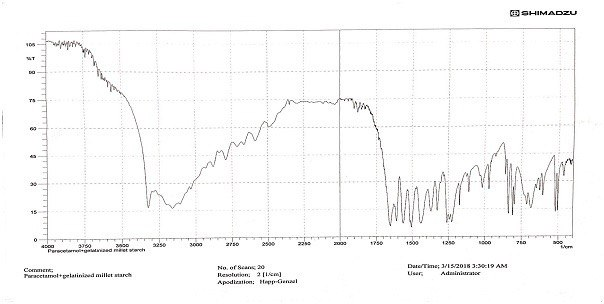
Fig. 3: FTIR spectrum of paracetamol and PGMS mixture
Table 1: Composition of formulation runs using various binder types and concentrations in the 32 full factorial design
| Formula code | Paracetamol | PVP | CMMS | FGS | SSG | Talc | Mg. st |
| E1 | 500 mg | 3% | 1% | 2% | 1% | ||
| E2 | 500 mg | 4.5% | 1% | 2% | 1% | ||
| E3 | 500 mg | 6% | 1% | 2% | 1% | ||
| E4 | 500 mg | 3% | 1% | 2% | 1% | ||
| E5 | 500 mg | 4.5% | 1% | 2% | 1% | ||
| E6 | 500 mg | 6% | 1% | 2% | 1% | ||
| E7 | 500 mg | 3% | 1% | 2% | 1% | ||
| E8 | 500 mg | 4.5% | 1% | 2% | 1% | ||
| E9 | 500 mg | 6% | 1% | 2% | 1% |
PVP: Polyvinyl Pyrrolidone, CMMS: Carboxymethylated Millet Starch, FGS: Fully Gelatinized Maize Starch, SSG: Sodium Starch Glycolate, Mg. st: Magnesium Stearate.
Table 2: Composition of formulation runs using PGMS and a combination of PVP and SSG at varying concentrations in the general factorial design
| Formula | Paracetamol | PGMS as binder | PGMS as disintegrant | PVP | SSG | Talc | Mg. st |
| B1 | 500 mg | 6% | 2% | 2% | 1% | ||
| B2 | 500 mg | 8% | 2% | 2% | 1% | ||
| B3 | 500 mg | 10% | 2% | 2% | 1% | ||
| B4 | 500 mg | 6% | 2% | 2% | 1% | ||
| B5 | 500 mg | 8% | 2% | 2% | 1% | ||
| B6 | 500 mg | 10% | 2% | 2% | 1% |
PGMS: Pregelatinized millet starch.
Evaluation of micromeritic properties
The results of the micromeritic properties of the paracetamol granules prepared using different binder types and concentrations are shown in table 3. In addition, the results of the micrometric properties of the paracetamol granules prepared using PGMS and a combination of PVP and SSG at different concentrations are presented in table 4.
Table 3: Micromeritic properties of the paracetamol granules prepared using different binder types and concentrations
| Type of binder | Conc. a% | Bulk density (g/cm³) |
Tapped density (g/cm³) |
Carr’s index (%) |
Hausner's ratio | Angle of repose (θ) |
| PVP | 3 4.5 6 |
0.48±0.014 0.46±0.007 0.50±0.007 |
0.57±0.014 0.55±0.014 0.57±0.014 |
15.8±0.354 16.4±0.778 12.3±0.495 |
1.19±0.007 1.17±0.021 1.14±0.042 |
30.97±0.41 25.60±0.87 26.83±0.40 |
| CMMS | 3 4.5 6 |
0.50±0.007 0.47±0.014 0.50±0.021 |
0.59±0.014 0.56±0.007 0.57±0.035 |
15.3±1.626 16.1±1.464 12.3±1.909 |
1.18±0.042 1.19±0.021 1.14±0.021 |
32.03±1.44 25.60±0.87 25.83±0.75 |
| FGS | 3 4.5 6 |
0.50±0.014 0.48±0.014 0.47±0.021 |
0.59±0.021 0.55±0.014 0.53±0.028 |
15.3±0.778 12.7±0.283 11.3±0.707 |
1.18±0.007 1.15±0.007 1.13±0.007 |
32.27±0.46 25.17±1.40 26.33±0.46 |
Data are expressed as mean ±SD, n=3. aConc.: Concentration.
Table 4: Micromeritic properties of the paracetamol granules prepared using PGMS and mixture of PVP and SSG at different concentrations
| Type | Conc.% | Bulk density (g/cm³) | Tapped density (g/cm³) | Carr’s index (%) | Hausner's ratio | Angle of repose (θ) |
| PGMS | 8 10 12 |
0.48±0.014 0.53±0.021 0.48±0.014 |
0.57±0.021 0.62±0.028 0.55±0.021 |
15.8±0.636 14.5±0.424 12.7±0.707 |
1.19±0.007 1.17±0.007 1.15±0.007 |
30.7±0.40 26.4±0.81 24.5±1.80 |
| PVP+SSG | 8 10 12 |
0.5±0.0140 0.53±0.021 0.55±0.007 |
0.56±0.014 0.59±0.021 0.61±0.007 |
10.7±0.283 10.2±0.354 9.80±0.141 |
1.12±0.007 1.11±0.007 1.11±0.007 |
26.1±0.46 24.6±0.40 24.6±0.40 |
Data are expressed as mean±SD, n=3.
Evaluation of tablet properties
The results of the evaluation of tablet properties are presented in tables 5 and 6.
Statistical analysis and optimization
Estimates of the linear and interaction effects of excipient types and concentrations are displayed in tables 7 and table 8. The optimized and ideal values for the set of responses (hardness and friability set within the acceptable range stated by USP while disintegration time is set as the possible lowest level of the designs using the numerical optimization via Design Expert 8 software as shown in tables 9 and 10. The best solutions (formulations) suggested by the design based on the desirability approach for optimizations are listed in tables 11 and 12.
In vitro drug release study
Fig. 4 shows the in vitro drug release behaviour of the optimized formulations, as well as Humadol and Tylenol tablets.
Table 5: Evaluation of paracetamol tablets prepared using different binder types at different concentrations
| Type of binder | Conc. (%) | CVa (%) | Hardness (kg/cm2) | Friability (%) | Disintegration time (min) |
| PVP | 3 4.5 6 |
0.8396±0.288 1.4248±0.345 1.4192±0.658 |
5.50±0.408 6.83±1.041 8.00±0.612 |
1.00±0.059 0.95±0.021 0.65±0.127 |
0.910±0.123 1.250±0.914 1.975±0.253 |
| CMMS | 3 4.5 6 |
0.7658±0.547 1.0317±0.432 1.7416±0.325 |
6.12±0.854 7.25±0.645 8.83±0.289 |
1.20±0.071 1.00±0.153 0.69±0.141 |
1.073±0.200 1.830±0.661 2.501±0.172 |
| FGS | 3 4.5 6 |
0.8336±0.854 1.1347±0.368 1.2132±0.523 |
5.50±0.866 7.67±0.577 8.67±0.289 |
1.40±0.058 0.95±0.121 0.56±0.205 |
0.720±0.242 1.170±0.362 1.830±0.240 |
Data are expressed as mean ±SD, n=3. aCV%: Coefficient of variance.
Table 6: Evaluation of paracetamol tablets prepared using PGMS and mixture of PVP+SSG at different concentrations
| Type | Conc. (%) | CV** (%) | Hardness kg/cm2 | Friability (%) | Disintegration time (min) |
| PGMS | 8 10 12 |
1.5093±0.158 2.4335±0.925 2.0348±0.732 |
6.30±0.764 7.60±0.629 8.00±0.577 |
1.16±0.152 0.77±0.082 0.65±0.102 |
3.00±1.061 4.33±1.155 7.50±0.707 |
| PVP+SSGa | 8 10 12 |
1.4014±0.452 1.4339±0.523 0.6863±0.842 |
7.00±0.479 8.25±0.354 8.50±0.707 |
1.01±0.090 0.81±0.064 0.58±0.021 |
2.00±0.250 5.50±0.866 8.83±1.041 |
Data are expressed as mean ±SD, n=3. aPVP+SSG: a mixture of polyvinyl pyrrolidone and sodium starch glycolate.
Table 7: Estimated linear and interactive effects for a 32 full factorial design to compare CMMS against PVP and FGS as a tablet binder
| p-value* | Hardness | Friability | Disintegration time |
| A-Conc.% of binder | <0.0001 | 0.0005 | 0.0007 |
| B-Type of binder | 0.0773 | 0.2678 | 0.0784 |
| AB-interaction | 0.5749 | 0.0510 | 0.2123 |
*If the p-value is under 0.05, the results are considered statistically significant.
Table 8: Estimated linear and interactive effects for a general factorial design to compare PGMS against a mixture of PVP+SSG
| p-value* | Hardness | Friability | Disintegration time |
| A-Conc.% of excipients | 0.0157 | 0.0062 | 0.0088 |
| B-Type of excipients | 0.1009 | 0.3594 | 0.3698 |
| AB-interaction | 0.8209 | 0.6607 | 0.1606 |
*If the p-value is under 0.05, the results are considered statistically significant.
Table 9: Numerical optimization for a 32 full factorial design using CMMS at different concentrations in paracetamol tablet formulations
| Constraint name | Goal | Lower limit | Upper limit | Weight | Importance |
| Type of binder | Equal to CMMS | - | - | 1 | 3 |
| Conc.% of binder | Is in range | -1 (3%) | +1 (6%) | 1 | 3 |
| Hardness | Is in range | 5 kg/cm2 | 9 kg/cm2 | 1 | 3 |
| Friability | Is in range | 0 % | 0.7 % | 1 | 3 |
| Disintegration Time (DT) | Minimize | 0 min | 5 min | 1 | 3 |
Table 10: Numerical optimization for a general factorial design using PGMS at different concentrations in paracetamol tablet formulations
| Constraint name | Goal | Lower limit | Upper limit | Weight | Importance |
| Type of excipients | Equal to PGMS | - | - | 1 | 3 |
| Conc.% excipients | Is in range | -1 (8%) | +1 (12%) | 1 | 3 |
| Hardness | Is in range | 5 kg/cm2 | 9 kg/cm2 | 1 | 3 |
| Friability | Is in range | 0 % | 0.75 % | 1 | 3 |
| Disintegration time (DT) | Minimize | 5 min | 10 min | 1 | 3 |
Table 11: Selected solution of numerical optimization for a 32 full factorial design using CMMS at different concentrations in paracetamol tablet formulations
| No | Formula | Binder conc. % | Binder type | Hardness kg/cm3 | Friability % | DTa (min) | Desirability |
| 1 | F1opta | 6.00 | CMMS | 8.798±1.026* | 0.70±0.05* | 2.34±0.71* | 0.886 |
Data are expressed as mean ±SD, n=3, aDT: Disintegration Time, F1opt: Optimized formula of paracetamol tablets containing CMMS.
Table 12: Selected solution of numerical optimization for a general factorial design using PGMS at different concentrations in paracetamol tablet formulations
| No | Formula | Excipient conc. % | Excipient type | Hardness kg/cm3 | Friability % | DT (min) | Desirability |
| 1 | F2opta | 11.02 | PGMS | 7.675±0.751* | 0.75±0.14* | 5.91±1.06* | 0.817 |
Data are expressed as mean±SD, n=3. aF2opt: Optimized formula of paracetamol tablets containing PGMS.
Table 13: Similarity (F2) and difference (F1) factors comparing optimized formulations with humadol and tylenol
| Humadol | Tylenol | |||
| F1 | F2 | F1 | F2 | |
| F1opta | 24.74 | 38.01 | 42.20 | 18.37 |
| F2opta | 06.68 | 62.41 | 23.60 | 26.29 |
aF1opt: The optimized formula of paracetamol tablets containing CMMS, F2opt: The optimized formula of paracetamol tablets containing PGMS.
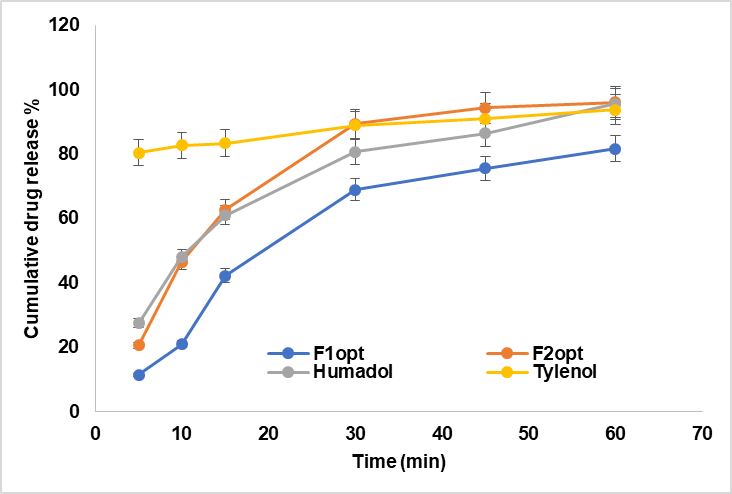
Fig. 4: Comparative In vitro drug release studies between the optimized formulations vs. marketed Humadol and Tylenol tablets, error bars indicate the standard deviation of replicates, n=3
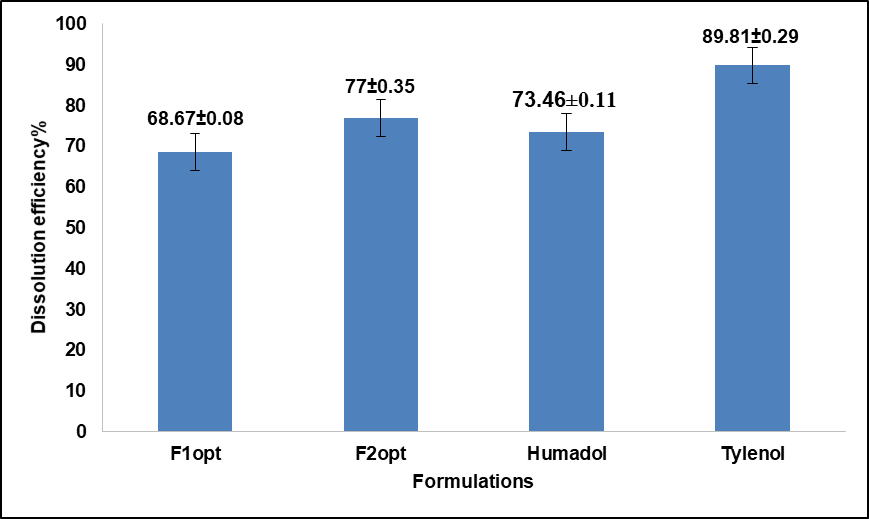
Fig. 5: Dissolution efficiency % of the optimized formulations compared to marketed humadol and tylenol after 1 h, All values shown in graph are measured as mean±SD, n=3
Table 14: Release kinetics of optimized formulations, humadol, and tylenol
| R2 | Model | Formulations |
0.872 0.957 0.944 0.943 0.931 |
Zero Order First Order Higuchi Korsmeyer Peppas Hixon Crowell |
F1opt |
0.789 0.958 0.893 0.895 0.912 |
Zero Order First Order Higuchi Korsmeyer Peppas Hixon Crowell |
F2opt |
0.865 0.979 0.945 0.945 0.971 |
Zero Order First Order Higuchi Korsmeyer Peppas Hixon Crowell |
Humadol |
0.971 0.993 0.991 0.965 0.990 |
Zero Order First Order Higuchi Korsmeyer Peppas Hixon Crowell |
Tylenol |
Similarity and difference factors
The results of similarity and difference factors of optimized formulations to Humadol and Tylenol are presented in table 13.
Dissolution efficiency % and kinetics of drug release
The results of dissolution efficiency % (D. E. %) and Kinetics of the released drug for optimized formulations, Humadol and Tylenol are presented in fig. 5 and table 14, respectively.
DISCUSSION
Our results indicated no chemical interaction between the drug and the modified starch, as shown in fig. 1, 2, and 3. In a drug-excipient compatibility study, it's essential to assess whether there is any chemical interaction between the drug and the excipient used in the formulation. The absence of chemical interactions can be crucial for ensuring the stability and efficacy of the drug product [18]. The evaluation results demonstrated that all granules exhibited good flow, and the values obtained fell within the predetermined ranges needed to produce tablets of high quality. The results of Carr’s index and Hausner's ratio indicated that the granules showed good flowability and consolidation properties, as shown in Tables 3 and 4. Particle size, size distribution, and particle shape are primary factors influencing bulk density. Bulk density serves as an indicator of how powders pack during various tableting processes, such as die filling, mixing, granulation, and compression. It indirectly measures powder flow. Elevated bulk density suggests reduced porosity, meaning less room for deformation during compression. Consequently, this leads to a lower potential for deformation, resulting in diminished contact between powder particles and, ultimately, weaker tablets [19]. Carr's index and Hausner's ratio serve as indicators of a material's compressibility and its flow characteristics during compression to form a compact mass. These indices offer insights into how granules are expected to behave under pressure, aiding in predicting their flow properties [20]. Higher values of these indices correspond to decreased powder flow, potentially leading to tablets with greater weight variation [21]. The angle of repose (θ) serves as a qualitative indicator of the cohesion or flow tendency of powdered or granulated materials, particularly as they move from hoppers through feed frames into tableting machines. Elevated θ values indicate poorer flow characteristics, with values exceeding 40, signalling particularly inadequate flow [22].
Regarding tablet properties, and according to the data presented in Tables 5 and 6, all formulations successfully met the requirements of the weight uniformity test, as indicated by the standard deviation from the mean falling within the specified limits outlined in the USP. The tablet hardness increased with higher concentrations but remained within acceptable limits across all formulations. Most tablets passed the friability test, though exceptions were observed in formulations with lower concentrations. Importantly, all tested formulations met the official disintegration time criteria specified by the USP [14]. Tablets must endure abrasion, friction, and mechanical shocks throughout their manufacturing, packaging, and transportation processes. Additionally, tablets must exhibit appropriate hardness, resistance to powdering, and friability to gain consumer approval. Tablet hardness is critical, as it directly impacts disintegration and dissolution, making it a key parameter that warrants thorough investigation to ensure tablet quality and efficacy [23]. Insufficient binder solution/dispersion, compression pressure, and air entrapment within the granules or powders during mixing or before compression are potential factors that may affect the outcomes [24]. For immediate-release tablets, disintegration time plays a key role in the dissolution test [25]. The acceptable range for hardness, friability, and disintegration time for uncoated tablets as required by United States pharmacopoeia is 4-8, ≤ 1%, and ≤ 15 min, respectively [14]. The presence of a high concentration of plastic-elastic binding agent can cause an increase in the plastic deformation of particles and create more solid bonds between them. That can result in increasing the hardness and decreasing the friability [26]. The same scenario justified the observed results with our paracetamol tablets. Increased disintegration times were noted with increased concentration due to increased crushing strength of the tablets at these concentrations as shown in Tables 5 and 6. In pharmaceutical formulation studies, it's important to understand the effects of excipient types and their concentrations on the physical and mechanical properties of tablets [27]. According to the results of estimates of the linear and interaction effects of excipient types and concentrations, only the concentrations exhibited a statistically significant effect (p<0.05) on the hardness, friability, and disintegration time of the various paracetamol tablet formulations as shown in tables 7 and 8.
Regarding optimization, the optimized and ideal values for the set of responses, the hardness and friability, are within the acceptable range stated by USP, and the disintegration time is set as the possible lowest level of the designs using the numerical optimization via Design Expert 8 software [14]. As shown in Tables 11 and 12, the optimized formulations had a desirability of more than 0.8 which means that the probability that theoretical formulations give the same results demonstrated in tables is more than 80%.
In vitro drug release behavior of all the optimized formulations as well as for Humadol and Tylenol tablets profile, were studied by recording the cumulative percentage of drug released over time. From our results, except for F1opt, all formulations passed the dissolution test for immediate-release tablets [14], as shown in fig. 4. The formula F1opt containing CMMS showed the least performance in terms of cumulative percent drug released over time. The observed delay in drug release from the examined tablets was linked to CMMS (cross-linked methylcellulose). It was suggested that CMMS forms a gel-like layer upon contact with water, which acts as a barrier, trapping dissolved drugs and consequently delaying their release [28].
Similarity and difference factors for optimized formulations of Humadol and Tylenol were shown in table 13. The dissolution profile of F2opt was comparable to that of Humadol. However, none of the optimized formulations had a dissolution profile analogous to that of Tylenol. To deem two dissolution profiles comparable, the difference factor (f1) should fall within the range of 0 to 15, while the similarity factor (f2) should range between 50 and 100, as stated [15]. The results of dissolution efficiency % indicated that Tylenol has the highest D. E. % among all formulations. The formation of a gel-like layer by PGMS and CMMS in cold water might account for the delayed release of drugs from tablets containing these modified starches [28]. However, ensuring appropriate dissolution is crucial whenever a new solid dosage form is developed. Nowadays, pharmaceutical industries and regulatory bodies prioritize medication dissolution/release studies. Quantitative analysis of drug release in various dosage forms often relies on applying suitable mathematical formulas that correspond to specific characteristics of the dosage form. Commonly utilized functions include zero order, first order, Hixson–Crowell, Higuchi, and Korsmeyer–Peppas models [28]. In an optimal scenario, drug delivery would adhere to "zero-order kinetics," maintaining steady blood levels of drugs over the entire delivery duration [29]. As shown in fig. 5 and table 14, the Kinetics of the released drug showed the best correlation coefficient values (R2) to the first-order release. It was initially fast, then it slowed over time as the drug was depleted from the delivery system.
CONCLUSION
This study successfully evaluated the use of CMMS and PGMS as pharmaceutical excipients in paracetamol tablet formulations. The drug-excipient compatibility studies revealed no significant interactions, confirming the suitability of the chosen excipients. The formulations prepared using CMMS and PGMS as binders showed favorable micromeritic properties, such as good flowability and compactibility, with minimal variations in hardness, friability, and disintegration time. The optimized formulations demonstrated promising in vitro drug release profiles, comparable to commercial brands like Humadol and Tylenol, with dissolution efficiency and kinetics showing good correlation with the desired release patterns. The results of this study reveal that modified millet starches, specifically carboxymethyl and pregelatinized forms, offer a viable alternative to conventional pharmaceutical excipients, particularly in sustained-release formulations. This advancement not only provides a cost-effective solution by utilizing locally available resources but also promotes the potential for increased self-reliance in pharmaceutical raw materials. Further studies are recommended to explore the clinical relevance of these optimized formulations and to assess the long-term stability of the tablets.
ACKNOWLEDGMENT
I would like to express my sincere gratitude to the University of Khartoum for their invaluable support and assistance throughout this study. Special thanks to all staff at the faculty of pharmacy for their guidance, expertise, and encouragement.
FUNDING
This research did not receive any specific grant from funding agencies in the public, commercial, or non-profit sectors.
AUTHORS CONTRIBUTIONS
Y Ahmed designed the research study, led the development of the methodology, played a key role in analyzing the data, and drafted the manuscript. AH Maad managed the collection, organization, and analysis of data. HA Hassan conducted the experiments. DB Abdallah contributed to reviewing the manuscript. M Yousef contributed to interpreting the results. AH Kadhum reviewed the manuscript drafts. Z Osman co-led the conceptual design of the study and supervision.
CONFLICT OF INTERESTS
The authors declare no conflict of interest
REFERENCES
Kar M, Chourasiya Y, Maheshwari R, Tekade RK. Current developments in excipient science. In: Basic fundamentals of drug delivery. Amsterdam: Elsevier; 2019. p. 29-83. doi: 10.1016/B978-0-12-817909-3.00002-9.
Elballa W, Salih M. Influence of partially and fully pregelatinized starch on the physical and sustained-release properties of HPMC-based ketoprofen oral matrices. Int J Pharm Pharm Sci. 2022;14(8):29-34. doi: 10.22159/ijpps.2022v14i8.45031.
Van der Merwe J, Steenekamp J, Steyn D, Hamman J. The role of functional excipients in solid oral dosage forms to overcome poor drug dissolution and bioavailability. Pharmaceutics. 2020;12(5):393. doi: 10.3390/pharmaceutics12050393, PMID 32344802.
Zhong Y, Tian Y, Liu X, Ding L, Kirkensgaard JJ, Hebelstrup K. Influence of microwave treatment on the structure and functionality of pure amylose and amylopectin systems. Food Hydrocoll. 2021;119:106856. doi: 10.1016/j.foodhyd.2021.106856.
Lawal MV. Modified starches as direct compression excipients-effect of physical and chemical modifications on tablet properties: a review. Starch Starke. 2019;71(1-2):1800040. doi: 10.1002/star.201800040.
Sangshetti JN, Deshpande M, Zaheer Z, Shinde DB, Arote R. Quality by design approach: regulatory need. Arab J Chem. 2017;10:S3412-25. doi: 10.1016/j.arabjc.2014.01.025.
Hadidi N, Nazari N, Aboofazeli R. Formulation and optimization of microemulsion-based organogels containing propranolol hydrochloride using experimental design methods. DARU J Pharm Sci. 2015;17(3):217-24.
Jadhav SB, Koshti AR, Bari MM, Barhate SD. Formulation optimization and Evaluation of transdermal patch of losartan potassium containing DMSO as permeation enhancer. Asian J Pharm Technol. 2019;9(3):220-7. doi: 10.5958/2231-5713.2019.00037.0.
Beg S, Swain S, Rahman M, Hasnain MS, Imam SS. Application of design of experiments (DoE) in pharmaceutical product and process optimization. In: Pharm Qual Des Amsterdam: Elsevier; 2019. p. 43-64. doi: 10.1016/B978-0-12-815799-2.00003-4.
Maqlam T, Maad AH, Kadhum AA, Basaeed M. Evaluation of tramadol use in Ibn Sena General Hospital in Mukalla City, Hadhramout governorate, Yemen. J Med Pharm Chem Res. 2024;6(11):1716-24. doi: 10.48309/jmpcr.2024.450324.1174.
Gitau NS. Development and evaluation of pediatric orally disintegrating paracetamol tablets. University of Nairobi; 2019.
Saleemulla K, Ramu G, Mohan GK, Jayaveera KN, Bhalgat C. Tablet disintegrant activities of new starch from immature pepino fruits. J Sci Ind Res. 2011;70:149-55.
Alam S, Bishal A, Bandyopadhyay B. Formulation and evaluation of metformin hydrochloride sustained release matrix tablets. Int J Curr Pharm Res. 2021;13(5):82-8. doi: 10.22159/ijcpr.2021v13i5.1899.
USP C. The United States pharmacopeia. Natl Formul. 2008;14.
Kassaye L, Genete G. Evaluation and comparison of in vitro dissolution profiles for different brands of amoxicillin capsules. Afr Health Sci. 2013;13(2):369-75. doi: 10.4314/ahs.v13i2.25, PMID 24235938.
Usman S. Shehada Mbi, Usman A, Islam Q. Pharmaceutical quality assessment of glimepiride tablets–comparison of brands and newly formulated tablets with innovator. Asian J Pharm Clin Res. 2021;14(10):63-7. doi: 10.22159/ajpcr.2021.v14i10.42768.
Ram D, Pankhaniya H. Formulation, evaluation and optimization of sustained-release drug delivery system of cisapride tablet. Int J Pharm Pharm Sci. 2021;13(9):56-62. doi: 10.22159/ijpps.2021v13i9.41799.
Dino SF, Edu AD, Francisco RG, Gutierrez E, Crucis P, Lapuz AM. Drug-excipient compatibility testing of cilostazol using FTIR and DSC analysis. Philipp J Sci. 2023;152(6A). doi: 10.56899/152.6A.08.
Brubaker J, Moghtadernejad S. A comprehensive review of the rheological properties of powders in pharmaceuticals. Powders. 2024;3(2):233-54. doi: 10.3390/powders3020015.
Okpanachi GO, Musa H, Isah AB. Evaluation of disintegrating property of native and microcrystalline starches derived from digitaria iburua. West Afr J Pharm. 2013;24(1):64-71.
Olayemi O, Oyi A, Allagh T. Comparative evaluation of maize, rice and wheat starch powders as pharmaceutical excipients. Niger J Pharm Sci. 2008;7(1):131-8.
Gbenga BL, Olakunle O, Adedayo AM. Influence of pregelatinization on the physicochemical and compressional characteristics of starches obtained from two local varieties of Dioscorea rotundata. IOSRPHR. 2014;4(6):24-32. doi: 10.9790/3013-040602024032.
Gobinath T. Formulation and evaluation of enteric coated tablets of pantoprazole: JKK Nattraja College of Pharmacy, Komarapalayam. Tamil Nadu, India; 2014.
Mbah CC. Effect of process parameters on the properties of some metronidazole tablet and capsule formulations. Afr J Microbiol Res. 2012;6(24). doi: 10.5897/AJPP11.672.
Gupta A, Hunt RL, Shah RB, Sayeed VA, Khan MA. Disintegration of highly soluble immediate release tablets: a surrogate for dissolution. AAPS Pharm Sci Tech. 2009;10(2):495-9. doi: 10.1208/s12249-009-9227-0, PMID 19387843.
Badwan AA, Rashid I, Al Omari MM, Darras FH. Chitin and chitosan as direct compression excipients in pharmaceutical applications. Mar Drugs. 2015;13(3):1519-47. doi: 10.3390/md13031519, PMID 25810109.
Janssen PH, Fathollahi S, Bekaert B, Vanderroost D, Roelofs T, Vanhoorne V. Impact of material properties and process parameters on tablet quality in a continuous direct compression line. Powder Technol. 2023;424:118520. doi: 10.1016/j.powtec.2023.118520.
Bangar SP, Balakrishnan G, Navaf M, Sunooj KV. Recent advancements on barnyard millet starch: a sustainable alternative to conventional starch. Starch Stärke. 2024;76(9-10):2300232. doi: 10.1002/star.202300232.
Adepu S, Ramakrishna S. Controlled drug delivery systems: current status and future directions. Molecules. 2021;26(19):5905. doi: 10.3390/molecules26195905, PMID 34641447.