
Int J App Pharm, Vol 17, Issue 2, 2025, 329-338Original Article
INVESTIGATION OF HOT MELT EXTRUSION TECHNIQUE FOR FORMULATING TERNARY AMORPHOUS SOLID DISPERSION OF BCS-IV ANTI-PLATELET DRUG FOR SOLUBILITY AND DISSOLUTION ENHANCEMENT
RAJESH GIRADKAR, JANAKI DEVI SIRISOLLA*
GITAM School of Pharmacy, GITAM Deemed to be University, Rushikonda, Visakhapatnam, A. P, India
*Corresponding author: Janaki Devi Sirisolla; *Email: jsirisol@gitam.edu
Received: 27 Jul 2024, Revised and Accepted: 03 Jan 2025
ABSTRACT
Objective: The objective of this study was to investigate Hot Melt Extrusion (HME) technique of formulating stable amorphous solid dispersion of BCS IV drug ticagrelor for dissolution and bioavailability enhancement.
Methods: Ticagrelor, a low soluble and low permeable anti-platelet agent has been used as a model drug. A ternary Amorphous Solid Dispersion (ASD) was explored to improve the solubility and dissolution of ticagrelor using amphiphilic polymer Hydroxy Propyl Methyl Cellulose Acetate Succinate (HMPC-AS) and solubilizer poloxamer (Kolliphor RH188) employing HME. The ratio of ternary ASD was optimized by Design of Experiments (DoE) with 32-factor design. The Design Expert®13 was explored for the statistical evaluation.
The HME technique was preferred considering solvent free process, scalability and industrial safety. The extent of amorphization of ticagrelor was evaluated by Differential Scanning Calorimetry (DSC) and Powder X-Ray Diffraction (P-XRD). The comparative saturation solubility was evaluated by HPLC method and drug dissolution rate by UV spectroscopy.
Results: The ternary ASD prepared by HME technique has shown complete amorphization of input crystalline ticagrelor as confirmed by P-XRD and DSC analysis of ticagrelor solid dispersion formulated with HPMC-AS and poloxamer. The ternary ASD formulation was optimized by DoE has shown significant enhancement in ticagrelor solubility and 8 fold increase in dissolution rate and extent compared to conventional release marketed tablets.
Conclusion: A stable tablets formulation of ticagrelor ternary ASD was successfully prepared by HME technique and could enhance in vitro dissolution significantly, to an extent of 8 fold by complete conversion from crystalline to amorphous state.
Keywords: Ternary amorphous solid dispersion, Hot melt extrusion, Dissolution enhancement, Design of experiments
© 2025 The Authors. Published by Innovare Academic Sciences Pvt Ltd. This is an open access article under the CC BY license (https://creativecommons.org/licenses/by/4.0/)
DOI: https://dx.doi.org/10.22159/ijap.2025v17i2.52186 Journal homepage: https://innovareacademics.in/journals/index.php/ijap
INTRODUCTION
As per pharmaceutical screening programme, nearly 40% of the New Chemical Entities (NCEs) identified and few existing drug molecules have been failed to develop because of their poor water solubility and bioavailability [1]. This is the practical challenge for the pharmaceutical industry and formulation scientists to develop safe, effective and bioavailable oral solid formulation options for many potential drug candidates. Solid dispersions are widely used technique in enhancing the solubility and bioavailability of poorly soluble drugs of BCS-II and IV class [2]. Ticagrelor has been selected, which is orally active BCS-IV drug platelet inhibitor indicated to reduce the cardiovascular death and stroke in patients with Acute Coronary Syndrome (ACS) or Myocardial Infarction (MI) and stent thrombosis.
Ticagrelor has poor solubility<0.01 mg/ml across physiological pH 1 to 8 and low permeability ~36% (30-42%) and median Tmax of 1.5 h (range 1.0–4.0 h) [3]. Ticagrelor does not exhibit pKa within physiological pH range (pH 1 to 8) due to absence of ionizable functional group. No much work has been done yet to improve both solubility and permeability of ticagrelor as oral tablets using Hot Melt Extrusion (HME) process at industrial scale and no such product available in the market (only conventional Brilinta® tablets manufactured by Astra Zeneca available in market).
The pH dependent polymers like Hydroxypropyl Methylcellulose Acetate Succinate (HPMC-AS), eudragit-L100 as polymeric carriers and non-ionic surfactants/solubilizers like poloxamers P188, polysorbate 80, vitamin E TPGS have been reported to enhance drug solubilization, dissolution and in vivo permeability of BCS-II and IV drugs formulated as solid dispersions [4]. Such ternary amorphous solid dispersions have been postulated to enhance dissolution and in vivo permeability by below mechanisms which was introduced and explained by Guzman H et al. [4, 5]. A theoretical ‘Spring-parachute model’ is presented in fig. 1 to demonstrate various solubility enhancement scenarios [6, 7, 23].
Specifically, this model (ternary solid dispersion) proposes where, the medication is released into solution quickly and kept there for as long as possible in a supersaturated state that is higher than its equilibrium solubility. It was expected that the combination of polymeric carrier and surfactant would act like desired strong parachute along with rapid spring like drug release, delaying precipitation from the supersaturated solution of ASD. This is accomplished through intermolecular interactions, such as hydrogen bonding and hydrophobic interactions between the drug, polymer, and solubilizer which influence the kinetics of crystallisation [8, 15, 16]. The objective of current study is to optimize a ternary amorphous solid dispersion of ticagrelor using amphiphilic polymer viz. HPMC-AS and solubilizer viz. poloxamer P188 with HME technique. The formulation was optimized by DoE, an important tool for Quality by Design (QbD) to statistically evaluate the impact of factors to achieve the Critical Quality Attributes (CQAs) of the formulation. The HME technique is more practical considering cost effective solvent free process with industrial and human safety.
The solid dispersion thus obtained was characterized for the extent of amorphization of ticagrelor ASD, analysed by DSC and P-XRD to confirm the extent of amorphization of crystalline ticagrelor in formulation. The different formulation trials of solid dispersion were evaluated for comparative dissolution profiles in pH 6.8 Phosphate buffer to find out the most promising composition. The optimized ticagrelor ASD tablets were subjected to stability.
Ticagrelor is thermostable drug having melting point: 138-140 ℃ and the chemical structure shown in fig. 2. HPMC-AS polymer has melting point of 164-168 ℃ and Tg of 113 ℃, Poloxamer (Kolliphor P188 having melting point 52-62 ℃) used to reduce the Tg of HPMC-AS after cooling due to its solubilizer and plasticizer function. It helps hot melt processing at lower temperature and shear rates to produce softer mass [9, 20].
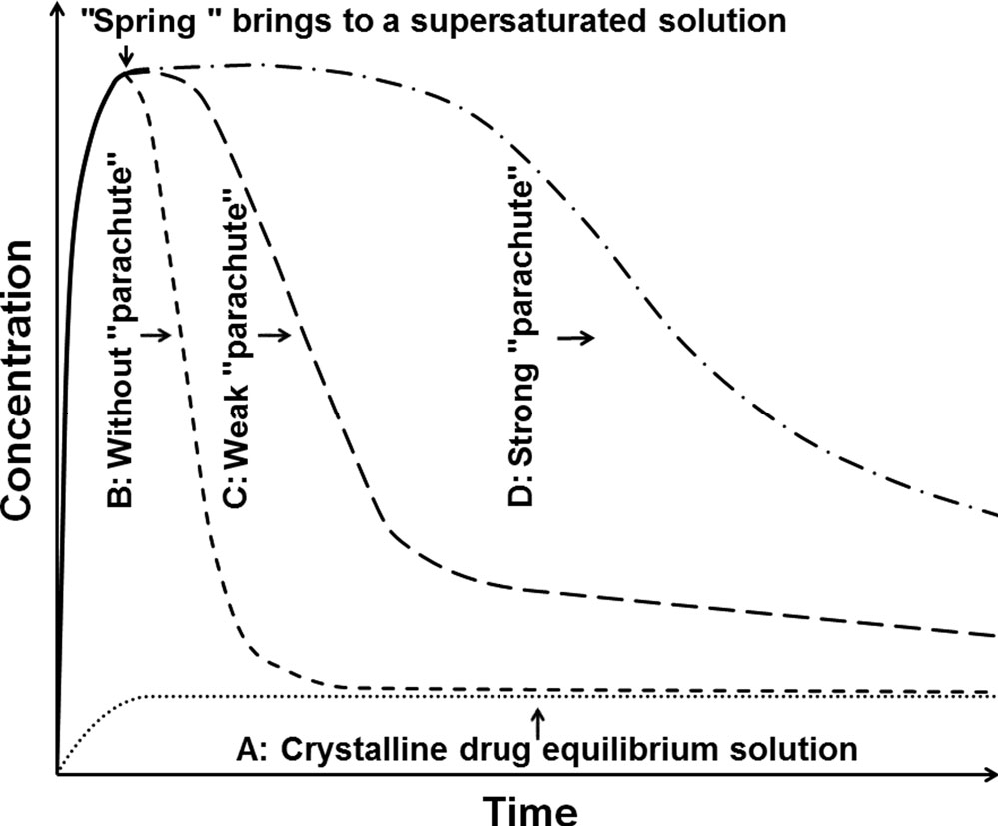
Fig. 1: Illustration of supersaturated solution through amorphous solid dispersion (ASD)
A: Crystalline drug having lower solubility. B: Amorphous drug showing higher solubility but rapid precipitation. C: ASD showing weak parachute polymer unable to delay the precipitation of the drug. D: ASD with strong parachute polymer able to sustain the drug supersaturation.
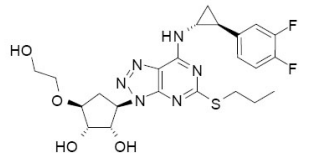
Fig. 2: Chemical structure of ticagrelor
MATERIALS AND METHODS
Materials
A gift sample of ticagrelor API was received from Dr Reddy’s Labs Ltd. Hyderabad, India. Hydroxypropyl methylcellulose-Acetate succinate (HPMC-AS, AquaSolveTM LG) was supplied by Ashland India. Magnesium aluminum metasilicate (Neusilin US2) was received as gift samples from Fuji Chem. (Japan). Mannitol (Pearlitol SD 200 was provided by Signet Chem Corpo. Poloxamer (Kolliphor RH188) was received from BASF and Sodium starch glycollate was received from DFE Pharma. All other chemicals used were of analytical grade.
Methods
HPLC analysis
The HPLC system (Shimadzu Corporation, Japan) that was used for the ticagrelor assay and solubility testing included a Shimadzu LC-2010 with a photodiode array detector. A reverse-phase C18 column (Chromosil 250 mm × 4.6 mm; 5 μm) was used for the separation. The chosen mobile phase was 60:40 v/v of acetonitrile: 50 mmol ammonium acetate buffer (pH 8.0), pumped at a constant flow rate of 1 ml/min for a duration of 6 min. The ticagrelor showed a 4.8 min retention period and absorbance was taken at 256 nm [11-13].
Standard solution preparation: 10 mg ticagrelor reference standard was dissolved with 5 ml methanol in a 10 ml volumetric flask, sonicated, and volume made up to 10 ml with methanol. 2 ml of standard stock solution were diluted to 20 ml with mobile phase (Acetonitrile: Ammonium acetate, 60:40 v/v) adjusted to pH 8.0.
Saturation solubility study
An excess amount (2 g) of plain ticagrelor drug was mixed separately with 10 ml distilled water, 0.1 N HCl and pH 6.8 potassium phosphate buffer in different volumetric flask (in triplicate). All the flasks were put into thermomixer set at 37 °C for 24 h. Post 24 h, the suspension was centrifuged, and supernatant was passed through a 0.45 μ nylon filter. The filtrate was diluted and analysed using HPLC [12, 13]. A similar procedure was carried out for determining the solubility of ticagrelor amorphous solid dispersion granules.
Dissolution study
The USFDA dissolution method database recommends dissolution conditions for ticagrelor tablets to use 900 ml water with 0.2 % w/v polysorbate 80, paddle run at 75 RPM, and sampling at 10, 20, 30, 45, and 75 min [14]. Since, water lacks the buffer capacity and adding surfactant to a medium would reduce its discriminatory power, pH 6.8 phosphate buffer without surfactant was chosen as the discriminatory medium to assess the in vitro dissolution performance. An in vitro dissolution study of ticagrelor tablet formulations was carried out in dissolution tester (Electrolab TDT-08 L model) using the paddle (USP II apparatus) run at 50 RPM in 900 ml of pH 6.8 Potassium phosphate buffer.
Different concentrations of ticagrelor standard solution were prepared in methanol, ranging from 2 mcg/ml to 10 mcg/ml, and absorbance was measured at 226 nm wavelength using an UV-Visible spectrophotometer (Shimadzu 1900 model). 5 ml samples were collected each at 10, 20, 30, 40, 50, and 60 min from dissolution vessels and filtered through a 0.45 µ filter. The samples were analysed using an UV-Visible spectrophotometer at 226 nm wavelength. The calculated dissolution profiles of the conventional ticagrelor tablets 60 mg and formulated ticagrelor ASD tablets eq. to 60 mg were compared for dissolution rate and extent.
Manufacturing process: HME
Ticagrelor amorphous solid dispersion was prepared by employing hot-melt extruder lab model (Omicron 10, Mini from STEER engineering) as shown in fig. 3. The HME has set control with different temperature and sheer/torque zones for tween screw (barrels) mixing, melting and cooling as shown in table 1. A schematic diagram of hot melt extrusion process has shown in fig. 4 and the steps followed for critical process parameters are explained below [19, 20].
Step 1: Ticagrelor, HPMC-AS and Poloxamer (Kolliphor RH188) were blended together at different weight ratio followed by magnesium aluminum metasilicate (Neusilin US2).
Step 2: The step 1 blended material was transferred to feeder of HME and hot-melt extruded at pre-set temperature over a period of 2 min at 60 RPM screw feeder speed to form ASD.
Step 3: The step 2 solidified cooled ASD granules were passed through #30 mesh and blended together with extra granular excipients like mannitol (filler), sodium starch glycolate (disintegrant) and magnesium stearate (lubricant) in a polybag for 5 min.
Step 4: Blend was compressed into tablets at 350 mg weight using 8.0 mm round punches.
DoE for formula optimization
Based on preliminary screening experiments, the ratio of drug to polymeric carrier HPMC-AS is critical for dissolution rate enhancement and stabilization of ASD formulation during shelf life. However, solubilizer (Poloxamer-Kolliphor RH188) concentration is important for maintaining drug in supersaturated stage in vivo after dissolution (rate and extent) from formulation [12, 13].
Hence, based on initial laboratory trials, the lower to higher levels of two independent factors i. e. HPMC-AS and poloxamer (Kolliphor RH188) were chosen to find out the optimized formulation required to achieve desired response. The dependent variables (responses) i. e. drug release at 10 min (Q10 min) and drug release at 20 min (Q20 min) were selected as critical quality attributes (CQAs). 32 full factorial DoE was selected for formulation optimization and to find out relationships between the independent variables (factors) and dependent variables (responses) using Design expert software (Stat-Ease Inc.) The independent variables at low (−1), medium (0), and high (+1) levels selected are compiled in table 2. The selected dependent variables (responses) and constraints are also presented in table 3. The unit composition of all the DoE formulations trials is given in table 4.
Table 1: Set temperature at different zones during HME process
| Name of zones | Temperature |
| Zone-I | 25 ℃±2 ℃ |
| Zone II | 60 ℃±2 ℃ |
| Zone-III | 100 ℃±2 ℃ |
| Zone IV | 150 ℃±2 ℃ |
| Zone-V | 150 ℃±2 ℃ |
| Zone-VI | 150 ℃±2 ℃ |
| Zone-VII | 100 ℃±2 ℃ |
| Zone-VIII | 60 ℃±2 ℃ |
| Zone-IX (Cooling/Chilling) | 25 ℃±2 ℃ |
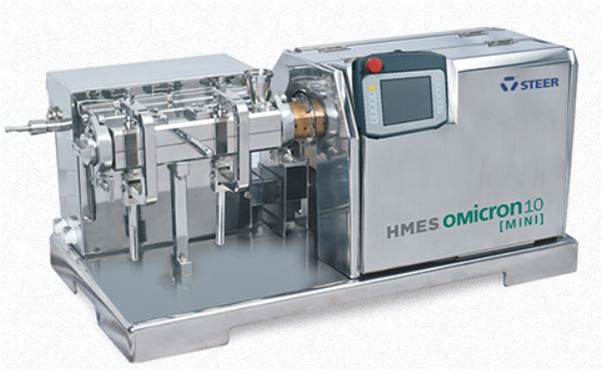
Fig. 3: HME lab model: omicron 10 [mini] equipment
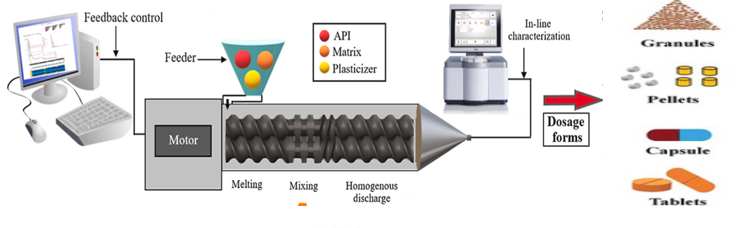
Fig. 4: Schematic diagram HME
Characterization of ticagrelor ASD and its tablet formulation
Powder X-ray diffraction (P-XRD)
The API and solid dispersions formulations were analysed for form conversion by p-XRD. The p-XRD patterns of the samples were recorded using the Rigaku Miniflex 600 XRD System (Tokyo, Japan). The samples were scanned from 5° to 120° with an increment of 5°/min (diffraction angle 2 Theta) [12].
Differential scanning calorimetry (DSC)
Thermograms of The API and solid dispersions formulations were evaluated by a DSC N-60 thermal analyser (Scinco, Seoul, Korea). DSC thermogram was recorded under nitrogen and heating conditions ranging from 0 to 350 °C at a heating rate of 10 °C/min [12].
Solubility study by HPLC
The comparative solubility of the plain ticagrelor API and ticagrelor amorphous solid dispersion (ASD) formula F-2 was carried out in water, 0.1 N HCl and pH 6.8 potassium phosphate buffer. The samples were analysed by HPLC and data compiled in below table 8.
Assay by HPLC
Test solution preparation for solid dispersion: ASD, equivalent to 60 mg of ticagrelor, was dissolved in 25 ml of methanol. Filter the solution through a 0.45 µ syringe filter.
The filtered solution of ticagrelor was quantified with HPLC system at 270 nm.
Table 2: Factors and levels of 32 full factorial DoE for ticagrelor ternary ASD
| Factor (X) | Type | Levels (mg/unit) | Levels (Ratio of ticagrelor: factor) | ||||
| Independent variables | Low (-1) | Medium (0) | High (+1) | Low | Medium | High | |
| Factor X1 HPMC-AS (mg) | Continuous | 60.0 | 120.0 | 180.0 | 1:1 | 1:2 | 1:3 |
| Factor X2 Poloxamer (mg) | Continuous | 15.0 | 30.0 | 45.0 | 1:0.25 | 1:0.50 | 1:0.75 |
Table 3: Responses evaluated and goals
| Responses (Dependent variables) | Constraint | Goal |
| Response Y1 % Dissolution at 10 min | NLT 80 % | Maximize |
| Response Y2 % Dissolution at 20 min | NLT 95 % | Maximize |
Table 4: Composition of ticagrelor solid dispersion-based tablets of DoE trials by HME
| Formula batches/Runs | F-1 | F-2* | F-3 | F-4 | F-5 | F-6 | F-7* | F-8 | F-9 | F-10 |
| Intra-granular Ingredients | Quantity (mg/tablet) | |||||||||
| Ticagrelor (Crystalline) | 60.0 | 60.0 | 60.0 | 60.0 | 60.0 | 60.0 | 60.0 | 60.0 | 60.0 | 60.0 |
| HPMC-AS (AquaSolve-LG) | 120.0 | 120.0 | 60.0 | 180.0 | 180.0 | 120.0 | 120.0 | 60.0 | 180.0 | 60.0 |
| Poloxamer (Kolliphor RH188) | 45.0 | 30.0 | 45.0 | 15.0 | 45.0 | 15.0 | 30.0 | 15.0 | 30.0 | 30.0 |
| Magnesium aluminium metasilicate | 10.0 | 10.0 | 10.0 | 10.0 | 10.0 | 10.0 | 10.0 | 10.0 | 10.0 | 10.0 |
| Solid Dispersion HME Granules | 235.0 | 220.0 | 175.0 | 265.0 | 295.0 | 205.0 | 220.0 | 145.0 | 280.0 | 160.0 |
| Mannitol (Pearlitol SD 200) | 105.0 | 120.0 | 165.0 | 75.0 | 45.0 | 135.0 | 120.0 | 195.0 | 60.0 | 180.0 |
| Sodium starch glycolate | 7.0 | 7.0 | 7.0 | 7.0 | 7.0 | 7.0 | 7.0 | 7.0 | 7.0 | 7.0 |
| Magnesium stearate | 3.0 | 3.0 | 3.0 | 3.0 | 3.0 | 3.0 | 3.0 | 3.0 | 3.0 | 3.0 |
| Tablet weight | 350.0 | 350.0 | 350.0 | 350.0 | 350.0 | 350.0 | 350.0 | 350.0 | 350.0 | 350.0 |
*Centre point batches
In vitro dissolution study
An in vitro dissolution study of ticagrelor tablet formulations was carried out in dissolution tester (Electrolab TDT-08 L instrument) using the paddle (USP II apparatus) run at 50 RPM in 900 ml of pH 6.8 Potassium phosphate buffer.
RESULTS AND DISCUSSION
Powder X-ray diffraction (P-XRD)
The P-XRD pattern of pure crystalline ticagrelor and its amorphous solid dispersion prepared with HPMC-AS are shown in fig. 5 and 6 respectively. Pure ticagrelor has shown sharp crystalline peaks of 2θ at 13.4°, 18.2°, 22.5° and 24.2°, whereas all the crystalline peaks were not observed in the solid dispersion sample, which indicates complete conversion of the input crystalline ticagrelor into an amorphous form. The comparative P-XRD pattern for crystalline pure ticagrelor and its amorphized solid dispersion samples has been discussed by Panda R et al. using solvent evaporation technique [12].
Differential scanning calorimetry (DSC)
The DSC thermograms of pure ticagrelor and ticagrelor solid dispersion are presented in fig. 7 and 8. The melting and crystallization temperatures of ticagrelor API are indicated by the endothermic peak at 139.77 °C. However, glass transition temperature (Tg) of the ticagrelor solid dispersion sample indicated by the endothermic peak at 74.21 °C confirming amorphous conversion of ticagrelor [12, 17].
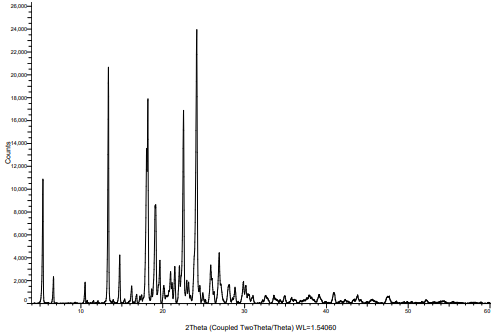
Fig. 5: P-XRD pattern of input crystalline ticagrelor API
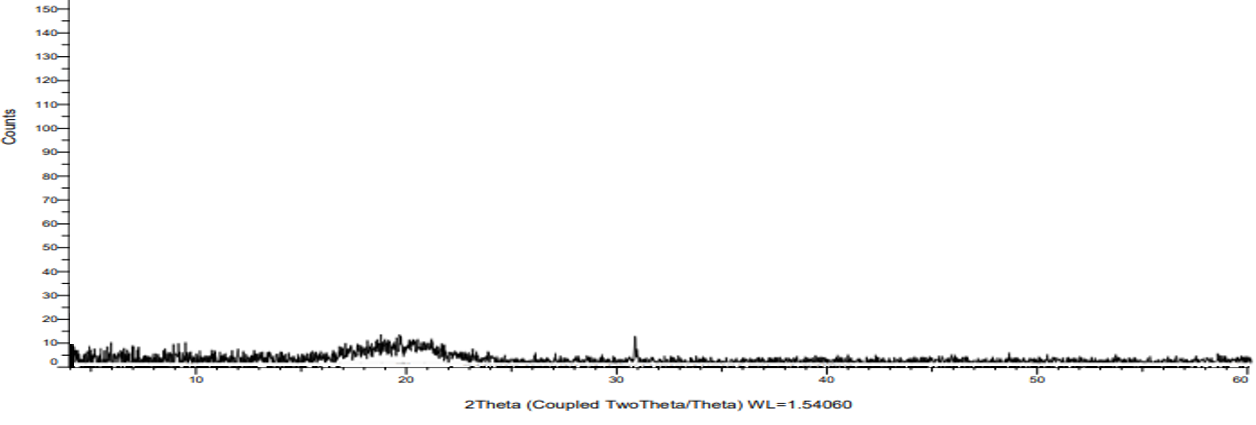
Fig. 6: P-XRD pattern of ticagrelor in ASD by HME
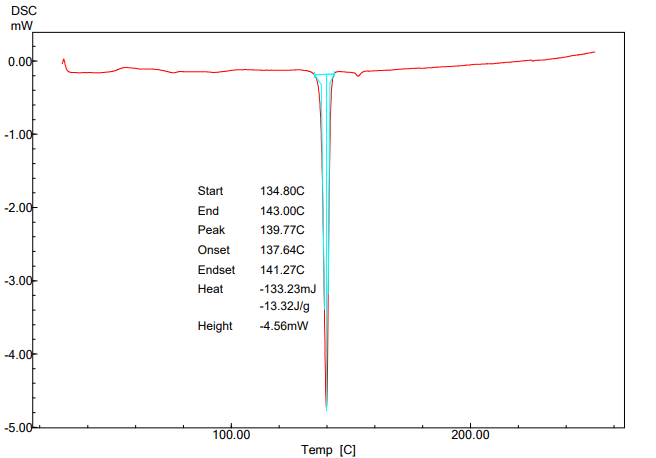
Fig. 7: DSC thermogram of pure ticagrelor API
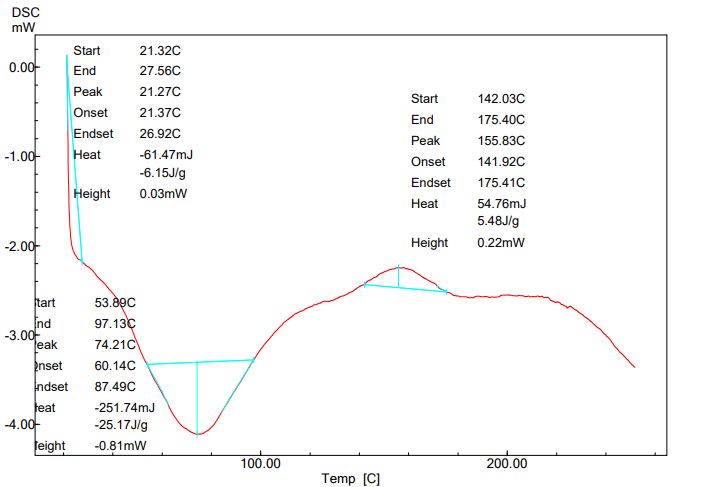
Fig. 8: DSC thermogram of ticagrelor ASD
Saturation solubility results
A significant increase in the solubility of ticagrelor from ASD formulation F-2 was observed compared to pure drug in water and across the physiological pH buffers. This can be attributed to multiple mechanisms like amorphization of crystalline drug by HME process. Improvement in the wettability of the hydrophobic ticagrelor particle by surfactant while supersaturation solubility maintained in buffers shall be attributed to the of polymeric carrier formulated as ternary ASD system [9, 10, 22].
Comparative in vitro dissolution by UV
The optimized ticagrelor ASD (1:2:0.5 ratio) formulation F-2 has shown about 8 fold increase in dissolution in pH 6.8 Phosphate buffer compared to conventional immediate release tablets (BRILINTA® 60 mg) as presented in table 6 and fig. 9.
Table 5: Comparative solubility of plain ticagrelor and ticagrelor ASD formula
| S. No. | Formulation | % Assay | Solubility (mg/ml) | ||
| Media used | -- | Distilled water | 0.1 N HCl | pH 6.8 phosphate buffer | |
| 1. | Ticagrelor (Plain drug) | -- | 0.0036±3.2 | 0.0082±4.3 | 0.0063±4.1 |
| 2. | ASD Formula F-2 | 98.7±1.4 | 4.3053±2.7 | 3.9930±1.5 | 4.6721±2.6 |
% assay and solubility data presented as mean (n=3)±SD, where n is the number of observations.
Table 6: Comparative dissolution of conventional ticagrelor tablets 60 mg (BRILINTA®) and optimized ASD tablets F-2 in pH 6.8 phosphate buffer
| Formulation batches | Conventional tablets (Brilinta®60 mg Mfg. by Astra Zeneca) | Ticagrelor ASD tablets (formula F-2) |
| Time | % dissolution±SD | % dissolution±SD |
| 10 min | 11.3±3.4 | 90.5±2.3 |
| 20 min | 12.1±4.1 | 97.5±2.5 |
| 30 min | 13.0±3.8 | 101.3±1.7 |
| 40 min | 13.3±4.0 | 99.2±1.2 |
| 50 min | 14.2±3.3 | 101.6±1.4 |
| 60 min | 14.4±2.2 | 101.3±0.8 |
Dissolution data presented as mean (n=6)±SD, where n is the number of observations.
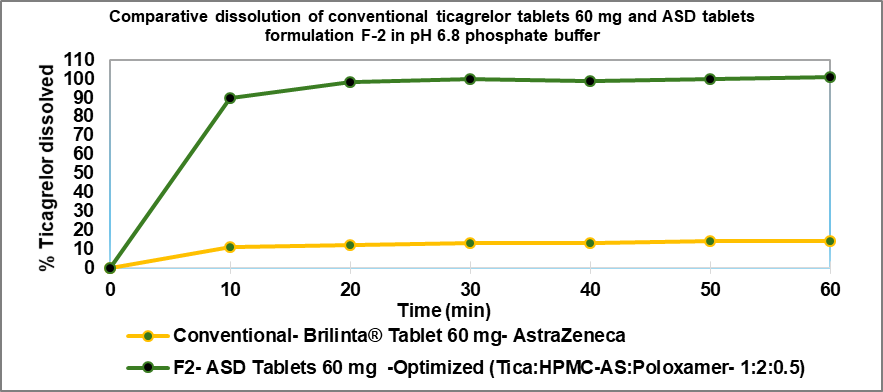
Fig. 9: Comparative dissolution profile of conventional tablet (Brilinta® 60 mg) and optimized ticagrelor ASD tablet F-2 by HME technique. Dissolution data presented as mean (n=6)±SD, where n is the number of observations
Evaluation of DoE and summary of statistical analysis
The data from all 10 DoE runs was fitted to a quadratic model for assessing their statistical significance by employing one-way ANOVA. The fit statistics for the quadratic model were evaluated. 3D plots were designed to explain the combined effect of every independent variable on an individual dependent variable. The statistical parameters such as model p-values, lack of fit, coefficient of determination (R2), adjusted R2, and adequate precision provided by ANOVA. The desirability function was analysed for the optimization of factors associated with desirable responses after the fitting of the statistical model.
Table 7: Experimental results of the DoE study with levels of factors and responses
| Formula batches/Runs | F-1 | F-2 | F-3 | F-4 | F-5 | F-6 | F-7 | F-8 | F-9 | F-10 |
| ASD ratio (Tica: HPMC-AS: Poloxamer) | 1:2:0.75 | 1:2:0.50 | 1:1:0.75 | 1:3:0.25 | 1:3:0.75 | 1:2:0.25 | 1:2:0.50 | 1:1:0.25 | 1:3:0.50 | 1:1:0.50 |
| Factor X1 HPMC-AS (mg) | 120.0 | 120.0 | 60.0 | 180.0 | 180.0 | 120.0 | 120.0 | 60.0 | 180.0 | 60.0 |
| Factor X2 Poloxamer (mg) | 45.0 | 30.0 | 45.0 | 15.0 | 45.0 | 15.0 | 30.0 | 15.0 | 30.0 | 30.0 |
| Response Y1 % Disso-10 min | 93.4±1.3 | 90.5±2.3 | 79.2±4.3 | 81.6±2.3 | 90.4±3.6 | 85.2±4.7 | 91.0±2.1 | 71.8±4.4 | 87.0±3.0 | 76.2±4.7 |
| Response Y2 % Disso-20 min | 98.1±0.8 | 97.5±2.5 | 92.8±1.5 | 95.1±1.3 | 94.9±2.0 | 92.3±2.5 | 97.2±1.8 | 84.3±3.6 | 95.1±2.1 | 90.4±2.3 |
Dissolution data presented as mean (n=6)±SD, where n is the number of observations.
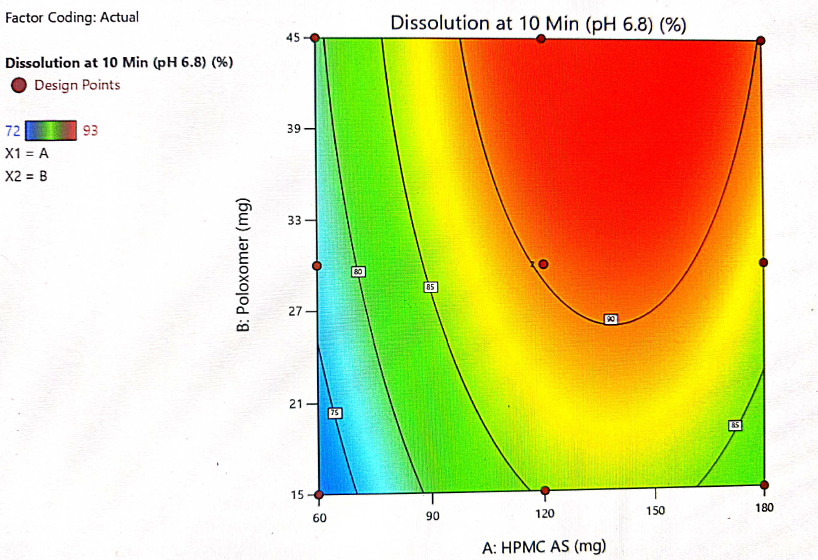
Fig. 10: Contour plot showing the interaction of HPMC-AS and poloxamer and their impact on dissolution at 10 min
Table 8: Summary of model fitting and statistical analysis (Response Y1 and Y2)
| Source | R1: Dissolution at 10 min | R2: Dissolution at 20 min |
| Model | Quadratic | Quadratic |
| Model p-value | 0.0001 | 0.0024 |
| Lack of fit p-value | 0.8249 | 0.3470 |
| R2 | 0.9972 | 0.9452 |
| Adjusted R2 | 0.9950 | 0.9013 |
| Predicted R2 | 0.9900 | 0.8090 |
| Adequate Precision | 61.3058 | 15.2843 |
| Standard Deviation | 0.4976 | 1.34 |
| Mean | 84.50 | 93.70 |
| C. V. % | 0.5889 | 1.43 |
Table 9: ANOVA for the quadratic model selected (Response Y1)
| Source | Sum of squares | df | Mean square | F-value | p-value | |
| Model | 445.26 | 4 | 111.32 | 449.54 | 0.0001 | Significant |
| A-HPMC-AS | 170.67 | 1 | 170.67 | 689.23 | 0.0001 | |
| B-Poloxamer | 88.17 | 1 | 88.17 | 356.06 | 0.0001 | |
| A2 | 171.43 | 1 | 171.43 | 692.31 | 0.0001 | |
| B2 | 2.68 | 1 | 2.68 | 10.82 | 0.0217 | |
| Residual | 1.24 | 5 | 0.2476 | |||
| Lack of fit | 0.7381 | 4 | 0.1845 | 0.3690 | 0.8259 | Not significant |
| Pure error | 0.5000 | 1 | 0.5000 |
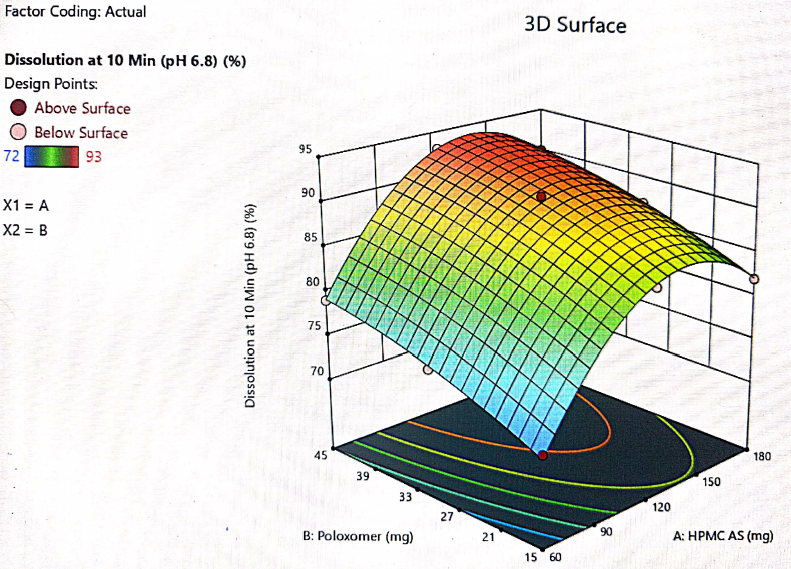
Fig. 11: 3D plot for the interaction of HPMC-AS and poloxamer and their impact on dissolution at 10 min
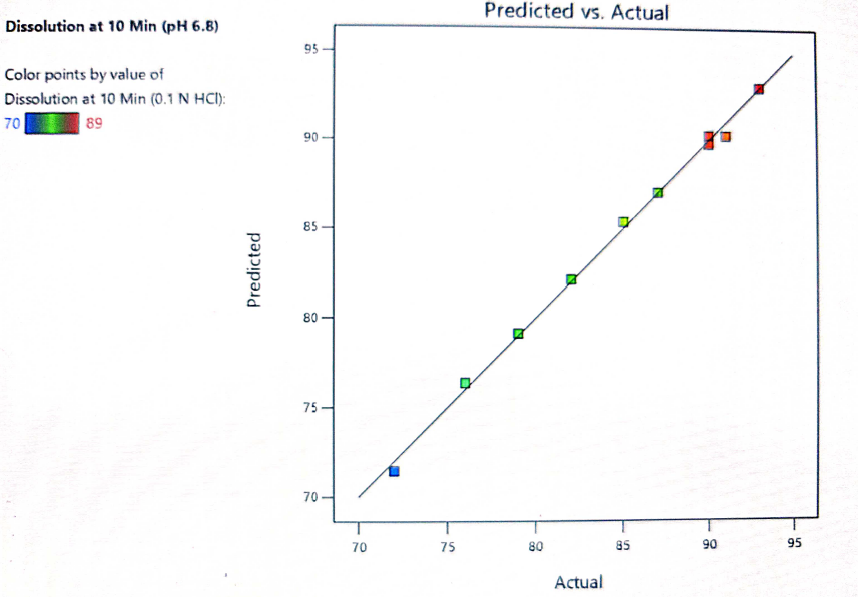
Fig. 12: Predicted vs. actual response for dissolution at 10 min
Table 10: ANOVA for a selected quadratic model (Response Y2)
| Source | Sum of squares | df | Mean square | F-value | p-value | |
| Model | 155.10 | 4 | 38.78 | 21.54 | 0.0024 | Significant |
| A-HPMC-AS | 54.00 | 1 | 54.00 | 30.00 | 0.0028 | |
| B-Poloxamer | 37.50 | 1 | 37.50 | 20.83 | 0.0060 | |
| AB | 20.25 | 1 | 20.25 | 11.25 | 0.0202 | |
| A2 | 43.35 | 1 | 43.35 | 24.08 | 0.0044 | |
| Residual | 9.0 | 5 | 1.8 | |||
| Lack of fit | 8.5 | 4 | 2.12 | 4.25 | 0.3470 | Not significant |
| Pure error | 0.5000 | 1 | 0.5000 |
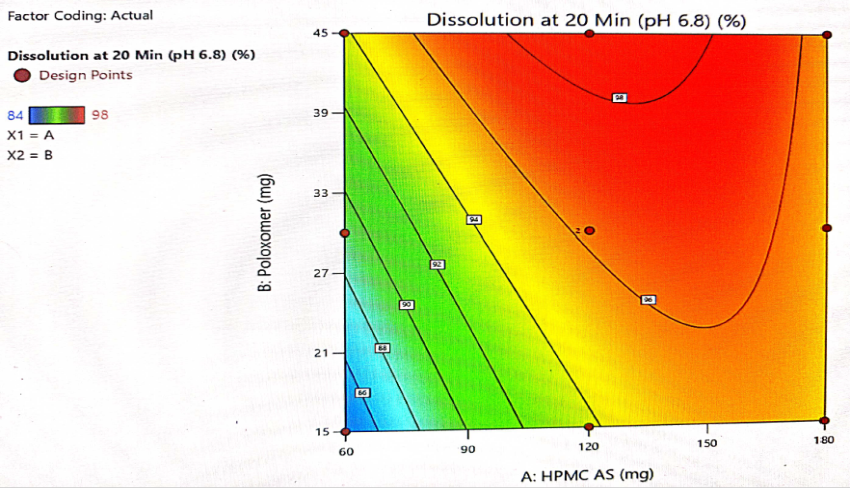
Fig. 13: Contour plot for interaction of HPMC-AS and poloxamer and its impact on dissolution at 20 min
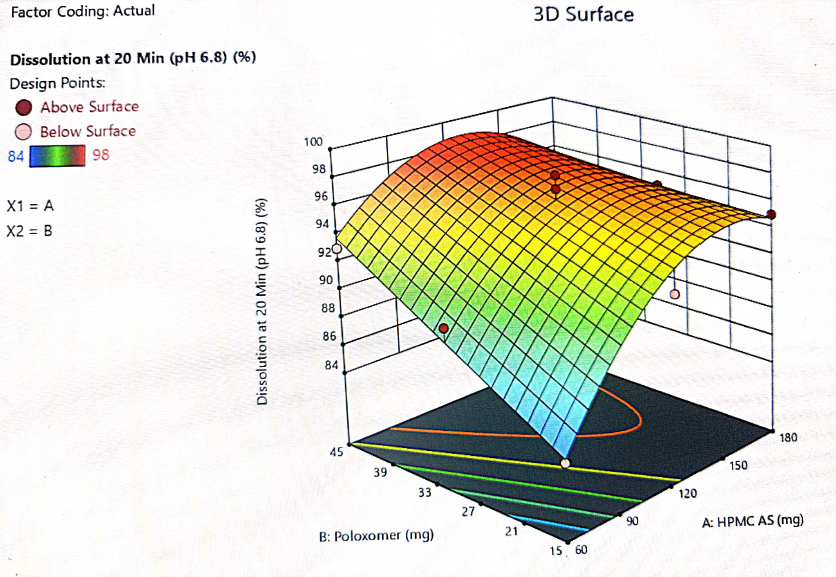
Fig. 14: 3D plot for the interaction of HPMC-AS and poloxamer and their impact on dissolution at 20 min
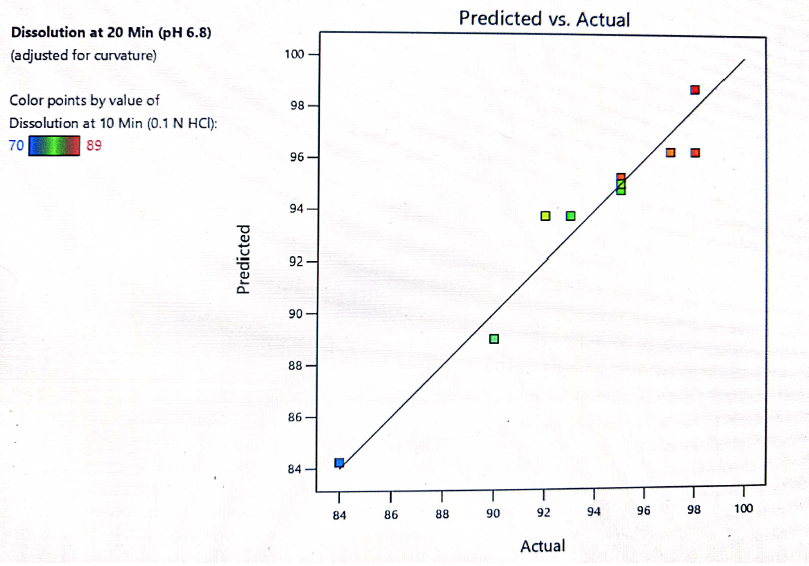
Fig. 15: Predicted vs. actual response for dissolution at 10 min
The optimization of the critical factors and design space evaluation of the responses Y1: dissolution at 10 min and Y2: dissolution at 20 min is presented in table 11 and overlay plot as fig. 16. The model was found to be significant for both the responses based on p-values less than 0.050 and the insignificant lack of fit p-values 0.8249 and 0.3470 i. e. more than 0.050 (table 8). The impact of the level of both HPMC-AS and poloxamer on dissolution at 10 min was found to be significant and an interaction is represented by a non-linear response, as presented in 3D plots (fig. 11 and 14).
The formulation was optimized based on the desirability and chosen levels of independent variables from the overlay plot and the validity of the optimization DoE model was done by testing optimized formula F-2. Table 11 shows the predicted (computed) and observed (experimental) values of the responses. The difference between model predicted and observed values was insignificant showing the DoE model has been used to achieve the desired dissolution response to optimize the levels of both independent variables. The response surface model (RSM) was validated by the strong agreement between the predicted and observed experimental values as presented in fig. 15.
Table 11: Predicted and observed values of optimized formula for model validation
| Parameter | Optimized formula F-2 | Predicted value | Observed value |
| Factor X1 HPMC-AS (mg) | 120 mg | -- | -- |
| Factor X2 Poloxamer (mg) | 30 mg | -- | -- |
| Response Y1 % Dissolution at 10 min | NLT 80 % (Constraint) | 89±3.5 | 90±2.3 |
| Response Y2 % Dissolution at 20 min | NLT 95 % (Constraint) | 97±2.8 | 98±2.5 |
Dissolution data presented as mean (n=6)±SD, where n is the number of observations.
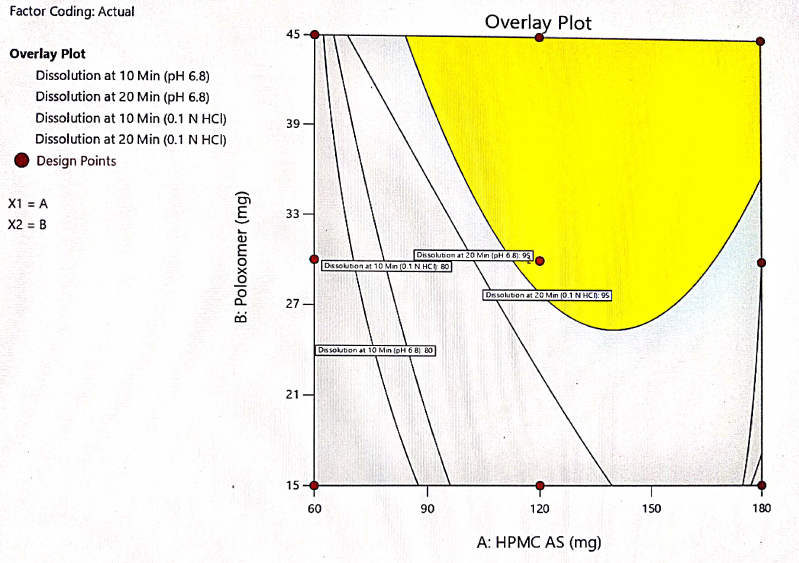
Fig. 16: Overlay plot for design space of both factors vs response
Stability study: physico-chemical characterization of optimized ticagrelor ASD tablets
The stability studies were conducted to ensure the physical and chemical stability of the developed ASD formulation. Formula F-2 tablets were placed in HDPE bottle inside the stability chamber at accelerated condition (40 °C/75% RH) for 3 mo. The tablets were evaluated for assay, dissolution at 10 and 20 min, P-XRD, Disintegration time (DT) and hardness and the comparative results are presented in table 12. All the tested parameters did not show any significant change compared to initial values even after 3 mo storage at 40 °C/75% RH.
Table 12: Physico-chemical characterization of optimized ticagrelor ASD tablets
| Ticagrelor ASD tablets 60 mg (Formula F-2) | Assay (%) | Dissolution at 10 min (%) | Dissolution at 20 min (%) | pXRD | DT (min) | Hardness (Kp) |
| Initial | 98.7 | 90.5±2.3 | 97.5±2.5 | No crystalline sharp peaks exhibited at 2θ = 13.4°, 18.2°, 22.5°, 24.2° | 2:30±2.1 | 8.4±1.3 |
| 3 mo/40 ℃,75 % RH | 99.2 | 89.5±1.6 | 99.2±1.1 | No crystalline sharp peaks exhibited at 2θ = 13.4°, 18.2°, 22.5°, 24.2° | 2:00±1.0 | 7.9±2.2 |
Dissolution, DT and Hardness data presented as mean (n=6)±SD, where n is the number of observations.
CONCLUSION
The input crystalline ticagrelor found to be completely amorphized, as confirmed by the P-XRD and DSC results of API and amorphous solid dispersion formulation prepared by HME technique. A significant increase in the solubility of ticagrelor from ASD sample was achieved compared to pure crystalline drug. An ~8 fold increase in ticagrelor dissolution was achieved from optimized ternary ASD tablets compared to marketed conventional Brilinta® (ticagrelor) tablets 60 mg. The significant enhancement in solubility and dissolution rate can be attributed to mechanisms like amorphization of crystalline drug and improvement in the wettability of the hydrophobic ticagrelor particle by surfactant poloxamer 188 and molecular stabilization of amorphized ticagrelor with polymeric carrier HPMC-AS.
The final prototype ternary ASD formulation of ticagrelor: HPMC-AS and poloxamer was optimized by employing DoE using quadratic model. A stable ASD formulated tablets of ticagrelor was successfully prepared by solvent free, safe and rapid process using hot melt extrusion lab model machine. However, scale-up, validation and in vivo studies in animals are required for the successful translation of this formulation and process from lab scale to industrial scale.
FUNDING
Nil
AUTHORS CONTRIBUTIONS
Rajesh Giradkar planned and performed the experimentation, data collection and drafted the manuscript. Janaki Devi Sirisolla has supervised the work, findings and reviewed the manuscript.
CONFLICT OF INTERESTS
The authors declare that, they have no conflict of interests.
REFERENCES
Kansara H, Panola R, Mishra A. Techniques used to enhance bioavailability of BCS class II drugs: a review. Int J Drug Dev Res. 2015;7(1):82-93.
Leuner C, Dressman J. Improving drug solubility for oral delivery using solid dispersions. Eur J Pharm Biopharm. 2000;50(1):47-60. doi: 10.1016/s0939-6411(00)00076-x, PMID 10840192.
Food and Drug Administration. Drug approval package: brilinta (ticagrelor) NDA #022433. Available online: https://www.accessdata.fda.gov/drugsatfda_ docs/nda/2011/022433orig1s000toc.cfm. [Last accessed 17 Jul 2023].
He Y, Ho C. Amorphous solid dispersions: utilization and challenges in drug discovery and development. J Pharm Sci. 2015;104(10):3237-58. doi: 10.1002/jps.24541, PMID 26175316.
Guo Y, Luo J, Tan S, Otieno BO, Zhang Z. The applications of vitamin E TPGS in drug delivery. Eur J Pharm Sci. 2013;49(2):175-86. doi: 10.1016/j.ejps.2013.02.006, PMID 23485439.
Guzman H, Tawa M, Zhang Z, Ratanabanangkoon P, Shaw P, Mustonen P. A “spring and parachute” approach to designing solid celecoxib formulations having enhanced oral absorption. AAPS J. 2004;6:T2189.
Yadav M, Sarolia J, Vyas B, Lalan M, Mangrulkar S, Shah P. Amalgamation of solid dispersion and melt adsorption technique: improved in vitro and in vivo performance of ticagrelor tablets. AAPS PharmSciTech. 2021;22(8):257. doi: 10.1208/s12249-021-02138-z, PMID 34676463.
Kim SJ, Lee HK, Na YG, Bang KH, Lee HJ, Wang M. A novel composition of ticagrelor by solid dispersion technique for increasing solubility and intestinal permeability. Int J Pharm. 2019;555:11-8. doi: 10.1016/j.ijpharm.2018.11.038, PMID 30448313.
Ghebremeskel AN, Vemavarapu C, Lodaya M. Use of surfactants as plasticizers in preparing solid dispersions of poorly soluble API: selection of polymer-surfactant combinations using solubility parameters and testing the processability. Int J Pharm. 2007;328(2):119-29. doi: 10.1016/j.ijpharm.2006.08.010, PMID 16968659.
Vasconcelos T, Sarmento B, Costa P. Solid dispersions as strategy to improve oral bioavailability of poor water soluble drugs. Drug Discov Today. 2007;12(23-24):1068-75. doi: 10.1016/j.drudis.2007.09.005, PMID 18061887.
Jamal M, El J, Azza A, Gazy A. Analysis of three cardiovascular drugs in their ternary mixture using green analytical methodology of smart spectrophotometric methods and RP-HPLC method. Int J Pharm Pharm Sci. 2016;8(8):243-50.
Panda R, Lankalapalli S. Design of experiments and optimization of amorphous solid dispersion of a BCS Class IV anti-platelet drug through factorial design. Int J App Pharm. 2023;15(6):353-64. doi: 10.22159/ijap.2023v15i6.48767.
Bueno LM, Manoel JW, Giordani CF, Mendez AS, Volpato NM, Schapoval EE. HPLC method for simultaneous analysis of ticagrelor and its organic impurities and identification of two major photodegradation products. Eur J Pharm Sci. 2017;97:22-9. doi: 10.1016/j.ejps.2016.11.004, PMID 27816632.
Dissolution Methods Database. United States Food and Drug Administration. Available from: http://www.accessdata.fda.gov/scripts/cder/dissolution/index.cfm. [Last accessed on 17 Jun 2023].
Vojinovic T, Medarevic D, Vranic E, Potpara Z, Krstic M, Djuris J. Development of ternary solid dispersions with hydrophilic polymer and surface adsorbent for improving dissolution rate of carbamazepine. Saudi Pharm J. 2018;26(5):725-32. doi: 10.1016/j.jsps.2018.02.017, PMID 29991917.
Gupta MK, Tseng YC, Goldman D, Bogner RH. Hydrogen bonding with adsorbent during storage governs drug dissolution from solid-dispersion granules. Pharm Res. 2002;19(11):1663-72. doi: 10.1023/a:1020905412654, PMID 12458672.
Chokshi RJ, Zia H, Sandhu HK, Shah NH, Malick WA. Improving the dissolution rate of poorly water soluble drug by solid dispersion and solid solution: pros and cons. Drug Deliv. 2007;14(1):33-45. doi: 10.1080/10717540600640278, PMID 17107929.
Chiou WL, Riegelman S. Pharmaceutical applications of solid dispersion systems. J Pharm Sci. 1971;60(9):1281-302. doi: 10.1002/jps.2600600902, PMID 4935981.
Tambosi G, Coelho PF, Luciano S, Lenschow IC, Zétola M, Stulzer HK. Challenges to improve the biopharmaceutical properties of poorly water-soluble drugs and the application of the solid dispersion technology. Materia (Rio J). 2018;23(4). doi: 10.1590/s1517-707620180004.0558.
Tan DK, Davis DA, Miller DA, Williams RO, Nokhodchi A. Innovations in thermal processing: hot-melt extrusion and KinetiSol® dispersing. AAPS PharmSciTech. 2020;21(8):312. doi: 10.1208/s12249-020-01854-2, PMID 33161479.
Kala SG, Chinni S. Development and characterization of venetoclax nanocrystals for oral bioavailability enhancement. AAPS PharmSciTech. 2021;22(3):92. doi: 10.1208/s12249-021-01968-1, PMID 33683477.
Farooqui P, Gude R. Formulation development and optimisation of fast dissolving buccal films loaded glimepiride solid dispersion with enhanced dissolution profile using central composite design. Int J Pharm Pharm Sci. 2023;15(6):35-54. doi: 10.22159/ijpps.2023v15i6.47992.