
Int J App Pharm, Vol 17, Issue 3, 2025, 157-169Original Article
DEVELOPMENT OF HYDROGEL FORMULATIONS OF SELECTED ANTIFUNGAL DRUGS USING CYCLODEXTRIN BASED NANOSPONGES AS A CARRIER
MD APSAR PASHA1*, SEEMA TOMAR1, KIRAN KUMAR Y.2
1*Faculty of Pharmaceutical Sciences, Motherhood University, Roorkee, Uttarakhand-247661, India. 2Department of Pharmaceutics, Gate Institute of Pharmaceutical Sciences, Ramapuram (V), Kodad, Chilkuru (M), Nalgonda (D), Chilkuru, Suryapet-508206, Telangana, India
*Corresponding author: Md Apsar Pasha; *Email: farhanpharma2@gmail.com
Received: 10 Dec 2024, Revised and Accepted: 14 Feb 2025
ABSTRACT
Objective: This project will construct a Cyclodextrin-Based Nanosponge (CDNS) gel and test its topical skin application to improve Posaconazole's (PO) therapeutic impact, distribution, and preservation.
Methods: Using convection heating, Cyclodextrin (CDs) (β-CD, 2-HP-β-CD, and SBE-β-CD) were employed to crosslink diphenylcarbonate Nanosponge (NS). Make Posaconazole-Loaded Nanosponges (PONS) by freeze-drying. Box–Behnken Experimental Design (BBD) was used to formulate Carbopol 974 (1–3%, w/w), Propylene glycol (5–10%), and ethanol (10–20%, w/w). The relationship between procedural parameters and quality factors was examined using statistical screening. Analysis of Variance (ANOVA) was used for pilot studies. Key techniques affect contour, Response Surface Methodology (RSM), and perturbation graph quality measures.
Results: The average particle size of plain NS was 120–220 nm, while PO loaded ones were 48–51 nm with low Polydispersity Index (PDI). High Zeta Potential (ZP) suggests stable, low-agglomeration chemicals. The formulation demonstrated strong encapsulation efficiency (85.78±4.13%) with a viscosity range of 3476.34±213.12 to 3538.28±164.24 and showed 14% degradation over three months. All test formulations exhibited significantly higher PO skin penetration 12 h post-application (range: 41.64±1.72 μg/cm² to 54.12±1.89 μg/cm²) compared to the control group (5.68±0.23 μg/cm²). In vitro release tests indicated NS complexes released medicines faster than pure medications. PONS3, PONS7, and PONS12 with controlled release were chosen for topical hydrogel research due to their effective PO release regulation. NS resisted photodegradation and chemical degradation of PO for 6 mo. Model carbopol gel with NS compositions tested skin permeability, antifungal efficacy, and stability. PONS steadily permeated rat skin for 12 h.
Conclusion: The slow drug release, greater skin penetration, and superior storage stability of the gel formulation based on CDNS of PO imply that it has great potential as a topical delivery system.
Keywords: Posaconazole, Box-behnken design, Nanosponges, Freeze drying, Inclusion complex, Skin permeability
© 2025 The Authors. Published by Innovare Academic Sciences Pvt Ltd. This is an open access article under the CC BY license (https://creativecommons.org/licenses/by/4.0/)
DOI: https://dx.doi.org/10.22159/ijap.2025v17i3.52303 Journal homepage: https://innovareacademics.in/journals/index.php/ijap
INTRODUCTION
The strong antifungal Posaconazole (PO) treats and prevents many fungal infections. It inhibits fungal growth as a triazole antifungal. This medicine treats invasive fungal infections caused by Aspergillus, Candida, and Zygomycetes. It also prevents fungal infections in immunocompromised patients experiencing chemotherapy or bone marrow replacement [1, 2]. PO inhibits ergosterol synthesis, a key component of fungal cell membranes like cholesterol in humans. PO makes fungal cell membranes more permeable by blocking ergosterol formation, killing them. PO inhibits ergosterol production and accumulates harmful sterol intermediates by binding to this enzyme [3-5]. PO comes in oral solution, delayed-release tablets, and intravenous injection [6-8]. The oral suspension formulation is well-tolerated and bioavailable, although it needs a high-fat meal or nutritional supplement to absorb fully. Dietary restrictions may make this difficult. The 100-mg delayed-release tablet is an alternative to the oral suspension. As effective as the oral suspension, it doesn't require high-fat meals. However, its decreased bioavailability and twice-daily dose may be inconvenient for some patients. Formulation problems include medication adherence, drug interactions, and regular adverse effect monitoring [9-12].
Innovative PO formulations with solubilizing chemicals or unique technologies like nanoemulsions, solid lipid nanoparticles, and lipid-polymer hybrid nanoparticles need more study to improve solubility and bioavailability [13-17]. Controlled-release formulations may sustain therapeutic medication levels for a long time, requiring further investigation. Palatability, simplicity of administration, and optimal drug exposure are sought in paediatric formulations. Finally, study into PO formulation stability, shelf-life, and drug stability and degradation under different storage settings is essential [18].
Several research has examined Cyclodextrin (CD)-based formulations to increase PO solubility and absorption [19]. In 2017 AAPS PharmSciTech study examined how various CDs could increase PO solubility and stability. A study indicated that methyl-β-CD has the maximum solubility and stability of PO, suggesting it could be a feasible technique for generating superior formulations [20]. A new formulation of PO combines CD and NS to improve solubility and bioavailability. Drug-delivering Nanosponge (NS) are porous, cross-linked polymers. They entrap hydrophobic medicines like PO, enhancing solubility and bioavailability due to their high surface area. A new hydrogel formulation of PO using Cyclodextrin-Based Nanosponge (CDNS) improves solubility and bioavailability [21-23].
The proposed research on a CDNS-based hydrogel formulation of PO aims to improve its solubility, bioavailability, and therapeutic efficacy for fungal infections and wound healing [24].
MATERIALS AND METHODS
Materials
Gangwal Chemicals Pvt. Ltd. (Mumbai, India) provided gift samples of β-CD, 2-Hydroxypropyl (HP) β-CD, Sulfobutyl ether (SBE)-β-CD and Diphenyl carbonate came from Sigma Aldrich (Milan, Italy). All additional substances and reagents were analytical. Mili Q water (Millipore) was utilized during experiments. Hyderabad-based Hetero Labs supplied PO. Mumbai-based S. D. Fine Chem. supplied Carbopol 934, propylene glycol, triethanolamine, and N-methyl-2-pyrrolidone.
Methods
Preparation of CDNS using different CD
A method was used to precisely prepare 15 variations of CDNS [25]. Various CD, including β-CD, 2-HP β-CD, and SBE-β-CD, were used with diphenylcarbonate as a crosslinking agent. Anhydrous β-CD, 2-HP β-CD, or SBE-β-CD remained dissolved in di methyl formamide. Diphenylcarbonate was added to this reaction blend, which was refluxed in an oil bath at 90 °C with constant stirring for 6 h. The reaction mixture was rinsed with water and filtered by soxhlet extraction with ethanol for up to 4 h. Grinding followed by overnight oven drying at 60 °C of the white powder. The fine powder from this grinding process was spread in water, and the colloidal component was collected and lyophilized. The NS were vacuum-dried and kept at 25 °C for use. The NS were characterised in terms of particle size distribution, Zeta Potential (ZP), Fourier Transform Infrared Spectroscopy (FTIR), Differential Scanning Calorimetry (DSC), and X-ray Diffraction (XRD), and solubility efficiency.
Preparation of PONS
As described [26], freeze-dried drug-loaded NS were made. Using a magnetic stirrer, accurately weighed NS were suspended in 50 ml of Milli Q water, the surplus Drug was added, and the blend was sonicated for 10 min and stirred for 24 h. The uncomplexed medication was isolated as a depositunder the colloidal supernatant after 10 min of centrifugation at 2,000 rpm. A LARK INDIA lyophilizer freeze-dried the supernatant at-20 °C and 13.33 mbar. A desiccator held the dried powder.
Physico-chemical characterization of drug-loaded NS
Determination of EE and percent drug loading in NS
Encapsulation Efficiency (EE) is the ratio of drug weight entrapped in a carrier system to drug added. Drug loading is drug weight/carrier system weight [27]. PONS complex was added in methanol, sonicated for 10 min to breakdown it, diluted, and examined by UV spectrophotometer at 263.12 nm to know its concentration. The "percent drug pay load" and "percent drug EE" were computed using equations 1 and 2:


Particle size, PDI, and ZP determination
A Mastersizer 2000 was used to observe the formulation's particle size distribution size range and homogeneity. We diluted the samples with Milli Q water for each measurement. The ZP was measured using a Zetasizer. The use of a flawless disposable zeta cell kept the instrument at 25 °C. After averaging the three data, cumulant analysis computed the particles' mean hydrodynamic diameter (Dh) and Polydispersity Index (PDI).
Transmission electron microscopy (TEM)
PONS and their morphology were examined using TEM. On a film-coated copper grid, one drop of diluted drug-loaded nanoparticle suspension was marked with one drop of 2% (w/v) phosphor-tungstic acid aqueous solution and permitted to dry for contrast enrichment. The models were investigated using TEM at 72000 magnifications.
FTIR spectroscopy
FTIR spectra of drug, β-CD, plain NS, and drug-loaded samples were analysed using a Tensor 27 FTIR Spectrophotometer in the 4000-600 cm−1 range utilizing the potassium bromide.
DSC
Drug, plain NS, and drug-loaded NS complexes were studied using a Perkin Elmer DSC/7 differential scanning calorimeter, with a TAC 7/DX instrument controller. The device was standardized for melting point and fusion heat with indium. The 30-400 °C temperature range was heated at 10 °C/min. Perkin-Elmer aluminium model pans were utilised, with ablank pan as a reference. Samples of 5 mg were analysed in triplicate below nitrogen purge.
XRPD
Powder diffraction patterns of Drug, plain NS, and drug-loaded NS complexes were checked using a Bruker D8 Advance X-ray diffractometer at 5°/min in the 2.5°-60° 2θ range.
In vitro release of drug from NS formulations
The in vitro release investigation used multi-compartment (n=6) rotating cells with a dialysis membrane. The donor phase comprised of a 5 mg Drug in 100 ml simulated gastric fluid (pH 6.4). The receptor phase has the similar media. The receptor phase was supplemented with 0.5% w/v sodium lauryl sulphate (1 ml) to keep sink conditions. The receptor phase was entirely removed after fixed time breaks, diluted with distilled water, and analysed by UV spectrophotometer. The trial was tripled.
Preparation of hydrogel formulation of drug NS
Carbopol 974 was used to make drug NS' gel basis [28]. The gel formulation was made by gradually dispersing Carbopol 974 polymer into a predetermined amount of water under continuous stirring, adding methylparaben sodium (0.01%, w/v) and propylparaben sodium (0.1%), and soaking for 24 h. The dispersion was then hydrated and swelled for 60 min. The medication, equivalent to 0.1% (w/w), was added in propylene glycol, ethanol, and 10% of the optimized permeation enhancer, 3-Carene, with continual stirring after hydration. The combination was then transferred to a container with pre-soaked Carbopol and stirred for 20 min. For best efficiency, triethanolamine (TEA) was used in the dispersion and agitated till a clear, viscous, homogeneous gel was formed at pH 6.0–7.0. BBD was used to develop formulations of Carbopol 974 (1–3%, w/w), Propylene glycol (5–10%), and ethanol (10–20%, w/w). Statistical screening was used to optimize the formulation.
Design of experiments
Using Design Expert®, second-order polynomial models and quadratic response surfaces were used to optimize the formulations in a 3-factor, 3-level BBD. Table 1 lists the independent and dependent variables with their low, medium, and high coded values. Experimental design yielded the polynomial equation:

Y0 is the dependent variable, B0 is the intercept, B1, B2, and B3 are the regression coefficients calculated from Y's experimental values, and X1, X2, and X3 are the coded independent variables. The interaction terms are X1X2, X1X3, and X2X3, whereas the quadratic terms are X12X22X32.
Numerical optimization
The ideal independent variable values were determined via numerical optimisation, taking response characteristics and affecting factors into account. Next, the nanosuspension formulation was made in triplicate under optimized conditions to test the optimization procedure.
Table 1: Variables with coded values in BBD
| Independent variables | Coded levels | ||
| Low (-1) | Intermediate (0) | High (+1) | |
| X1-Carbopol 974 (% w/w) | 1 | 2 | 3 |
| X2-Propylene glycol (% w/w) | 5 | 7.5 | 10 |
| X3 – Ethanol (% w/w) | 10 | 15 | 20 |
| Independent variables | Constraints | ||
| Y1-pH of the gel | 4 ≤ Y1 ≥ 6 | ||
| Y2-Viscosity of the gel(cP) | 3000 ≤ Y2 ≥ 3500 | ||
| Y3 – Flux of the drug (μg/cm2/h) | 90 ≤ Y3 ≥ 120 | ||
Evaluation of gel formulations
pH determination
A digital pH meter measured all the gel compositions. NS-based gel (0.25 g) was carefully weighed and mixed in 25 ml filtered water. The pH metre was standardized with buffer solution of pH 4.0, 7.0, and 9.0 before use. Triplicate formulation pH measurements were taken and averaged.
Viscosity determination
A Brookfield viscometer DV-I at 10 rpm measured gel viscosity. Gel samples were settled at 25±1 °C for 30 min before measuring viscosity. Triplicate viscosity measurements were taken.
Ex-vivo permeation study
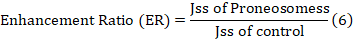
Ibrahim et al. [29] conducted an ex-vivo permeation research on male wistar rats. A diffusion cell with the stratum corneum facing up held the rat skin among the donor and receptor compartments. The receptor compartment received 30% (v/v) ethanol in phosphate buffer pH 7.4 to keep sink conditions. The temperature was kept at 37±1 °C. NS PO (10 mg) was applied to rat skin. Magnetic beads swirled receptor compartment content. Samples were taken at various times and replaced with fresh medium. Drug content was measured by means of a 263.12 nm UV spectrophotometer. The cumulative drug permeation (Q) at varied time intervals and steady state flux (Jss), permeability coefficient (Kp), and enhancement ratio (ER) were estimated using the subsequent equations:


Skin irritation study hydrogel
Three rats received 0.5 gm hydrogel on a 1" x 1" (2.54 x 2.54 cm) piece of skin. Returning animals to cages. Hydrogel was withdrawn after 24 h. Wiping test sites with tap water removed test item residue [30].
In vitro and in vivo skin permeation studies
Animals
Vab bioscience, Musheerabad supplied 120–150 g Wistar Albino rats aged 6–8 w for in vitro permeation testing. The animals were kept in aired chambers at 25 °C with a 12/12 h light/dark series. Ad libitum food and water. A week was provided for animals to acclimatize before the research. The TRR college of pharmacy, Hyderabad (1447/PO/Re/S/11/COCSEA/102/A) institutional animal ethics committee accepted all animal experiment procedures (Proposal number: 282/PO/RcBt/s/2000/CPCSEA). Three groups of animals received free drug in gel formulation (Control) or NS encapsulated drug formulations (Test I, II, and III).
In vitro skin permeation and deposition studies
Wister Albino rats were sedated with chloral hydrate and had their abdomen fur properly shaved. Cut 5 cm2 of skin on the left and right sides of the abdomen, then trim subcutaneous fat and connective tissue. Wash and check the removed skins for flaws. Franz diffusion cells by an active diffusion area of 3.14 cm2 were utilized for in vitro skin permeation and deposition experiments. Franz diffusion cell donor and receptor chambers clamped dorsal skin samples by the stratum corneum side near the donor chamber. A thin coating of 0.03 g of test gel was put in to the stratum corneum with an effective diffusional area of 1 cm2. The receptor compartment was full with 20 ml of physiological saline (pH 7.2) with 1% Tween80 to improve drug solubility to 155.8 μg/ml and maintain a sink condition for skin penetration. The diffusion cells were kept at 32±1 °C and stirred at 300 rpm during the experiment. To maintain sink conditions, 0.5 ml of receptor medium was collected at 0.5, 1, 2, 4, 6, 8, 10, or 12 h and replaced with fresh physiological saline solution [31]. Using High-Performance Liquid Chromatography (HPLC), drug concentrations were measured. After dorsal delivery, skin surfaces were carefully cleaned with distilled water to eliminate extra formulation at hours 3, 6, 9, and 12. Drug on the stratum corneum was removed by stripping the epidermis with cellophane sticky tape. Small skin portions were homogenized. The drug on the tape and homogenized skin was removed with methanol. After centrifuging at 4000 rpm for 10 min, HPLC measured the drug concentration in the supernatant [32].
In vivo permeation study in mice
24 h before the trial, dorsal hair was shaved off and the skin was cleansed with a physiological solution. 0.03 g of test gel was placed as a thin coating on the dorsal surface (3.14 cm2). The mice were slayed by cervical dislocation at hours 3, 6, 9, and 12 and the preserved skin was dissected. As indicated above, skin sample treatment and drug extraction from skin tissues were repeated. HPLC measured drug levels in the epidermis and dermis [33].
In vitro antifungal activity
The antifungal effectiveness of NS-encapsulated drug formulations was tested on Candida albicans and Aspergillus fumigatus species, these were obtained from MTCC Chandigarh. Dissolving saboured dextrose in hot distilled water and autoclaving at 121 °C for 15 min created nutritional agar. By diffusion, 10 CFU/ml test organisms were seeded in nutritional agar. The aliquot test samples were micropipetted into nutrient agar petri dishes. Following a duration of 30 min, the plates were subjected to incubation at a temperature of 25 °C for a period of 24 h. The diameters of the zone of inhibition for Candida albicans and Aspergillus fumigatus were measured at 24 and 120 h.
Stability studies
Stability experiments were performed on carbopol gel formulations with free or NS-encapsulated drug (1%, w/w). All trails were maintained in sealed amber glass bottles at ambient temperature (25±2 °C/60% RH±5% RH) in a dark environment. At appropriate intervals, 40–50 mg aliquots were transferred to calibrated flasks (20 ml). Trials were extracted by sonication in methanol, diluted, filtered through 0.45 μm membrane filters, and analysed by HPLC for drug concentration. Triplicate measurements were taken.
STATISTICAL ANALYSIS
Every experiment was done three times. Statistics were compared using SPSS 12.0. P ≤ 0.05 indicates statistical significance for data reported as mean±SD.
RESULTS AND DISCUSSION
CDNS were made by convective heating and polymerization with polyfunctional agents. A proven approach for synthesising NS uses organic carbonates in solution at high temperatures and aprotic solvents like DMF, butanone, pyridine, or dimethyl sulfoxide to make the reagents more soluble [53]. NS were made using CD in 5 molar concentrations (1:2, 1:4, 1:6, 1:8, and 1:10), including β-CD, 2-HP-β-CD, and SBE-β-CD. To assure batch consistency, these NS were characterized before use. The NS yielded less at decreasing molar concentrations. This practical yield was proportional to crosslinking agent concentration.
Particle size in synthesized NS revealed some interesting properties. Laser light scattering revealed an average particle size of 120–220 nm and a low PDI. The particle size distribution was narrow and unimodal. The complexes' strong ZP values confirmed their stability and low agglomeration rate. The narrow PDI shows colloidal suspensions are homogeneous. The NS were processed to uniform particle size. The carbonate link between two CD molecules was seen in NS (NS1-NS15) FTIR spectra at 1740–1760 cm-1. The major characteristic of NS at 1740–1760 cm-1 intensified with cross linking. X-rays characterized NS' solid structure. XRPD patterns of NS reveal crystallinity and weak long-range order, with narrow peaks and large reflections in β-CD, 2-HP-β-CD, and SBE-β-CD. Short-range order is almost destroyed, with only broad reflections indicating paracrystalline NS. XRPD patterns are similar in all NS made with varying cross-linking ratios. The DSC thermogram of β-CD showed an endothermic peak at 290 °C, indicating its melting transition point. The DSC thermogram of 2-HP-β-CD exhibited an endothermic peak at 278.08 °C, indicating dehydration. The DSC thermogram of SBE-β-CD exhibited an endothermic peak at 203.28 °C, indicating dehydration. DSC examination of NS showed no peak before 350 °C, indicating great thermal stability. TEM pictures show that the NS are essentially spherical with homogenous size distributions. TEM demonstrated NS' consistent spherical shape and diameters.
All fifteen PONS were compared to free PO in distilled water for solubilization efficiency. Fig. 1 shows that all NS (NS1-NS15) increased solubility. The solubilization efficiency of NS3 (β-CD: DPC at 1:6 ratio), NS7 (2-HP β-CD: DPC at 1:4 ratio), and NS12 (SB-β-CD: DPC at 1:4 ratio) was higher than that of ordinary PO (1.62 μg/ml). NS may have better solubilization capability due to drug inclusion complexes and matrix entrapment. This study shown that NS improve solubilization efficiency. Solubilization capability was higher in NS made from SBE-β-CD (NS11-NS15) compared to NS1-NS3 and 2-HP-β-CD. The superior solubilization capacity of SBE-β-CDNS compared to β-CD and 2-HP β-CD NS is due to its unique features. Adding sulfobutyl groups to the β-CD structure improves its water solubility and complexation capabilities. Higher hydrophilicity of SB-β-CD NS may improve interaction with hydrophobic drug molecules like PO, leading to enhanced solubilization efficiency. The structural changes in SB-β-CD may increase cavity size or alter molecular organisation, creating a better environment for drug incorporation. These parameters enhance the solubilization capacity of SB-β-CD NS compared to their counterparts.
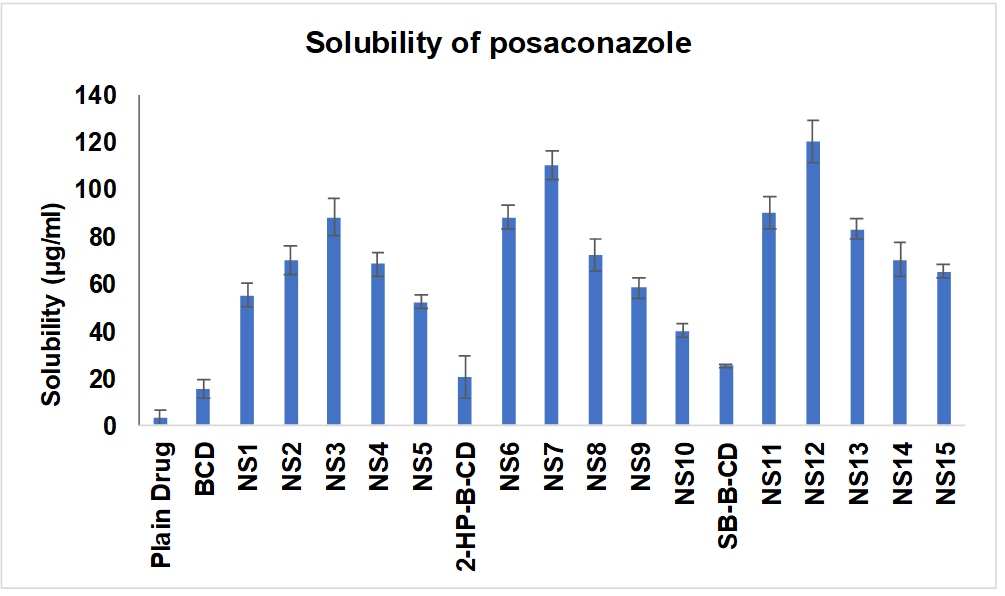
Fig. 1: Solubilization efficiency of NS-PO, all the values were expressed in (n=3) mean±SD
Three types of NS were loaded with PO via freeze-drying. Drug-loaded NS formulations were named PONS3, PONS7, and PONS12 based on the NS utilised. All formulas were fine, flowable powders. To determine the amount of drug associated with NS and calculate the proportion of drug to carrier weight, table 2 shows EE and drug pay load. The average medication payload per g of lyophilized powder was 319.74 mg of PO across all batches. PO's strong EE (85.78±4.13%) suggests the inclusion complex development. The medication may have fit inside CDNS. The results show that NS12 encapsulates PO better than NS7 and NS3.
Table 2: Drug pay load and EE
| Type of formulation | EE (%) | % drug load | Drug: Polymer |
| PONS3 | 78.65±4.76 | 28.97±2.79 | 28.97:71.03 |
| PONS7 | 82.32±3.84 | 33.72±4.12 | 33.72:66.28 |
| PONS12 | 85.78±4.13 | 34.16±3.27 | 34.16:65.84 |
(All the results are expressed as mean ±SD of triplicate experiments)
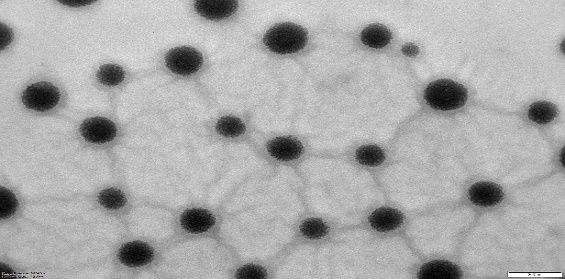
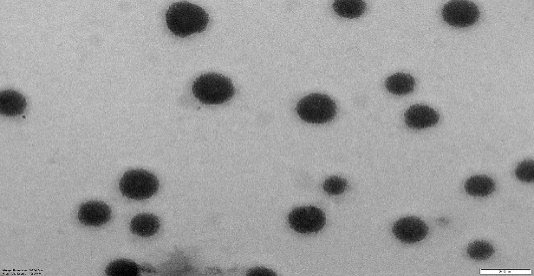
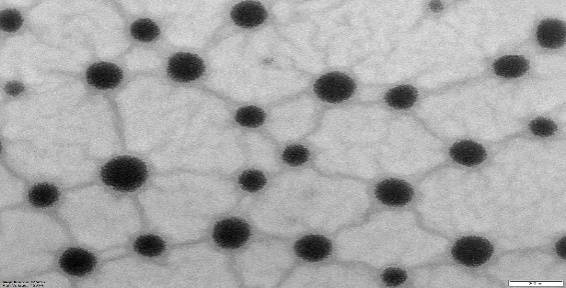
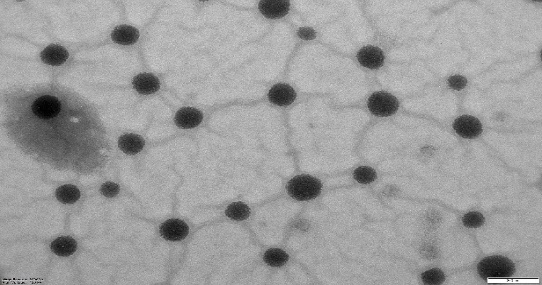
Morphology and sizes of the PONS
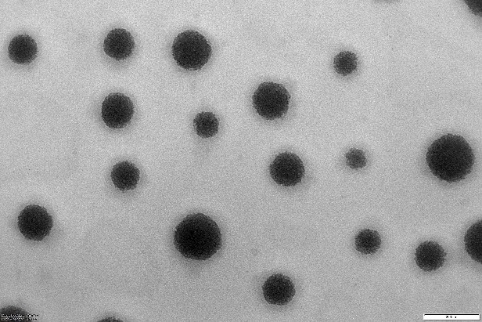
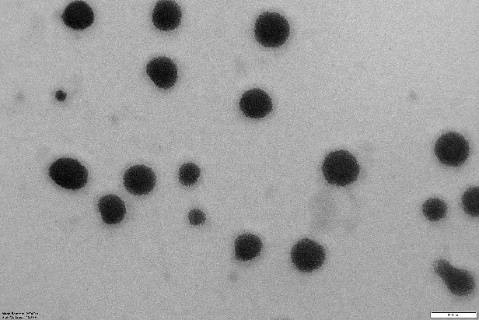
NS and NS complexes scatter laser light at 50–75 nm with minimal polydispersity. Table 3indicates a narrow, unimodal particle size distribution. High ZP stabilizes complexes and prevents agglomeration. PDIs are narrow in homogenous colloidal solutions. Each composition was a fine, free-flowing powder. Drug encapsulation keeps NS round, as shown in fig. 2.
Table 3: Mean particle size distribution of the PO loaded crosslinked CDs
| Sample | Mean diameter±SD (nm) | PDI | ZP (mV) |
| NS3 | 53.4±1.76 | 0.13±0.005 | -25.3±2.14 |
| NS7 | 62.2±1.54 | 0.09±0.005 | -23.2±1.78 |
| NS12 | 73.0±0.98 | 0.06±0.005 | -26.8±2.08 |
| PONS3 | 51.6±3.52 | 0.14±0.005 | -25.4±1.97 |
| PONS7 | 48.8±2.15 | 0.22± 0.005 | -23.9±3.12 |
| PONS12 | 49.0±1.32 | 0.11±0.005 | -26.9±1.86 |
(All the results are expressed as mean ±SD of triplicate experiments)
 |
 |
| NS3 | PONS3 |
 |
 |
| NS7 | PONS7 |
 |
 |
| NS12 | PONS12 |
Fig. 2: TEM images of cross-lined CDNS and drug-loaded NS (72000 magnifications)
Free PO, NS, and their complexes FTIR, DSC and XRD spectra are presented in fig. 3. In the PO FTIR spectra, the C-N, C-F, and C-C stretching bands peaked at 3197.8–3047.3, 1498.6–1454.2, and 1589.2–1454.2 cm-1. The plain NS's FTIR spectra showed a carbonate bond peak at 1780 cm-1, C-H stretching vibration peaks at 2918 cm-1, C-H bending vibration peaks at 1418 cm-1, and primary alcohol C-O stretching vibration peaks at 1026 cm-1. The NS formulations' FTIR spectra only showed NS-related peaks, not drug peaks. PO is effectively encapsulated in the NS complex, as drug-specific peaks are absent. PO's DSC thermogram shows an endothermic peak at 130 °C, its melting point. DSC thermograms of NS peak exothermically about 350 °C. Note that the complexes' PO compound's DSC thermogram exclusively shows NS-related peaks. The drug's endothermal peak disappeared following freeze-drying, suggesting formulation component interactions and drug amorphousization or inclusion complex formation. This shows how the formulation process changes the physical properties of PO in NS complexes. XRD patterns of pure PO, CDNS, and PONS were evaluated for physical attributes.
PO's high-crystalline peaks are shown in fig. 3. No NS complexes had pure PO peaks. The NS contained PO since there were no complicated crystalline peaks. FTIR, DSC, and XRD analysis revealed PO inclusion compound containing NS.
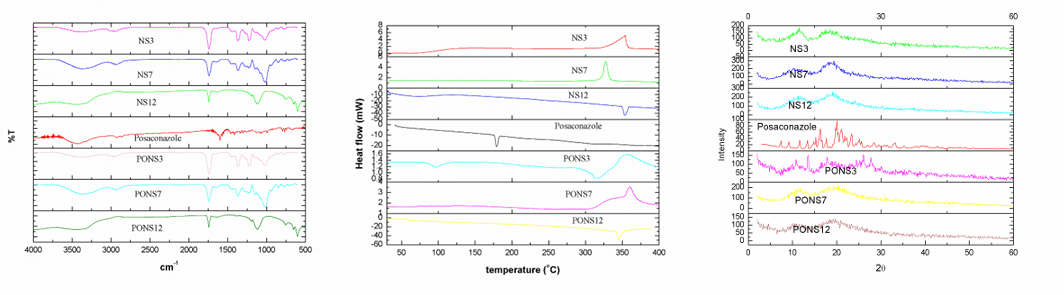
Fig. 3: FTIR, DSC and XRD spectra of cross lined CDNS and drug loaded NS
In vitro release of PO from NS formulations
PO dissolution summaries were examined at various time points for the control, Posatral 100 mg Tablet, and PONS formulations (PONS3, PONS7, PONS12). Over the given time intervals, the formulations released drugs differently (fig. 4). Over time, PONS formulations showed a sustained and regulated release profile, reducing medication release relative to the control and Posatral tablet. Through 24 h, this release pattern persisted. PONS12 had the longest drug release, increasing gradually over time. In contrast, the control and Posatral tablet disintegrated quickly, almost completely by 24 h. This persistent release behaviour in PONS formulations, notably PONS12, suggests that CDNS may be excellent carriers for PO release. Sustained release may prolong therapeutic effects, reduce dose frequency, and increase patient compliance. The data suggests that PONS12 may optimise PO pharmacokinetics and therapeutic efficacy. These findings need further investigation and in vivo studies to confirm and investigate clinical relevance.

Fig. 4: In vitro release profile of plain PO and PO loaded cross-linked CD, all the values were expressed in (n=3) mean±SD
The carpool-based topical PO formulation used various NS. The drug-loaded NS formulations were named PONSgel depending on the NS type. In topical formulation, pH (Y1), viscosity (Y2), and drug flux (Y3) were key quality attributes. Critical process parameters included Carbopol 974 (A: X1), Propylene glycol (B: X2), and Ethanol (C: X3) compositions. The-1 and+1 crucial process parameters were optimized using design of experiments. The definitive screening design randomly assigned thirteen experiments and used response surface methods to assess the data. Table 4 shows design model summary data. Fig. 5 summarises the design. All models were significant with large F-values. Multiple linear regression analysis provided polynomial equations for all essential quality indicators (table 5). Table 6 shows the mean, SD, R2, Adjusted R2, Predicted R2, Adeq Precision, and % CV of all models.
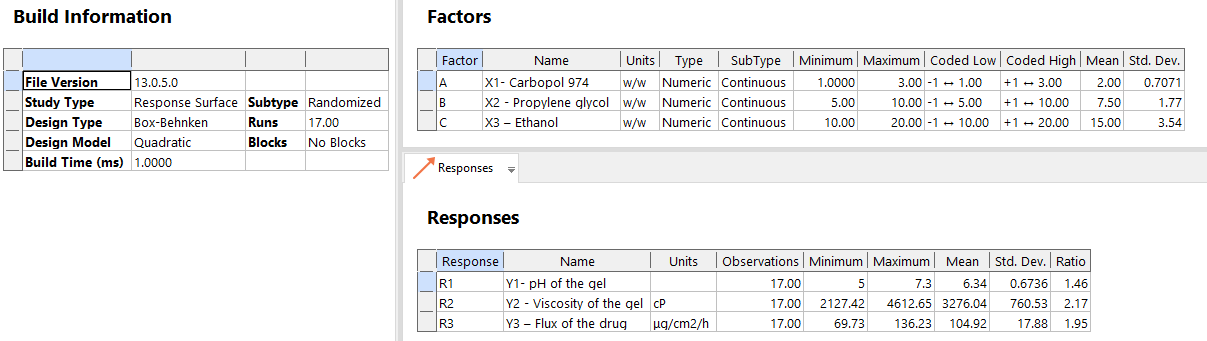
Fig. 5: Overall design summary
pH of the gel (Y1)
Physicochemical pH affects metabolic, molecular, and cell-regulating activities. Topical treatments must have optimum pH and buffer capacity to preserve active components and auxiliary materials. It may also increase non-ionized species absorption of acidic and basic active substances. Controlling pH in formulations improves stability and active component activity [33]. The experimental results indicate a gel formulation pH prediction model based on Carbopol 974, Propylene glycol, and Ethanol contents. In most cases, the model predicts pH values accurately, as shown by modest residuals. Sometimes variances indicate variability or unexplained causes. The model has positive and negative residuals and appears impartial. For a complete reliability and applicability assessment, model significance and variation sources must be examined.
The simplified quadratic model of gel pH had a significant ANOVA result (F-value = 536.91, p<0.0001), indicating an excellent match for the data. The model comprises linear (A, B, C), interaction (A: X1, B: X2, C: X3, AC), and quadratic (A²) factors. The F-values and p-values of each term are below 0.05, indicating that they significantly contribute towards the model. Lack of Fit test, with p-value 0.7510, displays that lack of fit is not significant comparative to pure error, validating model adequacy. The model is more reliable due to the close agreement between Predicted R² (0.9928) and Adjusted R² (0.9967), with a difference of less than 0.2. Fig. 6a shows that Y1 values match predictions. With 78.271 Adeq Precision, the model's signal-to-noise ratio is robust, indicating its potential for design space navigation. fig. 6b shows the perturbation plot of separate variables on Y1. The equation shows that A and B negatively affect R1, while C positively affects it. At greater levels, A has a quadratic effect on Y1. Three-dimensional RSM and contour plots show the interacting effect of variables A and C (fig. 6c and 6d).
Table 4: Statistical analysis of all response models
| Source | SS | DF | MS | F-value | P-Value | |
| ANOVA of the reduced quadratic model – pH of the gel | ||||||
| Model | 7.25 | 9 | 0.8054 | 536.91 | <0.0001 | significant |
| A: X1 | 5.78 | 1 | 5.78 | 3853.33 | <0.0001 | |
| B: X2 | 0.2812 | 1 | 0.2812 | 187.50 | <0.0001 | |
| C: X3 | 0.7813 | 1 | 0.7813 | 520.83 | <0.0001 | |
| AC | 0.0100 | 1 | 0.0100 | 6.67 | 0.0364 | |
| A² | 0.3853 | 1 | 0.3853 | 256.86 | <0.0001 | |
| Residual | 0.0105 | 7 | 0.0015 | |||
| Lack of Fit | 0.0025 | 3 | 0.0008 | 0.4167 | 0.7510 | not significant |
| Pure Error | 0.0080 | 4 | 0.0020 | |||
| Cor Total | 7.26 | 16 | ||||
| ANOVA of the reduced quadratic model –Viscosity of the gel | ||||||
| Model | 9.247106 | 9 | 1.027x10⁶ | 996.73 | <0.0001 | significant |
| A: X1 | 8.671x10⁶ | 1 | 8.671x10⁶ | 8411.86 | <0.0001 | |
| B: X2 | 2.127x10⁵ | 1 | 2.127x10⁵ | 206.37 | <0.0001 | |
| C: X3 | 1.377x10⁵ | 1 | 1.377x10⁵ | 133.60 | <0.0001 | |
| AC | 13067.92 | 1 | 13067.92 | 12.68 | 0.0092 | |
| BC | 30331.71 | 1 | 30331.71 | 29.42 | 0.0010 | |
| A² | 1.639x10⁵ | 1 | 1.639 x10⁵ | 158.98 | <0.0001 | |
| C² | 20828.93 | 1 | 20828.93 | 20.21 | 0.0028 | |
| Residual | 7215.84 | 7 | 1030.83 | |||
| Lack of Fit | 1837.18 | 3 | 612.39 | 0.4554 | 0.7279 | not significant |
| Pure Error | 5378.66 | 4 | 1344.67 | |||
| Cor Total | 9.254x10⁶ | 16 | ||||
| ANOVA of the reduced quadratic model – Flux of the drug | ||||||
| Model | 5097.90 | 9 | 566.43 | 271.45 | <0.0001 | significant |
| A: X1 | 2088.52 | 1 | 2088.52 | 1000.88 | <0.0001 | |
| B: X2 | 2502.78 | 1 | 2502.78 | 1199.40 | <0.0001 | |
| C: X3 | 61.60 | 1 | 61.60 | 29.52 | 0.0010 | |
| AB | 96.43 | 1 | 96.43 | 46.21 | 0.0003 | |
| B² | 228.05 | 1 | 228.05 | 109.29 | <0.0001 | |
| C² | 135.63 | 1 | 135.63 | 65.00 | <0.0001 | |
| Residual | 14.61 | 7 | 2.09 | |||
| Lack of Fit | 4.55 | 3 | 1.52 | 0.6031 | 0.6466 | not significant |
| Pure Error | 10.06 | 4 | 2.51 | |||
| Cor total | 5112.51 | 16 |
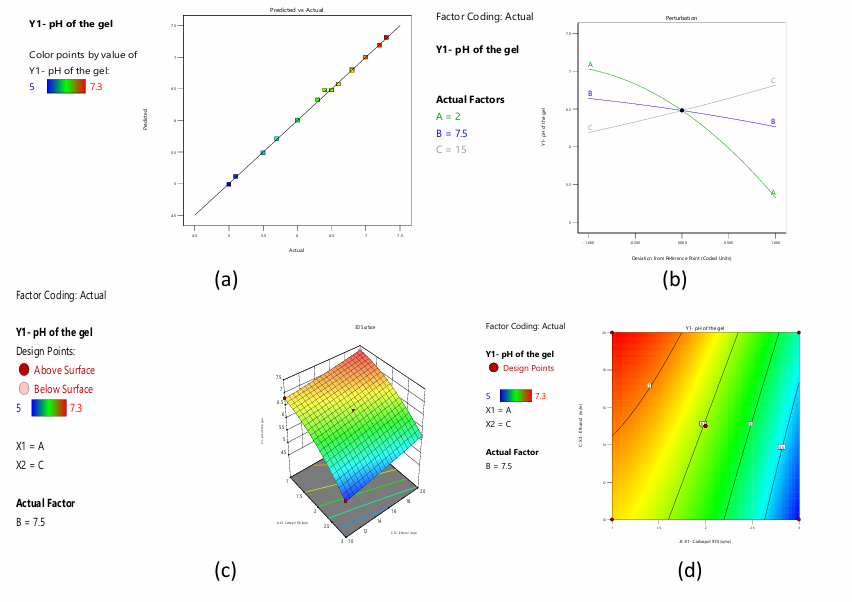
Fig. 6: a) Predicted versus actual values of the response pH of the gel b) Perturbation plot displaying the individual influence of variables on Y1 c) 3-D RSM and contour plot displaying the interactive influence of A and C on Y1
Table 5: Regression equations
| S. No. | Response variable | Equations |
| 1 | Y1 | 6.48-0.85A-0.1875B+0.3125C+0.05AC-0.3025A2 |
| 2 | Y2 | 3232.19+1041.11A+163.07B-131.20C+57.16AC-87.08BC+197.28A²-70.33C² |
| 3 | Y3 | 105.96-16.16A+17.69B+2.77C-4.91AB-7.36B²+5.68C² |
Table 6: The model fit statistics of all the responses
| S. No. | Response variable | Mean | SD | R2 | Adjusted R2 | Predicted R2 | Adeq precision | % CV |
| 1 | Y1 | 6.34 | 0.0387 | 0.9986 | 0.9967 | 0.9928 | 78.2712 | 0.6113 |
| 2 | Y2 | 3276.04 | 32.11 | 0.9992 | 0.9982 | 0.9959 | 100.3018 | 0.98 |
| 3 | Y3 | 104.92 | 1.44 | 0.9971 | 0.9935 | 0.9827 | 61.0970 | 1.38 |
Viscosity of the gel (Y2)
Gel formulation viscosity affects topical formulation performance and efficacy. Gel formulations' viscosity affects how easily they can be distributed, administered, and, most critically, how the active components are released. Drug release in topical preparations depends on gel viscosity. A gel with a higher viscosity is thicker and more uniform, which can affect its skin residence time. Active substance absorption and penetration into skin layers are affected by this. Viscosity consistency ensures uniform administration, improves patient adherence, and maximises topical formulation therapeutic effects. Understanding and managing gel viscosity is essential to creating effective and reliable topical products [34]. Each experimental run's viscosity values are compared to the model's anticipated values, and the residuals are given. The model predicts gel viscosity well, with occasional differences. The gel formulation viscosity model may need further investigation and tweaking to improve prediction. The reduced quadratic model for gel viscosity's ANOVA shows a significant F-value of 996.73 and a low p-value of<0.0001, demonstrating the model's ability to explain gel viscosity variability. Several factors and interactions, such as A: X1, B: X2, C: X3, AC, BC, A², and C², significantly impact the response variable, as seen by their low p-values. These parameters dictate gel formulation viscosity. The lack of fit F-value, which represents the difference between the model and unaccounted-for data, is non-significant with a p-value of 0.7279. This good result shows that the model fits the data well, attributing unexplained variability to random chance. The Predicted R² of 0.9959 approximates the Adjusted R² of 0.9982, with a difference of less than 0.2. Fig. 7a shows that observed and anticipated values are closely related, confirming the model's correctness. Adeq Precision's signal-to-noise ratio exceeds 4 (100.302), proving the model's eligibility for design space. The perturbation plot in fig. 7b shows how each variable affects Y2. The equation shows that A and B positively affect Y2, but C negatively affects it. A and C have a quadratic effect on Y2 at higher values. 3-dimensional RSM and contour plots show the interacting influence of variables A and C (fig. 7c and 7d).3-dimensional RSM and contour plots show the interactive influence between B and C (fig. 7e and 7f).
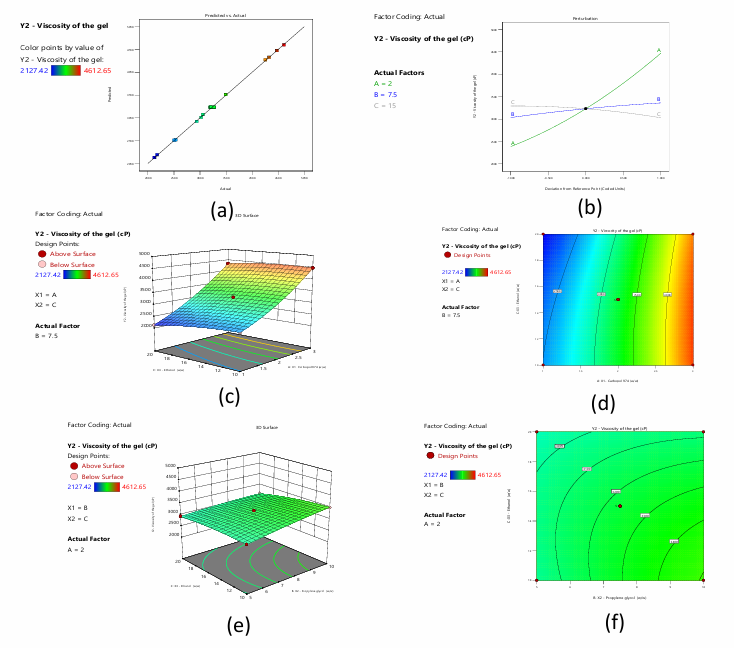
Fig. 7: a) Predicted versus actual values of the response viscosity of the gel b) Perturbation plot displaying the individual influence of variables on Y2 c) and d) 3-D RSM and contour plot displaying the interactive influence of A and C on Y2 e) and f) 3-D RSM and contour plot displaying the interactive influence of B and C on Y2
Flux of the drug (Y3)
Optimisation of drug flow in topical gel formulation requires careful parameter modifications. Selecting a medicine with appropriate solubility and dissolution rate, fine-tuning polymer kinds and concentrations, adding surfactants or penetration enhancers, modifying pH, and carefully managing co-solvent concentrations are important. Temperature, gel microstructure, and storage conditions also matter. The formulation is refined using in vitro and in vivo testing and statistical optimisation methods like Design of Experiments [35]. The actual and projected drug flux (μg/cm2/h) values and residuals are compared. Various concentrations of carbopol 974 (Factor 1), propylene glycol (Factor 2), and ethanol are tested. Drug flux is the goal of the optimised formulation. The residuals show the difference between real and anticipated values, assessing predictive model accuracy.
ANOVA for the reduced quadratic model applied to topical gel drug flow shows extremely significant findings. The model's large F-value of 271.45 and extremely low p-value of less than 0.0001 show its significance. This shows the model properly describes drug flow variability. Among individual and interaction factors, A: X1, B: X2, C: X3, AB, B², and C² have significant effects on the response variable, with low p-values. Drug flow in gel formulation depends on these parameters and interactions. A lack of fit F-value of 0.6031, showing the disparity between the model and real data not explained by the model, is not significant with a p-value of 0.6466. This suggests that the model fits the data well and that the unexplained variability is attributable to random chance. The model is suitable for studying and optimising topical gel medication flow parameters. An excellent model fit is shown by the close agreement between Predicted R² (0.9827) and Adjusted R² (0.9935), with a difference of less than 0.2. Fig. 8a shows the close association between observed and expected values. Signal-to-noise ratio of 61.097 is over the acceptable threshold of 4 according to Adeq Precision. This shows that the model has enough signal to guide design space exploration. These measurements demonstrate the model's reliability and usability for navigating and optimising design parameters. The perturbation plot in Fig.8b shows how each variable affects Y3. The equation shows that B and C positively affect Y3, but A negatively affects it. B and C have a quadratic influence on Y3 at greater values. 3-dimensional RSM and contour plots show the interacting influence of variables A and B (fig. 8c and 8d).
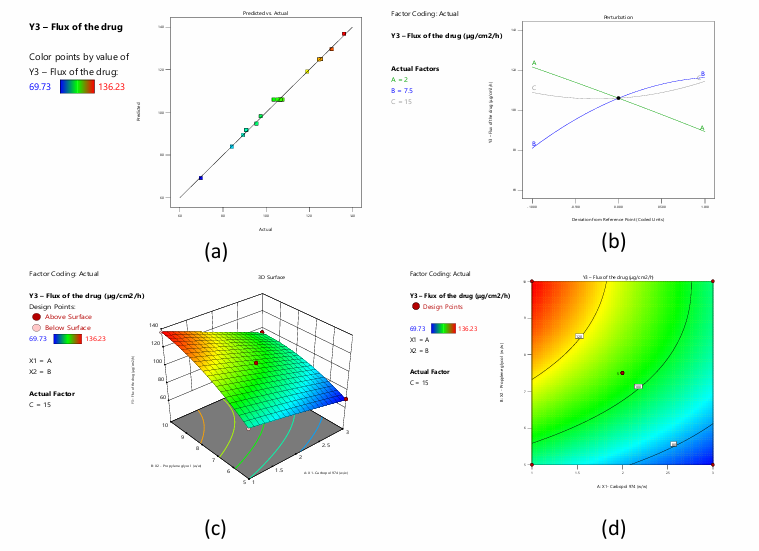
Fig. 8: a) Predicted versus actual values of the response flux of the drug b) Perturbation plot displaying the individual influence of variables on Y3 c) and d) 3-D RSM and contour plot displaying the interactive influence of A and B on Y3
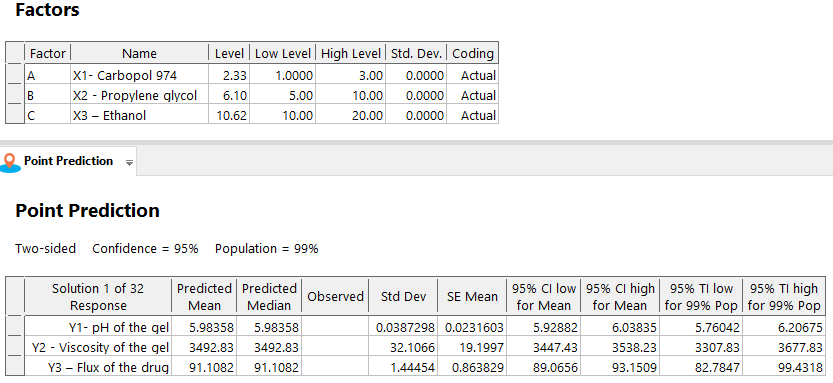
Fig. 9: The optimum levels of critical variables and predicted values of CQAs
Numerical optimisation with desirable constraints determined the optimal levels of the critical process parameters (Carbopol 974 (A: X1), Propylene glycol (B: X2), and Ethanol (C: X3)) that affect gel pH (Y1), viscosity (Y2), and drug flux (Y3). Fig. 9 shows important variable optimums, projected quality attribute values, and reactions. The overlay plot in fig. 10 displays the design space for variables and responses for optimisation with desirability 1.000. To achieve reliable results, design-space plot chromatographic conditions were chosen as a control method. The procedure worked well with Carbopol 974 (2.327 w/w), Propylene glycol (6.096), and Ethanol (10.618).
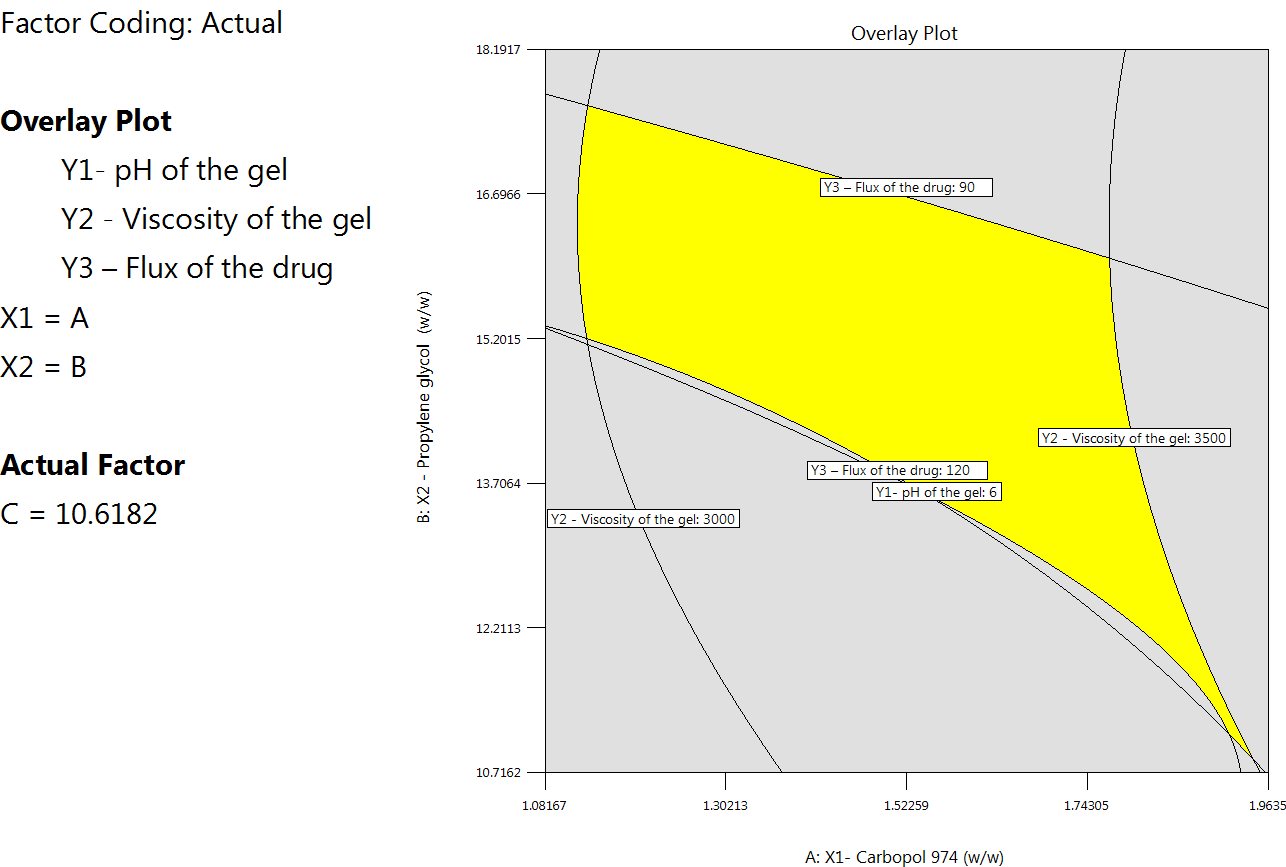
Fig. 10: Overlay plot showing the design space
Three experiments at optimum critical variable levels (fig. 9) were used to prepare drug-loaded NS-based hydrogel formulations and determine their results. The critical method attributes' results were similar to the statistically predicted values (fig. 11).
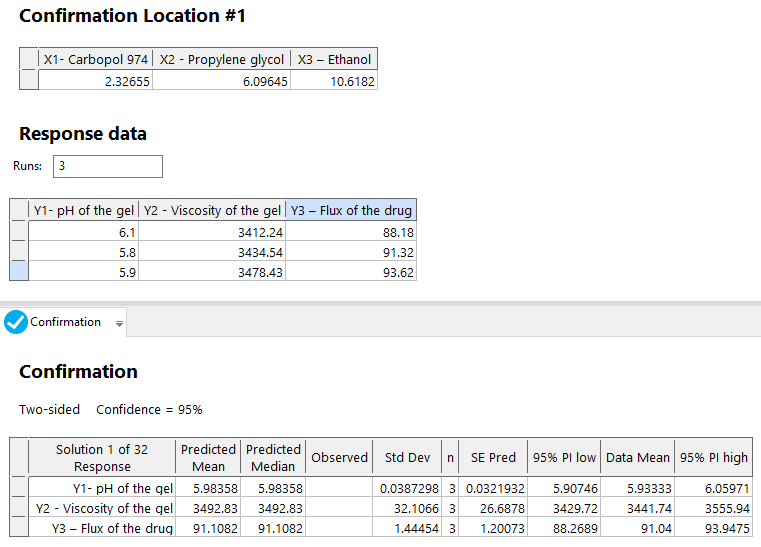
Fig. 11: Results of the confirmation experiments
Carbopol gel formulations with 1% w/w PONS (PONS3, PONS7, and PONS12 gels) were produced. The pH of all formulations was 5.6–6.0, which is within the skin pH range of 3.0–9.0, making them non-irritating. Gel formulation relies on rheology. The formulation has a viscosity range of 3476.34±213.12 to 3538.28±164.24 cps. Hydrogels are hydrophilic polymers that can hold huge amounts of water in their 3-dimensional networks. Adsorption and fusing onto the skin surface are key to NS-based hydrogel formulations' medication penetration. A penetration-enhancing non-ionic surfactant disrupts densely packed lipids in the stratum corneum's extracellular gaps, changing its barrier characteristics. Table 7 shows that membranes and excised skin release PO at different rates, highlighting skin barrier changes. The interactions between skin and NS components may explain these differences. NS-based hydrogel formulations fusing with the skin surface increase flow, allowing nanocarriers to directly transfer drugs.
Table 7: Flux of PO from hydrogel formulations
| Formulation | Flux (μg cm−2 h−1) | |
| Egg membrane | Rat skin | |
| PONS3 gel | 65.72±2.65 | 83.54± 4.87 |
| PONS7 gel | 63.12±2.43 | 80.37±5.54 |
| PONS12 gel | 75.72±2.65 | 92.76±4.12 |
| Control | 24.56±2.48 | 17.54±2.76 |
NS encapsulation was tested on PO penetration and skin deposition in hairless mice using vertical Franz diffusion cells at 37 °C. A control carbopol gel formulation of free PO was evaluated alongside three NS-encapsulated gel formulations. Therefore, these formulations are called Control (gel formulation of free PO), Test 1 (PONS2), Test 2 (PONS7), and Test 3 (PONS12). To evaluate transdermal PO administration, receptor media was sampled at 0.5, 1, 2, 4, 6, 8, 10, and 12 h. PO was not found in the receptor phase after 12 h of administration for control and test preparations, indicating no transdermal transport. Vertical Franz diffusion cells at 37 °C were used to study PO penetration and deposition in hairless mice skin after NS encapsulation. Three NS-encapsulated PO gel formulations were tested for skin permeation, with carbopol gel of free PO as the control. Control (gel formulation of free PO), Test 1 (PONS2), Test 2 (PONS7), and Test 3 (PONS12) will be listed below. To test transdermal PO administration, we sampled receptor media at 0.5, 1, 2, 4, 6, 8, 10, and 12 h. The receptor phase showed no PO after 12 h of control and test preparations, indicating no transdermal administration. We measured PO in rat skin's stratum corneum and epidermis/dermis after the 12-hour permeation research. Table 8 shows skin permeation results.
Table 8: In vitro skin penetration of PO from the carbopol gel formulations containing encapsulated or nonencapsulated PO, 12 h after topical application
| Sample | PO (μg/cm2) | |
| Stratum corneum (SC) (μg/cm2) | (Epidermis+Dermis) (μg/cm2) | |
| Control | 4.12±0.62 | 1.38±0.23 |
| Test 1 | 35.32±2.47* | 6.12±0.89* |
| Test 2 | 36.72±3.43* | 6.78±0.64* |
| Test 3 | 45.38±1.27** | 8.32±0.48** |
Results are represented by mean±S. D. (n = 3). *Significant statistical difference compared to control (p<0.05). **Significant statistical difference compared to Test 1 and Test 2 (p<0.01)
All Test formulations had significantly higher PO skin penetration 12 h after application than the control group. At 12 h, the gel formulations (Control, Test 1, Test 2, Test 3) had cumulative levels of PO of 5.68±0.23 μg/cm², 41.64±1.72 μg/cm²+42.08±2.14 μg/cm², and 54.12±1.89 μg/cm², respectively This suggests that at 12 h, the gel formulation having encapsulated PO penetrated the skin more than 10-12 times more than the gel formulation containing free PO. PONS12 gel formulation had better 12 h PO skin penetration than PONS2 and PONS7 gel formulations. Test 3 provided 1.3 times more PO through the skin than Tests 1 and 2. PO distribution in excised rat skin is shown in fig. 12. In vitro skin penetration investigation showed higher PO concentrations in the stratum corneum (SC) at 0.5, 1, 2, 4, 6, 8, 10, and 12 h post-application using NS (P<0.05). Additionally, PO concentration in the epidermis/dermis ([E+D]) significantly increased after 0.5, 1, 2, 4, 6, 8, 10, and 12 h (P<0.05). NS encapsulation and Carbopol gel formulation synergistically increased PO permeability and deposition.
PO evaluated against Aspergillus fumigatus and Candida albicans. Table 9 indicates inhibition zone mean diameters. PONS gel inhibited Candida albicans and Aspergillus fumigatus growth in agar diffusion microbiological experiments, but not the gel itself. After 24 h, inhibitory zones reduced microbial growth.
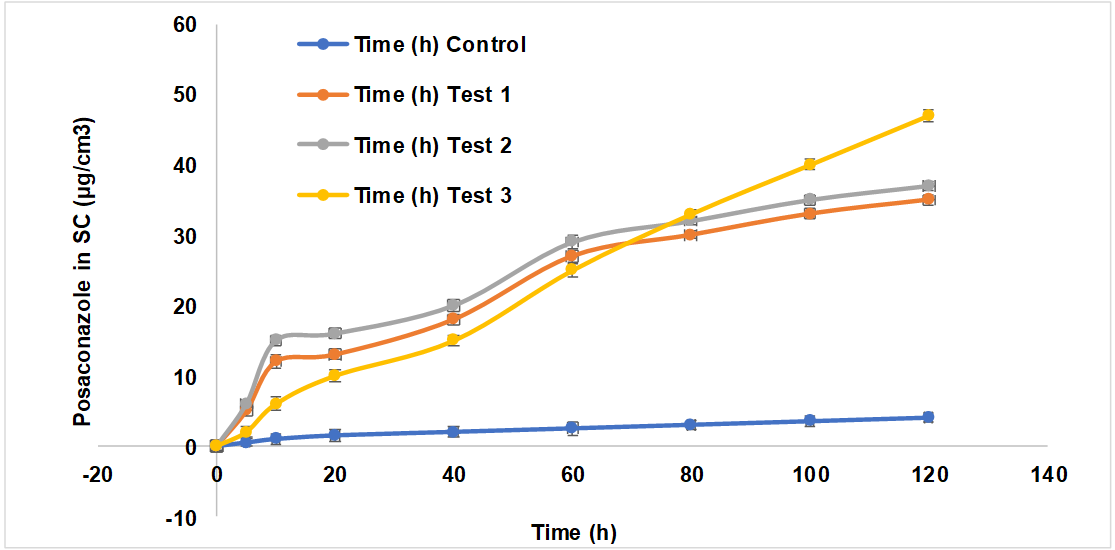
Fig. 12: The time course of in vitro skin permeation of PO incorporated into gel formulations in a) Stratum corneum and b) Epidermis and dermis, results are represented by mean±SD (n = 3)
Table 9: Antifungal activity of posaconazole, posaconazole nanosponges in comparison to standard
| S. No. | Sample | Zone of inhibition (mm)±SEM |
| Candida albicans | PO in gel formulation | 11.23±1.24 |
| PONS3 gel formulation | 56.64±3.12 | |
| PONS7 gel formulation | 49.78±2.44 | |
| PONS12 gel formulation | 61.28± 2.62 | |
| Standard (Candid Gel) | 52.21±1.45 | |
| Aspergillus fumigates | PO in gel formulation | 9.37±0.68 |
| PONS3 gel formulation | 57.32±1.82 | |
| PONS7 gel formulation | 62.73±2.88 | |
| PONS12 gel formulation | 75.38±4.02 | |
| Standard (Candid Gel) | 52.21±1.45 | |
| PO: Posaconazole; NS: Nanosponges. Results are represented by mean±SD (n = 3). |
Finally, gel formulations retained pH and clarity at room temperature. Fig. 13 shows that PO gel degraded 14% over three months. PONS gel formulations did not decrease PO content during the same period. Durability is due to CDNS.
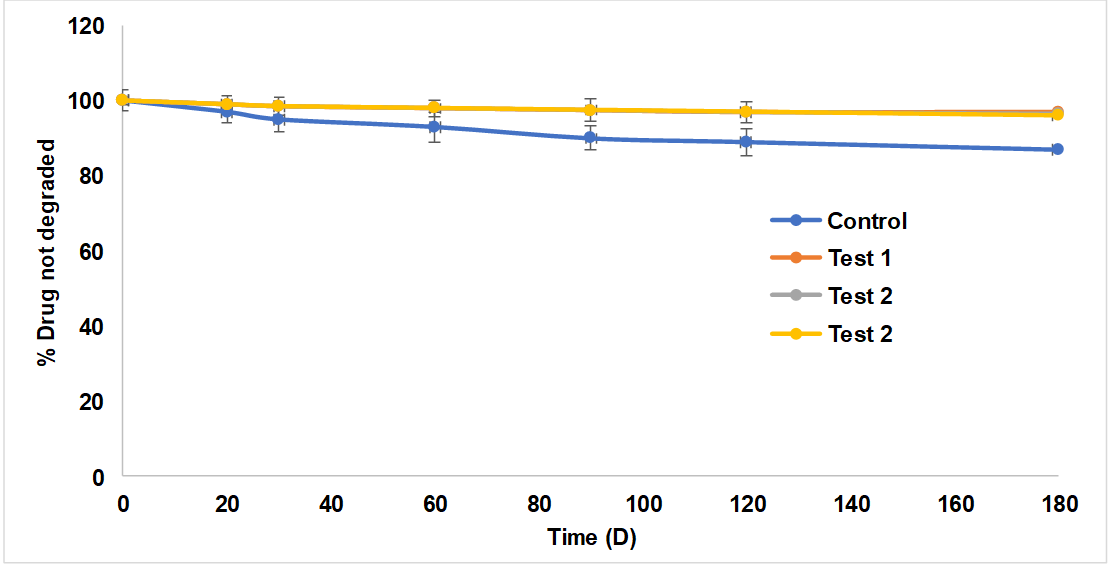
Fig. 13: Results of stability study, results are represented by mean±SD (n = 3)
CONCLUSION
Finally, the study prepared, characterised, and evaluated a PO hydrogel formulation using CDNS. Hydrogels' hydrophilic nature allowed them to retain considerable volumes of water in their three-dimensional networks. NS adsorption and fusing on the skin surface improved PO penetration. A penetration-enhancing non-ionic surfactant disturbed the stratum corneum's densely packed lipids in the extracellular spaces, changing its barrier characteristics. The differences in PO flow across membranes and excised skin showed skin barrier changes. Association and fusing of NS with the skin surface increased flow, allowing nanocarriers to directly transmit drugs. The work sheds light on NS-based hydrogel formulations' potential to improve transdermal PO distribution, which could impact medication delivery systems.
ACKNOWLEDGEMENT
The authors would like to acknowledge the administration and faculty of the Department of Pharmaceutics, SRM College of Pharmacy, SRMIST, Kattankulathur, Tamilnadu, India, for their assistance in facilitating the research. The students are also grateful for the support and encouragement they have received during their tenure at this institution.
FUNDING
Nil
AUTHORS CONTRIBUTIONS
AP contributed to the study design and collaborated with data collecting and analysis, while ST and KK, supported in paper writing, assuring a collaborative and balanced effort throughout the research process. All Authors reviewed and approved the final draft.
CONFLICT OF INTERESTS
All authors involved in this study have declared that they have no actual, prospective, or seeming conflicts of interest.
REFERENCES
Indiramuzib Y, Sreevidya P. Pulmonary drug delivery systems of posaconazole: development and optimization through quality by design. Int J Appl Pharm. 2024 May;16(5):51163. doi: 10.22159/ijap.2024v16i5.51163.
Herbrecht R. Posaconazole: a potent extended spectrum triazole anti‐fungal for the treatment of serious fungal infections. Int J Clin Pract. 2004 Jun;58(6):612-24. doi: 10.1111/j.1368-5031.2004.00167.x, PMID 15311563.
Varghese FS, Meutiawati F, Teppor M, Jacobs S, DE Keyzer C, Taskopru E. Posaconazole inhibits multiple steps of the alphavirus replication cycle. Antiviral Res. 2022 Jan;197:105223. doi: 10.1016/j.antiviral.2021.105223, PMID 34856248.
Waghmare SM, Barve KB, Ruchake NK. A review on biological activity of 1, 3-diazole derivatives. Int J Curr Pharm Res. 2022 May;14(5):1-3. doi: 10.22159/ijcpr.2022v14i5.2030.
Wong TY, Loo YS, Veettil SK, Wong PS, Divya G, Ching SM. Efficacy and safety of posaconazole for the prevention of invasive fungal infections in immunocompromised patients: a systematic review with meta-analysis and trial sequential analysis. Sci Rep. 2020 Jan;10(1):14575. doi: 10.1038/s41598-020-71571-0, PMID 32884060.
Chen L, Krekels EH, Verweij PE, Buil JB, Knibbe CA, Bruggemann RJ. Pharmacokinetics and pharmacodynamics of posaconazole. Drugs. 2020 Jul;80(7):671-95. doi: 10.1007/s40265-020-01306-y, PMID 32323222.
Howard SJ, Lestner JM, Sharp A, Gregson L, Goodwin J, Slater J. Pharmacokinetics and pharmacodynamics of posaconazole for invasive pulmonary aspergillosis: clinical implications for antifungal therapy. J Infect Dis. 2011 Sep;203(9):1324-32. doi: 10.1093/infdis/jir023, PMID 21357943.
LI Y, Theuretzbacher U, Clancy CJ, Nguyen MH, Derendorf H. Pharmacokinetic/pharmacodynamic profile of posaconazole. Clin Pharmacokinet. 2010;49(6):379-96. doi: 10.2165/11319340-000000000-00000, PMID 20481649.
Moore JN, Healy JR, Kraft WK. Pharmacologic and clinical evaluation of posaconazole. Expert Rev Clin Pharmacol. 2015 Mar;8(3):321-34. doi: 10.1586/17512433.2015.1034689, PMID 25916666.
Kersemaekers WM, Dogterom P, XU J, Marcantonio EE, DE Greef R, Waskin H. Effect of a high fat meal on the pharmacokinetics of 300-milligram posaconazole in a solid oral tablet formulation. Antimicrob Agents Chemother. 2015 Jun;59(6):3385-9. doi: 10.1128/AAC.05000-14, PMID 25824210.
Sanaei Oskouei SS, Araman AO, Erginer YO. Preparation optimization and in vitro drug release study of microemulsions of posaconazole. J Drug Deliv Sci Technol. 2023 Jan;79:104090. doi: 10.1016/j.jddst.2022.104090.
Dekkers BG, Bakker M, Van Der Elst KC, Sturkenboom MG, Veringa A, Span LF. Therapeutic drug monitoring of posaconazole: an update. Curr Fungal Infect Rep. 2016 Feb;10(2):51-61. doi: 10.1007/s12281-016-0255-4, PMID 27358662.
Sravya NJ, Vijetha KA. Formulation and evaluation of posaconazole bilayer delayed release tablets using solid dispersion technique. Sch Int J Linguist Lit. 2022 Sep;5(9):276-88. doi: 10.36348/sijll.2022.v05i09.006.
Kolipaka T, Sen S, Mane SS, Bajad GD, Dengale SJ, Ranjan OP. Development of posaconazole nanosuspension for bioavailability enhancement: formulation optimization in vitro characterization and pharmacokinetic study. J Drug Deliv Sci Technol. 2023 May;83:104434. doi: 10.1016/j.jddst.2023.104434.
Ghurghure SM, Jadhav T, Kale S, Phatak AA. Formulation and evaluation of posaconazole loaded nanostructured lipid carriers for topical drug delivery system. CTPPC. 2022 Mar;4(3):126-34. doi: 10.18231/j.ctppc.2022.022.
Gautham TV, Patel R, Gupta VR, Devi GP, Dharamsi A. Oral formulation of posaconazole in nanosuspension: development and optimization by design of experiments approach. Asian J Pharm. 2023 Feb;17(2):221.
Yenilmez E, Demirel M, Başaran E, Aykac K. Posaconazole loaded ocular inserts for antifungal activity. JPT. 2020;1(1):1-6. doi: 10.37662/jpt.2020.0.
Puri A, Loomis K, Smith B, Lee JH, Yavlovich A, Heldman E. Lipid based nanoparticles as pharmaceutical drug carriers: from concepts to clinic. Crit Rev Ther Drug Carrier Syst. 2009 Jun;26(6):523-80. doi: 10.1615/critrevtherdrugcarriersyst.v26.i6.10, PMID 20402623.
Santana AC, Nadvorny D, DA Rocha Passos TD, DE LA Roca Soares MF, Soares Sobrinho JL. Influence of cyclodextrin on posaconazole stability release and activity: improve the utility of the drug. J Drug Deliv Sci Technol. 2019 Oct;53:101153. doi: 10.1016/j.jddst.2019.101153.
Tang P, Wang L, MA X, XU K, Xiong X, Liao X. Characterization and in vitro evaluation of the complexes of posaconazole with β- and 2,6-di-O-methyl-β-cyclodextrin. AAPS Pharm Sci Tech. 2017;18(1):104-14. doi: 10.1208/s12249-016-0497-z, PMID 26883260.
Abbas N, Parveen K, Hussain A, Latif S, UZ Zaman S, Shah PA. Nanosponge based hydrogel preparation of fluconazole for improved topical delivery. Trop J Pharm Res. 2019 Feb;18(2):215-22. doi: 10.4314/tjpr.v18i2.1.
Sarfaraz MD, Shaikh ZM, Doddayya H. Preparation and characterization of fluconazole topical nanosponge hydrogel. Int J Pharm Pharm Sci. 2024 Apr;16(4):18-26. doi: 10.22159/ijpps.2024v16i4.50589.
Subair TK, Mohanan J. Development of nano based film forming gel for prolonged dermal delivery of luliconazole. Int J Pharm Pharm Sci. 2022 Feb;14(2):31-41. doi: 10.22159/ijpps.2022v14i2.43253.
Bhagyavathi A, Lakshmi S TK, Sahitya DM, Bhavani B. Nanosponges a revolutionary targeted drug delivery nanocarrier: a review. Asian J Pharm Clin Res. 2023 Apr;16(4):3-9.
Singireddy A, Pedireddi SR, Subramanian S. Optimization of reaction parameters for synthesis of cyclodextrin nanosponges in controlled nanoscopic size dimensions. J Polym Res. 2019;26(93):1-2.
Swaminathan S, Vavia PR, Trotta F, Cavalli R. Nanosponges encapsulating dexamethasone for ocular delivery: formulation design physicochemical characterization safety and corneal permeability assessment. J Biomed Nanotechnol. 2013 Jun;9(6):998-1007. doi: 10.1166/jbn.2013.1594, PMID 23858964.
Singireddy A, Subramanian S. Cyclodextrin nanosponges to enhance the dissolution profile of quercetin by inclusion complex formation. Part Sci Technol. 2016 Mar;34(3):341-6. doi: 10.1080/02726351.2015.1081658.
Chaudhary H, Rohilla A, Rathee P, Kumar V. Optimization and formulation design of carbopol loaded piroxicam gel using novel penetration enhancers. Int J Biol Macromol. 2013 Apr;55:246-53. doi: 10.1016/j.ijbiomac.2013.01.015, PMID 23376559.
Ibrahim MM, Sammour OA, Hammad MA, Megrab NA. In vitro evaluation of proniosomes as a drug carrier for flurbiprofen. AAPS Pharm Sci Tech. 2008 Mar;9(3):782-90. doi: 10.1208/s12249-008-9114-0, PMID 18587650.
Rahman SA, Abdelmalak NS, Badawi A, Elbayoumy T, Sabry N, El Ramly AE. Formulation of tretinoin loaded topical proniosomes for treatment of acne: in vitro characterization skin irritation test and comparative clinical study. Drug Deliv. 2015 Jun;22(6):731-9. doi: 10.3109/10717544.2014.896428, PMID 24670094.
Song CK, Balakrishnan P, Shim CK, Chung SJ, Chong S, Kim DD. A novel vesicular carrier transethosome for enhanced skin delivery of voriconazole: characterization and in vitro/in vivo evaluation. Colloids Surf B Biointerfaces. 2012 Apr 1;92:299-304. doi: 10.1016/j.colsurfb.2011.12.004, PMID 22205066.
Vicentini FT, Fonseca YM, Pitol DL, Iyomasa MM, Bentley MV, Fonseca MJ. Evaluation of protective effect of a water in oil microemulsion incorporating quercetin against UVB-induced damage in hairless mice skin. J Pharm Pharm Sci. 2010 Feb;13(2):274-85. doi: 10.18433/j3830g, PMID 20816012.
Nazzaro F, Fratianni F, Coppola R, DE Feo VD. Essential oils and antifungal activity. Pharmaceuticals (Basel). 2017 Apr;10(4):86. doi: 10.3390/ph10040086, PMID 29099084.
Milanowski B, Wosicka Frackowiak H, Glowka E, Sosnowska M, Wozny S, Stachowiak F. Optimization and evaluation of the in vitro permeation parameters of topical products with non-steroidal anti-inflammatory drugs through Strat-M® membrane. Pharmaceutics. 2021 Aug;13(8):1305. doi: 10.3390/pharmaceutics13081305, PMID 34452264.
Hummer J, Birngruber T, Sinner F, Page L, Toner F, Roper CS. Optimization of topical formulations using a combination of in vitro methods to quantify the transdermal passive diffusion of drugs. Int J Pharm. 2022;620:121737. doi: 10.1016/j.ijpharm.2022.121737, PMID 35413396.