
Int J App Pharm, Vol 17, Issue 3, 2025, 270-282Original Article
OPTIMIZATION OF THEOPHYLLINE SUSTAINED RELEASE TABLETS WITH A COMBINATION OF ETHYLCELLULOSE AND XANTHAN GUM MATRIX USING SIMPLEX LATTICE DESIGN METHOD
SUPRAPTO SUPRAPTO*, RIZA MAULANA, RIMA MUNAWARAH, RAFIKA HANIFAH JAUHARI
Faculty of Pharmacy, Universitas Muhammadiyah Surakarta, Jl. A. Yani No 1, Pabelan, Surakarta, Indonesia
*Corresponding author: Suprapto Suprapto; *Email: sup215@ums.ac.id
Received: 15 Aug 2024, Revised and Accepted: 20 Mar 2025
ABSTRACT
Objective: The study aims to investigate the effects of combining Ethyl Cellulose (EC) and Xanthan Gum (XG) matrix on the physical properties dissolution profiles and determine the optimal formula for sustained-release theophylline tablets.
Methods: We used the Design Expert 13 software with the Simplex Lattice Design (SLD) models EC (A) and XG (B) to obtain the sustained release tablet formula of theophylline, which yielded seven formulas: F1 (80:120), F2 (110:90), F3 (120:80), F4 (90:110), F5 (100:100), F6 (120:180), and F7 (80:120). Granule evaluation included flowability rate, angle of repose, and compressibility index. Tablet evaluation included weight uniformity, hardness, friability, uniformity of content, and dissolution rate.
Results: The physical properties of granules and tablets from the optimal formula showed that all test parameters met the standards. The granule flow rate was 11.98 g/sec, angle of repose 33.65, compressibility index 13.36%, tablet weight uniformity (%CV) 0.40%, tablet hardness 15.18, tablet friability 0.36%, content uniformity 98.03%, dissolution rate 11.30 mg/h. The effect of XG was more dominant in improving flow properties, angle of repose, compressibility index, weight uniformity, hardness, content uniformity, and dissolution rate. On the contrary, the more dominant EC could increase tablet friability and sustained drug release from the matrix.
Conclusion: The optimal formula for theophylline sustained-release tablets contains a combination of EC: XG ingredients with a concentration of 107.03:92.97 mg, respectively, with a desirability value of 0.507.
Keywords: Theophylline, Sustained-release, Optimization, Ethylcellulose, Xanthan gum
© 2025 The Authors. Published by Innovare Academic Sciences Pvt Ltd. This is an open access article under the CC BY license (https://creativecommons.org/licenses/by/4.0/)
DOI: https://dx.doi.org/10.22159/ijap.2025v17i3.52362 Journal homepage: https://innovareacademics.in/journals/index.php/ijap
INTRODUCTION
Theophylline is one of the asthma drugs (with water-soluble properties, and the common dose is relatively small, ranging from 130 to 150 mg [1]. However, the therapeutic index of theophylline is narrow, ranging from 5 to 20 g/ml and has a relatively short elimination half-life. This makes the drug more suitable for formulation into sustained-release dosage form so that the release of the drug can be slower and more controlled. Sustained-release dosage form can keep the drug concentrate on in the blood stable for an extended period of time [2]. The sustained-release dosage form formulation of the theophylline compound is expected to prolong the release of the drug so that the level of the drug in the blood is more uniform and the effects of the drug are within the therapeutic range [3]. The drug given in sustained release has slowed drug release into the blood, meaning blood levels remain stable and drug release lasts longer [4]. While novel drugs are not the only means of treating asthma, they can be more beneficial and effective by modifying polymers and other materials, using existing drugs in novel ways, and treating asthma with them [5]. The formulation of the sustained-release dosage form is made using a specific system so that the drug can release its active substance slowly but will still have the expected therapeutic effect. Matrix systems are often applied to manufacture sustained-release tablets because they are the simplest systems [6]. The hydrophobic matrix generally releases a drug by forming a gel and expanding, then dissolving [7]. The hydrophobic matrix releases the drug by allowing the fluid to enter the pores of the matrix and diffuse out [8]. Ethyl Cellulose (EC) is a hydrophobic cellulose derivative matrix that can inhibit the drug's release into the blood by forming a gel layer to hold the drug in the matrix [9]. In addition, its hydrophobic nature also allows it to control the drug release and maintain it for 12 h by preventing water from penetrating into the matrix [10]. Xanthan Gum (XG) is a hydrophilic matrix because it is easily hydrated, so it will proliferate in the drug and control the release [11]. The use of the single ethyl cellulose matrix in late-release tablet formulation has already given a fairly good drug release pattern, but ethyl cellulose has low solubility, so its penetration is poor [12]. Hydrophilic polymers, when combined with hydrophobic polymers, can produce an optimal formula [8]. The concentration of polymers showed a great effect on the release of the drug as the concentration of polymer increased, the release of the drug decreased [13]. The experimental design approach used for the type of tablet preparation, which has unique and significant quality characteristics, forms the basis of the formulation design strategy [14]. The combination of the two matrices EC and XG is expected to produce a sustained release and produce a sustained release tablet that has the physical properties that meet the requirements.
MATERIALS AND METHODS
Materials
This study used an analytical balance (Ohaus), a 12 mesh sieve, an oven (Memmert), a volumenometer (Dual Tape Density), a stainless funnel measuring flow properties, a stopwatch, a single punch tablet machine (Korsch EK-0), a LIH-1 hardness tester (Vanguard Pharmaceutical Machinery, Inc. USA), a LIC-2 friability tester (Vanguard Pharmaceutical Machinery, Inc. USA), an RC-6D dissolution tester (Vanguard Pharmaceutical Machinery, Inc. USA), a UV-Vis spectrophotometer (Shimadzu UV-1280), and a pH meter (Ohaus Starter 3100). The materials used in this study were pharmaceutical-grade theophylline, ethyl cellulose, xanthan gum, magnesium stearate, lactose, polyvinyl Pyrrolidone (PVP), and CO2-free distilled water.
Theophylline sustained-release tablet formulation
This study's different treatment was combining two EC and XG matrices with upper and lower limits. The limit range of each ingredient determined the limits of these two matrices according to the existing literature. The delivery matrix for the sustained-release tablet should have EC concentrations between 3-20% [15]. The EC and XG amounts at the upper and lower limits are shown in table 1.
Table 1: Upper and lower limits of matrix concentration
| Concentration | Name | Low | Upper |
| A [mixture] | Ethyl cellulose | 80 mg | 120 mg |
| B [mixture] | Xanthan gum | 80 mg | 120 mg |
Notes: Total weight of the two matrices = 200 mg
Table 2: Results of formula design according to design expert v.13 with simplex lattice design method
| Formula | Runs | Actual (mg) | Coded | ||
| EC | XG | EC | XG | ||
| 1 | 1 | 80 | 120 | 0 | 1 |
| 2 | 2 | 110 | 90 | 0.75 | 0.25 |
| 3 | 3 | 120 | 80 | 1 | 0 |
| 4 | 4 | 90 | 110 | 0.25 | 0.75 |
| 5 | 5 | 100 | 100 | 0.5 | 0.5 |
| 6 | 6 | 120 | 80 | 1 | 0 |
| 7 | 7 | 80 | 120 | 0 | 1 |
Table 3: Theophylline sustained release tablet preparation formula with a combination of EC and XG matrices
| Formula | Theophylline (mg) | EC (mg) | XG (mg) | PVP (mg) | Lactose (mg) | Mg stearate (mg) |
| 1 | 300 | 80 | 120 | 24 | 70 | 6 |
| 2 | 300 | 110 | 90 | 24 | 70 | 6 |
| 3 | 300 | 120 | 80 | 24 | 70 | 6 |
| 4 | 300 | 90 | 110 | 24 | 70 | 6 |
| 5 | 300 | 100 | 100 | 24 | 70 | 6 |
| 6 | 300 | 120 | 80 | 24 | 70 | 6 |
| 7 | 300 | 80 | 120 | 24 | 70 | 6 |
Notes: The total weight of theophylline sustained-release tablets is 600 mg
Determination of the theophylline sustained-release tablet formula obtained using Design-Expert v.13 software with Simplex Lattice Design (SLD) method. The results of the formula design are shown in table 2 and the theophylline sustained-release tablet formula are listed in table 3.
Granulation
Theophylline, ethyl cellulose, xanthan gum, and lactose were mixed in a mortar until homogeneous, then added distilled water was gradually added to the mixture while stirring until a homogeneous granular mass was obtained. The wet granule mass was sieved through a 12 mesh sieve and the granules were dried in an oven at 40℃ for approximately 24 h, then magnesium stearate was added and mixed until homogeneous [16].
Flowability test
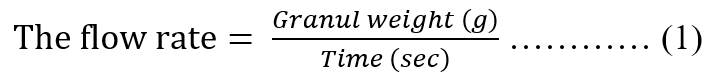
The total of 100 g of granule was placed in the funnel of the flowability tester; then the granule was allowed to flow freely until it ran out by opening the funnel lid. The time required for the granules to flow was recorded as the flow time. This test was performed in three replicates. A good granule has a flow time of ≥10 g/sec [17]. The granule flow rate was calculated using the equation (1) [18].
Angle of repose test
The fixed funnel method was used to calculate the angle of repose, first, 100 g of powder was being weighed, then freely delivered through the pulley toward the plate. The radius (r) and height (h) of the granular powder were measured, then the large angle of repose (α) was calculated using the equation (2) [19].
![]()
Determination of the compressibility index (T)
A number of granules was placed in the volumenometer until 250 ml was reached, then the volumenometer was set to 10, 500, 1250 taps to determine the volume change of granules. Each volume change that occurred at 10, 500, 1250 taps was recorded. Each formula was tested in three replicates. The compressibility index (T) was calculated using the following equation (3) [20].
 =
=  . . (3)
Notes: T is the compressibility index (%), Vo is the initial volume of the granules before treatment (ml), and Vf is the final volume of granules after treatment (ml).
Compression of tablet test
Granules that had been tested for quality and met the existing requirements were to be printed into tablets. The granule mixture was printed using a single-punch tablet press with a weight of 600 mg per tablet. The compression pressure for tablet printing was 15 kg.
Tablet weight uniformity test
A total of 10 tablets were weighed, and the average weight of the tablets was calculated, then the deviation of each tablet from its average weight was calculated [21]. Weight uniformity was determined by the value of the coefficient of variation of the equation (4).
 ………… (4)
Notes: CV = coefficient of variation; SD = standard of deviation; X = average tablet weight
Tablet hardness test
The tablet hardness test was performed using a hardness tester. We randomly selected 10 tablets and positioned them horizontally on the device, which was initially calibrated to a position of 0.00. The device was rotated until the tablet cracked and broke, at which point the scale on the device turned red.
Tablet friability test
We first freed a set of 12 tablets to remove any fine particles or dust that had adhered to them and then carefully weighed each tablet. We placed the tablet in the friability tester and rotated it up to 100 times at a speed of 25 rotations per minute before removing it and freeing it from the dust. The tablets were reweighed, and the friability (F) percentage of the tablets was calculated using the equation (5) [22].
 . . . . . . (5)
Notes: W1 = weight of tablets prior to test and W2 = mass of test leaf tablets
Preparation of phosphate buffer solution pH 7.4
A total of 50 ml of KH2PO4 0.2 M and 39.1 ml of NaOH 0.2 N were mixed into a beaker glass then diluted with CO2 free water up to 200 ml. The pH of the solution was measured with a pH meter to obtain a pH of 7.4±1 with or without the addition of 0.2 N NaOH solution and 0. 2 N HCl [20].
Determination of the maximum wavelength
The theophylline standard solution was prepared by weighing 200 mg of theophylline and dissolving it in 100 ml of phosphate buffer pH 7.4. The previously prepared solution was taken up to 1.0 ml and diluted to 100 ml with phosphate buffer. The dissolved solution was placed in the cuvette. Its absorption was recorded in red at a wavelength of 250-300 nm, so that the maximum Wavelength with the maximum absorption length was found.
Preparation of standard solution
Theophylline standard solution was taken in an amount of 50; 100; 200; 300; 400; 500; 600; 700; 800 μl; then dissolved in 10 ml of phosphate buffer pH 7.4. The theophylline solution concentration series was measured with a UV spectrophotometer at the maximum Wavelength of theophylline previously obtained. The linear regression curve was plotted based on the result obtained between the theophylline levels and the absorbance result to obtain the linear regression equation.
Tablets uniformity of content test
The concentration was determined using 10 tablets of each formulation, then each tablet was diluted and 100 mg of powder was weighed. The theophylline tablet powder was dissolved in 100 ml of phosphate-buffered saline pH 7.4 and mixed until homogeneous. The theophylline tablet solution was then filtered and 1.0 ml was taken to dilute in 5 ml of phosphate buffer solution pH 7.4. Determine the red absorbance of the solution using a UV spectrophotometer at the maximum wavelength [20]. Calculate the rate (mg%) of absorbance using the linear regression curve, then the % recovery of content uniformity can be calculated [23].
Tablet dissolution test
The dissolution test was performed using a dissolution apparatus at a speed of 50 rpm at a temperature of 37 °C±5 °C. Each theophylline tablet was first weighed and then dissolved until submerged in a phosphate buffer pH 7.4 medium of 900 ml. Dissolved for 6 h and did sampling as much as 5 ml at 5, 10, 15, 30, 60, 90, 120, 150, 180, 210, 240, 270, 300, 330, 360 min. Each sampling procedure required replacement of the pH 7.4 phosphate buffer medium with the same amount of sample volume. Samples were filtered and diluted, then the absorbance of the solution was read at the maximum Wavelength of 272 nm using a UV spectrophotometer [23]. The % dissolution rate of theophylline was calculated from the absorption result.
Data analysis
All data were analyzed using Design-Expert version 13 software with SLD optimization to obtain the optimal formula. The kinetic profile of theophylline release from the matrix was calculated based on the zero order, first order, Higuchi, and Korsmeyer-Peppas kinetic formulas using Microsoft Excel.
RESULTS AND DISCUSSION
Results of granule physical properties test
The results of physical properties test of theophylline granules are shown in table 4.
Table 4: Results from the physical test of the formula of theophylline tablets with the combination of EC and XG matrix using the simplex lattice design method
| Test | Formula’s code | ||||||
| F1 | F2 | F3 | F4 | F5 | F6 | F7 | |
| Flowability rate (g/sec) | 13.87±0.54 | 11.89±0.27 | 11.40±0.30 | 12.58±0.21 | 12.45±0.14 | 11.32±0.14 | 12.60±0.12 |
| Angle of repose (degree) | 33.54±0.53 | 33.34±0.53 | 34.07±0.57 | 36.27±0.62 | 34.91±1.06 | 34.80±0.98 | 34.54±0.77 |
| Tapped (%) | 13.60±0.80 | 12.80±0.00 | 12.53±1.22 | 13.87±0.92 | 14.40±0.00 | 14.67±0.46 | 13.87±0.46 |
*Data are presented as mean±standard deviation (SD); n = 3.
Notes: F1 is a formula that contains EC: XG ratio of 80: 120 mg; F2 is a formula which contains the EC: XG ratios of 110: 90 mg; F3 is a formula that contains the EC: XG ratio of 120: 80 mg; F4 is a formula that contains the EC: XG ratio of 90: 110 mg; F5 is a formula that contains the EC ratio: XG of 100: 100 mg; F6 is a formula that contains the EC: XG ratio of 120: 80 mg; and F7 is a formula that contains the EC: XG ratio of 80: 120 mg.
Flowability rate of granule
Granules with good flow properties will affect the tablet-making process. If the granulate flows easily, the resulting tablets will have good weight uniformity [24]. Table 4 shows the results of the flow rate test on all formulas ranging from 11-14 g/sec so that all formulas have good flow properties due to the grain flow speed ≥10 g/sec [17]. The SLD program with the linear model was obtained, the response equation of the granule flow rate combination of two EC-XG matrix materials was shown in equation (6), and the ANOVA analysis result showed a p-value value of 0.0057 (<0.05), which means the different result for all formulas against the granule flow rate is significant. The result of lack of fit value is 0.9826 (>0.05), which means there is no significant deviation in all formulas to the flow rate response.
 ……………… (6)
Notes: A = ethyl cellulose (EC), and B = xanthan gum (XG)
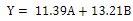
Based on equation (6), the XG coefficient is larger than the EC, it can be concluded that the most influential component on the flow rate is XG. It is consistent with the study that XG has good and stable flow characteristics compared to EC [25]. fig. 1 shows the flow rate chart of the combination of EC 80 mg and XG 120 mg produces a greater flow rate compared to the combination of EC 120 mg and XG 80 mg, so the more XG concentration it will increase the flow rate of the granules, otherwise the more EC concentration it will decrease the flow rate of the granules. The formula with the amount of EC 80 mg and XG 120 mg produces the fastest flow rate compared to other formulas, as shown in fig. 1.
Angle of repose
Table 4 shows that the angle of repose test results of all formulas range between 33 -35 so that all formulas have good angle of repose because they are in the range 20 -40 [26]. The SLD program with the cubic model was obtained, the response equation of angle of repose written on the equation (7), the ANOVA analysis showed p-value 0.0536 (>0.05), which means the different result is not significant in all formulas against angle of repose. The lack of fit value>0.05, which is 0.9307, means that there is no significant deviation in all formula against the angle of repose responses.
 …… (7)
Notes: A = ethyl cellulose (EC), and B = xanthan gum (XG)
Based on equation (7) which indicates that the XG coefficient is greater than the EC coefficient, it can be concluded that XG is the most influential component against the angle of repose. The interaction between the two matrices gives a positive interaction (+2.85), which suggests that the interaction of both matrices can increase the value of the angle of repose. Formula 2 with EC 110 mg and XG 90 mg yielded results with granules with the smallest angle of repose values of 33.34 and Formula 4 with EC 90 mg and XG 110 mg gave results with the granules that have the largest angle of repose of 36.27 as shown in fig. 2. Formula that contains more XG components can increase angle of repose due to the properties of XG that are capable of adsorbing water vapour.
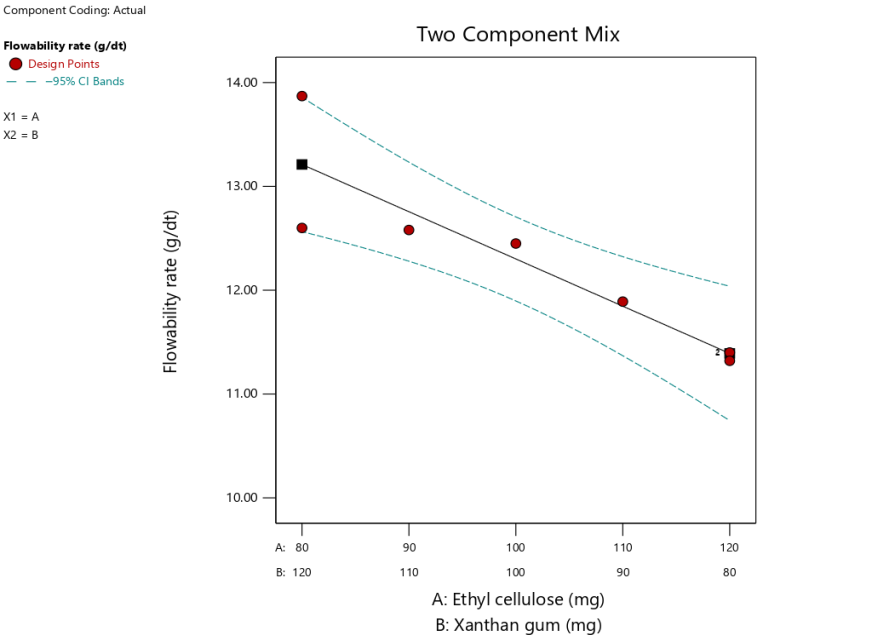
Fig. 1: Graphic sustained release tablet of theophylline with a combination of EC and XG matrix to the response of the flow rate of granules with the simplex lattice design method
Fig. 2: Graphic of theophylline sustained release tablets with a combination of EC and XG matrix to a granule of angle of repose response with the simplex lattice design method
Compressibility index (T) test
The purpose of conducting a compressibility index (tapped) test is to find out how the flowability effect affects the granules. In the Table-4 it is indicated that the settings values of all formulas range between 12-15%, which means that all formulas have good granules because of settings<20% [27]. The SLD program with the quartic model was obtained, the response equation of tapped test as described in the equation (8), the ANOVA analysis showed p-value of 0.8654 (>0.05), which means the different result is not significant in all formulas against the tapped test. The result of the lack of fit value was not detected, which means that the result data cannot be analysed in all formulas.
… (8)
Notes: A = ethyl cellulose (EC), and B = xanthan gum (XG)
Based on the equation (8) shows that the EC coefficient is similarity the XG coefficient, then it can be concluded that the more influential component on the setting is XG. The interaction of two matrices has a positive value (+2.93), which means that the two-matrix combination can increase the compressibility index.
Based on the graph in fig. 3 shows that the combination of EC 115 mg and XG 85 mg matrix yields the lowest T compared to other formulas, whereas the use of EC 100 mg and XG 100 mg produces the highest T compared with other formulas. This result is that the more EC components can decrease the T value. Good compressibility aims to make the tablets formed have good strength so that they are not vulnerable to fragility in the process of drug distribution [28].
Tablet physical properties test
The results of examining the physical properties of sustained-release theophylline tablet are summarized in table 5.
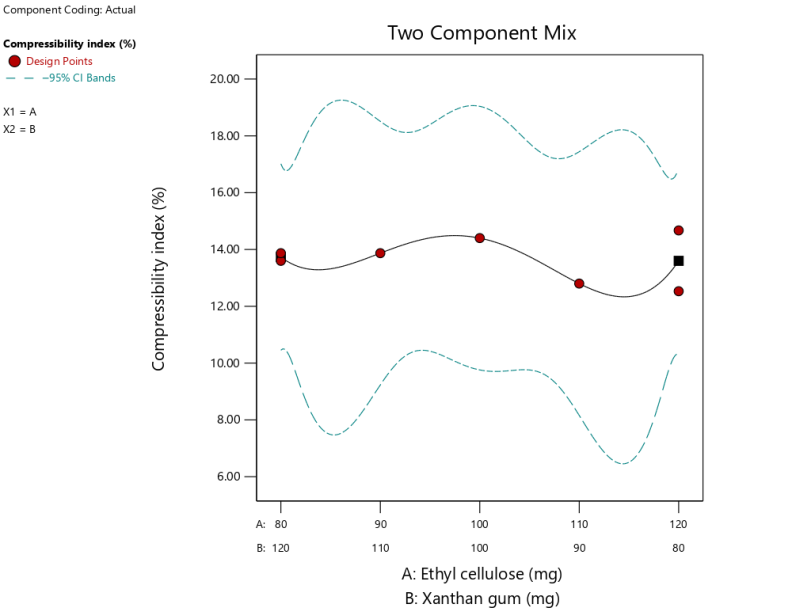
Fig. 3: Graphic of theophylline sustained release tablets with a combination of EC and XG matrix to granules of compressibility index response with simplex lattice design method
Table 5: The results of the examination of the physical properties of theophylline sustained release tablets with a combination of EC and XG matrices using the simplex lattice design method
| Test | F1 | F2 | F3 | F4 | F5 | F6 | F7 |
| Weight uniformity** (CV%) | 0.24±1.45 | 0.45±2.76 | 0.53±3.19 | 0.55±3.36 | 0.37±2.24 | 0.53±3.18 | 0.32±1.95 |
| Tablet hardness** (kg) | 14.70±1.75 | 13.86±1.50 | 12.95±0.45 | 14.88±0.64 | 17.14±0.85 | 18.01±0.75 | 19.35±0.66 |
| Tablet friability* (%) | 0.32±0.05 | 0.31±0.05 | 0.41±0.26 | 0.47±0.06 | 0.37±0.08 | 0.26±0.07 | 0.51±0.13 |
| Drug content uniformity* (% recovery) | 99.90 | 98.01 | 97.53 | 97.47 | 97.87 | 98.61 | 97.92 |
| Dissolution rate* (mg/h) | 13.05 | 10.87 | 10.70 | 12.81 | 11.84 | 10.15 | 13.1 |
*Data are presented as mean±standard deviation (SD); n = 3, **Data are presented as mean±standard deviation (SD); n = 10, Notes: F1 is a formula that contains EC: XG ratio of 80: 120 mg; F2 is a formula which contains the EC: XG ratios of 110: 90 mg; F3 is a formula that contains the EC: XG ratio of 120: 80 mg; F4 is a formula that contains the EC: XG ratio of 90: 110 mg; F5 is a formula that contains the EC ratio: XG of 100: 100 mg; F6 is a formula that contains the EC: XG ratio of 120: 80 mg; and F7 is a formula that contains the EC: XG ratio of 80: 120 mg
The weight uniformity of tablets
In table 5, it is shown that the test results of the formula are good, and this can be seen on the whole formula's CV result ranging from 0.2% to 0.3% so that it has met the CV value requirement of<5% [27]. The SLD program with the quartic model obtained the equivalence of the weight of the tablet combination of the two EC-XG matrices described in the equation (9); the ANOVA analysis result showed p-value value 0.0726 (>0.05), which means different results mean not significant in all formulas against the weight uniformity of tablets.
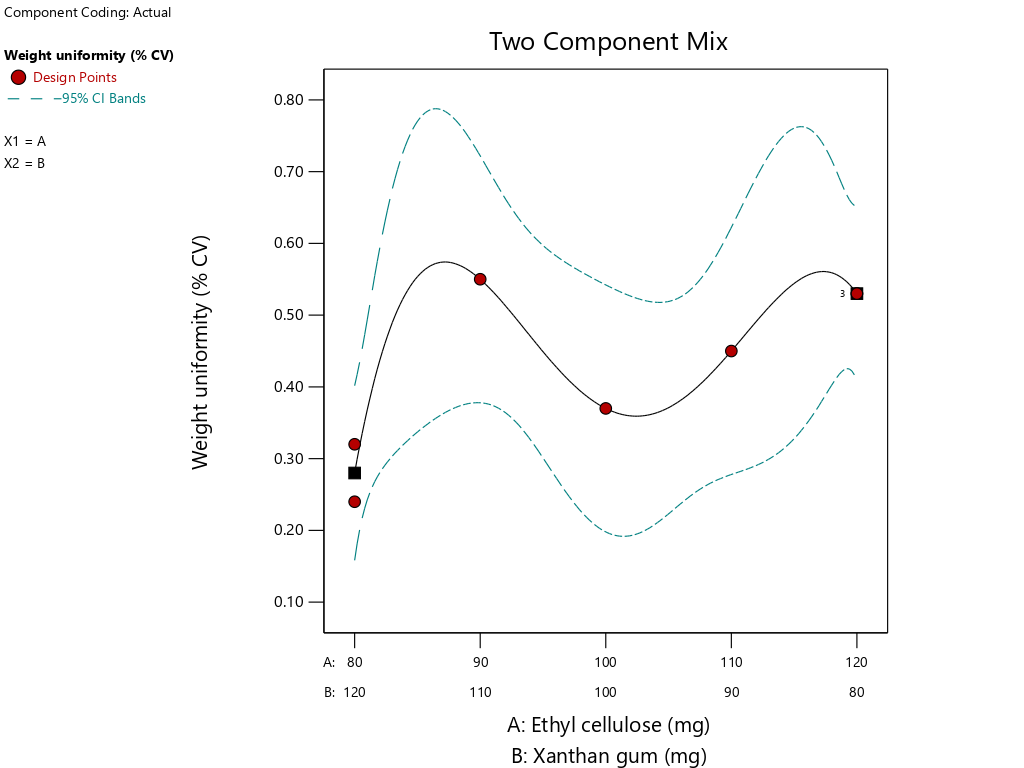
Fig. 4: Theophylline sustained release tablet graph with a combination of EC and XG matrix to tablet weight uniformity response with simplex lattice design method
The result of the lack of fit value was not detected, which means that the result data cannot be analysed in all formulas.
…… (9)
Notes: A = ethyl cellulose (EC), and B = xanthan gum (XG)
Based on equation (9) that indicates that the EC coefficient is higher than the XG coefficient, EC is the most influential component on weight uniformity. The interaction of both matrices gives a negative interaction (-0.140), which means that the interaction between the two matrices can decrease %CV on weight uniqueness.
The graph in fig. 4 shows that the combination of EC 120 mg and XG 80 mg yields the lowest %CV value, which means that in combination the two components yield the most uniform weight consistency result among the other formulas, whereas the 90 mg EC combination and the 110 mg XG yielded the highest %CV result which meant that in a combination both of the components gave the least uneven weight uniformity result amongst the other formulas. This result that high XG components can increase %CV values and thus decrease tablet weight uniformity.
Hardness test of tablet
Table 5 shows that the hardness test results on the whole tablet range between 12-18 kg, so all formulas have met the hardness requirement of sustained-release tablets ranging between 10-20 kg [29]. The SLD program with a quadratic model was obtained with the equation described in the equation (10), the ANOVA analysis result showed a p-value value 0.7977 (>0.05) which means the different result is not significant in all formula against tablet hardness. The lack of fit value>0.05, which is 0.7961, means that there is no significant deviation in all formula against hardness of tablet responses.
 ………… (10)
Notes: A = ethyl cellulose (EC), and B = xanthan gum (XG)
Based on the equation (10) that indicates that the XG coefficient is higher than the EC coefficient, then it can be concluded that the most influential component on the hardness of the tablet is XG. The graph on fig. 5 shows that the combination of EC 80 mg and XG 120 mg produces the tablet that has the highest strength value among other formulas, whereas the combinations of EC 120 mg and XG 80 mg produce the lowest strength tablet among other formulas.
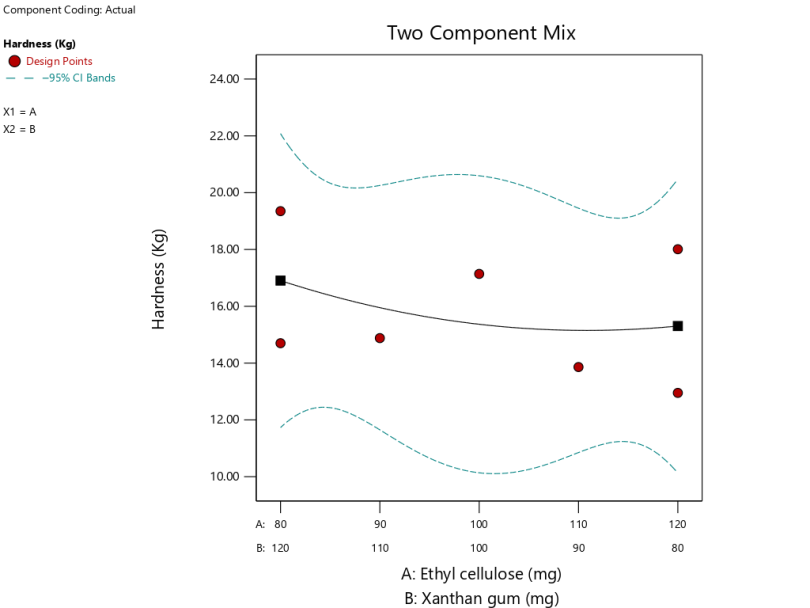
Fig. 5: Graphic of theophylline sustained release tablets with a combination of EC and XG matrix against tablet violent response by simplex lattice design method
The compression pressure and the properties of the ingredients in the formula are factors that can affect the hardness of the tablet [30]. All formulas are printed using the tablet machine by giving the same compression pressures, then another factor that can influence the strength of tablets is the property of ingredients within the formula. These results are that XG has good compressibility so that it increases the strength of tablets, then the tablet strength can increase even more if the XG components are added more and more. Tablets that have high hardness mean that the bond between particles is strong, so that in the event of a shock the tablet is not easily damaged [31].
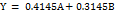
Friability of tablet
The friability test was carried out with the aim of determining the strength of non-salute tablets against friction [32]. Table 5 shows that the friability test results on the whole tablet have fragilities ranging between 0.26-0.51% so that the tablets manufactured have met the friability requirement of tablets that is less than 1% [29]. The SLD program with the linier model was obtained with the equation described in the equation (11), the ANOVA analysis result showed a p-value 0.2404 (>0.05), which means that the different results are not significant in all formulas against tablet friability. The lack of fit value>0.05, which is 0.9185, means that there is no significant deviation in all formula against hardness of tablet responses.
 ……… (11)
Notes: A = ethyl cellulose (EC), and B = xanthan gum (XG)
Based on the equation (11) indicating that the EC coefficient is high compared to the XG, then it can be concluded that the more dominant component influencing tablet friability is the EC. There was not interaction of both matrices.
The graph on fig. 6 shows that the combination of EC 80 mg and XG 120 mg produces tablets that have the lowest friability value among other formulas. Tablet friability is influenced by several factors, such as the properties of the granule flow, the hardness of the tablet, and the matrix used [33]. Ethyl cellulose is an insoluble water matrix, at the time of granulation with the addition of EC binding material less able to absorb water so less merge with other materials to form a compact granule, therefore when dried will form a more fragile granule and, when casting will form tablets that are easily fragile on the tablet surface.
The uniformity of content of tablet
The purpose of the content uniformity test is to find out that theophylline has been mixed evenly in the granules. A good tablet has an active substance content in the range of 85-115% [21]. Based on the results of the content uniformity test shown in Table-5 showing that the whole tablet has fulfilled the content uniformity requirement because it has a content compatibility value of 97-99%. The SLD program with the quartic model was obtained and described in the equation (12), the ANOVA analysis result showed a p-value value 0.8374 (>0.05), which means the different result is not significant in all formulas with respect to the tablets' contents compatibility. The result of the lack of fit value was not detected, which means that the result data cannot be analysed in all formulas.
 ……….. (12)
Notes: A = ethyl cellulose (EC), and B = xanthan gum (XG)
Based on equation (12), which shows that the XG coefficient is slightly larger than the EC coefficient, it can be concluded that XG has more influence on the uniformity of tablet content. The interaction of both matrices gives a negative interaction (-2,48), which means that the interaction between the two matrices can decrease the uniformity of the active substance content of the tablets.
The graph in fig. 7 shows that the graph curve is curved downwards, which means at the use of EC 100 mg and XG 100 mg results in the lowest consistencies of the contents compared to other formulas. The abnormality in the weight of the tablet, the separation of the active substance from the other ingredients of the mixture, and the uneven mixture of the substance during the granulation are some of the factors affecting the consistency of the contents [19]. XG is one of the main ingredients that enhances content diversity due to its ability to improve the flow properties of the granules and improve the diversity of the content.
Dissolution test
Dissolution testing can now be employed for both the in vitro in vivo corelation (IVIVC) allows prediction of the in vivo performance of a drug based on the in vitro drug release profiles and quality control approaches thanks to recent developments in dissolution methodologies[34]. Dissolving a drug from a preparation on a particular medium is known as dissolving [35]. The dissolution profile of tablets can be described by the percentage of dissolved; the longer the time, the higher the level of the medication [36]. In the dissolution test, a phosphate buffer solution with a pH of 7.4 was used to represent the fluid in the intestines.
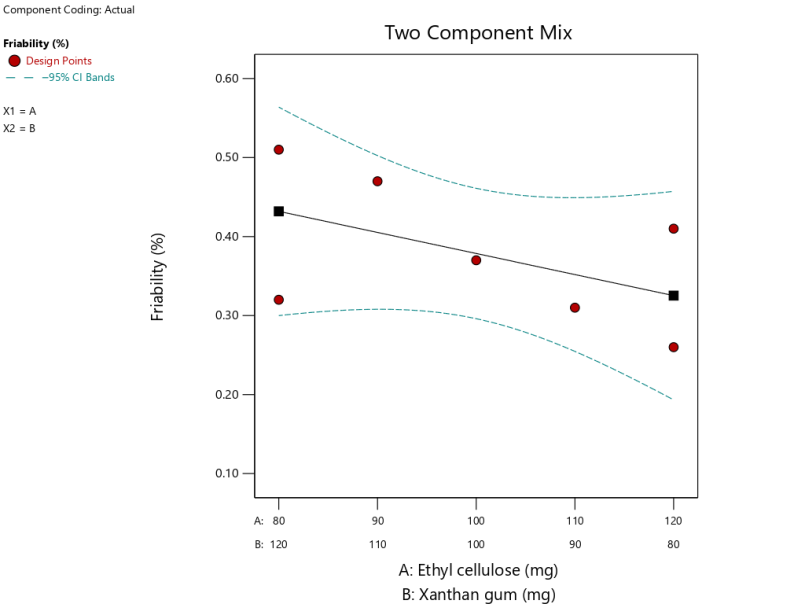
Fig. 6: Theophylline sustained release tablet graph with a combination of EC and XG matrix against tablet friability response by simplex lattice design method
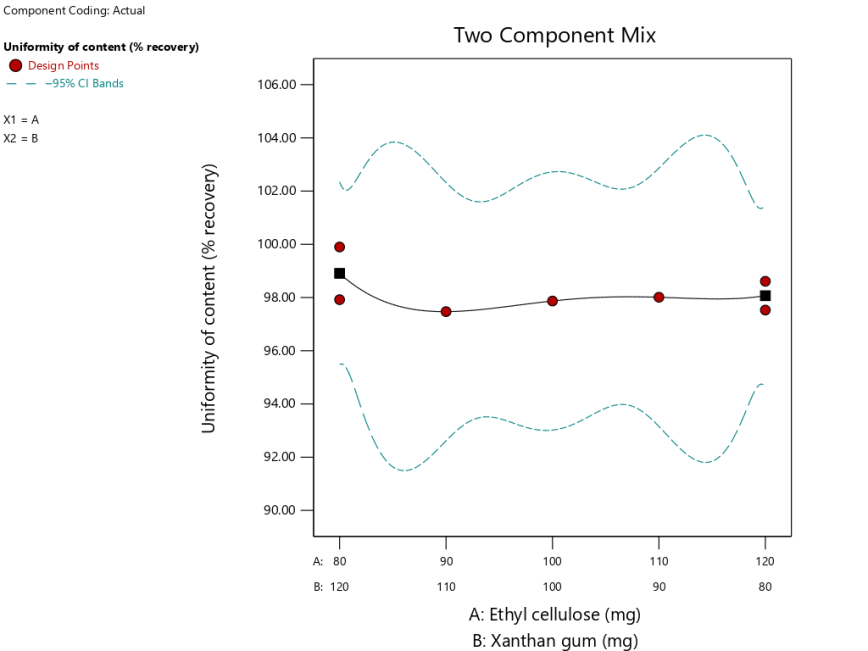
Fig. 7: Theophylline sustained release tablet graph with a combination of EC and XG matrix to a content uniformity (%recovery) response with simplex lattice design method
Fig. 8: The theophylline sustained release tablet dissolved rate curve with a combination of EC and XG (Qt) matrix against time (t)
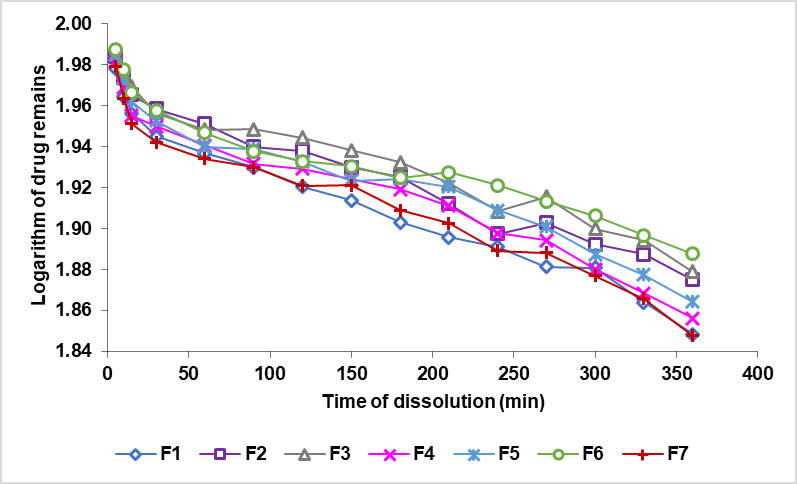
Fig. 9: The logarithmic curve of the quantity of the drug left in the sustained release tablets of theophylline with a combination of the EC and XG matrix (Log (Qo-Qt)) against time (t)
The results of the theophylline's dissolving sustained release tablets are expressed in (%) dissolved form. The zero-order curve, comparing the % dissolved rate to the time shown in fig. 8. The order curve 1, compares the logarithm of the remaining quantity of the drug (Log (Qo-Qt)) to that of the time depicted in fig. 9. The Higuchi curve is compared to the minute root as shown in fig. 10.
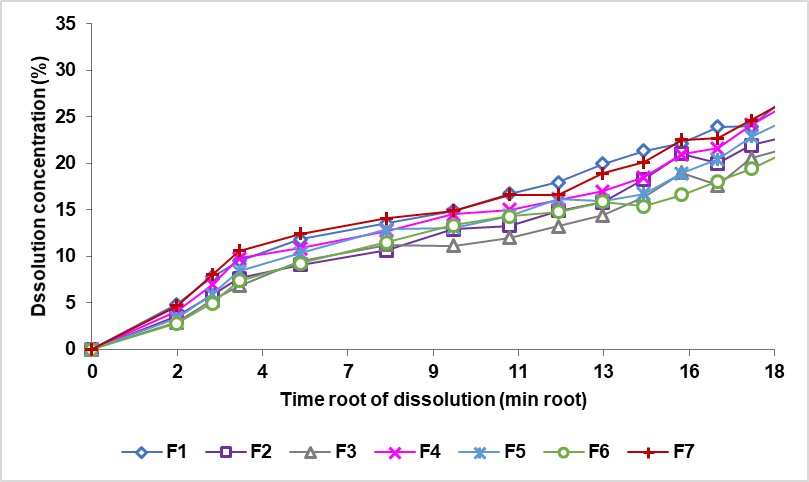
Fig. 10: The theophylline sustained release tablet dissolved rate curve with a combination of EC and XG matrix (Qt) against time root (√t)
A sustained release preparation would ideally have a drug release model following the zero order [37], since the matrix system would release the drug at a rate constant. The value of the correlation coefficient of the formula compared with the value of the table correlations (N-2=13, a significant level of 0.05) is 0.5139, which can be understood that all the formulas have a larger line correlation coefficient compared with the table correlation coefficient and indicates that all the formulas follow the four kinetic models of drug release. Based on the values of the correlation coefficient, as shown in table 7, obtained from the zero order, first order, Higuchi and Korsmeyer-Peppas conic models, all the formulas follow the kinetics of the Higuchi model, which can be seen from the magnitude of the kinetic correlation coefficient of the Higuchi>Korsmeyer-Peppas>first order>zero order model, as shown in table 6. Drug release controlled by matrix erosion then indicates the relationship between the number of drugs released versus linear time, whereas drug release controlled by diffusion then indicates the relationship between the number of drugs released versus linear time root. In the Korsmeyer-Peppas model kinetics, if the value n<0.5, the drug release follows the diffusion mechanism; if the value n>1, the release follows the erosion mechanism, and if the value 0.5.
Table 6: The theophylline sustained release tablet drug release curve equation with a combination of EC and XG matrices
| Formulas | Curve equation (% dissolution concentration) | |||
| Zero-order | First order | Higuchi | Korsmeyer-Peppas | |
| F1 | y = 0.0575x+8.5791 | y =-0.0003x+1.9622 | y = 1.2526x+3.5128 | y = 0.3609x+0.4988 |
| F2 | y = 0.0529x+6.5100 | y =-0.0003x+1.9717 | y = 1.1481x+1.8904 | y = 0.4013x+0.3354 |
| F3 | y = 0.0493x+5.9516 | y =-0.0003x+1.9742 | y = 1.0649x+1.7165 | y = 0.4098x+0.2826 |
| F4 | y = 0.0555x+7.6727 | y =-0.0003x+1.9666 | y = 1.1943x+2.9489 | y = 0.3693x+0.4484 |
| F5 | y = 0.0531x+7.0056 | y =-0.0003x+1.9695 | y = 1.1495x+2.4128 | y = 0.3966x+0.3612 |
| F6 | y = 0.0447x+6.7803 | y =-0.0002x+1.9699 | y = 0.9930x+2.6311 | y = 0.4086x+0.2912 |
| F7 | y = 0.0556x+8.7591 | y =-0.0003x+1.9614 | y = 1.2021x+3.9608 | y = 0.3472x+0.5247 |
Notes: Zero order: x = time (minutes), y = dissolved concentration (%), First order: x = time (minutes), y = logarithm drug remains, Higuchi: x = square root time (root minutes), y = dissolved concentration (%), Korsmeyer-Peppas: x = logarithm time (log minutes), y = logarithm dissolved (%)
Table 7: The value of the correlation coefficient of the theophylline tablet release drug sustained release with the combination of the EC and XG matrices and the value of table correlations
| Formulas | r value | ||||
| Zero order | First order | Higuchi | Korsmeyer-Peppas | Value of r | |
| F1 | 0.9568 | 0.9671 | 0.9799 | 0.9763 | (N-2 = 13 significant level 95%), r value = 0.5139 |
| F2 | 0.9620 | 0.9703 | 0.9795 | 0.9748 | |
| F3 | 0.9495 | 0.9556 | 0.9545 | 0.9539 | |
| F4 | 0.9559 | 0.9624 | 0.9554 | 0.9502 | |
| F5 | 0.9413 | 0.9489 | 0.9511 | 0.9511 | |
| F6 | 0.9039 | 0.9179 | 0.9608 | 0.9540 | |
| F7 | 0.9481 | 0.9570 | 0.9570 | 0.9473 | |
Based on the result of the dissolution in fig. 11 shows that a formula with a EC concentration greater than XG produces the longest release of the drug among other formulas, formulas with a XG concentration larger than EC produces a drug release the fastest among other formulas. Ethyl cellulose is a hydrophobic matrix, so it can inhibit the release of drugs in the blood by forming a gel layer to keep the drug in the matrix. Xanthan gum is a water-soluble matrix that will expand and erode when in contact with the medium [9, 38].
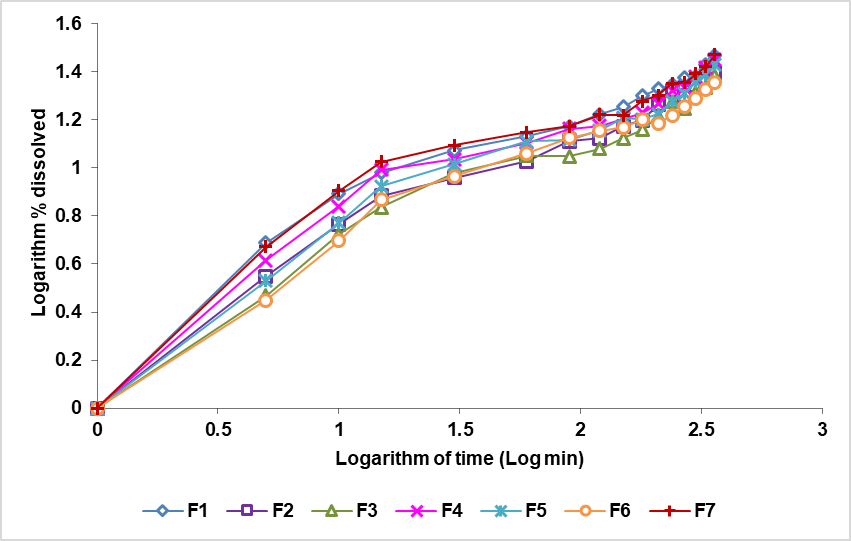
Fig. 11: The theophylline sustained release tablet dissolved percentage logarithm curve with a combination of the EC and XG (Qt) matrix against the time logarithm (log t)
The SLD program with a linear model obtained the equivalence of the response rate of dissolution of the tablet combination of the two EC-XG matrices described in equation (13). The ANOVA analysis yielded a p-value of<0.05, which was less than 0.0001, indicating that the observed differences were statistically significant for all formulas with regard to the dissolution rate. The lack of fit value is greater than 0.05, indicating that there is no significant deviation in all formulas with regard to the hardness of the tablet responses. The value is 0.5987.
 ………… (13)
Notes: A = ethyl cellulose (EC), and B = xanthan gum (XG)
Equation (13) indicates that the XG coefficient is greater than the EC coefficient, which allows the conclusion to be drawn that the most influential component on the dissolution rate of theophylline sustained-release tablets is XG.
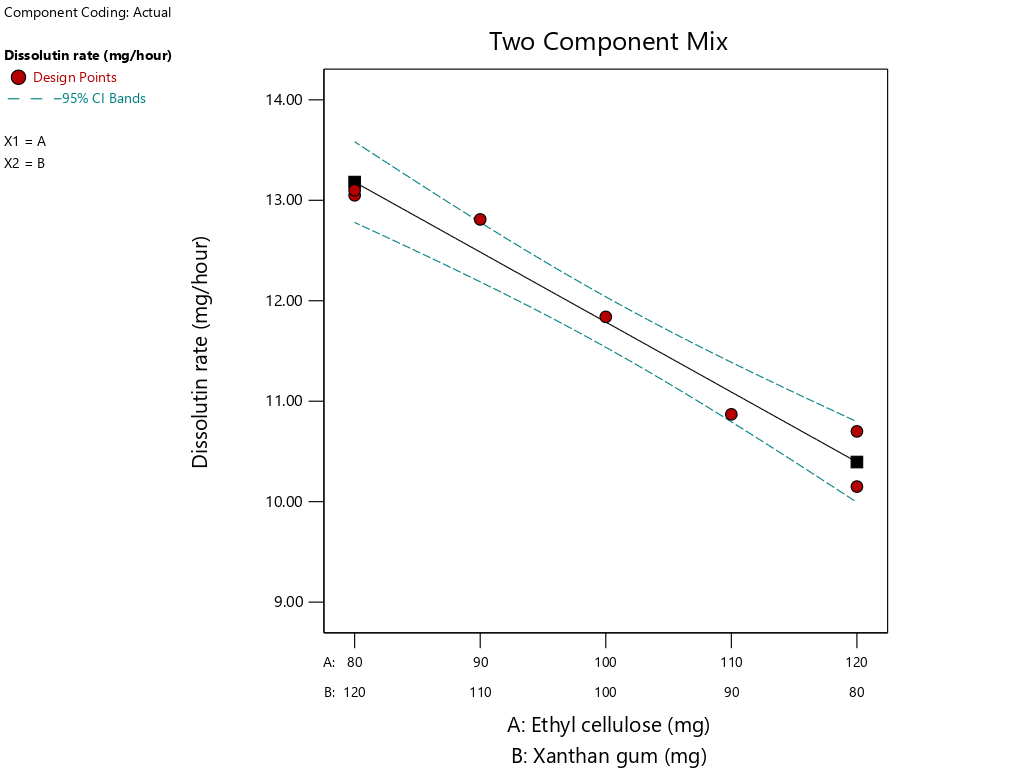
Fig. 12: Graphic sustained release tablet of theophylline with a combination of EC and XG matrix to the dissolution rate (mg/h) response with SLD method
As illustrated in fig. 12, the combination of 80 mg EC and 120 mg XG yields the tablet with the fastest dissolution rate, while the combination of 120 mg EC and 80 mg XG produces the tablet with the slowest dissolution rate. This is due to the fact that ethyl cellulose is less water-soluble, which allows for the control of drug release and maintenance of the drug within the matrix for a period of 12 h by preventing the ingress of water [10].
Determination of optimum formula
The optimum formula is determined by processing the physical property response obtained from each formula measured with the optimum criteria using the Design Expert software [39]. The determination of the optimum formula in this research was done using the Design Expert 13.0 program with the SLD model. The optimized components are ethyl cellulose and xanthan gum, which are the matrix as drug release controllers on theophylline sustained-release tablets. Experimental results such as flow properties of granules (flow rate, angle of repose, and compressibility index), tablet determination such as weight uniformity, hardness, friability, content uniformity, and dissolution rate are included in Design-Expert version 13.0 as shown in table 9 with the criteria defined to obtain the optimal formula as shown in table 8.
Table 8: The criteria for determining an optimize formula
| Parameter | Criteria | Standards | Limitation | Importance |
| Flowability rate of granule (g/sec) | maximize | ≥10 | 10-14 | +++ |
| Angle of repose (ᵒ) | minimize | 20-40 | 20-40 | +++ |
| Compressibility index (%) | minimize | 8-15 | 12-15 | +++ |
| Weight uniformity (%CV) | minimize | <5% | 0.24-5 | +++ |
| Hardness (kg) | maximize | 10-20 | 10-20 | +++ |
| Friability (%) | minimize | <1% | 0.26-1 | +++ |
| Uniformity of content (%) | maximize | 100 | 95-105 | +++ |
| Dissolution rate (mg/hour) | target | 12.5 | 10.15-13.1 | +++ |
Table 9: The result equation optimization of physical properties of granules and physical-chemical property of theophylline sustained release tablets using SLD method
| Test | Models | Equation | p-value | Lack of fit | Adjusted R2 | Predicted R2 | Adequate precision |
| Flowability rate (g/sec) | Linier | Y = 11.39A+13.21B | 0.0057 | 0.9826 | 0.7733 | 0.5434 | 8.1728 |
| Angel of repose (degree) | Cubic | Y = 34.44A+34.04B+2.85AB – 16.88B(A-B) | 0.0779 | 0.9307 | 0.7365 | 0.4763 | 7.6500 |
| Compressibility index (%) | Quartic | Y = 13.60A+13.74B – 2.93AB – 5,35AB(A-B) – 18.81AB(A-B)2 | 0.8654 | - | 0.8995 | NA | 1.7554 |
| Uniformity weight (CV%) | Quartic | Y = 0.530A+0.280B-0.140AB – 0.120AB(A-B)+2.590AB(A-B)2 | 0.0726 | - | 0.8891 | NA | 7.9867 |
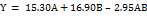
| Hardness (kg) | Quadratic | Y = 15.30A+16.90B – 2.95AB | 0.7977 | 0.7961 | -0.3397 | -2.0603 | 0.9833 |
| Friability (%) | Liner | Y = 0.4145A+0.3145B | 0.2404 | 0.9185 | 0.1142 | -0.7169 | 2.3490 |
| Uniformity of content (%recovery) | Quartic | Y = 98.07A+98.91B-2.48AB+5.12AB (A-B) – 6.08AB (A-B)2 | 0.8374 | - | -0.7902 | NA | 1.5109 |
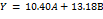
| Dissolution rate (mg/h) | Linier | Y = 10.40A+13.18B | <0.0001 | 0.5987 | 0.9557 | 0.9246 | 20.1565 |
Notes: Y = Responses, A = EC, B = XG,-= undetected, and NA = case with leverage of 1.000
Table 10: The theophylline sustained release tablet optimum formula prediction results with a combination of EC and XG matrix using the SLD method
| Response | Prediction of optimum formula, [EC: XG = 107.03 mg: 92.97 mg] |
| Flowability rate of granule (g/sec) | 11.98 |
| Angle of repose (ᵒ) | 33.65 |
| Compressibility index (%) | 13.36 |
| Uniformity tablet weight (%CV) | 0.40 |
| Hardness tablet (kg) | 15.18 |
| Friability of tablet (%) | 0.36 |
| Uniformity of content tablet (mg) | 98.03 |
| Dissolution rate (mg/h) | 11.30 |
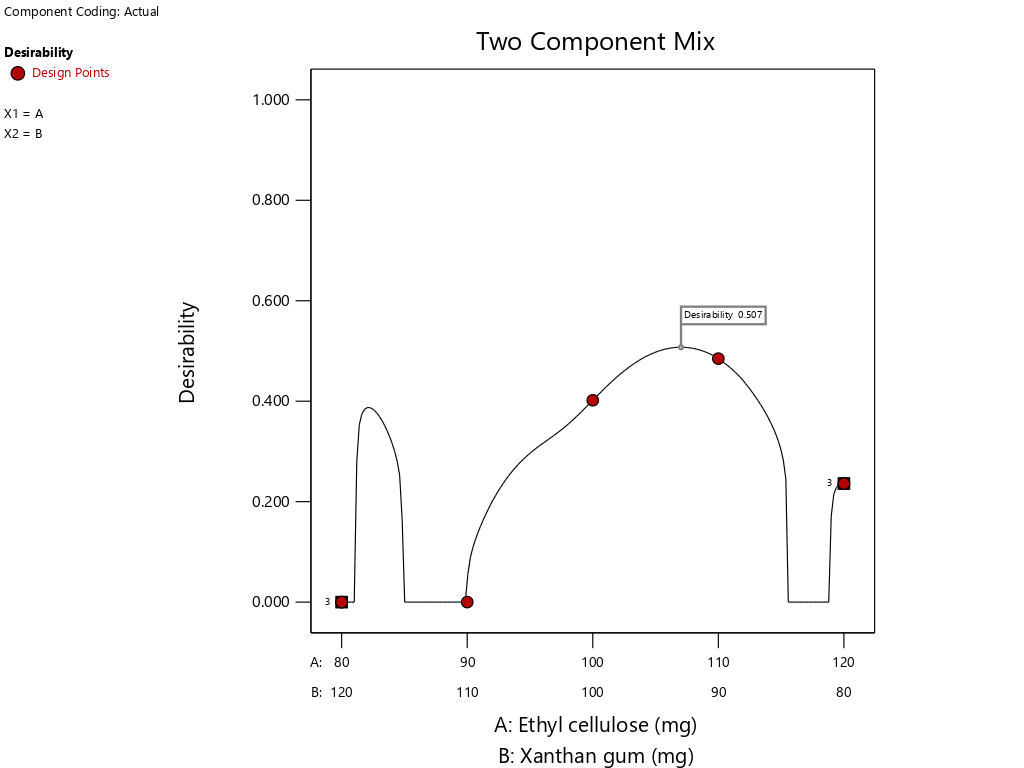
Fig. 13: The result of optimum point determination of theophylline sustained release tablets with a combination of EC and XG matrix using design expert version 13 (Licence) that desirability value is 0.507 (107.03 mg: 92.97 mg)
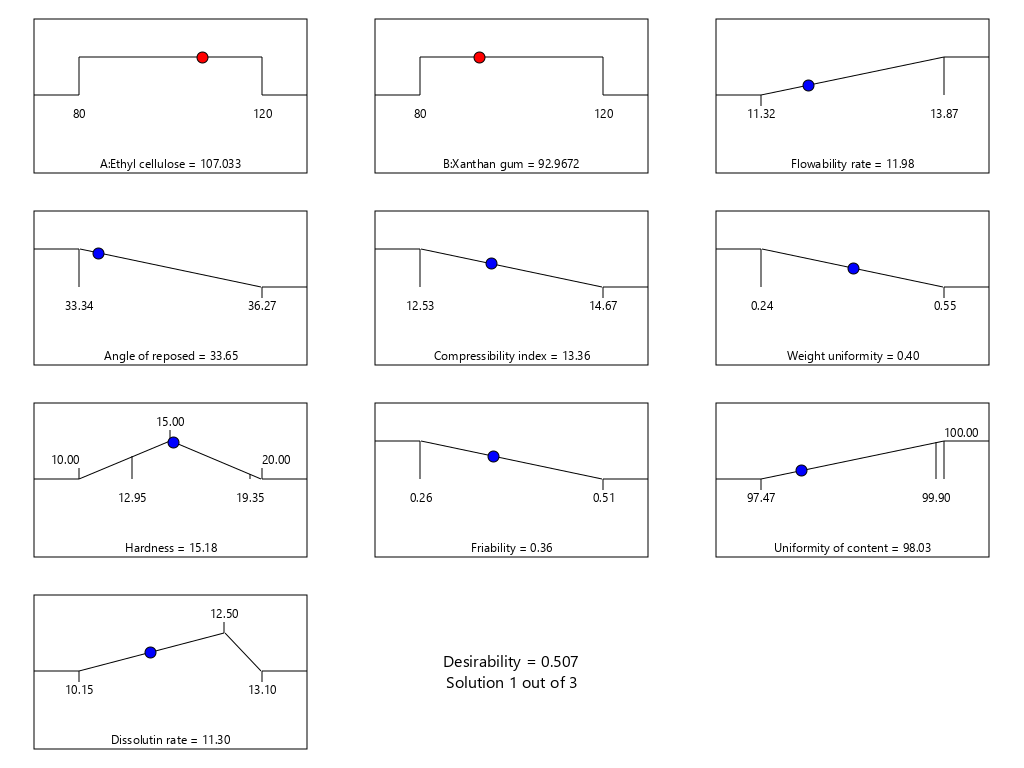
Fig. 14: The resume of optimum point determination of theophylline sustained release tablets with a combination of EC and XG matrix using design expert version 13
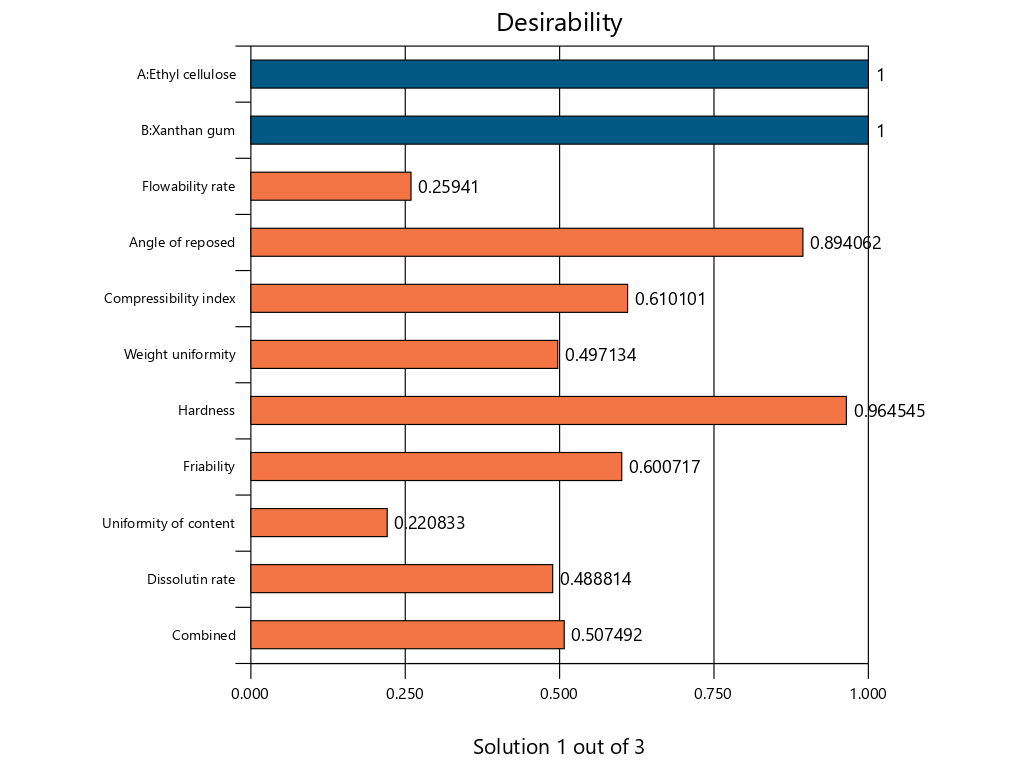
Fig. 15: The bar graph of desirability of optimum point determination of theophylline sustained release tablets with a combination of EC and XG matrix using design expert version 13
The result of prediction data using SLD method gives an optimum formula prediction EC 107.03 mg and XG 92.97 mg with a desirability value of 0.507 as seen in fig. 13 and fig. 14, the bar graph of desirability of optimum point determination as seen in fig. 15. The desirability value ranges from zero to one, this value is used to indicate how well the SLD program is able to meet the desire based on the criteria and weighting that have been set [40]. If the desired value is high, the perfection in achieving the desired result will be increased. The optimum formula obtained by the SLD program along with the predicted response result of the formula, is shown in table 10.
CONCLUSION
The combination of EC and XG matrices can affect the physical properties of the granules and theophylline sustained release tablets, i. e., increasing the concentration of XG compared to EC increases the flowability, angle of repose, compressibility index, uniformity of weight, hardness, content of uniformity and dissolution rate. Using a higher concentration of EC than XG will increase the friability of the tablet. The interaction of EC and XG will improve the angle of repose, weight uniformity and friability as well as may decrease the percentage of compression and diversity. The drug release from the matrix is slower with the larger EC; the release patterns produced by the combination of EC and XG follow the kinetics of zero order, order one, Higuchi, and Korsmeyer-Peppas. A combination of EC of 107.03 mg and XG of 92.97 mg is an optimal formulation combination recommended by the SLD method with a desirability value of 0.507.
ACKNOWLEDGEMENT
On this occasion we would like to express our gratitude to the PP-Muhammadiyah as the Funding and Implementation of the Muhammadiyah National Research Grant Batch VII Year 2024 with the number: 0258.461/I.3/D/2024, LPMPP-UMS who has facilitated this research activity and the Faculty of Pharmacy of UMS which has provided the facilities of the laboratory for this research.
AUTHORS CONTRIBUTIONS
Suprapto acts as data processing, data analysis, and make manuscript of article publication. Riza Maulana acts as helped in data analysis and article correction. Rima Munawaroh acts as helped in data analysis and article correction. Rafika Hanifah Jauhari acts as data collection and data processing.
CONFLICT OF INTERESTS
All authors declare no conflict of interest.
REFERENCES
Indonesian National Drug Information Centre. Jakarta: Food and Drug Administration of the Republic of Indonesia; 2008.
Suprianto. Formulation and determination of theophylline release order of granule preparation of chitosan mixture with methylcellulose. Akademia. 2013;17(2):58-62.
Ahirrao S, Gide P, Shrivastav B, Sharma P. Extended release of theophylline through sodium alginate hydrogel beads: effect of glycerol on entrapment efficiency drug release. Part Sci Technol. 2014;32(2):105-11. doi: 10.1080/02726351.2013.809396.
Handiana IR, Indriyati W. Theophylline sutained release tablet formulation with hydrophilic characterised matrix materials. Pharmaka Suppl. 2016;14(1):136-41.
Khan S, Monika. Circadian rhythms regulated asthma treatment by virtue of pulsatile drug delivery system. Int J App Pharm. 2022;14(4):1-8. doi: 10.22159/ijap.2022v14i4.44395.
Akbari W, Chaerunisaa AY, Abdassah M. Regulation of drug release from tablets with carrageenan matrix system. Maj Pharmaceutics. 2020;5(3):124-36.
Wilson CG. Controlled release in oral drug delivery. London: Springer; 2011. p. 131-59.
Adyanti VV, Bestari AN, Sulaiman TN. Optimization of famotidine floating tablet formula with combination of hydroxypropyl methylcellulose K100M and ethyl cellulose polymer. Maj Farm. 2016;12(2):466-79. doi: 10.22146/farmaseutik.v12i2.27792.
Purnama H, Mita SR. In vitro study of ketoprofen via transdermal route. Farmaka. 2018;14(1):70-80.
Chowdary KP, Kalyani GS. Recent research on matrix tablets for controlled release a review. Int Res J Pharm Appl Sci. 2013;3(31):142-58.
Hastuti CS, Kuncahyo I, Dzakwan M. Optimization of sustained release tablet formula of tramadol HCl with PVP and xanthan gum mucoadhesive matrix combination by simplex lattice design. J Farm Indones. 2014;11(1):90-100.
Goswami K, Khurana G, Marwaha RK, Gupta M. Development and evaluation of extended-release ethyl cellulose-based matrix tablet of diclofenac sodium. Int J Pharm Pharm Sci. 2014;6(6):296-301.
Juweriya A, Ratnamala K. Formulation and evaluation of sintered gastroretentive tablets of pioglitazone. Int J Pharm Sci Rev Res. 2021;69(1):42-7. doi: 10.47583/ijpsrr.2021.v69i01.007.
Sopyan I, Wahyuningrum R, Insan Sunan KS. An experimental design in the optimization of various tablet excipient formulations: a concise review. Int J Appl Pharm. 2022;14(1):28-32.
Rowe RC, Sheskey PJ, Quinn ME. Handbook of pharmaceutical excipients. 6th ed. Pharmaceutical Press; 2009.
Mardhiyah ML. Optimization of sustained-release theophylline tablets using a combination of hydroxypropyl methylcellulose (HPMC) and xanthan gum matrix [thesis]. Surakarta: Faculty of Pharmacy Universitas Muhammadiyah Surakarta; 2018.
Siregar CJ, Wikarsa S. Pharmaceutical technology tablet preparations practical basics. Jakarta: ECG Medical Books; 2010.
Halim A. Farmasi Fisika Pulva Engineering. Padang: Andalas University Press; 2012.
Lachman L, Lieberman HA. Theory and practice of industrial pharmacy. 2nd ed. Jakarta: UI Press; 1994.
Indonesian Ministry of Health. Indonesian pharmacopoeia V edition. Jakarta: Ministry of Health of the Republic of Indonesia; 2014.
Indonesian Ministry of Health. Indonesian pharmacopoeia. 6th ed. Jakarta: Ministry of Health of the Republic of Indonesia: Ministry of Health of the Republic of Indonesia; 2020.
Voigt R. Textbook of pharmaceutical technology. 4th ed Noerono S translator. Yogyakarta: Gadjah Mada University; 1984.
District G, Pradesh A. Formulation and evaluation of theophylline controlled release matrix tablets by using natural gums. Int J Pharm Sci Rev Res. 2014;27(33):183-7.
Pebrianti AS, Megantara S, Wijayanti R. Review of critical quality attributes (CQA) and critical process parameters (CPP) as part of the quality by design approach in the development process of film coated tablets. 2022;7(4):255-69.
Budaya UD, Surini S. Development of coprocessed excipients of xanthan gum and acacia gum as a controlled release matrix for famotidine floating tablets. Int J App Pharm. 2020;12(1):192-6. doi: 10.22159/ijap.2020.v12s1.FF044.
Anastasia DS, Luliana S, Desnita R, Isnindar I, Atikah N. Pengaruh variasi gula terhadap karakteristik sediaan minuman serbuk instan kombinasi rimpang jahe dan temu putih. JSSCR. 2022;4(2):253-62. doi: 10.37311/jsscr.v4i2.14003.
Lieberman HA, Lachman L, Schwartz JB. Pharmaceutical dosage forms: tablets volume 1 second edition. New York: Marcel Dekker Inc; 1989.
Laili N, Komala M, Maulida H. Optimization of sago amylum concentration (Metroxylon rumphii) as co-processed in theophylline tablets. J Farm Indones. 2017;14(2):72-80.
Kurniawan DW, Sulaiman TN. Pharmaceutical preparation technology. Yogyakarta: Graha Ilmu; 2009.
Parrott EL. Pharmaceutical technology basic pharmaceutics. 3rd ed. Minneapolis: Burgess Publishing Company; 1971.
Kusuma IY, Prabandari R. Optimization of formula of piroxicam tablets using excipients lactose avicel pH 101, and amprotab with simplex lattice design method. J Farm Indones. 2020;17(1):31-44.
Purnamasari NA, Untari MK. Preparation optimization of effervescent system captopril floating tablets. Biomedika. 2015;8(2):25-31.
Rashati D, Rohmah S. Physical test of theophylline floating tablet formulation with HPMC matrix. J Ilm Pertanian Akad Farm Jember. 2022 Dec:13-20.
Davanco MG, Campos DR, Carvalho P DE O. In vitro-in vivo correlation in the development of oral drug formulation: a screenshot of the last two decades. Int J Pharm. 2020 Apr 30;580:119210. doi: 10.1016/j.ijpharm.2020.119210, PMID 32173499.
Wagner J. Biopharmaceutics and relevant pharmacokinetics. 1st ed. Hamilton: Drug Intellegen Publication; 1971.
Taufikurrahmi T, Kharimah H, Fatmawati HD, Hidayatullah S, Chabib L. Effect of crusher variation on physicochemical properties and dissolution of aminophylline tablets as asthma therapy. J Pharm Sci. 2017;4(1):74-84.
Suprianto S. Analysis of theophylline release kinetics from chitosan matrix granules. J Ilm Manuntung. 2017;2(1):70.
Parfitt K. Martindales complete drug reference. Translation: S. London: Pharmaceutical Press; 1999.
Setiyadi G, Qonitah A. Optimasi masker gel peel off ekstrak etanolik daun sirih (Piper betle L.) dengan kombinasi carbomer dan polivinil alkohol. Pharmacon. 2020;17(2):174-83. doi: 10.23917/pharmacon.v17i2.11976.
Nurmiah S, Syarief R, Sukarno Peranginangin R, Nurtama B. Application of response surface methodology in optimization of alkali-treated cottonii (ATC) processing process conditions. JPB Mar Fish. 2013:9-22.