
Int J App Pharm, Vol 17, Issue 2, 2025, 339-351Original Article
OPTIMIZATION, CHARACTERIZATION, AND IN VIVO HEPATOPROTECTIVE EVALUATION OF NAC-LOADED NANOPARTICLES USING QBD AND IMAGEJ® SOFTWARE
BHAVANA MADUPOJU1,2, ANKARAO ARETI1*, NARENDER MALOTHU1, KANTLAM CHAMAKURI2
1KL College of Pharmacy, Koneru Lakshmaiah Education Foundation, Vaddeswaram, Guntur-522502, Andhra Pradesh, India. 2Department of Pharmacy, Brilliantgrammar School Educational Society’s Group of Institutions-Integrated Campus. (Faculty of Engineering and Faculty of Pharmacy), Hyderabad-501505, Telangana, India
*Corresponding author: Ankarao Areti; *Email: ankarao@kluniversity.in
Received: 18 Aug 2024, Revised and Accepted: 15 Jan 2025
ABSTRACT
Objective: This study formulated four novel N-Acetylcysteine (NAC)-lipid nanoparticles (Solid Lipid Nanoparticles [SLN], Nanostructured Lipid Carriers, Nano Drug Conjugate Carriers, Polymer-Lipid Hybrid Nanoparticles) and characterised their physicochemical features and in vitro drug release pattern to enhance NAC's pharmacological capabilities. The study also designed to test optimised formulation's hepatoprotective efficacy in vivo using Image J®.
Methods: The homogenisation approach was the chosen for nanoparticle preparation, which was then followed by characterisation. The optimisation process was conducted utilising the box–behnken design of Quality by Design technique. Hepatoprotective efficacy study using carbon tetrachloride (CCl₄)-induced liver damage stress mouse animal model was utilised to conduct in vivo studies to study the cellular toxicity.
Results: In Fourier Transform Infrared Spectroscopy, X-ray Diffraction, and Differential Scanning Calorimetry studies, the medication and formulative components did not interact, and the lipid structure and NAC structure were unchanged. Scanning Electron Microscopy pictures show the nanoparticles' nearly spherical form and rough surface. The prepared design has an Encapsulation Efficiency (EE) of 62.56 to 86.32%. Polydispersity index ranged from 0.156 to 0.232. The SLN had a mean particle size of 96.23 to 159.10 nm. SLN had the highest release percentage (92.3) among the four varieties. Higuchi model of medication release was observed in optimised NAC-SLNs with spherical and intact chemical structure (88.95% EE, 92.35% drug release,-25.08 mv zeta potential, <200 nm of particle size).
Conclusion: Lastly, the 4 types of NAC-nanoparticles showed no statistically significant changes from SLN, making them viable antioxidant drug carriers. This work designed and formulated SLN of the hepatoprotective medication to improve bioavailability and overcome limited solubility, strong protein binding, metabolising enzymes, and efflux mechanisms. The study found that NAC can treat liver ailments if placed into a proper delivery method.
Keywords: N-acetyl cysteine, Solid lipid nanoparticles, Hepatoprotective analysis, Quality by design, Image J® software.
© 2025 The Authors. Published by Innovare Academic Sciences Pvt Ltd. This is an open access article under the CC BY license (https://creativecommons.org/licenses/by/4.0/)
DOI: https://dx.doi.org/10.22159/ijap.2025v17i2.52384 Journal homepage: https://innovareacademics.in/journals/index.php/ijap
INTRODUCTION
N-Acetylcysteine (NAC) is a well-known medicinal substance with numerous applications due to its mucolytic, antioxidant, and anti-inflammatory effects. The distribution of NAC has been widely studied using various nanocarrier methods to improve its bioavailability, stability, and controlled release. This study compares NAC-loaded Solid Lipid Nanoparticles (SLN), Nanostructured Lipid Carriers (NLC), Nanodrug Conjugate Carriers (NDC), and Polymer-Lipid Hybrid Nanoparticles (PLHP) [1].
SLN have become effective carriers for delivering drugs because they can enhance drug stability and regulate the release properties. They have the ability to enclose both H2O-soluble and fat-soluble drugs, creating a protective environment that prevents degradation [2-4]. NLC, or nanostructured lipid carriers, are a more advanced form of lipid nanoparticles that utilise a combination of liquid and solid lipids to enhance the capacity for medicine loading and increase release qualities. By including liquid lipids in NLC, the flexibility and stability are enhanced, enabling the encapsulation of a wider variety of therapeutic molecules [5]. The NDC offers an innovative approach by chemically bonding medicinal molecules to nanocarriers. This technique enhances the accuracy of drug administration and has the potential to enhance therapeutic results by augmenting the concentration of the drug at the intended location. NDC are particularly advantageous for drugs that require specialised administration methods to overcome biological obstacles [6]. PLHP synergistically include the beneficial characteristics of polymeric and lipid-based carriers. Hybrid systems provide a versatile structure to enhance the efficiency, stability, and controlled release of drugs. The polymer component enhances the structural stability, whereas the lipid component enhances the biocompatibility and solubility of medication [7-9].
By integrating the concepts of Quality by Design (QbD) into the development of these nanocarrier systems, the product is guaranteed to have quality from the very beginning. QbD is a systematic method to advance that starts with predetermined objectives and focusses on comprehending the invention and procedure, as well as controlling the procedure. This is achieved via the application of scientific principles and effective management of quality risks [10]. Implementing QbD methodologies can result in the development of more resilient and streamlined manufacturing procedures, ultimately leading to enhanced product performance. Box-Behnken Design (BBD) is a specific technique within response surface approach that is highly effective for optimising formulations. BBD enables the assessment of several variables and their interactions with a smaller number of experimental runs, resulting in improved efficiency and cost-effectiveness [11]. The utilisation of this statistical methodology is essential for identifying the most favourable circumstances for the formulation of NAC-loaded nanocarriers, guaranteeing utmost effectiveness and durability.
The aim of this comparative study is to assess the effectiveness, durability, and release patterns of NAC when enclosed in various nanocarrier systems, using QbD and BBD approaches. Through the analysis of these criteria, our objective is to determine the most appropriate nanocarrier for delivering NAC, with the potential to improve its therapeutic effectiveness and practicality in a clinical setting.
MATERIALS AND METHODS
Materials
Reddy's Laboratories in Hyderabad, India gifted samples of NAC, a clean pharmaceutical sample, and other gift polymer samples like soy lecithin and tween80 for educational purposes. Sigma Aldrich, India supplied Glyceryl Monostearate (GMS). Every relevant ingredient used in the study was of the highest quality throughout. Animals were sourced from Mahaveer enterprises, Telangana, India.
Methods
Solubility analysis
In the presence of surplus medication, excess medicine was combined with distilled H2O, ethanol, chloroform, n-butanol, methanol, 0.1 N HCl, and pH 6.8 and 7.4 buffers. Following a day in a vortex mixer, the mixtures were preserved in securely sealed, airtight containers at ambient temperature to achieve equilibrium. Equilibrated preparations underwent centrifugation at 3000 rpm for 5 min. A fraction of the supernatants was collected and diluted with phosphate buffer (pH 7.4) to determine the drug's maximal lambda by spectrophotometry. Distilled water, ethanol, chloroform, n-butanol, methanol, 0.1 N hydrochloric acid, and pH 6.8 and 7.4 buffers were combined. Following a day in a vortex mixer, the mixtures were preserved in securely sealed, airtight containers at ambient temperature to attain equilibrium. Equilibrated preparations underwent centrifugation at 3000 rpm for 5 min. A fraction of the supernatants was collected and diluted with phosphate buffer (pH 7.4) to determine the drug's maximal lambda by spectrophotometry [12].
Screening of lipids
Early work focused on selecting appropriate lipid components (lipids and surfactants) with affinity for NAC to ensure active capture and long-term physical integrity. In miscibility and experimental lipid screening, 1-2 mg of active to solid lipids were added to determine the maximum NAC solubility in 1 g of GMS, stearic acid, palmitic acid, and cholesterol. For 15, 30, 60, and 72 h, the mixtures were agitated at 5–10 °C above each lipid's melting point. Solubilisation was visually assessed by translucent, uniform, crystal-free solutions. The mixes were stored at room temperature in the dark after cooling for future analysis [13, 14].
The quality target product profile (QTPP) and critical quality characteristics (CQAs)
QTPP refers to a medication's predicted qualities, which are needed to determine its safety and efficacy to find CQAs. Scientific and regulatory standards were followed to establish the QTPP. QTPP regulate product and process development and create CQAs. During synthesis, nanomaterials are related to in-process resources alike Critical Material Attributes (CMAs) and process variables alike key process parameters [15]. In polymeric nanoparticle development, measurement, lipid, surfactant, drug, processing, equipment, man, and facility affect CQAs like particle size, entrapment efficiency, drug release, zeta potential, and polydispersity index. It shows how these aspects work together to improve drug delivery system quality.
Response surface technique optimization
The study was optimised with Design Expert 13 (State-Ease, Minneapolis). Three separate factors—lipid (mg) (A), surfactant (mg) (B), homogenisation speed (rpm) (C), and their effects on reported responses such Particle Size (PS), Entrapment Efficiency (EE), and Polydispersity Index (PDI)—were considered. This model shows the three-component, three-level optimisation design. The model logged 12 runs and their responses. The best-performing composition was chosen for future research [16].
Formulation development of nanoparticles
This study created NAC-loaded nanoparticles from soya lecithin, glyceryl monostearate, polysorbate 80, and Tweens 40 and 80 via heat homogenisation. Formulation was enhanced via BBD. The modified formulation was evaluated using Zeta Potential (ZP), PS, % EE, Drug Loading (DL), Fourier Transform Infrared Spectroscopy (FTIR), Differential Scanning Calorimetry (DSC) and X-ray Diffraction (XRD) [17].
Preparation of SLN formulations of NAC by hot homogenization method
SLN formulations of NAC were prepared by hot homogenization considering the melting point above of selected lipids. The lipid phase, comprising soya lecithin and polysorbate-80, and NAC, was heated to 10 °C above the lipid melting point (around 37 °C). The molar ratio of lipid to surfactant ranged from 1:200 to 1:400 as per table 1, with the actual quantity of lipid varying from 0.25 to 3 mg and surfactant from 50 to 100 mg. After heating the lipid and aqueous phases separately to the same temperature, the lipid phase was added dropwise to the aqueous phase and stirred at 3000 RPM. Following 60 min of sonication, a stable SLN formulation was achieved. Table 1 outlines the range constraints. [18]. Table 1 shows BBD experimental design features and restrictions for the study.
Table 1: BBD experimental design elements and constraints of SLN
| Independent variables | Levels | Constraints | ||
| -1 | 0 | +1 | ||
| A: Quantity of lipid(mg) | 0.25 | 1.625 | 3 | In the range |
| B: Quantity of surfactant(mg) | 50 | 75 | 100 | In the range |
| C: Homogenization speed (RPM) | 1000 | 2000 | 3000 | In the range |
| Dependent variables | ||||
| R1: Entrapment efficiency (%) | Maximize | |||
| R2: PDI | In range | |||
| R3: Particle size (nm) | Minimize |
Preparation of NLC nanoparticle formulations of NAC by hot homogenization method
For NLC formulations, lipids, NAC, and lipophilic surfactants were heated in a water bath to 20 °C above the lipid melting point. The molar ratio of lipid to surfactant ranged from 1:150 to 1:200, aligning with the constraints in table 2. Lipid quantities were ranged from 0.5 to 6 mg, and surfactant quantities ranged from 50 to 100 mg. The lipid phase was gradually added to the aqueous surfactant solution while stirring at 1000 to 1035 RPM. After 60 min of sonication, a stable NLC dispersion was obtained. Table 2 shows BBD experimental design features and restrictions for the study [19].
Table 2: BBD experimental design elements and constraints of NLC
| Independent variables | Levels | Constraints | ||
| -1 | 0 | +1 | ||
| A: Quantity of lipid(mg) | 0.5 | 3.25 | 6 | In the range |
| B: Quantity of surfactant(mg) | 50 | 75 | 100 | In the range |
| C: Homogenization speed (bar) | 1000 | 1017.5 | 1035 | In the range |
| Dependent variables | ||||
| R1: Entrapment efficiency (%) | Maximize | |||
| R2: PDI | In range | |||
| R3: Particle size (nm) | Minimize |
Preparation of NDC nanoparticle formulations of NAC by hot homogenization method
NDC nanoparticles were prepared by heating a mixture of lipids (Soya lecithin, Polysorbate-40), NAC, and lipophilic surfactants to 20 °C above the lipid melting point. The molar ratio of lipid to surfactant was between 1:175 and 1:250, as defined in table 3. Lipid quantities were varied from 0.5 to 6 mg and surfactant quantities from 50 to 100 mg. The lipid phase was added to the heated aqueous phase with continuous stirring at 1000 to 1500 RPM. Following 60 min of sonication, a stable NDC formulation was achieved [20]. Table 3 shows BBD experimental design features and restrictions for the study.
Table 3: BBD experimental design elements and constraints of NDC
| Independent variables | Levels | Constraints | ||
| -1 | 0 | +1 | ||
| A: Quantity of lipid(mg) | 0.5 | 3.25 | 6 | In the range |
| B: Quantity of surfactant(mg) | 50 | 75 | 100 | In the range |
| C: Homogenization speed (RPM) | 1000 | 1250 | 1500 | In the range |
| Dependent variables | ||||
| R1: Entrapment efficiency (%) | Maximize | |||
| R2: PDI | In range | |||
| R3: Particle size (nm) | Minimize |
Preparation of PLHP formulations of NAC by hot homogenization method
PLHP formulations were prepared by heating lipids (Soya lecithin, Polysorbate-60), NAC, and lipophilic surfactants in a water bath at 40 °C above the lipid melting point. The molar ratio of lipid to surfactant ranged from 1:125 to 1:175, according to table 4 constraints. Lipid quantities were set between 0.5 and 6 mg, while surfactant quantities ranged from 50 to 100 mg. The lipid phase was added dropwise to the aqueous phase, stirred at 1000 to 1550 RPM, and then sonicated for 60 min to obtain a stable dispersion. Table 4 shows BBD experimental design features and restrictions for the study [21].
Table 4: BBD experimental design elements and constraints of PLHP
| Independent variables | Levels | Constraints | ||
| -1 | 0 | +1 | ||
| A: Quantity of lipid(mg) | 0.5 | 3.25 | 6 | In the range |
| B: Quantity of surfactant(mg) | 50 | 75 | 100 | In the range |
| C: Homogenization speed (RPM) | 1000 | 1275 | 1550 | In the range |
| Dependent variables | ||||
| R1: Entrapment efficiency (%) | Maximize | |||
| R2: PDI | In range | |||
| R3: Particle size (nm) | Minimize |
Characterization of drug loaded SLN
The SLN samples were examined for drug EE, PDI, PS, and ZP. The methods employed in this work include DSC, XRD, SEM, in vitro drug release investigations, and analysis of release kinetics [22-28].
% EE
Ultracentrifugation of the developed NAC SLNs were performed with a sigma 3-1KL IVD, Germany at 25,000 rpm for 30 min. UV spectrophotometric analysis of supernatant reports the free drug content the succeeding equation were used to determine the % EE.
% EE = (Amt of drug in SLNPs (mg)×100)/(Amt of drug added (mg))
PS and ZP
The Zeta sizer Nano-1000HS from Malvern Instrument Ltd., UK, was used to quantify the zeta potential by using differential light scattering (DLS) method. Milli-Q solution was used to disperse nanomaterials specimen. At 25 °C (90,50mv). Each measurement was made three times.
SEM studies
In order to take pictures of the SLNs, they were then dipped in gold to lessen the heat produced by the high-power magnification. The scanning electron microscope used was an FEI Quanta2 hundred MK2 from the Netherlands to examine the morphological characteristics.
FTIR
Compatibility testing of the pure drug and optimized formulation was carried out by FT-IR spectrophotometer (Perkin Elmer Spectrum One, Waltham, Massachusetts, USA) from a range of 4000 to 400 cm-1.
DSC study
Differential scanning calorimetry (DSC Q10 V9.0 Build 275) was used to analyze the degree of compatibility of excipients and drug with the medication. A heating rate of 0 to 1000 °C at 15 °C per min in a hermetically sealed cabin was used to construct the thermographs.
XRD study
Crystalline nature of the sample can be analyzed using X-ray Diffractometer (Bruker, Germany). Cu Ka radiation with a wavelength of 1.5406 with a voltage of 40 kV and a current of 40 mA (angle range of 3–40 across 2 with a count time of 0.3 seconds and a step angle of 0.02) were the specifications used for improved NAC-SLNP formulation.
Hepatoprotective activity
Free radicals are reactive, unstable compounds with unpaired electrons. As oxidants or reductants, they transport electrons in biological processes. Hydroxyl, superoxide, singlet oxygen, hydrogen peroxide, nitric oxide, hypochlorite, and peroxynitrite destroy Deoxyribonucleic acid, proteins, carbohydrates, and lipids, disturbing cellular homeostasis. These radicals come from natural physiological functions or exposure to X-rays, ozone, cigarette smoke, pollution, and toxins. Deficits in enzymatic and non-enzymatic antioxidant systems can increase radical production [29]. In this NAC-SLN investigation, subjects were separated into 9 groups, each containing 6 animals. Male Swiss albino mice weighing 30 to 35 g were acquired and housed in polypropylene cages in a temperature-controlled room for a week before the experiment began in order to acclimate them to laboratory settings. Standard pellet meal and unlimited access to water were given to the mice. Nalanda College of Pharmacy's Institutional Animal Ethics Committee (IAEC) approved the study, which was carried out in accordance with CPCSEA criteria (CPCSEA Registration No. 318/Re/s/2001/CPCSEA, IAEC Approval No. NCOP/IAEC/00075).
In Group I, olive oil was administered twice weekly at 1 ml/kg Body Weight (BW) for two weeks, followed by 1.5 ml/kg BW for two weeks. Group II received CCl4 (combined with olive oil) at 1 ml/kg BW twice weekly for two weeks, followed by 1.5 ml/kg BW for two weeks thereafter to induce intoxication. Groups III, IV, and V consumed NAC-SLN at low (1.75 mg/kg BW), medium (2.5 mg/kg BW), and high (3.25 mg/kg BW) doses with CCl4. Groups VI, VII, and VIII received NAC without SLN at equivalent doses. Group IX received Silymarin (25 mg/kg BW daily, 0.7% w/v carboxy methyl cellulose in H2O) for four weeks. After treatment, animals were slaughtered and serum samples were taken for examination.
Histopathological examination
Haematoxylin and eosin staining was performed on liver tissue samples fixed in 10% formalin and processed into 5µm thick paraffin slices. Pathological tissue alterations were examined under a microscope [30]. Quantitative histological examination is essential for assessing tissue damage and therapy efficacy. ImageJ® was used to quantify pathological alterations in liver sections from animals treated with NAC, NAC-SLN, and CCl4.
Image analysis using imagej®
Liver section images were imported into ImageJ® software and converted to greyscale to simplify thresholding and segmentation. Calibration was performed using a reference scale bar to enable the software to convert pixels to micrometres accurately. Thresholding was then applied to distinguish diseased alterations from normal tissue, with the threshold adjusted as needed to appropriately measure tissue damage. Segmentation methods were used to isolate Regions of Interest (ROIs) representing necrosis, fibrosis, and inflammation. Depending on tissue complexity, ROI selection was performed manually or through automated processes. Quantification of ROIs was conducted using ImageJ®, measuring the impacted area as a percentage of the total tissue area in each image.
Data collection involved analyzing multiple images from each treatment group to ensure statistical significance. Liver damage in the NAC, NAC-SLN, and CCl₄ therapy groups was compared, with group differences assessed using statistical tests such as ANOVA. Comparative analysis evaluated the ability of NAC and NAC-SLN to mitigate CCl₄-induced liver damage, specifically comparing the percentage of damaged tissue in the NAC and NAC-SLN groups to the CCl₄-only group. The analysis aimed to determine whether NAC-SLN offered greater protection or treatment efficacy than NAC alone.
Visual illustration of the data included bar charts or box plots to compare liver damage across treatment groups, incorporating error bars to indicate variability. Quantitative data were correlated with qualitative histological observations, with detailed descriptions of pathological features such as necrosis and inflammation provided for each therapy group. This method allowed for reliable quantification of liver tissue damage and assessment of treatment efficacy, facilitating accurate comparisons of liver health outcomes across the different treatment methods.
Statistics
Each result was presented as mean±SD. To compare individuals, LSD and one-way Analysis of Variance (ANOVA) were used. To find significant group differences in GraphPad Prism 8.0, the T-test and one-way ANOVA were performed. Asterisks (*) designate statistical differences between the control group (Group I) and the CCl4 injection group (Group II) when p<0.05 [31].
RESULTS AND DISCUSSION
Drug is soluble inH2O, alcohol, hot isopropyl alcohol, methyl and ethyl acetate, but not chloroform or ether. Improved wettability of NAC particles in aqueous solutions, which may indicate spontaneous solubilization, is a crucial factor in enhancing the bioavailability and therapeutic efficacy of the drug. Wettability refers to the ability of a liquid to maintain contact with a solid surface, influenced by interfacial tensions and the surface energy of the particles. Enhanced wettability reduces the contact angle between the aqueous solution and the NAC particle surface, promoting better interaction and faster dissolution of the drug [13].
Spontaneous solubilization, as suggested by improved wettability, implies that the energy barrier for dissolution is significantly reduced. This can result from surface modifications of the particles or the incorporation of hydrophilic excipients or surfactants such as polysorbate 80. These agents decrease interfacial tension, facilitating the dispersion of hydrophobic or poorly water-soluble drugs like NAC in aqueous environments [14]. The screening of lipids and surfactants showed that GMS and polysorbate were better compatible with drug: I NAC.
NAC-loaded SLN, NLC, NDC, and PLHP were prepared in 12 each according to the BBD investigational model of Design Expert software. They were evaluated using EE, PDI, and PS, and the outcomes are listed below (table 5 to 8).
Table 5: Experimental lattice and acquired outcomes from randomized runs in BBD of NAC-SLN
| Formulation | Amount of lipid (mg) | Amount of surfactant (mg) | Homogenization speed (RPM) | EE (%) | PDI | PS (nm) |
| 1 | 3 | 75 | 1000 | 71.24±1.23 | 0.189±0.22 | 96.23±1.98 |
| 2 | 0.25 | 75 | 3000 | 63.59±1.89 | 0.215±0.85 | 100.36±1.05 |
| 3 | 3 | 50 | 2000 | 82.35±1.42 | 0.182±0.46 | 99.23±1.21 |
| 4 | 0.25 | 50 | 2000 | 75.25±1.63 | 0.213±0.62 | 125.12±1.8 |
| 5 | 1.625 | 75 | 2000 | 73.18±1.50 | 0.156±0.50 | 149.56±1.75 |
| 6 | 1.625 | 75 | 2000 | 78.95±2.01 | 0.221±0.01 | 132.16±1.89 |
| 7 | 1.625 | 50 | 3000 | 68.93±0.99 | 0.232±0.13 | 98.69±1.67 |
| 8 | 1.625 | 75 | 2000 | 62.56±1.25 | 0.163±0.24 | 135.40±1.93 |
| 9 | 3 | 75 | 3000 | 80.69±1.32 | 0.157±0.21 | 120±1.78 |
| 10 | 0.25 | 75 | 1000 | 86.32±1.24 | 0.189±0.24 | 159.10±1.36 |
| 11 | 1.625 | 50 | 1000 | 84.36±1.24 | 0.201±0.28 | 149±1.85 |
| 12 | 1.625 | 100 | 3000 | 80.21±1.86 | 0.212±0.82 | 96.23±1.98 |
Data are expressed as mean±SD (n=3)
Statistical analysis and optimization of NAC-SLN, NLC, NDC, PLHP by BBD
This work optimised NAC-loaded four nanoparticles by minimising PS and maximising % EE with a 12-run BBD. The investigation preferred autonomous variables such lipids (A), surfactant (B), and homogenisation speed (C). R1: EE (%), R2: PDI, and R3:PS (nm) were dependent variables. Regression analysis determined how independent factors affected dependent variables. All four nanoparticle kinds have regression analysis summaries in data tables. The EE, PDI, and PS models were applicable because of three preliminary study factors: lipid (A), surfactant (B), and homogenisation speed (C). ANOVA results for EE (R1), PDI (R2), and PS (R3) were shown in data tables for four nanoparticle kinds. Fig. s below show 2-D and 3-D response surface graphs for EE, PDI, and PS. Independent coefficients are A, B, C, and interactive coefficients are AB, BC, AC in polynomial equations, which explain how all variables affect each other (table 9 to 12).
Table 6: Experimental lattice and acquired outcomes from randomized runs in BBD of NAC-NLC
| Formulation | Amount of lipid (mg) | Amount of surfactant (mg) | Homogenization speed (RPM) | EE (%) | PDI | PS (nm) |
| 1 | 3.25 | 75 | 1017.5 | 62.32± 1.31 | 0.246±0.32 | 85.02±1.38 |
| 2 | 0.5 | 75 | 1000 | 50.32±1.75 | 0.185±0.71 | 91.01±1.25 |
| 3 | 6 | 50 | 1017.5 | 53.86±1.58 | 0.237±0.55 | 88.10±1.67 |
| 4 | 6 | 75 | 1017.5 | 58.58±1.36 | 0.152±0.24 | 73.21±1.28 |
| 5 | 3.25 | 50 | 1035 | 62.31±1.83 | 0.298±0.75 | 102.27±1.50 |
| 6 | 6 | 75 | 1035 | 58.36±1.38 | 0.234±0.42 | 118.32±1.32 |
| 7 | 6 | 100 | 1017.5 | 60.25±1.23 | 0.231±0.22 | 123.28±2.01 |
| 8 | 3.25 | 100 | 1035 | 59.63±1.25 | 0.189±0.21 | 182.26±1.20 |
| 9 | 3.25 | 50 | 1000 | 63.39±1.20 | 0.176±0.18 | 99.22±1.22 |
| 10 | 6 | 100 | 1017.5 | 65.93±1.18 | 0.168±0.22 | 56.11±1.12 |
| 11 | 0.5 | 100 | 1000 | 72.34±1.21 | 0.154±0.28 | 164.21±1.21 |
| 12 | 3.25 | 75 | 1000 | 68.42±1.19 | 0.128±0.17 | 78.14±2.01 |
Data are expressed as mean±SD (n=3)
Table 7: Experimental lattice and acquired outcomes from randomized runs in BBD of NAC-NDC
| Formulation | Amount of lipid (mg) | Amount of surfactant (mg) | Homogenization speed (RPM) | EE (%) | PDI | PS (nm) |
| 1 | 0.5 | 75 | 1500 | 58.50±1.33 | 0.181±0.95 | 93.21±1.91 |
| 2 | 3.25 | 75 | 1250 | 49.37±1.93 | 0.168±0.52 | 86.22±1.92 |
| 3 | 3.25 | 50 | 1500 | 63.21±1.85 | 0.162±0.73 | 90.35±1.85 |
| 4 | 0.5 | 75 | 1000 | 60.17±1.48 | 0.154±0.50 | 58.27±1.48 |
| 5 | 6 | 75 | 1500 | 57.45±5.39 | 0.247±0.23 | 63.21±0.89 |
| 6 | 6 | 50 | 1000 | 67.12±1.87 | 0.263±0.20 | 115.98±1.02 |
| 7 | 3.25 | 75 | 1250 | 69.34±1.25 | 0.169±0.47 | 201.42±1.25 |
| 8 | 6 | 75 | 1250 | 70.22±1.34 | 0.203±0.35 | 128.02±1.38 |
| 9 | 3.25 | 100 | 1500 | 71.11±1.52 | 0.154±0.55 | 130.11±1.55 |
| 10 | 0.5 | 50 | 1250 | 63.95±1.31 | 0.247±0.35 | 163.32±1.82 |
| 11 | 6 | 50 | 1250 | 71.24±1.28 | 0.168±0.29 | 116.59±1.30 |
| 12 | 0.5 | 100 | 1250 | 66.9±1.30 | 0.174±0.30 | 98.20±1.68 |
Data are expressed as mean±SD (n=3)
Table 8: Experimental lattice and acquired outcomes from randomized runs in BBD of NAC-PLHP
| Formulation | Amount of lipid (mg) | Amount of surfactant (mg) | Homogenization speed (RPM) | EE (%) | PDI | PS (nm) |
| 1 | 6 | 75 | 1000 | 61.21±1.12 | 0.212±0.32 | 101.75±1.30 |
| 2 | 3.25 | 50 | 1000 | 53.69±1.15 | 0.182±0.15 | 86.21±1.27 |
| 3 | 6 | 50 | 1275 | 50.31±1.32 | 0.127±0.12 | 131.72±1.32 |
| 4 | 6 | 75 | 1550 | 59.44±1.38 | 0.275±0.28 | 201.21±1.38 |
| 5 | 3.25 | 75 | 1275 | 63.34±1.12 | 0.185±0.12 | 87.96±1.86 |
| 6 | 3.25 | 100 | 1000 | 60.50±1.20 | 0.124±0.18 | 135.23±2.02 |
| 7 | 0.5 | 50 | 1275 | 64.36±1.27 | 0.179±0.25 | 140.29±1.27 |
| 8 | 3.25 | 50 | 1550 | 72.35±1.34 | 0.165±0.35 | 138.12±1.35 |
| 9 | 0.5 | 75 | 1550 | 68.93±2.05 | 0.172±0.04 | 125.23±2.05 |
| 10 | 6 | 100 | 1275 | 67.36±1.52 | 0.146±0.55 | 119.02±1.52 |
| 11 | 3.25 | 100 | 1550 | 65.93±1.48 | 0.164±0.42 | 98.82±1.50 |
| 12 | 0.5 | 100 | 1275 | 67.35±1.56 | 0.154±0.52 | 86.95±1.55 |
Data are expressed as mean±SD (n=3)
Table 9: ANOVA study of the BBD designed NAC-SLN
| Response | Model | R2 | Adjusted R2 | Predicted R2 | Adeq R2 | F Value | P Value |
| EE | 2F1 | 0.8662 | 07659 | 05958 | 11.6556 | 8.63 | 0.0038 |
| PDI | 2F1 | 0.7360 | 05380 | 0.5097 | 6.6200 | 3.72 | 0.0455 |
| PS | 2F1 | 0.9658 | 0.9402 | 0.8915 | 18.8645 | 37.67 | 0.0001 |
Table 10: ANOVA study of the BBD designed NAC-NLC
| Response | Model | R2 | Adjusted R2 | Predicted R2 | Adeq R2 | F Value | P Value |
| EE | Quadratic | 0.9216 | 0.7806 | 0.5765 | 9.1366 | 6.53 | 0.0262 |
| PDI | Linear | 0.61606 | 0.5044 | 0.7960 | 7.1119 | 5.75 | 0.0194 |
| PS | Quadratic | 0.9312 | 0.8072 | 0.6224 | 9.1922 | 7.51 | 0.0186 |
Table 11: ANOVA study of the BBD designed NAC-NDC
| Response | Model | R2 | Adjusted R2 | Predicted R2 | Adeq R2 | F Value | P Value |
| EE | Linear | 0.4969 | 0.3590 | 0.3037 | 5.6259 | 3.61 | 0.0491 |
| PDI | 2F1 | 0.7647 | 0.5882 | 0.3175 | 9.1769 | 4.33 | 0.0304 |
| PS | Linear | 0.5152 | 0.3830 | 0.1926 | 5.9167 | 3.90 | 0.0404 |
Table 12: ANOVA study of the BBD designed NAC-PLHP
| Response | Model | R2 | Adjusted R2 | Predicted R2 | Adeq R2 | F Value | P Value |
| EE | Linear | 0.5739 | 0.4572 | 0.2600 | 8.8530 | 4.94 | 0.0207 |
| PDI | Quadratic | 0.8961 | 0.5357 | 0.5327 | 12.3233 | 4.79 | 0.0426 |
| PS | Quadratic | 0.9028 | 0.7428 | 0.7428 | 7.3626 | 5.16 | 0.0427 |
Fitting the formulation results into polynomial model equations showed that the independent variables (PS, PDI, and EE) interact with observed responses. The tabular data shows that the independent variables have increased multiple correlations, adjusted, predicted, sum of squares, and significant statistical terms at the given probability level. All replies show a satisfactory agreement between anticipated and adjusted R2 values (difference<2). A precision ratio larger than 4 is appropriate for this investigation since it evaluates signal-to-noise ratio and aids design space navigation. The polynomial equations were validated using ANOVA was found to be statistically significant (p<0.05). With 2D and 3D-surface response plots, numerical and graphical optimisation findings help explore the interactive impacts of critical product parameters (CPP) on critical quality attributes. This surface approach plot allows simultaneous testing of two CPPs by maintaining others at a constant level at every response. Stabilising one parameter at each point allows perturbation and interaction plots to measure and match two parameters. Equations quantify A, B, and C's effects on responses. The magnitude of the coefficient displays how the variable affects the response, showing all coefficient values for each response. The statistical study supports the equation (F>P<0.05). Coefficients with positive signs and values indicate that the independent variable has an effect on the response.
: “+” is synergistic and “-” is antagonistic.3D graphs of independent variable effects on answers.
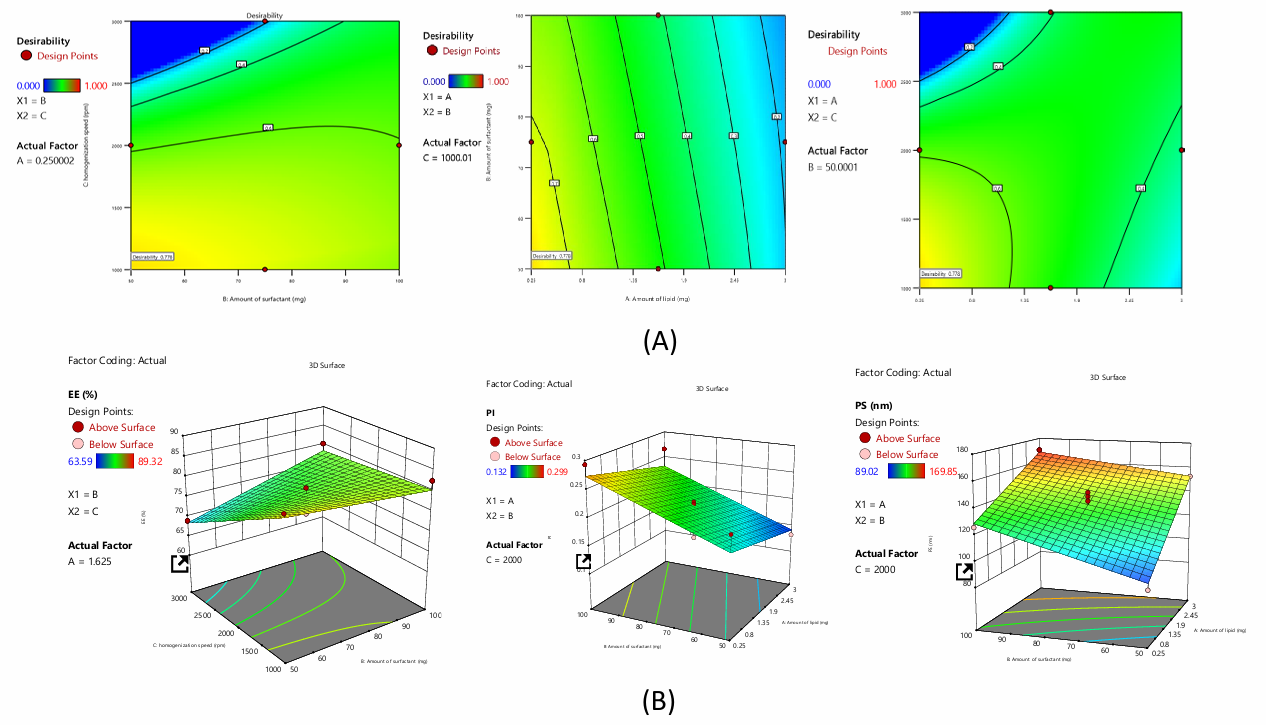
Fig. 1: A) Desirability and B) 3D plots of NAC-SLN using BBD
The polynomial equations for NAC-SLN
The equation above quantifies the effects of A, B, and C on responses. The magnitude of the coefficient displays how the variable affects the response, showing all coefficient values for each response.
Impact on EE
The investigation produced the polynomial expression, EE= 77.63+0.15A+1.64B-4.23C-3.01AB+8.79AC+BC. The given equation shows that independent coefficients A, B and interaction coefficients AB, BC synergise. Others like C, AB reduce formulation EE.
Impact on PDI
The investigation produced the polynomial expression, PDI=+0.20-0.207A+0.0451B+0.0054C. The given equation shows that independent coefficients A, B, C have synergistic effects and interactive coefficients AB, BC, AC have antagonistic effects on formulation PDI.
Effects on PS
The investigation produced the polynomial expression, PS=+135.90+24.55A+12.53B-9.56C-4.77AB+7.69AC+9.35BC. The given equation shows that independent coefficients A, B and interactive coefficients AC, BC synergise. Others like C, AB are hostile to formulation PS.
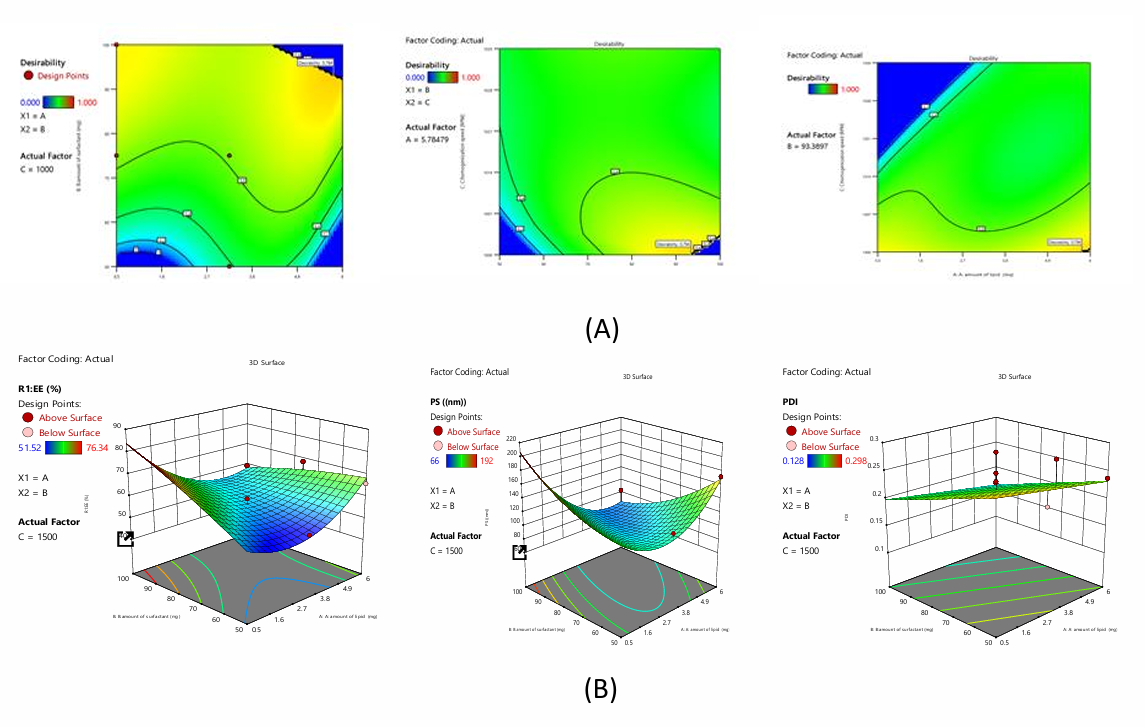
Fig. 2: A) Desirability and B) 3D plots of NAC-NLC using BBD
The polynomial equations for NAC-NLC
The equation above quantifies A, B, and C on responses. The magnitude of the coefficient displays how the variable affects the response, showing all coefficient values for each response.
Impact on EE
The investigation produced the polynomial expression, EE=+56.58-2.89A+4.75B+4.18C-9.8AB-12.14AC+2.0BC+10.9A2-1.3B2+9.54C2. The equation shows that independent coefficients A, B, C and interaction coefficients AB, BC, AC exhibit synergistic formulation EE.
Impact on PDI
The investigation produced the polynomial expression, PDI=+0.215-0.016A-0.033B+0.047C. According to the equation, independent coefficients B and C have synergistic and antagonistic effects on formulation PDI.
Impact on PS
The investigation produced the polynomial expression, PS=+91.19-21.15A-2.41B+37.53C-39.67AC+22.75BC+41.46A2+15.03B2+24.75C2. The given equation shows that independent coefficients B, C, and interactive coefficient BC synergise. Others like A, BC interfere with formulation PS.
The polynomial equations for NAC-NDC
The equation above quantifies A, B, and C on responses. The magnitude of the coefficient displays how the variable affects the response, showing all coefficient values for each response.
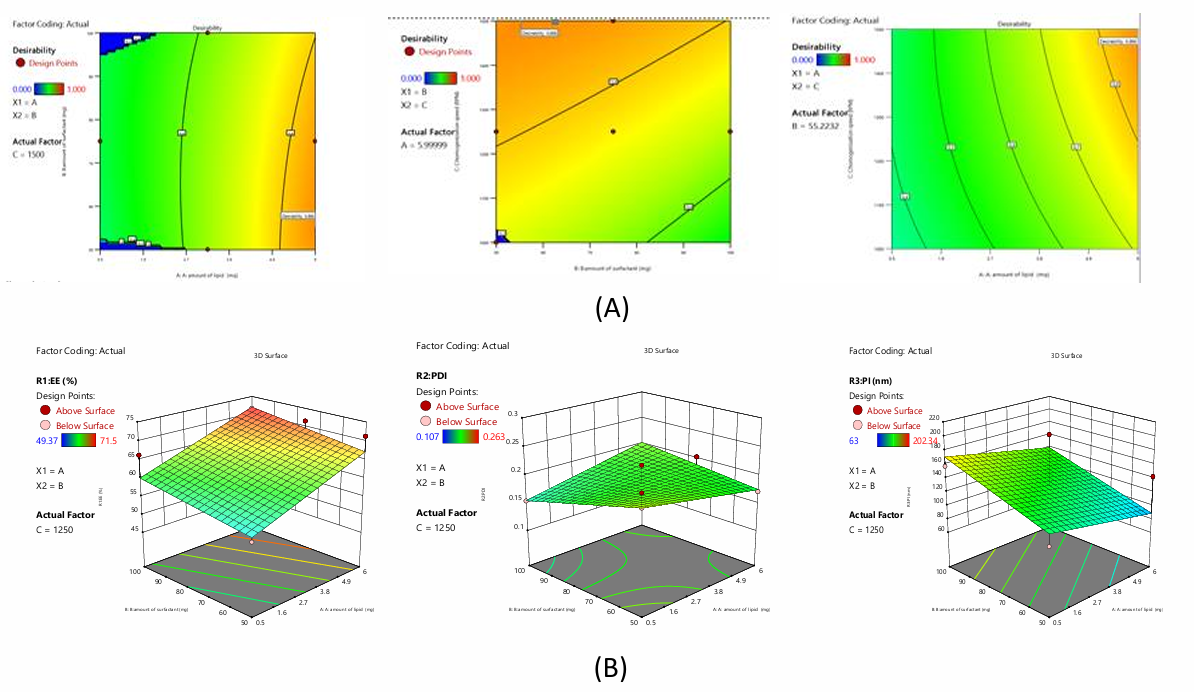
Fig. 3: A) Desirability and B) 3D plots of NAC-NDC using BBD
Impact on EE
The investigation produced the polynomial expression, EE=63.64+5.89A+2.36B-1.70C. The following equation shows that independent coefficients A, B have synergistic effects and C has antagonistic effects on formulation EE.
Impact on PDI
The investigation produced the polynomial expression, PDI=+0.186+0.002A-0.0078B+0.0057C+0.021AB+0.01AC-0.061BC. The following equation shows that independent and interacting coefficients like A, C, AB, AC have synergistic effects on formulation PDI, while B, BC have antagonistic effects.
Impact on PS
The investigation produced the polynomial expression, PS=+129.81-15.88A+25.19B-31.01C. The equation shows that independent coefficients B synergise others like A, C antagonistically affect formulation PS.
The polynomial equation for NAC-PLHP
The equation above quantifies A, B, and C on responses. The magnitude of the coefficient displays how the variable affects the response, showing all coefficient values for each response.
Impact on EE
Investigation yielded the polynomial expression: EE=+8.07-0.32A+0.18B+0.27C. According to the equation, independent coefficients B and C have a synergistic influence on formulation entrapment efficiency, while A has an antagonistic effect.
Impact on PDI
The polynomial expression for the investigation is: PDI=+0.43+0.016A+0.0007B+0.001C+0.0480AB+0.031AC+0.02BC+0.032A2-0.04B2+0.009C2. The preceding equation shows that all independent and interaction coefficients synergistically affect formulation PDI.
Impact on PS
The polynomial expression from the inquiry is: PS=+11.05+0.42A+0.39B+0.20C-0.52AB+2.07AC-0.62BC+1.86A2+0.33B2-0.63C2. The given equation shows that independent coefficients A, B, C and interacting coefficient AC synergise. Others like AB, BC harm formulation PS.
Desirability and BBD overlay plots of NAC-Nanoparticles. Experimental trials were conducted on all 12 BBD formulations. All replies' independent factors were optimised using desirability. Overlay plots depict two regions Yellow means optimised formulation conditions are possible, whereas grey means not possible.
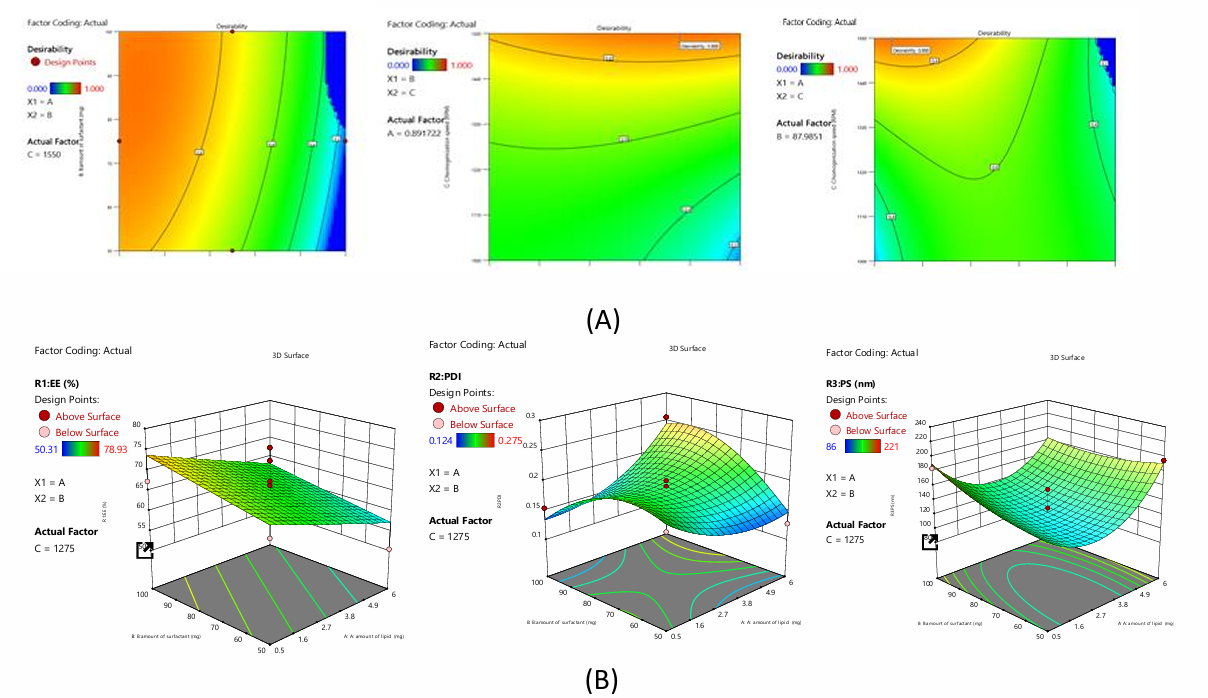
Fig. 4: A) Desirability and B) 3D plots of NAC-PLHP using BBD
Table 13: Characterization of optimized formulation of different SLN
| Characterization | NAC-SLN | NAC-NLC | NAC-NDC | NAC-PHLP | ||||
| Predicted | Observed | Predicted | Observed | Predicted | Observed | Predicted | Observed | |
| EE (%) | 89.18 | 86.32 | 74.42 | 72.34 | 65.96 | 71.24 | 76.09 | 68.93 |
| PDI | 0.177 | 0.189 | 0.128 | 0.154 | 0.241 | 0.168 | 0.163 | 0.172 |
| PS(nm) | 120.63 | 159.10 | 105.96 | 164.21 | 62.99 | 116.59 | 100.97 | 125.23 |
Following the transformation of all three responses (R1: EE, R2: PDI, and R3: PS) into desirability scales based on the desirability value (0.778), the NAC-SLN10 preparation was selected as the best option for preparation, as can be shown in fig. 5A. The subsequent attractiveness criteria for the best formulation are displayed on the overlay plot, which includes the following: PS is 159.10 nm, PDI is 0.189, and EE is 86.32 percent. A homogenisation speed of 1000 rpm, 0.25 mg of lipid, and fifty mg of surfactant are all desirable parameters for independent variables.
Following the transformation of all three answers (R1: EE, R2: PDI, and R3: PS) into desirability scales based on the desirability value (0.778), the formulation NAC-NLC11 was chosen as the best option. This is demonstrated in fig. 5B. The subsequent attractiveness criteria for the best formulation are displayed on the overlay plot, which includes the following: In terms of percentage, EE is 72.34, PDI is 0.154, and PS is 164.21 nm. The desirable parameters for independent variables consist of 5.78 mg of fat, 93.38 mg of surfactant, and 1000 RPM homogenisation.
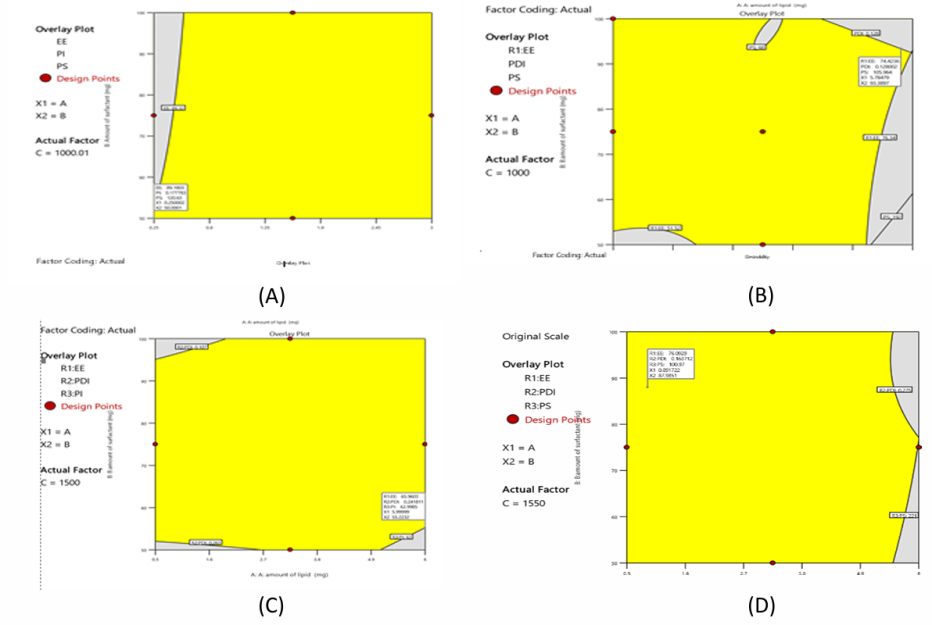
Fig. 5: Desirability and overlay plot of A) NAC-SLN B) NAC-NLCC) NAC-NDC D) NAC-PLHP using BBD
Following the transformation of all three answers (R1: EE, R2: PDI, and R3: PS) into desirability scales based on the desirability value (0.778), the formulation NAC-NDC 11 was chosen as the best option. This is demonstrated in fig. 5C. The subsequent attractiveness criteria for the best formulation are displayed on the overlay plot, which includes the following: PS is 116.59 nm, PDI is 0.168, and EE is 71.24 percent. A total of 5.99 mg of fat, 55.22 mg of surfactant, and 1499.9 RPM homogenisation are included in the collection of desirable criteria for independent components.
Following the transformation of all three answers (R1: EE, R2: PDI, and R3: PS) into desirability scales based on the desirability value (0.778), the formulation NAC-PLHP 9 was chosen as the best option. This is demonstrated in fig. 5D. The subsequent attractiveness criteria for the best formulation are displayed on the overlay plot, which includes the following: PS is 125.23 nm, PDI is 0.172, and EE is 68.93 percent. Homogenisation at 1550 revolutions per minute, 0.893 mg of lipid, and 87.9 mg of surfactant are all desirable characteristics for independent variables.
ZP
With a ZP ranging from-11.8 to-25.03 mV, the surface of the nanoparticles made of NAC-SLN possessed a charge that was moderately negative. This is because particles with a ZP that is either above+30 mV or below-30 mV are stable and do not combine. This is because of electrostatic repulsion. Because of the negative ZP in this range, nanoparticles are able to remain dispersed throughout the medium, which results in NAC-SLN being more stable and effective.
FTIR, DSC, XRD and SEM
A comparison of the FTIR spectra of pure drug, NAC-SLN, NAC-NLC, NAC-NDC, and NAC-PLHP is shown in fig. 6. Only the peaks that are indicative of the SLN were present in the FTIR spectra of the nanocomposite formulations. It can be deduced that the nanocomplex did not contain any non-encapsulated medication because it did not contain any typical drug peaks. During the DSC investigation, it was discovered that the crystallisation of pure medication occurred at temperatures ranging from 109 to 120 °C after heating. The large endothermic peak of the pure drug was smaller in the physical mixture, which indicates that it does not have any interaction with the lipid structure, either physically or chemically. Amorphousness is revealed by the XRD pattern of NAC, whereas semi-crystallineness is displayed by the pattern of GMS. If the amorphous medication is stored, surfactants might not be able to assist in the crystallisation of the drug because of its amorphous nature (fig. 7). Research using scanning electron microscopy (fig. 8) revealed that NAC-SLN are smooth, spherical, and have a mean particle size that is less than 200 nanometres. A study on the size of particles revealed that the diameter of NAC-SLNs was less than 248 nm. Because of this small and consistent particle size, drug delivery and absorption are dependent on it.
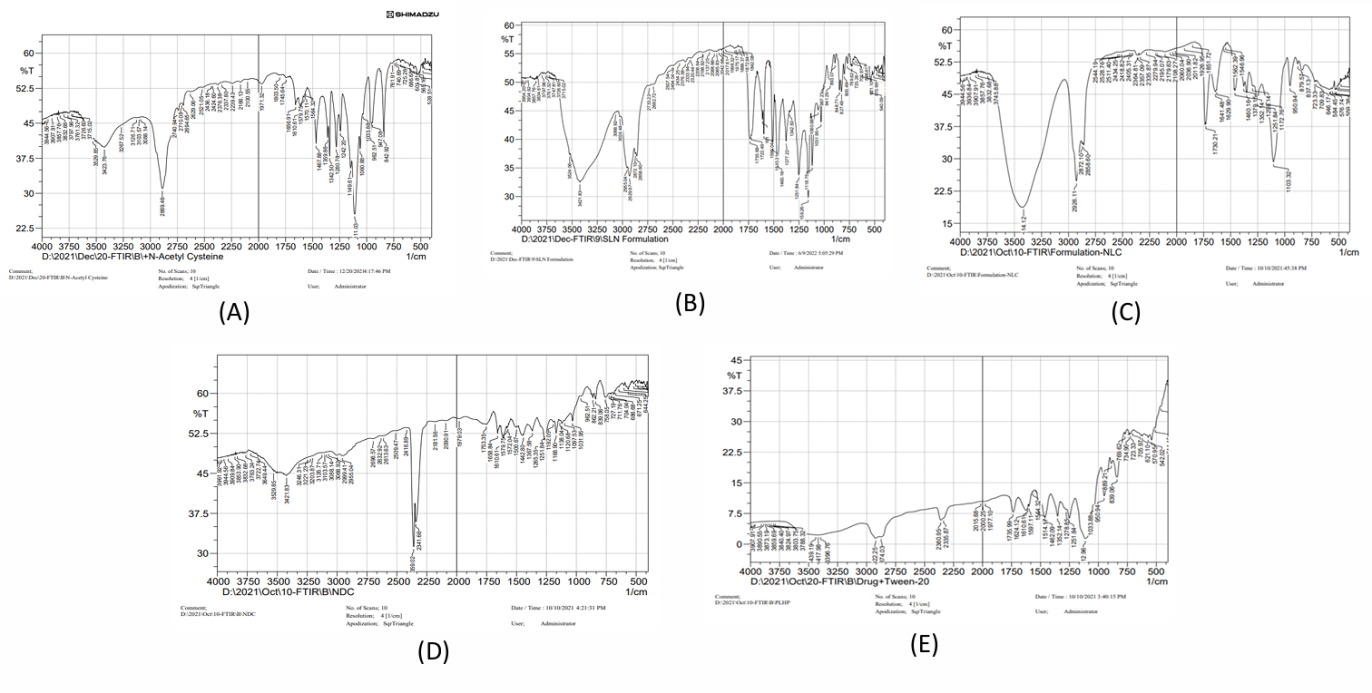
Fig. 6: FTIR spectra of A) Pure drug B) NAC-SLN C) NAC-NLC D) NAC-NDC E) NAC-PLHP
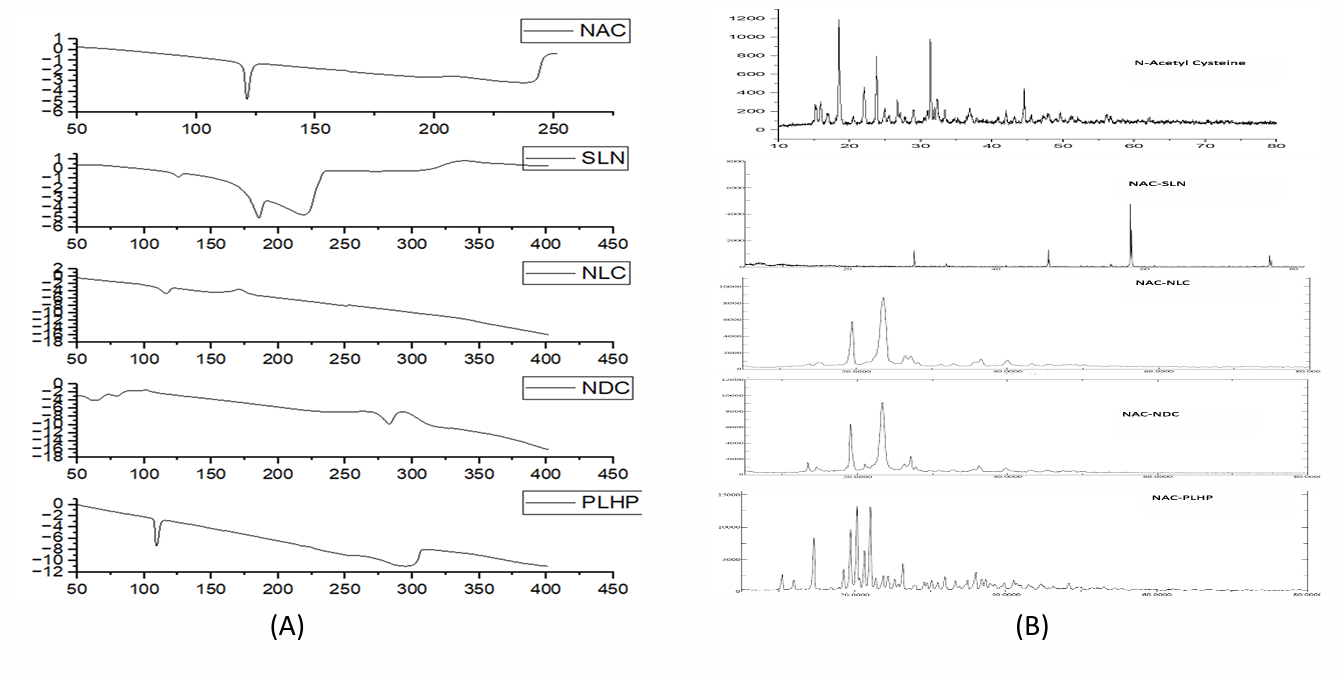
Fig. 7: DSC and XRD spectra of A) Pure drug B) NAC-SLN C) NAC-NLC D) NAC-NDC E) NAC-PLHP
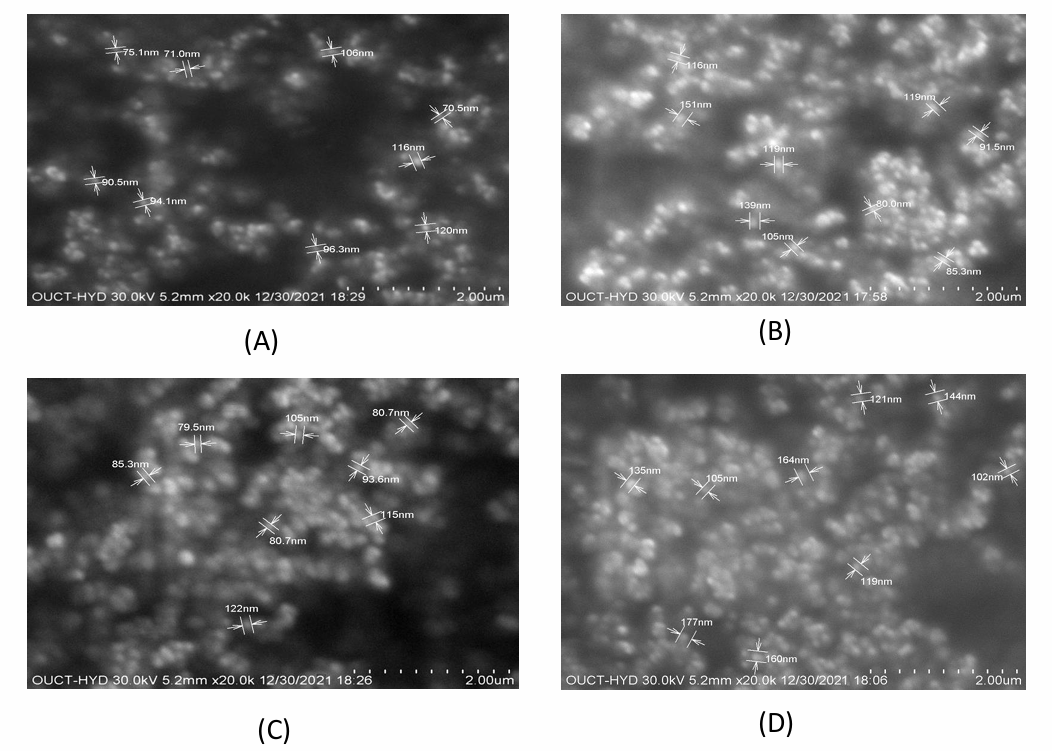
Fig. 8: SEM images of A) Pure drug B) NAC-SLN C) NAC-NLC D) NAC-NDC E) NAC-PLHP
In vitro drug release studies
The enhanced drug release observed with polysorbate 80 nanoparticles compared to Tween 40 and 80 nanoparticles is largely attributed to their smaller particle sizes, which play a critical role in drug delivery kinetics. Smaller nanoparticles provide a significantly larger surface area-to-volume ratio, facilitating faster drug desorption or dissolution at the nanoparticle surface. Additionally, smaller particle sizes reduce the diffusion distance for the drug to escape from the nanoparticle matrix, leading to quicker release [16].
Moreover, the physicochemical properties of the surfactants themselves could influence drug release. Polysorbate 80, known for its higher hydrophilicity due to its longer ethylene oxide chain, may form more stable and efficient micellar structures, aiding in sustained release. This structural stability could also prevent premature aggregation or precipitation of the nanoparticles, maintaining their integrity for prolonged drug release.
The choice of surfactant impacts not only the particle size but also the interfacial properties of the nanoparticles. Polysorbate 80 might better stabilize the drug within the nanoparticles or facilitate its interaction with the surrounding aqueous medium, further enhancing release kinetics. Additionally, the drug’s solubility and compatibility with the surfactant and nanoparticle matrix might synergistically affect the release profile.
Lastly, smaller nanoparticles like those with polysorbate 80 are more likely to evade rapid clearance by the mononuclear phagocyte system, leading to a longer systemic circulation time. This prolonged presence in the biological system allows for a more extended period of drug release, improving therapeutic efficacy. These combined factors underscore the advantages of using smaller-sized polysorbate 80 nanoparticles in drug delivery applications [17].
All of the NAC SLN formulations were subjected to drug release studies that lasted for a total of twelve hours and utilised dissolution apparatus. According to the findings, the NAC-SLN F10 exhibited a drug release rate of 92.30±0.46 in vitro. A total of 90.1±1.86 medicines were released by NAC-NLC F11 in vitro. A total of 85.72±1.64 medicines were released by NAC-NDC F11 in vitro. A total of 86.25±1.43 medicines were released by NAC-PLHP F9 in vitro.
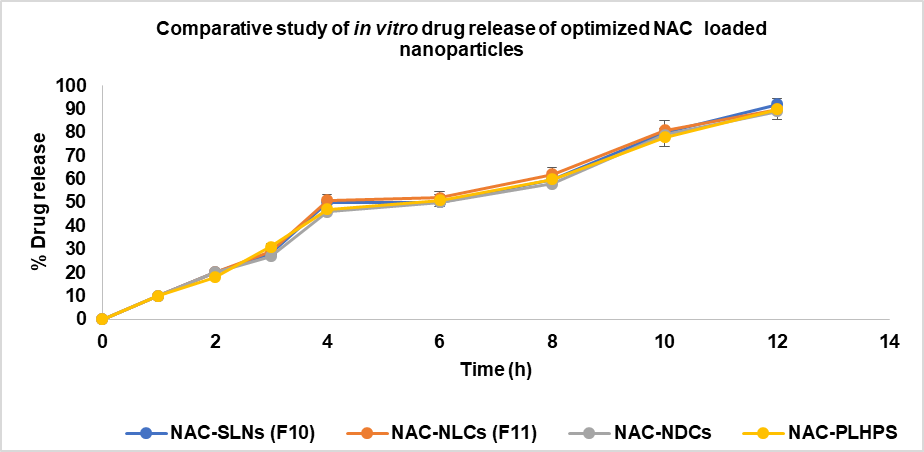
Fig. 9: comparative study of in vitro drug release of optimized NAC loaded nanoparticles, data are expressed as mean ±SD (n=3)
The percentage of drug release in all of the comparative formulations is shown in fig. 9, and the Optimised formulation for NAC SLN had a larger percentage of drug release than the other formulations. This indicates that the dissolving rate increased with the surface area of the formulation. SLN10 was 92.35±0.46% for a period of 12 h. The zero-order correlation coefficient for kinetics. A range of 96.23±9.98 to 159.10±15.36 nanometres was observed in the mean particle size of NAC-SLN nanoparticles. According to the order of the measurements, the PDI ranged from 0.156±0.50 to 0.232±0.13. A range of 62.56±1.25 to 86.32±1.24% is available for the formulation's EE. When compared to the other four varieties, SLN had the highest release percentage, which was 92.3±0.46. The Higuchi model of drug release was demonstrated by optimised NAC-SLN that had a chemical structure that was both intact and spherical (88.95% EE, 92.35% DR,-25.8 mV ZP, and less than 200 nm of PS).
Histopathology
Central veins, colourful cytoplasm, and conspicuous nuclei were all present in the liver cells of animals that were alive and healthy. CCl4-induced hepatic architecture was shown to be significantly altered through the presence of vacuolization, centrilobular hepatic necrosis, and fragmented central veins. Nevertheless, the therapy groups demonstrated a remarkable recovery in the structural integrity of the liver (fig. 10). Carbon tetrachloride (CCl4)-induced hepatic damage has been extensively studied for its relevance in mimicking human liver injuries, including fibrosis and necrosis. Histological studies confirm that CCl4 exposure leads to centrilobular necrosis, vacuolization, and significant disruption of liver architecture, as seen in fragmented central veins and inflammatory responses. Findings suggest that targeting metabolic dysregulation and inflammatory pathways is a robust strategy for reversing CCl4-induced liver damage [17].
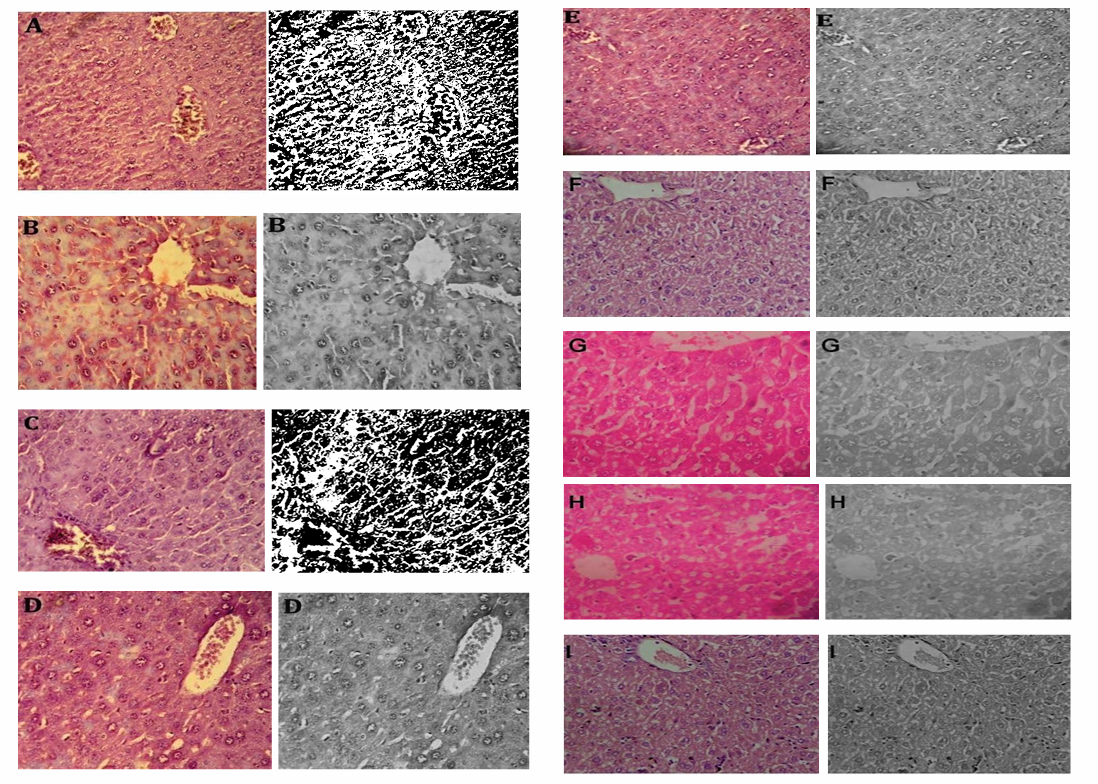
Fig. 10: In vivo hepatoprotective activity of the optimized formulation and their Image J ®software analysed images respectively, A: Negative control, B: Positive Control (CCl4 treated), C: CCl4+LD NAC-SLN, D: CCl4+MD NAC-SLN, E: CCl4+HD NAC-SLN, F: CCl4+LD NAC, G: CCl4+MD NAC, H: CCl4+HD NAC, I: CCl4+SILY
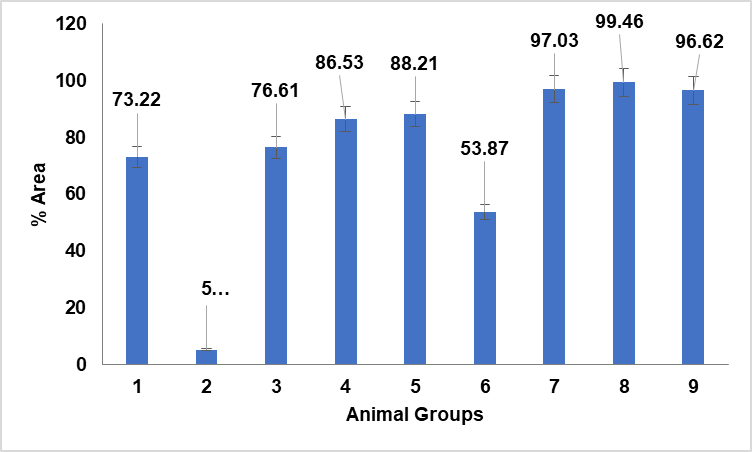
Fig. 11: Quantitative estimation of liver sections treated with NAC, NAC-SLN and CCl4 group of animals using Image J® software, data are expressed as mean±SD(n=3)
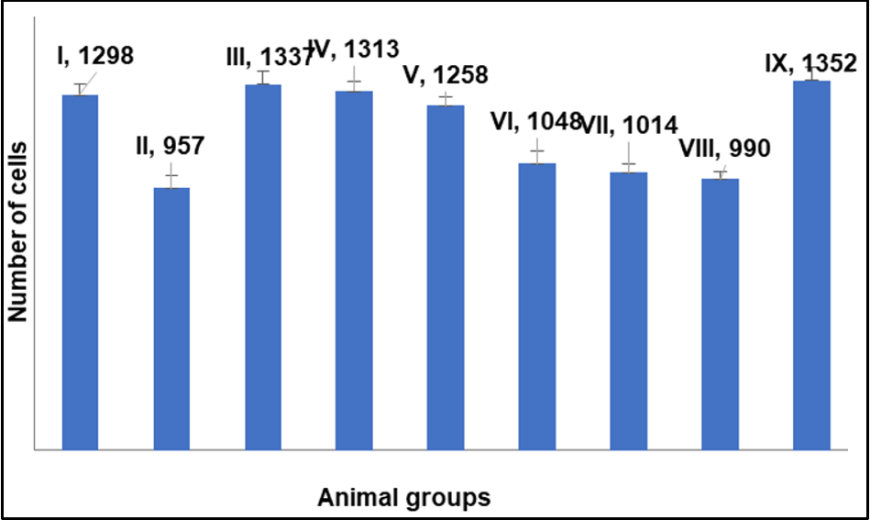
Fig. 12: Quantitative estimation of liver sections treated with NAC, NAC-SLN and silymarin treated group of animals using Image J® software, data are expressed as mean±SD (n=3)
Quantitative calculation of liver section area for NAC, NAC-SLNs, and CCl4-treated animal groups utilised in in vivo research. Fig. 11 illustrates the percentage of cell vasculature in comparison to the control group (Group I) and the CCl4-treated group (Group II). Elevated levels were seen in NAC-treated groups VII and VIII. Group IX, administered silymarin, was more prevalent. Approximately equivalent in NAC-SLN groups III, IV, and V. Vascular damage and excessive dosage accumulation may occur with moderate doses of NAC and nanocarriers (SLN). In a quantitative comparison of NAC-SLN to NAC and silymarin, low-dose NAC-SLN exhibited cell counts more closely aligned with the negative control group (fig. 12). NAC-SLN constitutes an efficacious low-dose treatment with effects comparable to those of the negative control group.
CONCLUSION
The 4 types of NAC-loaded nanoparticles tested showed no statistically significant changes among NLC and SLN, promising antioxidant drug carriers. But SLN surpassed other formulations in drug trapping and release. SLN designs outperformed other nanoparticles in vitro in physicochemical performance. The NAC assay methods are simple, sensitive, precise, and accurate, making them suited for routine bulk and pharmaceutical formulation examination. The study found that NAC-SLN therapy is more effective than NAC alone and comparable to silymarin, a hepatoprotective and antioxidant medication. NAC's antioxidant and hepatoprotective effects are enhanced by stable nanoparticle delivery methods. Research on NAC-SLN may lead to a promising hepatoprotective drug. This study demonstrates that SLNs may treat liver diseases using NAC.
ACKNOWLEDGEMENT
The authors would like to acknowledge the administration and faculty of the KL College of Pharmacy, Vaddeswaram, Guntur, Andhra Pradesh, India, and Department of Pharmacy, Brilliantgrammar school educational society’s group of institutions-integrated campus, Hyderabad, Telangana, India, for their assistance in facilitating the research. The students are also grateful for the support and encouragement they have received during their tenure at this institution.
ABBREVIATIONS
NAC-N-Acetylcysteine, SLN-Solid Lipid Nanoparticles, NLC-Nanostructured Lipid Carriers, NDC-Nano Drug Conjugate Carriers, PLHP-Polymer-Lipid Hybrid Nanoparticles, FTIR-Fourier Transform Infrared Spectroscopy, XRD-X-ray Diffraction, SEM-Scanning Electron Microscopy, DSC-Differential Scanning Calorimetry, BBD-Box–Behnken design, RPM-Revolutions Per Minute, w/v-Weight/volume, g/mole-Grams per mole, h/h-hour/hours, %-Percent, C-Degree Celcius, Nm-Nanometers, min/min-Minutes, g/mg-Gram/Milligram, µg-Microgram, w/w-weight/weight, ANOVA-Analysis of Variance, QbD-Quality by Design, PDI-Polydispersity Index, QTPP-Quality Target Product Profile, CQAs-Critical Quality Characteristics, SD-Standard Deviation, EE-Encapsulation efficiency, ZP-Zeta Potential, GMS-Glyceryl Mono Stearate, CMAs-Critical Material Attributes, PS-Particle Size
FUNDING
Nil
AUTHORS CONTRIBUTIONS
BM and KC contributed to the study design and collaborated with data collecting and analysis, while AA and NM, supported in paper writing, assuring a collaborative and balanced effort throughout the research process. All Authors reviewed and approved the final draft.
CONFLICT OF INTERESTS
All authors involved in this study have declared that they have no actual, prospective, or seeming conflicts of interest.
REFERENCES
Mokhtari V, Afsharian P, Shahhoseini M, Kalantar SM, Moini A. A review on various uses of n-acetyl cysteine. Cell J. 2017;19(1):11-7. doi: 10.22074/cellj.2016.4872, PMID 28367412.
Pardeike J, Hommoss A, Muller RH. Lipid nanoparticles (SLN, NLC) in cosmetic and pharmaceutical dermal products. Int J Pharm. 2009;366(1-2):170-84. doi: 10.1016/j.ijpharm.2008.10.003, PMID 18992314.
Priyanka P, Sri Rekha M, Seetha Devi A. Review on formulation and evaluation of solid lipid nanoparticles for vaginal application. Int J Pharm Pharm Sci. 2022;14(1):1-8.
kumar PJ, Shikha K, Tapash C. Lipid-polymer hybrid nanocarriers as a novel drug delivery platform. Int J Pharm Pharm Sci. 2022;14(4):1-12.
Shah NV, Seth AK, Balaraman R, Aundhia CJ, Maheshwari RA, Parmar GR. Nanostructured lipid carriers for oral bioavailability enhancement of raloxifene: design and in vivo study. J Adv Res. 2016;7(3):423-34. doi: 10.1016/j.jare.2016.03.002, PMID 27222747.
Sun TM, Davis ME. Nanodrug delivery systems: nanodrug conjugates. Wiley Interdiscip Rev Nanomed Nanobiotechnol. 2011;3(1):6-20.
Gomes MJ, Peixoto D, Teixeira MA. Polymer-lipid hybrid nanoparticles: a synergistic approach for oral bioavailability improvement of poorly soluble drugs. Coll Surf B Biointerfaces. 2017;159:169-77.
Salmanpour M, Yousefi G, Mohammadi Samani S, Abedanzadeh M, Tamaddon AM. Hydrolytic stabilization of irinotecan active metabolite (SN38) against physiologic pH through self-assembly of conjugated poly (2-oxazoline)-poly (l-amino acid) block copolymer: a-synthesis and physicochemical characterization. J Drug Deliv Sci Technol. 2020;60:101933. doi: 10.1016/j.jddst.2020.101933.
Salmanpour M, Saeed Vaghefi M, Abolmaali SS, Tamaddon AM. Sterically stabilized polyionic complex nanogels of chitosan lysate and PEG-b-Polyglutamic acid copolymer for the delivery of irinotecan active metabolite (SN-38). Curr Drug Deliv. 2021 Jun;18(6):741-52. doi: 10.2174/1567201817999201103195846, PMID 33155910.
Yu LX. Pharmaceutical quality by design: product and process development, understanding, and control. Pharm Res. 2008;25(4):781-91. doi: 10.1007/s11095-007-9511-1, PMID 18185986.
Ferreira SL, Bruns RE, Ferreira HS, Matos GD, David JM, Brandão GC. Box-behnken design: an alternative for the optimization of analytical methods. Anal Chim Acta. 2007;597(2):179-86. doi: 10.1016/j.aca.2007.07.011, PMID 17683728.
Jindal K. Review on solubility: a mandatory tool for pharmaceuticals. Int Res J Pharm. 2017;8(11):11-5. doi: 10.7897/2230-8407.0811210.
Kukoc Modun L, Radic N. Spectrophotometric determination of N-acetyl-L-cysteine and N-(2-mercaptopropionyl)-glycine in pharmaceutical preparations. Int J Anal Chem. 2011;2011:140756. doi: 10.1155/2011/140756, PMID 21647283.
Sakellari GI, Zafeiri I, Batchelor H, Spyropoulos F. Formulation design, production and characterisation of solid lipid nanoparticles (SLN) and nanostructured lipid carriers (NLC) for the encapsulation of a model hydrophobic active. Food Hydrocolloids for Health. 2021;1. doi: 10.1016/j.fhfh.2021.100024.
Ayesha J, Ratnamala KV. Formulation and evaluation of sintered gastroretentive tablets of vildagliptin using design of experiment. Asian J Pharm Clin Res. 2023;16(6):46-52.
Mishra V, Bansal KK, Verma A, Yadav N, Thakur S, Sudhakar K. Solid lipid nanoparticles: emerging colloidal nano drug delivery systems. Pharmaceutics. 2018;10(4):191. doi: 10.3390/pharmaceutics10040191, PMID 30340327.
Madupoju B, Rapaka SR, Malothu N, Desu PK, Areti A. Hepatoprotective activity of QBD-based optimized N-acetyl cysteine solid lipid nanoparticles against CCL4-induced liver injury in mice. Pharmacia. 2023;70(4):1397-410. doi: 10.3897/pharmacia.70.e113287.
Amit KS. Fabrication of solid lipid nanoparticles by hot high shear homogenization and optimization by box–behnken design: an accelerated stability assessment. J Appl Pharm Sci. 2021;11(9):35-47.
Naseri N, Valizadeh H, Zakeri Milani P. Solid lipid nanoparticles and nanostructured lipid carriers: structure, preparation and application. Adv Pharm Bull. 2015;5(3):305-13. doi: 10.15171/apb.2015.043, PMID 26504751.
Pandit S, Roy S, Pillai J, Banerjee S. Formulation and intracellular trafficking of lipid–drug conjugate nanoparticles containing a hydrophilic antitubercular drug for improved intracellular delivery to human macrophages. ACS Omega. 2020;5(9):4433-48. doi: 10.1021/acsomega.9b03523, PMID 32175491.
Shafique M, Ur Rehman M, Kamal Z, Alzhrani RM, Alshehri S, Alamri AH. Formulation development of lipid polymer hybrid nanoparticles of doxorubicin and its in vitro, in vivo and computational evaluation. Front Pharmacol. 2023;14:1025013. doi: 10.3389/fphar.2023.1025013, PMID 36825154.
Ekambaram P, Abdul HS. Formulation and evaluation of solid lipid nanoparticles of ramipril. J Young Pharm. 2011;3(3):216-20. doi: 10.4103/0975-1483.83765, PMID 21897661.
Thilak M. Characterization of nanomaterials: tools and challenges, nanomaterials for food applications. Micro and Nano Tech; 2019. p. 313-53.
Stella B, Peira E, Dianzani C, Gallarate M, Battaglia L, Gigliotti CL. Development and characterization of solid lipid nanoparticles loaded with a highly active doxorubicin derivative. Nanomaterials (Basel). 2018;8(2):110. doi: 10.3390/nano8020110, PMID 29462932.
Palak G, Hitesh KD. Aceclofenac loaded solid lipid nanoparticles: optimization, in vitro and ex-vivo. Int J Appl Pharm. 2023;15(4):184-90.
Gill P, Moghadam TT, Ranjbar B. Differential scanning calorimetry techniques: applications in biology and nanoscience. J Biomol Tech. 2010;21(4):167-93. PMID 21119929.
Choubey A, Gilhotra R, Singh SK, Garg G. Formulation and characterization of nanomedicine (solid lipid nanoparticle) associate with the extract of Pterospermum acerifolium for the screening of neurochemicals and neuroendocrine effects. Asian J Neurosurg. 2017;12(4):613-9. doi: 10.4103/ajns.AJNS_2_15, PMID 29114273.
Swapnil DP, Vishal B, Reenu Y, Satish P, Maloji R. A systematic review on nano drug delivery system: solid lipid nanoparticles (SLN). Int J Curr Pharm Res. 2024 Jan;16(1):10-20.
Devaraj VC, Krishna BG, Viswanatha GL, Kamath JV, Kumar S. Hepatoprotective activity of Hepax-a polyherbal formulation. Asian Pac J Trop Biomed. 2011;1(2):142-6. doi: 10.1016/S2221-1691(11)60013-0, PMID 23569745.
Del Rio D, Stewart AJ, Pellegrini N. A review of recent studies on malondialdehyde as toxic molecule and biological marker of oxidative stress. Nutr Metab Cardiovasc Dis. 2005;15(4):316-28. doi: 10.1016/j.numecd.2005.05.003, PMID 16054557.
Amr A, Mahmoud Ghoneim D. Texture analysis of liver fibrosis microscopic images: a study on the effect of biomarkers. Acta Biochim Biophys Sin. 2011 Mar;43(3):193-203.