
Int J App Pharm, Vol 17, Issue 3, 2025, 336-342Original Article
DEVELOPMENT AND VALIDATION OF A HIGH-PERFORMANCE LIQUID CHROMATOGRAPHY WITH PHOTODIODE ARRAY DETECTION (HPLC-PDA) BIOANALYTICAL METHOD FOR QUANTIFICATION OF IMATINIB MESYLATE IN HUMAN PLASMA
JAYA SHREE DILLI BATCHA1, ASHUTOSH GUPTA2, SUDHEER MOORKOTH2, SURULIVELRAJAN MALLAYASAMY1*
1Department of Pharmacy Practice, Manipal College of Pharmaceutical Sciences, Manipal Academy of Higher Education, Manipal, India. 2Department of Pharmaceutical Quality Assurance, Manipal College of Pharmaceutical Sciences, Manipal Academy of Higher Education, Manipal, India
*Corresponding author: Surulivelrajan Mallayasamy; *Email: msv.rajan@manipal.edu
Received: 29 Aug 2024, Revised and Accepted: 25 Feb 2025
ABSTRACT
Objective: Chronic Myeloid Leukemia (CML) is a myeloproliferative neoplasm represented by the uncontrolled growth of myeloid cells at different stages of maturation. Imatinib Mesylate (IM) has set a new standard for treating CML and other cancers. Therefore, in order to do PK investigations and to periodically monitor imatinib, clinical laboratories need an analytical approach that is practically adaptable. The current analytical techniques for use laborious, time-consuming. The aim of this study was to develop and validate a fast and simple method for imatinib quantification in human plasma using High-Performance Liquid Chromatography (HPLC) using photodiode array detection.
Methods: A mobile phase comprising potassium dihydrogen phosphate, methanol, and acetonitrile (30:35:35) with isocreatic programming was utilized to achieve the separation on an ODS C18 column (150×4.6 mm), 4µm column. The procedure consisted of simple protein precipitation with cold methanol extraction to obtain the maximum recovery from a 90 μl plasma sample.
Results: The regression coefficient of 0.99 indicates that the procedure is linear in the range of 100 to 10,000 ng/ml. The total recovery of the approach under lower quality control was 102.45%, at middle-quality control 101.70%; and at higher quality control, it was 95.75%. Both accuracy and precision were within acceptable bounds.
Conclusion: The quantification of imatinib levels in plasma of CML patients for Pharmacokinetic (PK) assessments and Therapeutic Drug Monitoring (TDM) necessitates the development and validation of an easy-to-use, effective, repeatable, and environmentally friendly analytical technique.
Keywords: Chronic myeloid leukemia, Imatinib mesylate, HPLC, Human plasma sample
© 2025 The Authors. Published by Innovare Academic Sciences Pvt Ltd. This is an open access article under the CC BY license (https://creativecommons.org/licenses/by/4.0/)
DOI: https://dx.doi.org/10.22159/ijap.2025v17i3.52563 Journal homepage: https://innovareacademics.in/journals/index.php/ijap
INTRODUCTION
Cancer is a condition in which some cells in the body grow abnormally and spread through various organs. Cancers can be classified as benign or malignant based on their spread; if the cancer cells are limited to a single location, they are benign. Malignant cells spread to organs other than the primary organ [1, 2]. The World Health Organization (WHO) reported that cancer is the biggest cause of mortality worldwide [3, 4]. In India, one out of every nine people are expected to develop cancer during their lifetime. According to 2022 statistics, the cancer incidence rate was 100.4 per 100,000 people, with 14,61,427 new cases reported in India. By 2025, the cancer burden is expected to reach 29.8 million disability-adjusted life years (adjusted for mortality and incidence) [5].
A myeloproliferative tumor, Chronic Myeloid Leukemia (CML) is characterized by an unregulated growth of myeloid cells during various phases of development. The three stages of CML are called Blast Crisis (BC) or Blast Phase (BP), Accelerated Phase (AP), and Chronic Phase (CP). These phases of the disease are characterised by the increase in the percentage of the blast cells of the lymphoid, myeloid or mixed lineage. According to WHO,>20% of blasts are seen in BC, 10-19% blasts are seen in AP, and<10% blasts in CP [6]. A large number of patients are first diagnosed with CP, but if treatment is not received, they eventually develop AP and BP. However, only a small proportion of people develop BP after CP. CML symptoms are not specific and include fever, fatigue, and weight loss due to splenomegaly and anaemia. Patients in the BP will experience more severe symptoms, such as bone pain and bleeding. More than 50% of patients with CML-CP have no symptoms and can only be discovered through routine examination [7, 8].
The discovery of Imatinib Mesylate (IM) has set a new standard for treating CML and other cancers. In CML, the chromosomes (9, 22) translocation causes the Bcr-Abl fusion oncoprotein, which leads to the Philadelphia chromosome [9, 10]. Imatinib was previously known as ST1571 and has been shown to inhibit the Bcr-Abl tyrosine kinase by preventing the binding of ATP [11]. The chemical structure and chemistry of imatinib are demonstrated in fig. 1 and table 1.
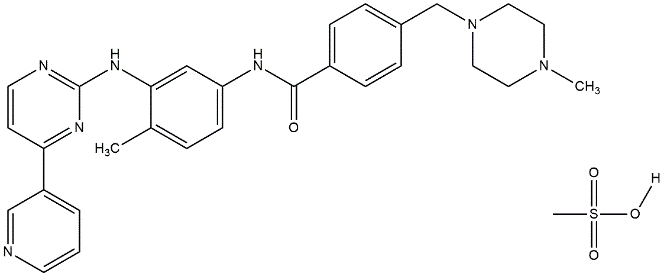
Fig. 1: Chemical structure of imatinib
Table 1: Chemistry of imatinib
| Parameter | Description |
| Molecular weight | 589.7 g/mol |
| H-bond acceptor | 10 |
| H-bond donor | 3 |
| pKa | 12.69, 7.84 |
| Log P | 3.47 |
| BCS Class | Class I |
High-Performance Liquid Chromatography (HPLC) is an indispensable analytical technique used in the quantification and analysis of drugs in biological matrices [12]. The development of an HPLC method for measurement of imatinib, a Tyrosine Kinase Inhibitor (TKI) is essential to monitor its levels in CML patients because it will assist us attaining the therapeutic drug level, to avoid adverse effects or drug interactions and titrate the dose depending on the response of the patient [13, 14].
To perform pharmacokinetics investigations and to periodically monitor imatinib, clinical laboratories need an analytical approach that is practically adaptable. The current analytical technique for use is laborious and time-consuming. An analytical technique that combines liquid chromatography with UV detection or mass spectrometry has been developed and validated in many studies to measure imatinib in human plasma. The internal standards used in most of those studies for HPLC method development were dasatinib, olanzapine, deuterated imatinib, 4-OH benzophenone and pyrilamine maleate [15-21]. The objective of this study was to develop and validate a quick and easy method for quantifying imatinib in human plasma utilizing high-performance liquid chromatography with Photodiode Array Detection (PDA).
MATERIALS AND METHODS
Reference standards, reagents, and biological sample
Sigma Aldrich supplied dasatinib (internal standard) and imatinib mesylate as secondary pharmaceutical standards. Strong ammonia solution and LC-MS grade acetonitrile were provided by MercK, India. Type I water was obtained using the Merck Millipore Direct Q-3 UV water purification system. Following informed consent, clinical samples were collected from patients who met the inclusion criteria. The Institutional Ethical Committee (IEC) approval was obtained from institutional ethical committee of Kasturba Hospital, dated September 14, 2021 (Approval No. IEC: 639/2021) and Clinical Trials Registry, India dated June 16, 2022 (CTRI/2022/07/044424), respectively. The method was developed and validated using plasma sample from healthy adult human volunteer.
Apparatus
The Shimadzu HPLC system, including the LC20-AD pump, SPD-20A and SPD-M10A detectors, CTO-10 ASVP column oven, SIL20-AC HT autosampler, and LabSolutions software, was utilized for optimizing and validating the chromatographic process. To prepare the buffer and standard solution, the chemicals have been degassed in an ultrasonic bath (GT Sonic, Guangdong GT Ultrasonic Co. Ltd, China) and weighed using a calibrated analytical balance (Sartorious Mechatronics CP225D, India) and a membrane filter of 0.22 µm are utilized. The mobile phase's pH was determined by utilizing a calibrated analog pH meter (model: LI 617, make: ELICO, Telangana, India). Pipetting was performed at different phases of sample processing with standardized variable micropipettes with volumes that vary from 0.2-10 µl**, 10-100 µl**, and 100-1000 µl** (made by Eppendorf, Germany).
Chromatography conditions
The chromatographic separation was achieved by gradient programming of the mobile phase (10 mmol phosphate buffer with pH 6.5 plus 1% TEA: methanol: acetonitrile (30: 35: 35)) at the flow rate of 0.5 ml/min and the column oven at a temperature of 25 °C. This stationary phase was ODS C18 column (150×4.6 mm), 4µm. A 10 µl** injection volume was used, and the autosampler was maintained at 8 °C.
Preparation of stock solution
Imatinib mesylate and dasatinib standard stock solutions in water and acetonitrile were prepared each at 1 mg/ml concentrations. The stock solution was serially diluted to prepare imatinib working standards (100-10,000 ng/ml). A working internal standard with a concentration of 2000 ng/ml was prepared using dasatinib stock solution in water.
Calibration and quality control (QC) samples
In order to obtain the calibrator concentrations of 100, 250, 500, 750, 1000, 2000, 5000, 10000 ng/ml, healthy adult human pooled plasma was spiked at 4% using the appropriate working standard solution. QC samples were created in the same way, with 100, 150, 4000, and 8000ng/ml concentrations to represent the Lower Limit of Quantification (LLOQ), Lower QC (LQC), Medium QC (MQC), and Higher QC (HQC).
Clinical sample collection
A prospective longitudinal observational study was designed to collect plasma samples from patients (N=10) for clinical validation. Patients who met the study's inclusion criteria and received imatinib as part of their routine treatment were enrolled after obtaining the required consent and IEC clearance. The blood samples were obtained by experienced nurses; then, the samples were centrifuged at 4,600*g for 10 min to separate the transparent plasma specimen, which was then preserved at-80 °C until analysis.
Plasma sample preparation
In a 1.5 ml conical centrifuge tube, 10 µl** of dasatinib working standard solution and 90 µl** of plasma sample were combined. To prepare for HPLC-PDA analysis, the aforementioned mixture was precipitated with 400 µl** of cold methanol and centrifuged at 9392×g at 4 °C for 10 min.
Method validation
The technique used for analysis was validated using the US-FDA and ICH M10 requirements. The evaluation considered system appropriateness, selectivity, recovery, matrix effect, carry-over, linearity, accuracy, and precision, as well as dilution integrity and stability (22–24).
System suitability
To ensure that the system performed properly, six MQC replication samples were evaluated. This is determined by measuring the column retention time, area response, and back pressure [25].
Selectivity and carry-over
A selectivity study was conducted to ascertain whether the developed approach could distinguish between and quantify any possible interference found in the blank matrix. Six blank matrices from healthy individuals were obtained and injected following the LLOQ. There shouldn't be any interference during the imatinib’s retention period. By injecting a blank matrix following the LLOQ and upper limit of quantification in six replicates, the difference between the observed concentration of the imatinib or dasatinib caused by the leftover imatinib or dasatinib from the prior sample that stays in the autosampler injector was also assessed. To guarantee that there is no carry-over, responses in the blank matrix at the imatinib retention time should be less than 20% of LLOQ and, for dasatinib, less than 5% of LLOQ.
Matrix effect
Imatinib was spiked at LQC and HQC in three replicates from healthy individual samples to study the effects of different plasma sources on imatinib measurement. The results were evaluated to ensure accuracy within ±15% of the nominal concentration and precision (%) Coefficient of Variation (CV) not exceeding 15% [26].
Linearity and LLOQ
Three separate Calibration Curves (CC) have been generated on three distinct days, with calibrators ranging from 100 to 10,000 ng/ml. The intercept and slope of the linear curves were determined using Qual browser and XCalibur software, with a weighing factor of 1/X applied. The calibrator standards' back-calculated concentration was found to be within ±20% and ±15% of the imatinib nominal concentration for LLOQ and other CC standards, respectively, indicating the technique's suitability for the tested range. The LLOQ was determined using the visual method, with precision from six replicate injections and a signal-to-noise ratio of at least 10 at 0.5 ng/ml.
Accuracy and precision
Six replicas of QC samples were injected at LLOQ, LQC, MQC, and HQC in order to evaluate the accuracy and precision with each run. Three different runs were carried out over three days to determine between-run precision and accuracy. The bias of computed concentrations was evaluated using nominal QC concentrations and the coefficient of variation, with an acceptable limit of ≤15% CV precision and QC (±20% for LLOQ). A linearity run was carried out before each accuracy and precision run to confirm compliance with the linearity range's acceptance limit.
Recovery
To evaluate the degree and consistency of analyte and internal standard extraction from plasma using a direct area-to-area comparison approach, five duplicates of pre-and post-extraction spiked QC and working internal standard were carried out at LQC and HQC. The acceptability criterion was ≤10% coefficient of variance from the mean recovery.
Dilution integrity
To assure dilution integrity, a 2.5×ULOQ (10,000 ng/ml) of imatinib from an independent stock solution was spiked into the blank plasma and tested after diluting 3-4 times. Back-calculated concentrations for integrity samples should be within a tolerance of ±15% accuracy and precision ≤15% CV.
Stability
The long-term stability of the imatinib standard stock solution and internal standard was tested at temperatures ranging from 2 °C to 8 °C over 0, 3, 7, 15, and 30 days. The stability of imatinib in plasma matrix at room temperature (bench-top stability, 24 h), autosampler stability (at 8 °C, 24 h), processed sample stability (at 2 °C-8 °C freezer, 48 h), and freeze-thaw stability (at-80 °C, five cycles at 24 h intervals) were tested at low and high concentrations. The stability of imatinib in the plasma matrix at-80 °C was assessed at 0, 3, 7, 15, 30, and 60 d time periods, both at LQC and HQC.
Clinical validation
The clinical study was approved by the institution's ethical committee. A total of 10 samples were collected and analyzed from 10 CML patients at random times while they underwent routine clinical investigations.
Greenness of the developed method
The analytical technique's greenness was evaluated using the AGREE software (“Analytical Greenness Metric Approach and software”) (27). This technique takes into account twelve factors, each of which is given a score ranging from zero to one, with higher numbers denoting a greener method [28, 29].
RESULTS AND DISCUSSION
Method optimization
All potential sources of analysis errors were taken into consideration when developing the approach. The chromatogram of imatinib is illustrated in fig. 2. The likelihood that the technique will fail during method transfer can be reduced by optimizing the critical chromatographic parameters and then validating the procedure. As imatinib absorbs well at 255 nm, the method was developed using HPLC and a photo diode array (PDA) detector. PDA detectors can monitor the samples at several wavelengths without requiring a repeat examination. Based on the drugs chemistry and the literature, a polar-RP C18 (150×4.6 mm) column was used for the detection of imatinib, based on the Log P value, which is nearly 3 and 5, respectively [30]. Since the pKa value of imatinib is about 7.84 the 0.1% formic acid phosphate and ammonium acetate buffer were tried as the aqueous phase.
In initial trials ammonium acetate and 0.1% formic acid were used which did not show any drug peak because imatinib did not retain in the column. In another trials potassium dihydrogen phosphate buffer was used with different pH range. Potassium dihydrogen phosphate buffer was utilized for method development, with a pH range set from 2.5 to 3.1 and 6.1 to 6.8. Initial trials were conducted within the 2.5 to 3.1 pH range using various organic solvents, including methanol and acetonitrile. The buffer at pH 3.1 combined with acetonitrile/methanol in different ratios was tested first, but it failed to produce any detectable peaks for imatinib and its Internal Standard (IS) dasatinib. Subsequently, using potassium dihydrogen phosphate buffer at pH 2.5 with acetonitrile/methanol resulted in the retention times of both drugs being too close, yielding a resolution of less than 1. To enhance resolution, the buffer pH was adjusted from 2.5 to 2.7, and 0.1% triethanolamine was added, which improved peak separation. In the final trial, a combination of potassium dihydrogen phosphate buffer at pH 6.5 with 0.1% triethanolamine, along with acetonitrile and methanol, was employed, resulting in well-resolved peaks for both the drug and IS, achieving a resolution greater than 1. Oostendorp et al. developed the HPLC method to quantify the imatinib in the human sample. The author has used the 50 mmol ammonium acetate at pH 6.8 for the elution of drug but high concentration of buffer can block the stationary phase affect the column properties. The method developed by us is better than previously reported method because we are using less buffer concentration [31]. Kakavandi et al. developed the HPLC method to quantify imatinib and its major metabolites, N-desmethyl imatinib in biological and environmental samples. Author has used complex to extract the sample from the biological matrix. In our method, we have used the simple precipitation method, which is simple procedure [32].

Fig. 2: Pictorial representation showed the chromatogram of (A) Blank plasma, (B) imatinib (RT 12.22 min) and internal standard (Dasatinib) (RT 6.16 min)
Validation of the developed HPLC method
System suitability
Suitability of the system guarantees that the analytical technique remains appropriate for its intended usage at all times. The methodology's system suitability was confirmed by the precision Relative Standard Deviation (RSD), which for the internal standard and imatinib retention time was determined to be no more than 2.0% throughout the study.
Selectivity and carry-over
At the time that IS and imatinib were retained in plasma samples, none of the six distinct blank samples exhibited interference. This demonstrates that the analytical technique can distinguish the analyte even in the presence of potential plasma matrix interferences. Additionally, the absence of imatinib and IS in the blank sample run after the plasma ULOQ test demonstrated the absence of a carryover effect.
Matrix effect
To investigate the impact of various plasma sources on amikacin measurement, imatinib was spiked at LQC and HQC in three replicates from six healthy persons. The measurements were assessed to guarantee accuracy within ±15% of the nominal concentration and precision (%), with a maximum of 15% for the coefficient of variation (CV).
Linearity range
The calibration curve was plotted between the range of 100 to 10,000 ng/ml; the Regression Coefficient (R2) was not less than 0.99, which shows the strong correlation between the area of drug and IS. The approach is suitable for the tested range, as evidenced by the accuracy of the back-calculated concentrations of the calibration standards, which were within ±15% of their nominal concentrations at every level.
Accuracy and precision
A linearity run was evaluated to see whether the acceptance limit listed in the linearity range was met before each accuracy and precision test. Table 2 displays the allowable ranges of accuracy and precision for the back-calculated concentrations of spiked plasma QCs. Three separate runs had within-run accuracy ranging from 93.59% to 104.40% with precision ranging from 3.68% to 6.21%. Three independent runs yielded a 92.41%–103.22% between-run accuracy and a 4.52%–7.41% precision. Alaejos et al., compared the automated and chromatography methods in terms of linearity, precision, and accuracy. The reported method did not discuss the sensitivity of the method. Our reported method is more accurate, with better linearity and high sensitivity [33].
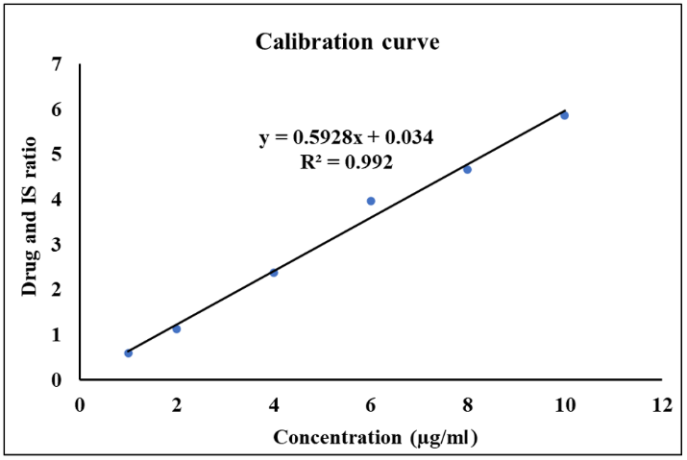
Fig. 3: The pictorial representation showed the calibration curve of the imatinib
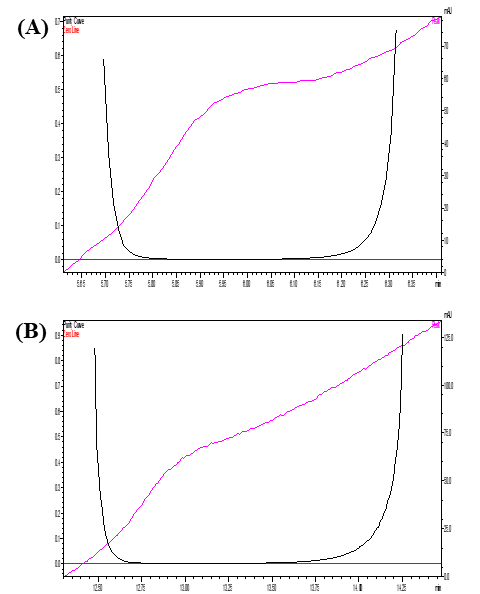
Fig. 4: The pictorial representation showed the peak purity of the drugs (A) imatinib (B) IS
Table 2: Accuracy and precision data of QC samples of imatinib from spiked plasma
| Parameter | Imatinib concentration (N=6) | |||
| LLOQ, 95 ng/ml | LQC, 600 ng/ml | MQC, 1250 ng/ml | HQC, 9200 ng/ml | |
| Within run | ||||
| Accuracy±SD (%) | 93.59±4.83 | 97.5±9.68 | 104.40±7.35 | 98.01±3.71 |
| Precision (% CV) | 4.13 | 3.94 | 6.08 | 4.62 |
| Between run | ||||
| Accuracy±SD (%) | 92.41±4.17 | 96.39±5.29 | 103.22±7.94 | 96.92±4.12 |
| Precision (% CV) | 5.17 | 7.68 | 4.43 | 5.52 |
Recovery
Imatinib recovery from the plasma sample had done at three levels LLOQ, MQC, and HQC which showed 102.45% assay (3.71% CV), 101.70% assay (4.50% CV), and 95.75% assay (2.66% CV) for imatinib, respectively.
Dilution integrity
Dilution integrity evaluation verifies that the dilution process has no impact on the analysis's outcomes. The three-and-four-times dilutions of the integrity sample's back-calculated concentrations revealed 96.82% assay with coefficients of variation of 3.28%, respectively. These findings persisted at minimal concentrations within the tolerance range of ±15% accuracy and<15% precision.
Stability evaluation
Over the course of 30 days, the internal standard and imatinib stock solution demonstrated stability, showing a total degradation of 3.7%±2.9% and 1.8%±3.1%, respectively, from the starting concentration. The findings of tests conducted on the autosampler, bench-top, freeze-thaw, and processed samples at the LQC and HQC levels are listed in table 3, all of which showed good stability.
The long-term stability of imatinib in plasma kept at-80 °C is shown in fig. 5. The imatinib concentration did not significantly decline as seen by the 4.85%±2.6% drop from the starting concentration observed in the 60th day of plasma stability samples.
Greenness of analytical procedure
Green Analytical Chemistry (GAC) seeks to analyze the implications of analytical procedures on the environment, safety for workers, and wellness especially when organic solvents are used in the mobile phase. The use of a range of green assessment methods to grade the greenness of various analytical procedures has become viable as interest in GAC has grown significantly in recent years. We used the AGREE tool to create an example (fig. 7) demonstrating the method's environmental friendliness. An AGREE score of 0.71 indicated that the developed HPLC method for measurement of imatinib was ecologically friendly.
Table 3: Imatinib stability results under various conditions
| Concentration | Stability study condition (%Accuracy±SD) (N=6) | |||
| Autosampler 24 h, 8 ℃ | Bench-top 24 h, RT | Freeze-thaw five cycles | Processed sample 48 h, 2-8 ℃ | |
| LOQ | 97.15%±2.41% | 98.34%±3.71% | 96.82%±2.69% | 95.21%±3.87% |
| HQC | 95.15%±3.67 | 97.72%±4.68% | 95.32%±4.82% | 97.49%±2.67% |
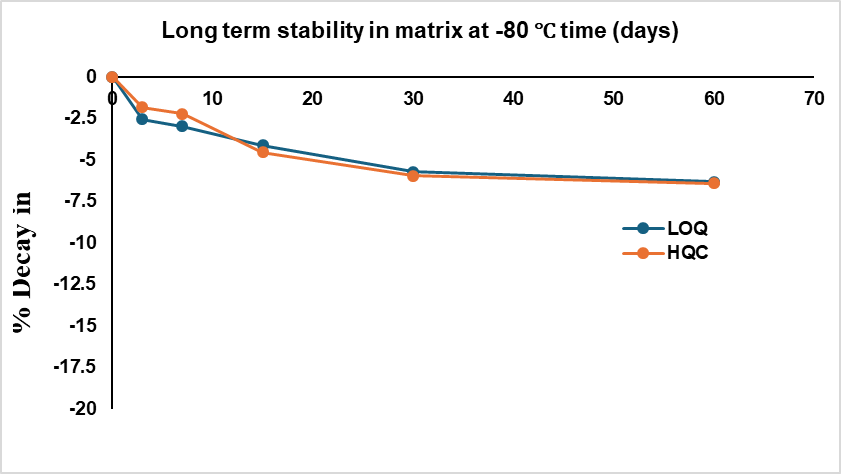
Fig. 5: Long-term stability data of imatinib in plasma at-80 °C
Table 4: Demographics of the patients
| Parameters (N=10) | Mean±SD or N(%) |
| Age | 43.9±12.77 |
Dose 400 mg 600 mg |
8 (80) 2 (20) |
| Height (cm/s) | 165±5.59 |
| Weight (kg/s) | 61.23±5.74 |
| Total no. of samples | 10 |
| Biochemistry | |
| Hb (g/dl) | 13.45±0.68 |
| WBC (1012/l) | 5.88±1.45 |
| Differential Count | |
| Neutrophils (%) | 49.57±4.85 |
| Lymphocytes (%) | 3553±8.18 |
| Monocytes (%) | 8.44±2.39 |
| Eosinophils (%) | 5.63±3.35 |
| Basophils (%) | 0.83±0.71 |
| Platelets (109/l) | 232.1±67.25 |
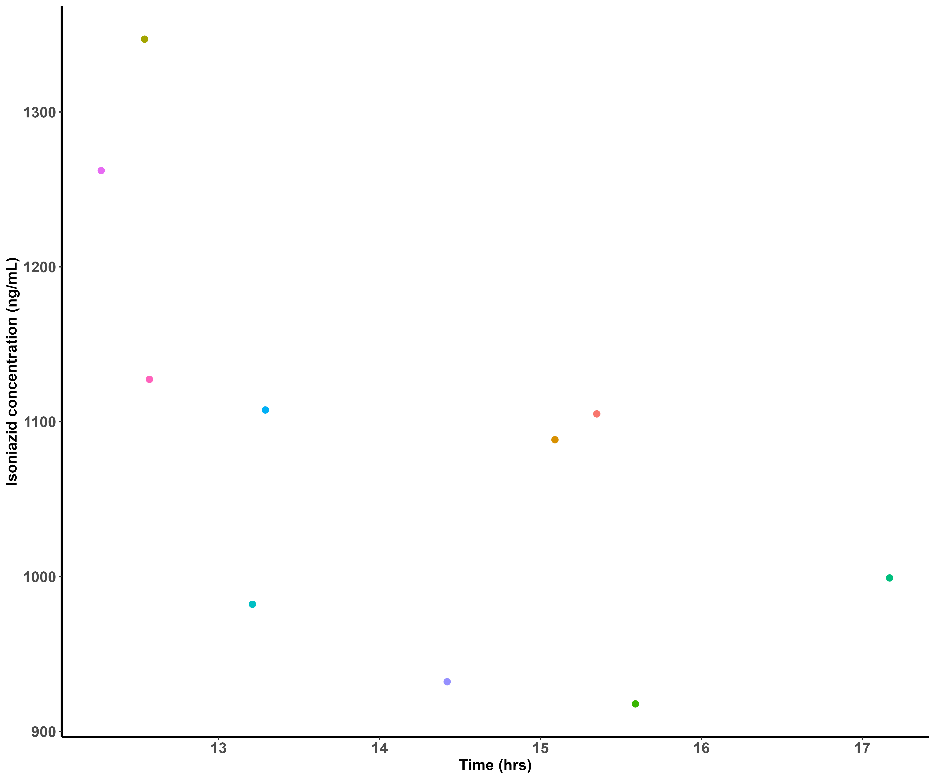
Fig. 6: Time vs concentration plot of imatinib
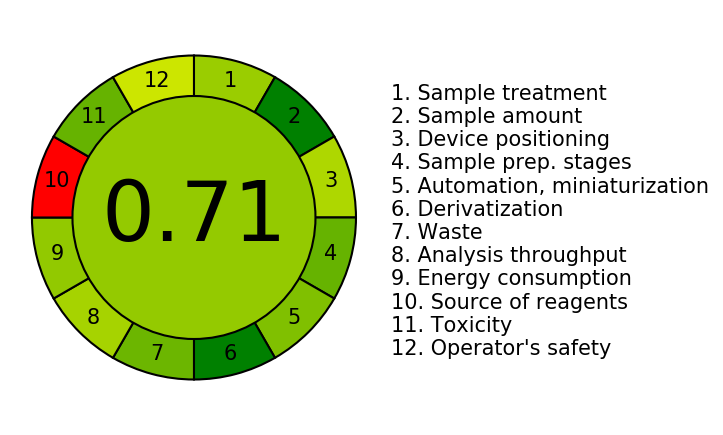
Fig. 7: Green analytical procedure index pictogram of developed HPLC-PDA method for estimation of imatinib from plasma of adult CML patients
CONCLUSION
The quantification of imatinib levels in plasma of CML patients for PK assessments and TDM necessitates the development and validation of an easy-to-use, effective, repeatable, and environmentally friendly analytical technique. The process doesn't involve any ion-pairing reagents or derivatization stages. The method's clinical validation showed a correlation between the CML patients’ clinical status and the imatinib concentrations that were detected. It was discovered that the suggested method might be applied to clinical laboratories for imatinib therapeutic monitoring in CML patient, as well as employed for PK research in the CML population. Studies on the bioavailability and bioequivalence of imatinib will also find application for this methodology.
ACKNOWLEDGEMENT
We are grateful to the Indian Council of Medical Research, New Delhi for providing a research fellowship for the first author.
FUNDING
The first author (J. S. D. B.) has received research fellowship from Indian Council of Medical Research.
AUTHORS CONTRIBUTIONS
Conceptualization: S. M. (SurulivelrajanMallayasamy) and J. S. D. B.; Methodology: J. S. D. B. and A. G.; Data Curation: J. S. D. B.; Formal Analysis: S. M. (SurulivelrajanMallayasamy) and J. S. D. B.; Writing—original draft: J. S. D. B. and A. G; Writing—review and editing: J. S. D. B., A. G, S. M. (SurulivelrajanMallayasamy), and S. M. (Sudheer Morkooth); Supervision: S. M. (SurulivelrajanMallayasamy), S. M. (Sudheer Morkooth).
CONFLICT OF INTERESTS
Declared none
REFERENCES
What is cancer? NCI. Available from: https://www.cancer.gov/about-cancer/understanding/what-is-cancer. [Last accessed on 21 Jul 2024].
Aravindan A, Gupta A, Moorkoth S, Dhas N. Implications of nanotherapeutic advancements to leverage multi-drug resistant breast cancer: the state of the art review. J Drug Deliv Sci Technol. 2024 Oct;100:106007. doi: 10.1016/j.jddst.2024.106007.
World Cancer D; 2024. Available from: https://ncdirindia.org/display/wcd.Aspx. [Last accessed on 21 Jul 2024].
Gupta A, Kulkarni S, Soman S, Saha M, Kulkarni J, Rana K. Breaking barriers in cancer management: the promising role of microsphere conjugates in cancer diagnosis and therapy. Int J Pharm. 2024 Nov 15;665:124687. doi: 10.1016/j.ijpharm.2024.124687, PMID 39265846.
Siegel RL, Miller KD, Wagle NS, Jemal A. Cancer statistics; 2023. CA Cancer J Clin. 2023 Jan 1;73(1):17–48. Available from: https://onlinelibrary.wiley.com/doi/full/10.3322/caac.21763. [Last accessed on 21 Jul 2024].
Arber DA, Orazi A, Hasserjian R, Thiele J, Borowitz MJ, LE Beau MM. The 2016 revision to the World Health Organization classification of myeloid neoplasms and acute leukemia. Blood. 2016;127(20):2391-405. doi: 10.1182/blood-2016-03-643544, PMID 27069254.
Minciacchi VR, Kumar R, Krause DS. Chronic myeloid leukemia: a model disease of the past present and future. Cells. 2021;10(1):117. doi: 10.3390/cells10010117, PMID 33435150.
Gupta A, Nishchaya K, Saha M, Naik GA, Yadav S, Srivastava S. Recent advancements in nanoconstructs for the theranostics applications for triple negative breast cancer. J Drug Deliv Sci Technol. 2024;93:105401. doi: 10.1016/j.jddst.2024.105401.
Jain P, Kantarjian H, Patel KP, Gonzalez GN, Luthra R, Kanagal Shamanna RK. Impact of BCR-ABL transcript type on outcome in patients with chronic phase CML treated with tyrosine kinase inhibitors. Blood. 2016;127(10):1269-75. doi: 10.1182/blood-2015-10-674242, PMID 26729897.
Rowley JD. A new consistent chromosomal abnormality in chronic myelogenous leukaemia identified by quinacrine fluorescence and giemsa staining. Nature. 1973;243(5405):290-3. doi: 10.1038/243290a0.
Peng B, Lloyd P, Schran H. Clinical pharmacokinetics of imatinib. Clin Pharmacokinet. 2005;44(9):879-94. doi: 10.2165/00003088-200544090-00001, PMID 16122278.
Gupta A, Kossambe RV, Moorkoth S. Box behnken design assisted eco-friendly RP-HPLC-PDA method for the quantification of paclitaxel: application to evaluate the solubility of paclitaxel cyclodextrin complex. Int J Appl Pharm. 2024;16(6):305-15. doi: 10.22159/ijap.2024v16i6.51690.
Blasdel C, Egorin MJ, Lagattuta TF, Druker BJ, Deininger MW, Thomas DA. Therapeutic drug monitoring in CML patients on imatinib. In: American Society of Hematology. Available from: http://ashpublications.org/blood/article-pdf/110/5/1699/1294197/zh801707001699.pdf. [Last accessed on 11 Jun 2024].
Therapeutic drug monitoring in oncology: International Association of therapeutic drug monitoring and clinical toxicology consensus guidelines for Imatinib Therapy Clinicalkey. Available from: https://www.clinicalkey.Com/#!/content/playContent/1-s2.0S0959804921005608?scrollTo=%23hl0000805. [Last accessed on 11 Jun 2024].
Titier K, Picard S, Ducint D, Teilhet E, Moore N, Berthaud P. Quantification of imatinib in human plasma by high-performance liquid chromatography-tandem mass spectrometry. Ther Drug Monit. 2005;27(5):634-40. doi: 10.1097/01.ftd.0000175973.71140.91, PMID 16175138.
Golabchifar AA, Rouini MR, Shafaghi B, Rezaee S, Foroumadi A, Khoshayand MR. Optimization of the simultaneous determination of imatinib and its major metabolite CGP74588 in human plasma by a rapid HPLC method using D-optimal experimental design. Talanta. 2011;85(5):2320-9. doi: 10.1016/j.talanta.2011.07.093, PMID 21962649.
Miura M, Takahashi N, Sawada K. Quantitative determination of imatinib in human plasma with high-performance liquid chromatography and ultraviolet detection. J Chromatogr Sci. 2011;49(5):412-5. doi: 10.1093/chromsci/49.5.412, PMID 21549035.
Tan KL, Ankathil R, Gan SH. Method development and validation for the simultaneous determination of imatinib mesylate and N-desmethyl imatinib using rapid resolution high-performance liquid chromatography coupled with UV detection. J Chromatogr B Analyt Technol Biomed Life Sci. 2011;879(30):3583-91. doi: 10.1016/j.jchromb.2011.09.048, PMID 22000961.
Francis J, Dubashi B, Sundaram R, Pradhan SC, Chandrasekaran A. A simple and rapid method for the quantification of imatinib mesylate and desmethyl imatinib in human plasma using LC-MS/MS and its application to routine therapeutic drug monitoring. World J Pharm Res. 2014;3(5):1067-75.
Katakam P, Rao KR. Development and validation of a bioanalytical method for the determination of imatinib in human plasma by LC-MS/MS. Article in journal of pharmacy research. 2012;5(6):3280-4.
Gupta A, Mutalik S, Navti PD, Saha M, Moorkoth S, Shetty S. Box behnken guided development of an eco-friendly RP-HPLC analytical method for simultaneous quantification of pantoprazole sodium and piperine co-loaded mucoadhesive GRDDS formulation for H. pylori eradication. J Appl Pharm Sci. 2024;14(9):98-110. doi: 10.7324/JAPS.2024.179147.
Bioanalytical method validation guidance for industry. In: FDA. Available from: https://www.fda.gov/regulatory-information/search-fda-guidance-documents/bioanalytical-method-validation-guidance-industry. [Last accessed on 21 Aug 2024].
Federal register. M10 bioanalytical method validation and study sample analysis; international council for harmonization; guidance for industry; 2022. Available from: https://www.federalregister.gov/documents/2022/11/07/2022-24113/m10-bioanalytical-method-validation-and-study-sample-analysis-international-council-for. [Last accessed on 21 Aug 2024].
Raveendran A, Gupta A, Lewis LE, Prabhu K, Moorkoth S. LC–MS‐based simultaneous determination of biomarkers in dried urine spots for the detection of cofactor dependent metabolic disorders in neonates. J Sep Sci. 2024;47(22):e70031. doi: 10.1002/jssc.70031, PMID 39582092.
Gupta A, Navti PD, Mutalik S, Saha M, Moorkoth S. DoE guided development of an HPLC method for evaluation of amoxicillin and metronidazole co-loaded mucoadhesive GRDDS formulation for H. pylori eradication. Chromatographia. 2023;86(11-12):729-42. doi: 10.1007/s10337-023-04290-z.
Raveendran A, Gupta A, Lewis LE, Prabhu K, Moorkoth S. Liquid chromatography-mass spectrometric method for the simultaneous analysis of branched-chain amino acids and their ketoacids from dried blood spot as secondary analytes for the detection of maple syrup urine disease. J Mass Spectrom Adv Clin Lab. 2024 Nov;34:8-20. doi: 10.1016/j.jmsacl.2024.10.001, PMID 39492949.
Pena Pereira F, Wojnowski W, Tobiszewski M. AGREE analytical GREEnness metric approach and software. Anal Chem. 2020;92(14):10076-82. doi: 10.1021/acs.analchem.0c01887, PMID 32538619.
Raveendran A, Gupta A, Lewis LE, Prabhu K, Moorkoth S. A comprehensive approach for detection of biotin deficiency from dried blood spot samples using liquid chromatography-mass spectrometry. Future Sci OA. 2024 Dec 31;10(1):2355038. doi: 10.1080/20565623.2024.2355038, PMID 38963009.
Saha M, Gupta A, Shetty S, Mutalik S, Nandakumar K, Raghu Chandrashekar H. DoE-aided optimization of RP-HPLC method for simultaneous estimation of amoxicillin and tinidazole loaded mucoadhesive GRDDS formulation for the treatment of H. pylori. Chromatographia. 2024;87(9):533-48. doi: 10.1007/s10337-024-04346-8.
He S, Shao Q, Zhao J, Bian J, Zhao Y, Hao X. Population pharmacokinetics and pharmacogenetics analyses of imatinib in Chinese patients with chronic myeloid leukemia in a real-world situation. Cancer Chemother Pharmacol. 2023;92(5):399-410. doi: 10.1007/s00280-023-04581-0, PMID 37624393.
Oostendorp RL, Beijnen JH, Schellens JH, Van Tellingen O. Determination of imatinib mesylate and its main metabolite (CGP74588) in human plasma and murine specimens by ion-pairing reversed-phase high-performance liquid chromatography. Biomed Chromatogr. 2007;21(7):747-54. doi: 10.1002/bmc.816, PMID 17385801.
Rahimi Kakavandi N, Asadi T, Jannat B, Abdi K, Ghazi Khansari M, Shahali H. Method development for determination of imatinib and its major metabolite N-desmethyl imatinib in biological and environmental samples by SA-SHS-LPME and HPLC. Biomed Chromatogr. 2021;35(7):e5088. doi: 10.1002/bmc.5088, PMID 33590534.
Alaejos AC, Cabrera SJ, Rodriguez BC, Castaneda AZ. Validation and comparison of two analytical methods for imatinib therapeutic drug monitoring. Chromatographia. 2021;84(6):589-96. doi: 10.1007/s10337-021-04041-y.