
Int J App Pharm, Vol 17, Issue 2, 2025, 293-298Original Article
SIMULTANEOUS DETERMINATION OF GLYCERINE AND DEG IN GLYCERINE RAW MATERIAL USING FT-IR SPECTROSCOPY AND MULTIVARIATE CALIBRATION METHODS
SAFWAN M. OBEIDAT*, AYMAN Y. HAMMOUDEH
Chemistry Department, Faculty of Science, Yarmouk University, Irbid-21163, Jordan
*Corresponding author: Safwan M. Obeidat; *Email: safwan@yu.edu.jo
Received: 21 Sep 2024, Revised and Accepted: 17 Dec 2024
ABSTRACT
Objective: This study aims to determine reliably the concentration of Diethylene Glycol (DEG) in glycerine raw material in a simple and rapid manner using Attenuated Total Reflectance-Fourier Transform Infrared (ATR-FTIR) spectroscopy coupled with chemometric methods.
Methods: for the first time, the current work employs multivariate data analysis tools and FTIR spectroscopy for the simultaneous determination of glycerine and DEG. Binary mixtures of the two substances were prepared and categorized into calibration, validation and test samples. The DEG ratio in these samples ranged from 1 to 30%. The FTIR spectra were recorded for all samples in the range 3700-815 cm-1, and spectral data for each group of samples were used for Principal Component Analysis (PCA), Principal Component Regression (PCR) and Partial Least Square (PLS) applications.
Results: In the case of PCA application, a 100% successful discrimination among pure glycerine, DEG and mixed samples was achieved. Semi-quantitative determination of both substances was also possible using PC1 and PC2, accounting for about 99% of the variation in the data set. When using the PCR algorithm, quantitative analysis of the two substances was successfully achieved with an average recovery percent of 98.32±0.19% for glycerine and 99.89±5.7% for DEG. On the other hand, the mean recovery percent values based on the PLS model were 101.37±0.13% and 103.26±3.2% for glycerine and DEG, respectively.
Conclusion: Distinguishing pure samples of both analytes was achieved successfully using FTIR spectroscopy and PCA for data analysis. On the other hand, the quantification of DEG in glycerine was very satisfactory upon analyzing the spectroscopic data using PCR and PLS algorithms. FTIR spectroscopy coupled with PCA, PCR and PLS has, thus, been shown to be of great potential to detect the adulteration of glycerine with DEG.
Keywords: Glycerine, Diethylene glycol, FTIRs, PCA, PCR, PLS
© 2025 The Authors. Published by Innovare Academic Sciences Pvt Ltd. This is an open access article under the CC BY license (https://creativecommons.org/licenses/by/4.0/)
DOI: https://dx.doi.org/10.22159/ijap.2025v17i2.52729 Journal homepage: https://innovareacademics.in/journals/index.php/ijap
INTRODUCTION
Glycerine or glycerol is a colorless, odorless, viscous, sweet and non-toxic alcohol used in manufacturing various products, from food and pharmaceutical to personal care products and others [1]. The contamination of glycerine and other high-risk drug components with DEG and Ethylene Glycol (EG) has been associated with incidents of fatal poisoning among consumers of drugs in liquid form, such as cough, allergy and analgesic medicines [2, 3]. A long history of DEG poisoning outbreaks has been reported [2-6]. The highly toxic DEG is a classical adulterant for glycerine since it has similar chemical and physical properties but is less expensive [1, 7-8]. In all cases of DEG poisoning, DEG entered the pharmaceutical supply chain when the drug manufacturers did not follow quality control procedures on glycerine, including DEG quantification [2]. The relevant World Health Organization (WHO’s) medical product alerts requested, among others, “increased surveillance and diligence within the supply chains of countries and regions likely to be affected” [3]. According to the United States Pharmacopeia (USP), the safety limit of DEG in glycerine is not more than 0.1%, where quality control must be performed before using glycerine in drug manufacturing [2].
Several analytical methods targeting the quantitation of DEG in glycerine were employed and published. A suitable, widely used technique is Gas Chromatography (GC) [9, 10]. Also, Gas Chromatography-Mass spectrometry (GC-MS) was applied to identify different types of glycols, in addition to DEG, in bait fish, electronic cigarettes, food and pharmaceutical products [11-18]. Thin Layer Chromatography (TLC) has been described as a screening method for non-compliance for DEG and EG in pharmaceutical products [9, 19]. Liquid chromatography was applied to determine 0.1% EG and DEG in dilute sorbitol solutions [22]. Also, the simultaneous determination of DEG and propylene glycol by High Performance Liquid Chromatography (HPLC) and Ultra Violate (UV) and fluorescence detection after pre-column derivatization has been successfully applied for the determination of DEG with high sensitivity [23, 24].
In general, the various chromatographic methods are costly, laborious and time-consuming. They may require pre-preparation steps, such as derivatization and preconcentration, and do consume organic solvents and generate chemical waste. Although infrared spectroscopic methods are less sensitive than the chromatographic ones, they are simple, less expensive and rapid, and present, thus, an appealing screening method for contamination with DEG. Indeed, mid-IR (MIR) and near-IR (NIR) spectroscopy were successfully applied to determine DEG in raw glycerine materials in addition to different pharmaceutical products and food supplements [6, 25-31].
It is well known now that chemometric or multi-way data analysis tools, such as PCA, PCR and PLS, can enhance the analytical performance greatly. Spectroscopic techniques (UV-Vis, IR, Raman, Fluorescence …) are very good examples where multivariate methods utilize the full spectra for analysis. Chemometric tools can also be directly connected to instrument software for in situ and rapid analysis for screening and automation applications [32]. In this work, ATR-FTIR spectroscopy in the range 3700-814 cm–1, in addition to several multivariate data analysis algorithms, have been used for the quantification of DEG in raw glycerine. ATR-FTIR spectroscopy coupled with chemometrics offers a non-destructive, reliable and powerful analytical approach with high efficiency and minimal sample preparation.
MATERIALS AND METHODS
Reagents
Glycerine (99.5%) was purchased from Tedia, while DEG (99%) was purchased from Vickerings UK.
Preparation of samples
As it appears in table 1, ten binary mixtures of glycerine and DEG were prepared to have glycerine mass percentages of 100, 99, 96, 94, 92, 90, 85, 80, 75 and 0%. All ratios were prepared in triplicates.
Table 1: The % composition of samples used for calibration of PCA, PCR and PLS models in addition to those used for validating both PCR and PLS models
| % Glycerine | %DEG | No. of samples used for calibrating the PCA model | No. of samples used for calibrating the PCR and PLSa models | No. of samples used for validating the PCR and PLSa models |
| 100 | 0 | 3 | 2 | 1 |
| 99 | 1 | 3 | 1 | 2 |
| 96 | 4 | 3 | 3 | 0 |
| 94 | 6 | 3 | 2 | 1 |
| 92 | 8 | 3 | 0 | 3 |
| 90 | 10 | 3 | 2 | 1 |
| 85 | 15 | 3 | 1 | 2 |
| 80 | 20 | 3 | 0 | 3 |
| 75 | 25 | 3 | 3 | 0 |
| 0 | 100 | 3 | 3 | 0 |
| Total number of samples | 30 | 17 | 13 |
aSelected from PCA calibration samples.
A total of 30 samples (experiments) were created and studied following a modified method of FT-IR measurements mentioned in [6]. The corresponding FTIR spectra for all samples were recorded in the range of 3700 to 815 cm–1. For the application of PCA, the spectra of the 30 samples were used to create a scores calibration model. Selected samples from these combinations (17 samples) were used as a calibration set for both PCR and PLS applications. Out of the same table, 13 samples were used as a validation set for PCR and PLS models. A separate set of 16 samples of known percentages was created and displayed in table 2. This sample group was used as a test set for PCA, PCR and PLS pre-created models.
All studied samples, including the calibration, validation and test samples, were similarly treated and analyzed. All samples were IR scanned in triplicate, and an average spectrum was used for further multivariate analysis.
Table 2: % composition of samples used for testing the PCA, PCR and PLS models (test set)
| % Glycerine | % DEG | No. of samples |
| 100 | 0 | 2 |
| 95 | 5 | 2 |
| 90 | 10 | 2 |
| 92 | 8 | 3 |
| 80 | 10 | 3 |
| 85 | 15 | 2 |
| 70 | 30 | 2 |
| Total No. of samples | 16 |
Instrumentation and data collection
ATR-FTIR spectra were collected on a Bruker Alpha spectrometer with a zinc selenide window and Deuterated Triglyceride Sulfate (DTGS) detector. The FTIR spectra were collected in the range 3700-814 cm-1in triplicate with air as a background; the resolution was 4 cm-1.
Data analysis and software
For data processing and analysis, MATLAB 7.0.4 Math Works, MA, USA and PLS_Toolbox 4.0 Eigenvector Research, Inc., WA, USA were employed.
RESULTS AND DISCUSSION
The FTIR spectra for pure glycerine and DEG were recorded and displayed in fig. 1. As it appears in this figure, strong overlapping between the spectra of both analytes is present. However, careful investigation of these spectra shows characteristic IR bands of glycerine at 1110, 992, 974 and 922 cm–1. On the other hand, diethylene glycol shows characteristic bands at 1085, 887 and 881 cm–1. Successful quantitation of these analytes has been achieved through computing the difference in the intensity of these bands [25].
However, the reported method requires a relatively long time of data analysis. The presented data analysis is quite classical and depends only on a small number of data points in the spectrum. To enhance the sensitivity of the FTIR spectroscopy in the current study, full spectra of pure and combined samples will be analyzed through multivariate algorithms such as PCA, PCR and PLS.
PCA
As can be seen in table 1, 30 samples of glycerine and DEG of different concentrations were studied. The FTIR spectral data of all samples were concatenated in a two-dimensional data matrix (30×1700). Data were auto-scaled and mean-centered prior to PCA analysis. The first ten PCs were tested and evaluated. The first two PCs were selected based on the visual inspection of the resulting models using different combinations of the obtained PCs. Also, there is a high variation in the dataset captured by these two PCs (about 99%). Fig. 2 represents the best-created PCA scores plot using the first (PC1) and second (PC2) principal components.
In predicting PCA scores plots, samples of identical or very close spectra tend to form independent clusters, and usually, the distance among clusters reflects the differences in the spectral features of the samples constituting these clusters. Fig. 2 clearly shows that pure glycerine and DEG formed two independent clusters far away from each other, reflecting the strength of PCA in distinguishing between the spectra of each substance. Amazingly, the mixtures of glycerine and DEG formed clusters separated from each other based on their concentrations. The positions of the mixtures-corresponding clusters were located closer to glycerine than DEG, which is consistent with the concentration profile of these samples where all of them contain a higher ratio of glycerine, and as the concentration of glycerine becomes less, the cluster becomes farther from the pure glycerine cluster and moves toward the pure DEG cluster, and vice versa. Moreover, the separation between the clusters is sensitive to small changes in the amounts of DEG in the mixture; even a concentration of 1% DEG in glycerine can be easily distinguished from pure glycerine. This detection level is in accordance with the results reported in other infrared investigations of adulteration with DEG. For example, Li et al. have demonstrated that portable NIR instruments programmed with a PLS method could be used in the field determination of DEG in propylene glycol-water mixtures at or below the 1% level [30]. Another NIR method based on chemometrics was developed to determine DEG in beer using a portable instrument and reported a detection capability of 106 mg L–1 [31]. It must be emphasized at this point that although infrared methods are less sensitive than the GC methods (10 mg L–1 for DEG in beer by GC-MS [17], 1 g/ml for DEG in paediatric syrups by GC-MS/MS [18] and 0.1% for DEG in glycerin and propylene glycol by high-performance thin-layer chromatography [21]), infrared methods represent simple and rapid methods that can be applied for the inexpensive screening of a large number of glycerine samples on-site in a short time.
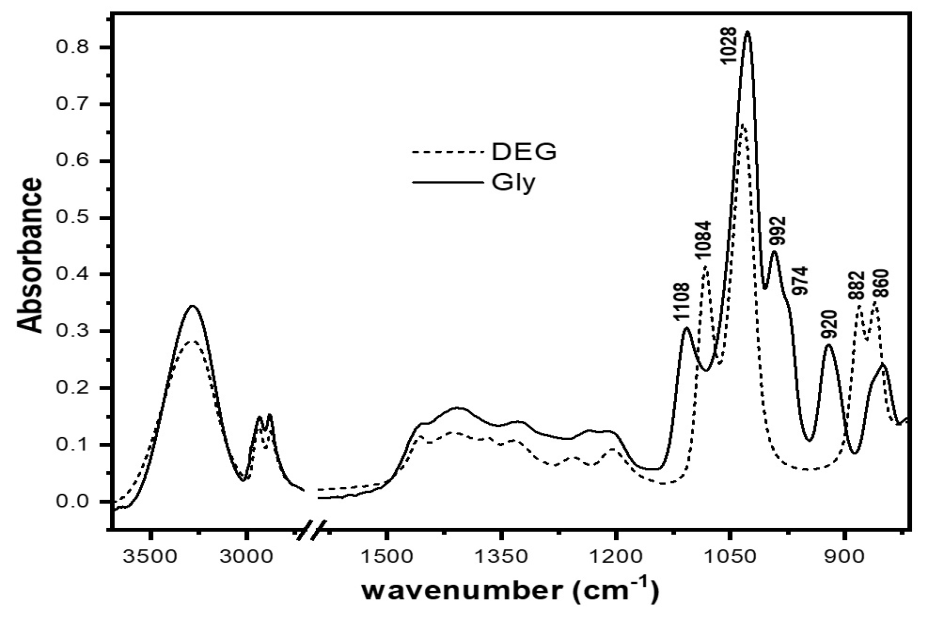
Fig. 1: The FTIR spectra for glycerine and pure DEG
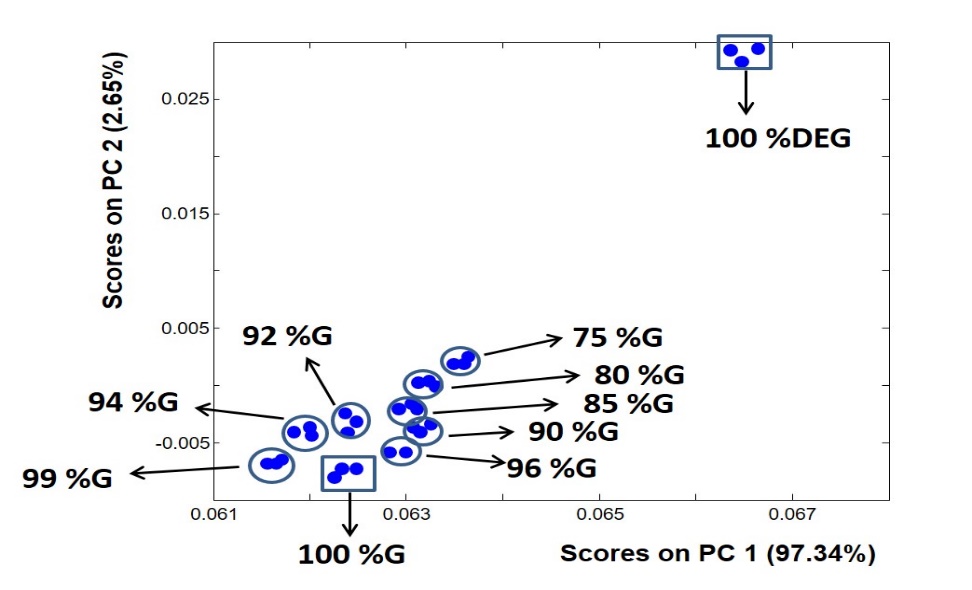
Fig. 2: The PCA scores plot applied to the FTIR spectral data of pure glycerine, pure DEG, and different mixtures of the two substances
It is, therefore, clear that distinguishing between pure glycerine and pure DEG can be easily achieved using mid-FTIR spectroscopy and PCA, and since PCA analysis can be automated, this can compensate for the need for FTIR experts, which reduces the cost and time of analysis. However, despite the relative success of PCA in uncovering the adulteration of glycerine with a very small ratio of DEG (1%), the clusters in the resulting PCA model were located very close to each other. This highly reduces the confidence limits upon quantitative analysis of such samples. It also becomes very difficult when the PCA plot is used as a calibration model to quantify DEG in glycerine samples. Table 2 shows a new set of mixtures of both substances that were prepared and used for testing the analysis methods employed in this work, including the PCA method. Upon applying the test dataset from table 2 to the PCA scores model (fig. 2), the resulting plot (not shown) was very crowded and difficult to follow and make sharp concentration predictions. Therefore, although the PCA model could tell whether the tested sample is pure glycerine or contaminated with even very small amounts of DEG, it has a limited prediction power of the mixing ratio. PCA is thus a pattern recognition algorithm that may provide only a semi-quantitative analysis. Therefore, other algorithms that are more directed at quantitative prediction analysis, such as PCR and PLS, were used.
PCR and PLS
For the application of the PCR and PLS calibration models, a set of 17 binary mixtures of glycerine and DEG were prepared (table 1). The concentration set and absorption data were considered as y-block (17×2) and x-block (17×1700) to construct the calibration models of PCR and PLS. The data were auto-scaled prior to the construction of the calibration PCR and PLS models. The models were cross-validated through the leave-one-out procedure. The Root mean Square Error of Calibration (RMSEC) values for the first 10 components was calculated to determine the best number of components for each model (fig. 3). The best number of components was selected in such a way that additional components don’t count unless they enhance the RMSEC value by 2% at least. The resulting models were visually investigated as well.
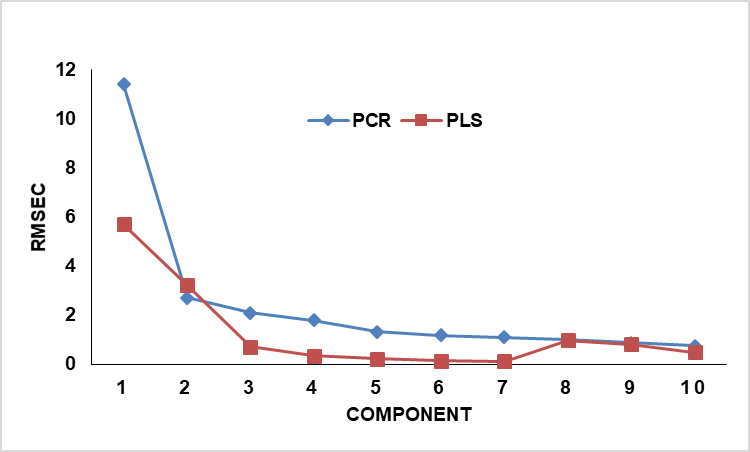
Fig. 3: RMSEC values for the PCR and PLS calibration models
As shown in fig. 3, only three components in the case of the PLS model and two components in the case of the PCR model enhanced the RMSE by 2%. Hence, three components were used in the case of the PLS model, while two components were employed for the PCR model. The actual-versus-predicted concentrations for both components were performed, and the corresponding slope and R2 values of the linear equations are presented in table 3. The closeness of R2 values to 1 reflects the good linearity of the obtained equations.
Table 3: Results of PCR and PLS for calibrations and prediction steps
| Step | PCR | PLS | |
| Calibration | Glycerine | DEG | |
| Slope | 1.0 | 0.99 | |
| R2 | 0.998 | 0.999 | |
| Prediction | Slope | 0.96 | 0.96 |
| R2 | 0.998 | 0.999 |
Again, the test samples in table 2 were used to test the prediction ability of the PCR and PLS models. Therefore, the corresponding FTIR data of the 16 test samples were concatenated in an independent two-dimensional data set (16×1700). The results of PCR and PLS models to the test data were summarized in table 4. As it appears in this table, the percent recovery values of glycerine and DEG using the PCR and PLS models and the relatively low corresponding Relative Standard Deviation (RSD) values reflect the very good concentration prediction ability of the proposed models.
Table 4: Glycerine and DEG recovery% values using the PCR and PLS models
| Actual sample composition % | Recovery %c | ||||
| PCR | PLS | ||||
| Glycerin | DEG | Glycerine | DEG | Glycerine | DEG |
| 100 | 0 | 98.11±0.12 | NAa | 101.52±0.12 | NAb |
| 99 | 1 | 98.13±0.13 | 111.47±5.3 | 101.51±0.09 | 110.01±3.5 |
| 94 | 6 | 98.24±0.11 | 98.58±5.7 | 101.43±0.15 | 102.50±3.1 |
| 92 | 8 | 98.29±0.22 | 97.93±6.1 | 101.39±0.15 | 102.13±3.1 |
| 90 | 10 | 98.34±0.20 | 97.55±5.6 | 101.36±0.11 | 10.90±3.0 |
| 85 | 15 | 98.48±0.18 | 97.03±5.6 | 101.26±0.15 | 101.60±3.4 |
| 80 | 20 | 98.32±0.17 | 96.77±5.8 | 101.15±0.14 | 101.45±3.3 |
| Mean | 98.32±0.19 | 99.89±5.7 | 101.37±0.13 | 103.26±3.2 | |
| RSD | 0.19 | 5.7 | 0.13 | 3.2 | |
aRecovery value was 0.15; recovery % was not calculated, bRecovery value was 0.09; recovery % was not calculated, cmean recovery ±RSD
CONCLUSION
This work aimed to determine the amount of DEG in glycerine raw material. The FTIR spectra for DEG and glycerine exhibit clear overlapping, which makes the DEG determination of raw glycerine difficult. Multivariate analysis tools, including PCA, PCR and PLS, were employed for analyzing the spectral data of a number of binary mixtures of the two components in different composition ratios. Distinguishing pure samples of both analytes was achieved successfully upon using the PCA for data analysis, identifying adulterated glycerine samples semi-quantitatively with even 1% of DEG was also possible. However, determining the exact amount of DEG in a glycerine raw sample with an acceptable confidence level was difficult due to the limited ability of PCA for quantitative prediction. On the other hand, the results on FTIR spectral data sets of DEG and glycerine mixtures show that the ability of the PCR and PLS models for concentration prediction was very satisfactory. Therefore, FTIR spectroscopy coupled with PCA, PCR and PLS holds great potential to detect the adulteration of glycerine with DEG. The studied method can be automated, thus allowing a nondestructive, rapid, simple and inexpensive screening of a large number of glycerine samples on-site in a short time. Future work involves expanding the study to other chemical substances, such as Polyethylene Glycol (PEG) and sorbitol that are also subjected to toxic DEG contamination. Classification algorithms such as classification analysis and Partial Least Square-Discriminant Analysis (PLS-DA) could also be employed. Moreover, Artificial Intelligence (AI)-driven models will also be attempted.
FUNDING
This research work was performed without funding
AUTHORS CONTRIBUTIONS
Obeidat’s contribution to the current manuscript involves the experimental design, data analysis and writing the manuscript.
Hammoudeh’s contribution involves conceptualization, data collection and manuscript writing.
CONFLICT OF INTERESTS
There is no conflict of interest of any type to declare
REFERENCES
Alfred S, Coleman P, Harris D, Wigmore T, Stachowski E, Graudins A. Delayed neurologic sequelae resulting from epidemic diethylene glycol poisoning. Clin Toxicol (Phila). 2005;43(3):155-9. doi: 10.1081/CLT-57875, PMID 15902788.
Testing of glycerin, propylene glycol, maltitol solution, hydrogenated starch hydrolysate, sorbitol solution, and other high-risk drug components for diethylene glycol and ethylene glycol, guidance for industry. United States Department of Health and Human Services, Food and Drug Administration, Center for Drug Evaluation and Research (CDER); 2023.
WHO. WHO urges action to protect children from contaminated medicines, World Health Organization; 2023. Available from: https://www.who.int/news/item/23-01-2023-who-urges-action-to-protect-children-from-contaminated-medicines. [Last accessed on 01 Nov 2024].
Schep LJ, Slaughter RJ, Temple WA, Beasley DM. Diethylene glycol poisoning. Clin Toxicol (Phila). 2009;47(6):525-35. doi: 10.1080/15563650903086444, PMID 19586352.
Blecher L, Mercill A. Progress in pharmaceutical excipients. Pharm Technol. 1998;22:50-4.
Ahmed MK, McLeod MP, Nezivar J, Giuliani AW. Fourier transform infrared and near-infrared spectroscopic methods for the detection of toxic diethylene glycol (DEG) contaminant in glycerin based cough syrup. Spectroscopy. 2010;24(6):601-8. doi: 10.1155/2010/608749.
Barr DB, Barr JR, Weerasekera G, Wamsley J, Kalb SR, Sjodin A. Identification and quantification of diethylene glycol in pharmaceuticals implicated in poisoning epidemics: an historical laboratory perspective. J Anal Toxicol. 2007;31(6):295-303. doi: 10.1093/jat/31.6.295, PMID 17725874.
Ferrari LA, Giannuzzi L. Clinical parameters, postmortem analysis and estimation of lethal dose in victims of a massive intoxication with diethylene glycol. Forensic Sci Int. 2005;153(1):45-51. doi: 10.1016/j.forsciint.2005.04.038, PMID 15979833.
WHO. Working. Tests for diethylene glycol and ethylene glycol liq prep for oral use; 2023.
Holloway G, Maheswaran R, Leeks A, Bradby S, Wahab S. Screening method for ethylene glycol and diethylene glycol in glycerin-containing products. J Pharm Biomed Anal. 2010;51(3):507-11. doi: 10.1016/j.jpba.2009.08.025, PMID 19782491.
Matusik JE, Eilers PP, Waldron EM, Conrad SM, Sphon JA. Confirmation of identities of propylene and ethylene glycols in anchovies by tandem mass spectrometry. J AOAC Int. 1993;76(6):1344-7. doi: 10.1093/jaoac/76.6.1344, PMID 8286973.
Maurer H, Kessler C. Identification and quantification of ethylene glycol and diethylene glycol in plasma using gas chromatography-mass spectrometry. Arch Toxicol. 1988;62(1):66-9. doi: 10.1007/BF00316260, PMID 3190459.
Varlet V, Farsalinos K, Augsburger M, Thomas A, Etter JF. Toxicity assessment of refill liquids for electronic cigarettes. Int J Environ Res Public Health. 2015;12(5):4796-815. doi: 10.3390/ijerph120504796, PMID 25941845.
Castle L, Cloke HR, Startin JR, Gilbert J. Gas chromatographic determination of monoethylene glycol and diethylene glycol in chocolate packaged in regenerated cellulose film. J Assoc Off Anal Chem. 1988;71(3):499-502. doi: 10.1093/jaoac/71.3.499, PMID 3391947.
Brooks JB, Basta MT, Alley CC, Holler JS, El Kholy AM. Identification of diethylene glycol in sera from Egyptian children by frequency-pulsed electron-capture gas-liquid chromatography. J Chromatogr. 1984;309(2):269-77. doi: 10.1016/0378-4347(84)80034-1, PMID 6480778.
Baffi P, Elneser S, Baffi M, De Melin M, Baffi P, Elneser S. Quantitative determination of diethylene glycol contamination in pharmaceutical products. J AOAC Int. 2000;83(4):793-801. doi: 10.1093/jaoac/83.4.793, PMID 10995105.
Caldeira LR, Madureira FD, Maia TF, Muller CV, Fernandes C. Simultaneous quantification of ethylene glycol and diethylene glycol in beer by gas chromatography coupled to mass spectrometry. Food Chem. 2021;346:128871. doi: 10.1016/j.foodchem.2020.128871, PMID 33360845.
Monerah AA, Yahya MA, Fahad SA, Norah HA, Sultan KA, Shaikah FA. A selective gas chromatography-tandem mass spectrometry method for quantitation of ethylene and diethylene glycol in paediatric syrups. Heliyon. 2024;10(7):e27559. doi: 10.1016/j.heliyon.2024.e27559.
Kenyon AS, Shi X, Wang Y, Ng WH, Prestridge R, Sharp K. Simple, at-site detection of diethylene glycol/ethylene glycol contamination of glycerin and glycerin-based raw materials by thin-layer chromatography. J AOAC Int. 1998;81(1):44-50. doi: 10.1093/jaoac/81.1.44, PMID 9477561.
John AMM. Determination of toxic diethylene glycol in toothpastes in dares salaam by high-performance thin layer chromatography and colorimetric methods, Tanz. J Sci. 2018;44(2):117-27.
Ghanem MP. Detection of diethylene glycol in glycerin and propylene glycol by using high performance thin layer chromatography HPTLC. IOSRPHR. 2011;1(1):29-34. doi: 10.9790/3013-01102934.
DIONEX, Application Note 246. Determination of ethylene glycol and diethylene glycol in a sorbitol solution; 2016. Thermofisher. Available from: https://assets.com/TFS-assets/CMD/application-notes/AN-246-IC-ethylene-diethylene-glycol-sorbitol-LPN2505-EN.pdf. [Last accessed on 30 Jan 2025].
Zhou T, Zhang H, Duan G. Simultaneous determination of diethylene glycol and propylene glycol in pharmaceutical products by HPLC after precolumn derivatization with p-toluenesulfonyl isocyanate. J Sep Sci. 2007;30(16):2620-7. doi: 10.1002/jssc.200700097, PMID 17880028.
Wu J, Yuan J, Liu Q, Tang F, Ding L, Tan J. New derivatizing reagent for analysis of diethylene glycol by HPLC with fluorescence detection. J Sep Sci. 2008;31(22):3857-63. doi: 10.1002/jssc.200800433, PMID 19065617.
Obeidat SM, Hammoudeh AY, Mahmoud A. Identification and quantification of diethylene glycol contamination in glycerine raw material. Spectrosc Lett. 2019;52(1):60-5. doi: 10.1080/00387010.2018.1556220.
Hammoudeh AY, Obeidat SM, Abboushi EKh, Mahmoud AM. FT-IR spectroscopy for the detection of diethylene glycol (DEG) contaminant in glycerin-based pharmaceutical products and food supplements. Acta Chim Slov. 2020;67(2):530-6. doi: 10.17344/acsi.2019.5553, PMID 33855552.
Prayoga A, Windarsih A, Apriyana W, Riswanto FD, Istyastono EP. Authentication of grape seed face oil using FTIR spectroscopy combined with chemometrics techniques. Int J App Pharm. 2024;16(5):220-4. doi: 10.22159/ijap.2024v16i5.51525.
Pravallika Burela VS, Nammi UR, Mandalemula P. New diffuse reflectance infrared Fourier transform spectroscopy for the estimation of tramadol hydrochloride capsules. Int J Pharm Pharm Sci. 2023;15(1):22-6. doi: 10.22159/ijpps.2023v15i1.46464.
Ahda M, Safitri A. Development of lard detection in crude palm oil (CPO) using FTIR combined with chemometrics analysis. Int J Pharm Pharm Sci. 2016;8(12):307-9. doi: 10.22159/ijpps.2016v8i12.14743.
Li X, Arzhantsev S, Kauffman JF, Spencer JA. Detection of diethylene glycol adulteration in propylene glycol-Method validation through a multi-instrument collaborative study. J Pharm Biomed Anal. 2011;54(5):1001-6. doi: 10.1016/j.jpba.2010.11.042, PMID 21177057.
Fulgencio AC, Resende GA, Teixeira MC, Botelho BG, Sena MM. Screening method for the rapid detection of diethylene glycol in beer based on chemometrics and portable near-infrared spectroscopy. Food Chem. 2022;391:133258. doi: 10.1016/j.foodchem.2022.133258, PMID 35640334.
Bystrzanowska M, Tobiszewski M. Chemometrics for selection, prediction, and classification of sustainable solutions for green chemistry-a review. Symmetry. 2020;12(12):2055. doi: 10.3390/sym12122055.