
Int J App Pharm, Vol 17, Issue 2, 2025, 402-414Original Article
QBD APPROACH FOR THE DEVELOPMENT OF NANOSPONGE LOADED TOPICAL GEL OF FUCOIDAN FOR THE TREATMENT OF RHEUMATOID ARTHRITIS: IN VITRO, EX-VIVO, AND IN VIVO ASSESSMENT
VAISHNAVI C. E.1, AJITHA AZHAKESAN1*, NARENDRA PENTU2
1Department of Pharmaceutical Chemistry, Sri Ramachandra Faculty of Pharmacy, Sri Ramachandra Institute of Higher Education and Research (Deemed to be University), No.1 Ramachandra Nagar, Porur, Chennai-600116, India. 2Department of Pharmaceutics, CMR College of Pharmacy, Kandlakoya (V), Medchal Road, Hyderabad-501401, India
*Corresponding author: Ajitha Azhakesan; *Email: ajithaazhakesan27@gmail.com
Received: 18 Aug 2024, Revised and Accepted: 15 Jan 2025
ABSTRACT
Objective: This contemporary research reports the fabrication, optimization, and evaluation of Fucoidan (FDN)-loaded Nanosponges (NS) based gel for the treatment of rheumatoid arthritis.
Methods: Risk assessment was performed, followed by screening and optimization of NS formulation by 32 factorial design using Design-Expert® software. FDN-loaded NS prepared by emulsion solvent evaporation technique was subjected to different solid and liquid state characterizations and subsequently loaded in carbopol gel. The effects of pro-inflammatory cytokines (IL-1 and TNFα) were evaluated using macrophage cells.
Results: The physical and chemical characteristics exhibited by the prepared NS and gels (F1-F9) were found to be optimal. The optimization resulted in achieving formulation NS1 with 72.6% in vitro drug release and 8457cp viscosity and followed the Higuchi-matrix model. Histopathology studies revealed that prepared nanogel has promising anti-arthritic activity. The skin permeation studies showed that the optimized gel formulation was successful in stopping the drug from permeation through the skin. Moreover, the nanogel has depicted sustained drug release till 24 h.
Conclusion: Hence, the NS-based the delivery system developed and assessed in the current research approach seemed to be auspicious concerning preventing rheumatoid arthritis along with practical utilization in the pharmaceutical field.
Keywords: Nanosponge, Fucoidan, Quality based design, Rheumatoid arthritis
© 2025 The Authors. Published by Innovare Academic Sciences Pvt Ltd. This is an open access article under the CC BY license (https://creativecommons.org/licenses/by/4.0/)
DOI: https://dx.doi.org/10.22159/ijap.2025v17i2.52746 Journal homepage: https://innovareacademics.in/journals/index.php/ijap
INTRODUCTION
Targeted Drug Delivery systems (TDDS) enhance the therapeutic effectiveness of drugs with targeted, and sustained delivery with simpler drug-administration procedures [1]. Incorporation of drug into nanocarrier is one of the efficient methods for targeted and sustained delivery of drug. Among the various TDDS, NS play a vital role in drug targeting and hence provide a controlled drug release pattern with targeted drug delivery [2, 3]. Characterized by their mesh-like structures, NSs possess the ability to encapsulate a wide range of substances and medication molecules [4-7]. Recent advances in nanotechnology paved path for design of nanogels with many potential applications in the field of nanomedicine [8]. Rheumatoid arthritis, a chronic inflammatory disease has increased universally over the past 30 years and is expected to reach 1.5 million within 15 years. By 2050, globally 31.7 million people are anticipated to live with rheumatoid arthritis. It involves infiltration of CD4+T cells and macrophages resulting in swelling, inflammation, tenderness, heating and stiffness of joints. Early diagnosis and its treatment with non-steroidal anti-inflammatory drugs are the main course of treatment, whereas if untreated in later stages leads to disability and loss of muscle strength [9, 10]. Considering the therapeutic importance of FDN, a class of multifunctional polysaccharides derived from marine organisms, responsible for selective inhibition of the cyclooxygenase-2 enzyme (anti-inflammatory effect) was selected for the proposed research. Also it is an effective antioxidant, anti-cancer, anti-inflammatory, anticoagulant, and antimicrobial [11-13]. The chemical structure of FDN is given in fig. 1.
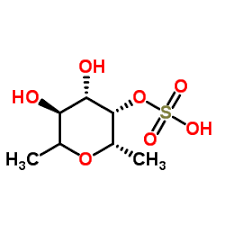
Fig. 1: Structure of fucoidan
The formulation of FDN powder in oral tablet dosage form has some challenges based on its physicochemical properties. Topical drug delivery through NS-loaded gel offers unique advantages such as nanometric size with a 3-dimensional network, porosity, programmable release, encapsulation of hydrophilic and lipophilic drugs, target ability, and greater patient compliance, minimized dosing frequency and lesser side effects [14]. NS loaded gels combines the advantages of achieving optimum concentration of drug at site of action and reduction in systemic side effects approach [15-17]. Literature review reveals no study about the Quality based Design (QbD) approach for the development of NS loaded topical gel of FDN for rheumatoid arthritis treatment. QbD uses various scientific strategies, tools, and nanoparticulate data to design and develop formulations integrating a risk-based approach. Hence, this research aimed to formulate a QbD NS based topical gel incorporating FDN, which exerted beneficial effects in Rheumatoid Arthritis (inhibits the IL-1β phosphorylation p38, NF-kβ activation).
MATERIALS AND METHODS
Chemical and solvents
Pure FDN was procured from Yucca Enterprises (Mumbai). Ethylcellulose, Polyvinyl alcohol (PVA, Molecular Weight – 85,000 – 124,000), Triethanolamine, Dichloromethane and Carbopol 934 were purchased from Sigma Aldrich, Germany. Analytical-grade chemicals and reagents were used for the current research. Demineralized Milli-Q water was used for the study.
Analysis of FDN
Analysis of FDN was performed by UV-visible spectrophotometry (Jasco Model: V-650), a cost effective, versatile and non-destructive technique. Weighed 100 mg of FDN in a 100 ml volumetric flask and made up the volume with pH 7.4 Phosphate Buffered Saline (PBS, 1 mg/ml). Further, serial dilutions in the range of 5-25 µg/ml with PBS was performed and the solution was observed in the UV range of 200-400 nm. The lambda max was optimized and the calibration graph was plotted against Concentration Vs Absorbance.
Development of FDN loaded NS
NS of FDN were prepared by Emulsion solvent evaporation technique [18]. Accurately weighed quantity (100 mg) of FDN was dissolved in dichloromethane by sonication for 10 min (Ultrasonic Bath sonicator). Different formulations (FNS1–FNS9) were prepared by varying the concentrations of ethyl cellulose (organic phase) and poly vinyl alcohol (aqueous phase). Organic phase was added persistently i. e. drop wise into the aqueous phase with incessant stirring in a mechanical stirrer at 1600 rpm for 90 min (RQ-121/D, Remi Instrument Pvt. Ltd., Mumbai, India). NS formed were filtered and dried in oven at 40 °C. Further stored in a glass stoppered amber-colored vials for further characterization [19]. The optimization of the formulation were done by design of experiment (DOE) using Design Expert® (10.0.0.1) software.
Design of experiments
DOE using Design Expert® (10.0.0.1) software was used for the optimization of statistical design of NS formulation. DOE gives information not only about the critical values required to achieve the desired response but also the possible interactions of the selected critical material attributes (CMA) on the critical quality attributes (CQA). A design with four centered points and 4 points for lack of fit was used to obtain a robust model. Dependent variables (CMA) such as the amount of ethyl cellulose (X1) and % PVA (X2) were used at low, medium and high levels as shown in (table 1).
Table 1: Levels of independable variables
| Independable variables | Levels of variables | |||
| Units | Low (-1) | Medium (0) | High (+1) | |
| Ethyl cellulose | mg | 100 | 150 | 200 |
| Polyvinyl alcohol | % | 1 | 1.5 | 2 |
This design has provided 09 runs to study the effect of dependent variables (CMA) on three independent variables (CQA) namely particle size (Y1) and % entrapment efficiency (EE, Y2) and Drug release studies (Y3). Critical Process parameters (CPP) such as amount of FDN, volume of organic phase (15 ml), stirring speed (1600 rpm) and stirring time (90 min) were kept constant throughout the optimization process (table 2).
Table 2: Formulation of FDN-loaded nanosponges (NS1 – NS9)
| Batch code | Ethyl cellulose (mg) | X1 | Polyvinyl alcohol (%) | X2 | Drug (mg) | DCM (ml) |
| NS1 | 100 | -1 | 1 | -1 | 100 | 15 |
| NS2 | 100 | -1 | 2 | 0 | 100 | 15 |
| NS3 | 100 | -1 | 3 | +1 | 100 | 15 |
| NS4 | 150 | 0 | 1 | -1 | 100 | 15 |
| NS5 | 150 | 0 | 2 | 0 | 100 | 15 |
| NS6 | 150 | 0 | 3 | +1 | 100 | 15 |
| NS7 | 200 | +1 | 1 | -1 | 100 | 15 |
| NS8 | 200 | +1 | 2 | 0 | 100 | 15 |
| NS9 | 200 | +1 | 3 | +1 | 100 | 15 |
The Ishikawa plot as represented in fig. 2 elaborates on the various risk factors, conditions required, along with CQA in the development process.
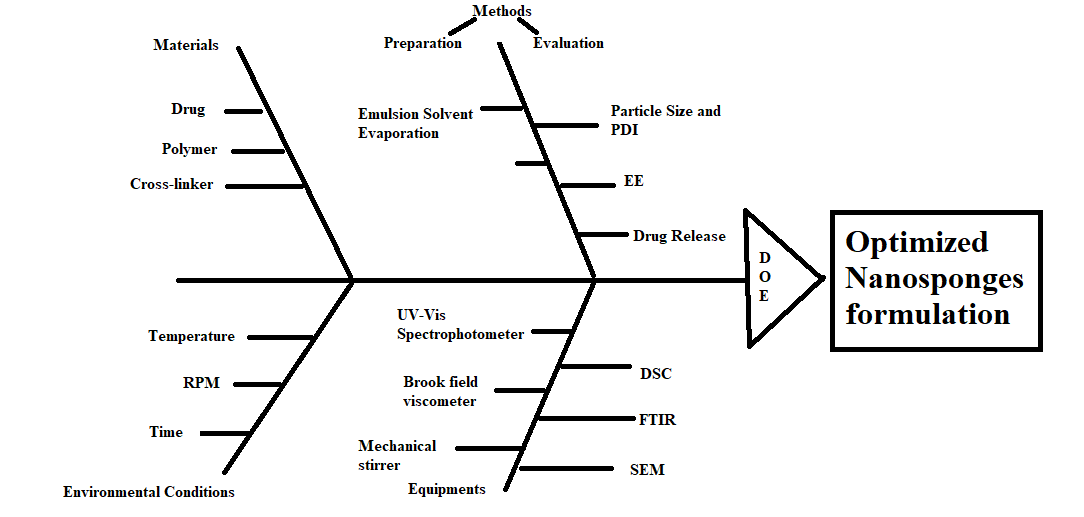
Fig. 2: Fishbone diagram illustrating the formulation parameters for the optimization of the nanosponges
Optimized formulation incorporation in to gel
The evaluation parameters of NS along with DOE results revealed FNS1 as the best formulation. FNS1 (Optimized formulation) was incorporated into Carbopol 934 (1% w/v) gelling agent with a suitable ratio of propylene glycol; continuous stirring was performed to avoid the formation of aggregates/lumps. Methyl paraben was added as a preservative, pH of the gel was adjusted by using triethanolamine. Gel was kept aside overnight for complete hydration. Gel characterization was done for the particle size, Polydispersity index (PDI), % EE and Drug release studies.
Particle size
Particle size and (PDI) was measured by using Zeta Analyzer (Make: Malvern; Model: Nano ZS-NIPER, Hyderabad). The sample under investigation was diluted with deionized water (1:9 % v/v) and filled in disposable polystyrene cuvette to analyze particle size and PDI [20]. The same procedure was followed for the measurement of zeta potential (ZP) using a zeta sizer (Nano ZS, Malvern Instruments, Worcestershire, UK).
PDI
PDI values are carried out by using the SPAN index, in which the particles of FNS1 align itself into various size ranges d90, d50, d10. % cumulative frequency of undersized particles was calculated and a graph was plotted between % cumulative frequency Vs mean particle size to find the diameter at 90% undersized, 50% undersized and 10% undersized particles.
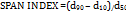
d90 = Diameter of the particles at 90% of cumulative frequency of undersized
d50= Diameter of the particles at 50% of cumulative frequency of undersized
d10 = Diameter of the particles at 10% of cumulative frequency of undersized
Determination of EE
EE was determined by collecting the filtrate from the dispersion (soaked in PBS for 48 h) after ultracentrifugation (1600 rpm) for 90 min at a temperature of4 C (CM-12 Plus model by REMI). The Supernatant was collected, washed with distilled water (n = 5), filtered, diluted and analyzed spectrophotometrically at 202 nm. The % EE and % Drug Loading (DL) of the FDN-loaded NS were calculated as mentioned below [21].
![]()
where,
Total amount of FDN added is the total amount of incorporated FDN and
FDN amount in supernatant is the amount of free FDN in the supernatant layer
In vitro drug release study
In vitro release study was carried out using dialysis sac method (HI Media-Dialysis membrane 135, Mol. cut off 12 000-14 000 Da, Mumbai, India). An accurately weighed quantity of FNS1 formulation equivalent to 100 mg of FDN was dispersed in 5 ml of PBS (Phosphate buffer saline) and introduced into the dialysis sac. The sac was hanged in a glass beaker containing 100 ml of PBS. The receptor compartment was stirred continuously at 37±0.5 °C on a magnetic stirrer. Aliquots from receptor medium was withdrawn at predefined time intervals up to 24 h and replenishing each time with same volume of buffer. The samples were measured spectrophotometrically at 202 nm.
Evaluation of optimized NS
Based on the above-mentioned parameters the data is analyzed statistically by the design expert software to finalize the optimized formulation. The optimized formulation (FNS1) was further evaluated for the following studies.
Fourier transform infrared spectroscopy (FTIR)
The FTIR spectra of pure FDN, Blank NS and optimized FNS1 were recorded in the region of 4000-400 cm-1 (FTIR Spectrophotometer, Jasco-Japan). The transparent pellets of these samples were prepared by pressed pellet technique (potassium bromide) and the recorded spectra were interpreted for the possible chemical interactions.
Differential scanning calorimetry (DSC)
DSC curves, called as Thermograms are plotted by incremental change in temperature. The difference in temperature may be due to the change in their melting point, % weight change, vaporization temperature and enthalpy. Interaction of the pure drug with the excipients might cause a shift in the thermogram due to the change in the physiochemical properties. Thermal analysis of FDN, Blank NS and the optimized formulation was performed by a Differential Scanning Calorimeter-DSC2A-02306. The samples (5 mg) were enclosed in aluminium pan and heated at a rate of 33-265 °C for Blank NS, gradually increased to 33-300 °C for FDN and FNS1 in atmospheric nitrogen (50 ml/min flow rate) at a stable increment rate of 10 °C/min.
Scanning electron microscopy (SEM)
SEM images of the NS was taken by scanning electron microscope. The samples were spread over a slide and dried under a high vacuum (1.2 nm). Vesicle morphology was examined by Field Emission SEM (Make: FEI; Model: Quanta 250 FEG-NIPER, Hyderabad) at a magnification of 30 X-300 kX with a resolution of 30 kV. Vesicle morphology of the samples was visualized at 10 kV [22].
Characterization of NS gel formulation
Optimized NS1 formulation was selected based on the physicochemical evaluation parameters assisted by statistical analysis of DOE. The Optimized NS1 was incorporated into polymeric gel and further it is evaluated for the following parameters [23-25].
Homogeneity
The prepared NS were evaluated for the Homogeneity under clear light and observed for any aggregates/lump’s formation.
Viscosity
Viscosity of the developed NS based gel was measured by Brookfield viscometer with spindle #63 at 25±0.5 °C.
pH
pH of FDN loaded NS1 based topical gel was measured by calibrated pH meter at 25±0.5 °C. The electrode was dipped into the gel and equilibrated; then the pH was measured in triplicate.
Transparency
Prepared gel formulation with FNS1 was checked under focused light of clarity test apparatus for presence of any particles in the gel formulation.
Spreadability
100 mg of nanogel was placed on the glass plate and allowed a glass slide to fall over the plate from a distance of 5 cm. Spreadability was determined using the equation:

Where S is the Spreadability, M is the weight tied to the upper side, l is the length of the glass slide and T is the time taken to separate the slide from each other.
Drug content
Weighed 1 g of nanogel and dissolved in 50 ml methanol for the period of 2 h on mechanical shaker in order to get absolute solubility of drug. The solution was filtered and suitable dilution was performed and estimated spectrophotometrically at 202.0 nm.
Ex vivo skin permeation studies
Rat skin membrane was collected from CMR College of Pharmacy after getting approval from the IAEC committee (CPCSEA/1657/IAEC/COL-23/130). Hairs of skin were removed using a razor. Wistar rat’s skin were excised, washed with isopropyl alcohol and mounted on a Franz diffusion cell with the stratum corneum facing the donor compartment and the dermis side facing the receptor. Phosphate buffer pH 7.4 was used as the receptor diffusion media at 37±1 °C with constant aeration. An essential amount of optimized gel formulation was placed on the skin surface in the donor compartment. The cell contents were stirred at 100 rpm by magnetic stirrer (Remi magnetic stirrer, Mumbai) and were maintained at a temperature of 37±1 °C by circulating water through an external jacket of the cell. A 5 ml aliquots was withdrawn at regular time intervals of 0, 1, 2, 4, 6, 8, 10, 12 and 24 h to estimate the drug concentration spectrophotometrically at 202 nm. Transdermal flux (J) was calculated by the slope obtained from the plot drawn between cumulative % drug release vs time [26]. Permeability coefficient was obtained by the formula of

Transdermal flux is divided by the concentration of FDN in donor chamber.
Calculation of drug release kinetics
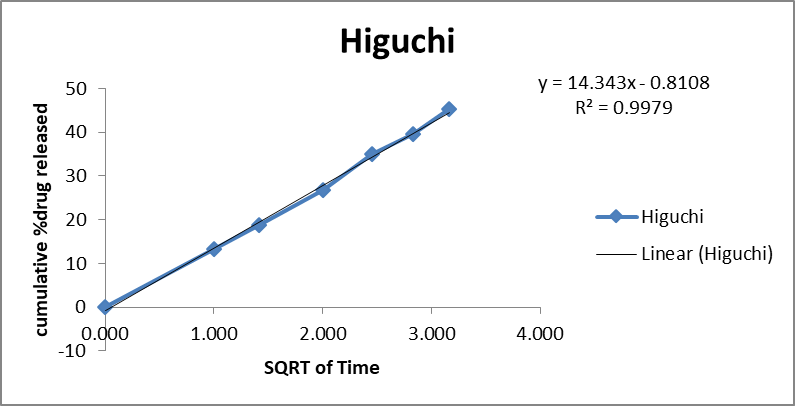
Drug release data was fitted in four kinetic models like zero order (cumulative release % Vs Time), first order (log % drug remaining Vs Time), Higuchi (Cumulative Drug release % Vs Square root of time and korsmeyer-Peppas (Log % drug released Vs Time) kinetic models and regression analysis was performed.
Comparative release studies of FNS1 and plain FDN gel formulation
Ex vivo drug release studies of FNS1 loaded NS gel was compared with the plain FDN, Carbopol 1% gel formulation. All the diffusion study parameters were mimicked in this study except cellophane membrane replaced with the rat skin membrane.
Stability studies
Stability studies as per ICH guidelines were conducted to predict the shelf life of the formulations under stressed environmental conditions (Temperature and relative humidity conditions for 3 mo). The formulation were placed in glass vials and stored at room temperature (25±2 °C/60±5 % RH) and accelerated condition (40±2 °C/75±5 % RH) in a stability chamber (Macro Scientific Work Pvt. Ltd., Delhi, India) for a period of 3 mo. Samples were analyzed for particle size, % EE and in vitro drug release after the stability period [27-29].
RESULTS AND DISCUSSION
Analysis of FDN by UV-visible spectrophotometry
The calibration curve for FDN, determined at a wavelength of 202 nm, demonstrated a notable linear relationship across a concentration range of 5 to 35 μg/ml, as indicated by a high correlation coefficient of 0.999. This strong correlation suggests a robust linear regression model that accurately describes the relationship between concentration and absorbance (table 3). Fig. 3 represents the perfect fit of linear regression model.
Table 3: Calibration results of FDN 7.4 pH solution
| S. No. | Concentration (μg/ml) | Absorbance |
| 1 | 5 | 0.19 |
| 2 | 10 | 0.3 |
| 3 | 15 | 0.41 |
| 4 | 20 | 0.5 |
| 5 | 25 | 0.61 |
| 6 | 30 | 0.7 |
| 7 | 35 | 0.81 |
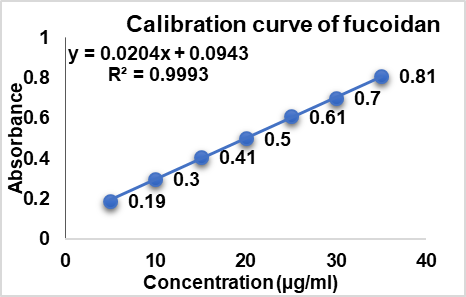
Fig. 3: Calibration curve of FDN
Particle characterizations
The developed FDN formulation showed particle size in the ranges of (171±0.15 to 378±0.25), PDI (0.213±0.01 to 0.567±0.05) and Zeta potential (14.3±0.25 mV to 33.12±0.47 mV). Further, the particle size, ZP and PDI were found to be increased with an increase in EC polymer concentration and vice versa (table 4). NS1 formulation, which resulted in highest homogeneity with low PDI values (0.213±0.01), less particle size distribution (171±0.15 nm) and zeta potential (14.3±0.25 mV) could be optimized as the best formulation.
Table 4: Physicochemical characteristics of FDN-loaded Nanosponges
| Formulation code | EC | PVA | Mean particle size (nm) | PDI | EE (%) | Zeta potential (mV) |
| NS1 | 100 | 1 | 171±0.15 | 0.213±0.01 | 87±0.85 | -14.3±0.25 |
| NS2 | 100 | 1.5 | 201±0.14 | 0.312±0.02 | 77±0.14 | -21.5±0.09 |
| NS3 | 100 | 2 | 271±0.68 | 0.451±0.10 | 71±0.56 | 27.98±0.08 |
| NS4 | 150 | 1 | 181±0.35 | 0.231±0.03 | 83±0.85 | 17.12±0.14 |
| NS5 | 150 | 1.5 | 211±0.21 | 0.321±0.05 | 76±0.47 | 23.45±0.03 |
| NS6 | 150 | 2 | 281±0.58 | 0.371±0.02 | 69±0.98 | 31.58±0.58 |
| NS7 | 200 | 1 | 231±0.17 | 0.411±0.04 | 79±0.68 | 17.99±0.02 |
| NS8 | 200 | 1.5 | 271±0.11 | 0.456±0.08 | 61±0.11 | 24.15±0.01 |
| NS9 | 200 | 2 | 378±0.25 | 0.567±0.05 | 56±0.45 | 33.12±0.47 |
Data are expressed as mean±SD values (n = 3).
EE
EE of developed NS (FNS1-FNS9) was found to be in the range of 87±0.85% to 56±0.45%; the results are given in table 5. From the results it was observed that NS9 showed the lowest % EE (56±0.45%) and % DL (2.17±0.53%), whereas the optimized formulation (NS1) showed the highest % EE (87±0.85%) and % DL (17.69±0.01%). Based on size (171.0±0.15 nm), PDI (0.213±0.01), ZP (−14.3±0.25 mV), % EE (87±0.85%) and % DL (17.69±0.01%), the NS1 was found optimum with content of FDN (100 mg), EC (100 mg) and PVA (1 mg). Fig. 4 represents the effect of EC/PVA on EE of FDN.
Drug release studies
In vitro drug release study was performed to determine the release behaviour and kinetics mechanism of the FDN release from the polymeric matrix in PBS (pH 7.4) diffusion medium. The in vitro cumulative release profiles of NS1-NS9 is shown in fig. 5.
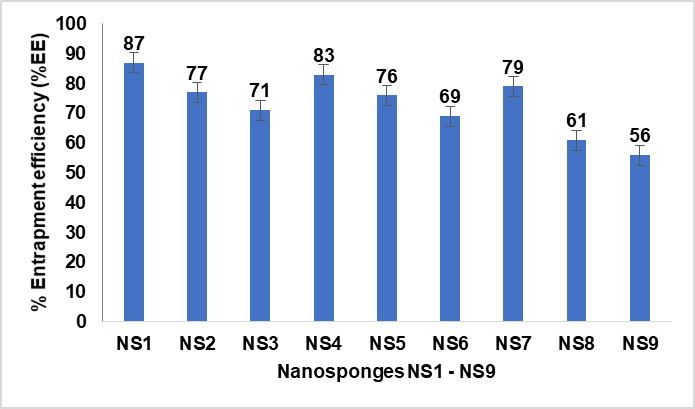
Fig. 4: %EE of different nanosponge formulations (NS1 to NS9) influenced by variations in the EC/PVA ratio. Data are expressed as mean±SD values (n = 3), with error bars indicating standard deviations
Table 5: In vitro cumulative release profiles of nanosponges
| Time (H) | NS1 | NS2 | NS3 | NS4 | NS5 | NS6 | NS7 | NS8 | NS9 |
| 0 | 0 | 0 | 0 | 0 | 0 | 0 | 0 | 0 | 0 |
| 1 | 18.2±0.1 | 16.1±0.2 | 14.5±0.4 | 17.5±0.1 | 15.6±0.4 | 13.2±0.8 | 16.7±0.4 | 12.9±0.1 | 11.4±1.2 |
| 2 | 27.8±1.1 | 21.4±0.4 | 22.5±0.9 | 21.75±0.4 | 18.2±0.8 | 16.7±0.9 | 20.4±0.7 | 23.7±0.2 | 16.9±0.2 |
| 4 | 44.4±0.2 | 41.2±0.5 | 39.7±1.1 | 42.6±0.9 | 39.2±0.6 | 31.7±0.1 | 41.7±0.8 | 37.8±0.5 | 31±0.7 |
| 6 | 45.9±0.1 | 43.1±0.8 | 42.7±0.2 | 46.7±0.8 | 45.7±0.2 | 36.8±0.2 | 44.8±0.3 | 41.2±0.6 | 33.7±1.1 |
| 8 | 51.1±0.9 | 47.8±1.1 | 57.8±1.2 | 50.1±0.3 | 50.7±1.0 | 45.7±0.4 | 50.9±0.8 | 49.7±0.3 | 36.1±1.2 |
| 10 | 60.8±0.8 | 59.8±1.7 | 64.9±1.8 | 61.4±0.7 | 60.2±1.2 | 59.4±0.5 | 62.7±0.9 | 58.4±0.8 | 39.5±0.4 |
| 12 | 66.2±0.7 | 77.1±0.3 | 75.8±0.4 | 79.8±0.2 | 68.7±1.1 | 64.8±0.9 | 71.4±0.1 | 61.9±0.7 | 41.7±0.5 |
| 24 | 89.7±0.1 | 78.1±0.4 | 77±0.9 | 81.2±1.0 | 71±1.3 | 66.8±1.0 | 77.1±0.5 | 64.8±1.1 | 45.1±0.6 |
*Data are expressed as mean±SD values (n = 3).
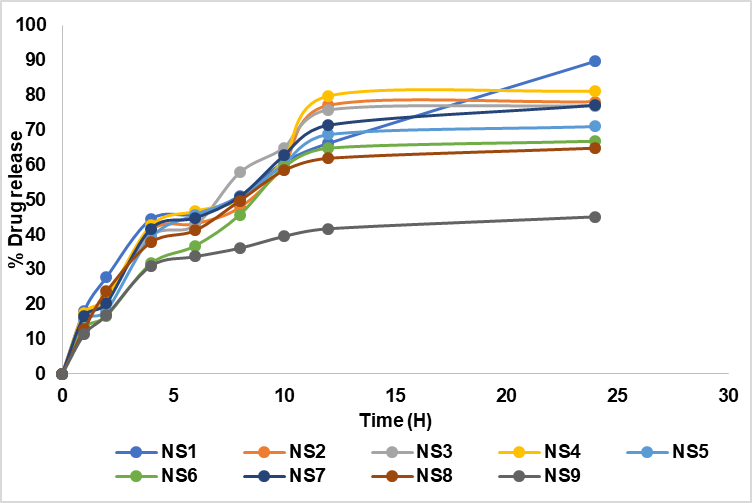
Fig. 5: In vitro cumulative percentage drug release profiles of nanosponges (NS1 to NS9) over 24 h. The graph highlights the drug release behavior of each formulation, with NS1 exhibiting the highest release (89%) at 24 h. Data are represented as mean from a sample size of three (n = 3), ensuring reproducibility and accuracy
As shown in fig. 5 the release of FDN was gradual initially and was rapid within the next twelve-hour period. Over the time interval (0 to 24 h) NS1 showed a high drug release of 89.7±0.1%.
Statistical analysis of the data and optimization of the NS formulation
Effect of variables on particle size (Y1), PDI (Y2), % EE (Y3), drug release (Y4)
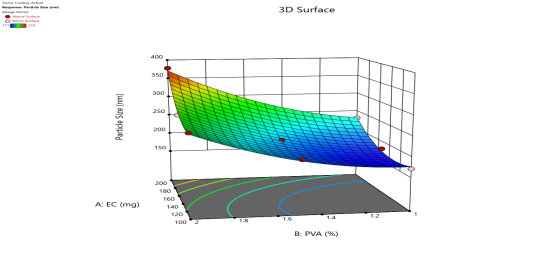
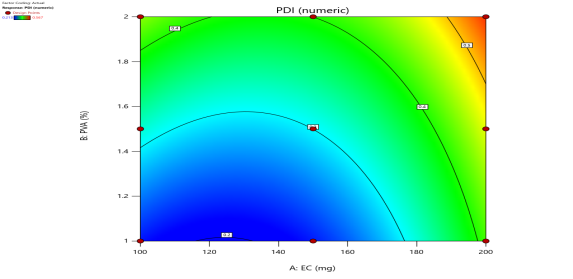
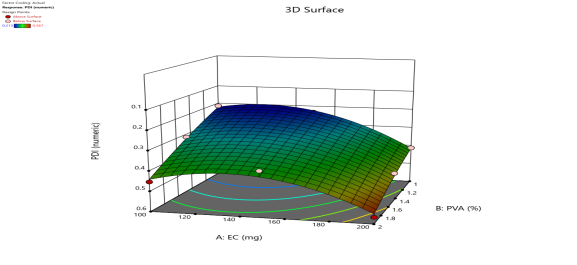
The particle size (Y1), PDI (Y2), % EE (Y3), Drug release (Y4) for all the nine runs were in the broad range of 171±0.15 to 378±0.25, 0.213±0.01 to 0.567±0.05, 87±0.85 to 56±0.45, and 89.7±0.1 to 45.1±0.6, respectively. The study results show that the X1 (polymer) and X2 (surfactant) ratios have a positive impact on the response Y1 and Y2 and negative impact on Y3 and Y4. It means the increased polymer-surfactant ratio results in an increase in Particle Size and PDI. Equation (1a and 1b) represents the positive influence of X1 and X2 ratio on response Y1 and Y2.
 Equation (1a)
 Equation (1b)
 Equation (1c)
 Equation (1d)
where, Y1 is the particle size and X1, X2, are the polymer: surfactant ratios respectively.
| Particle Size (Y1) | 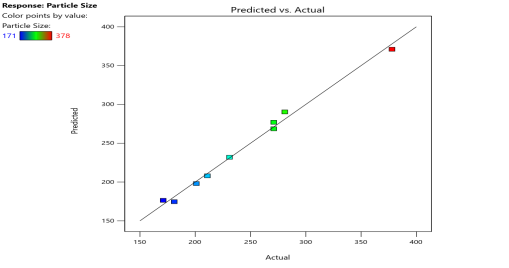 |
 |
 |
| PDI (Y2) | 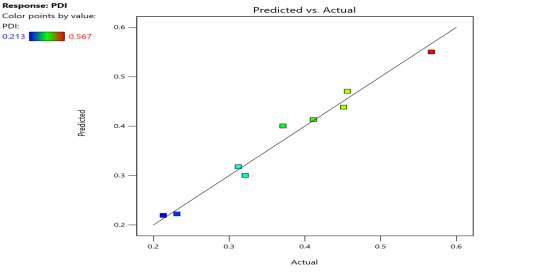 |
 |
 |
| % EE (Y3) | 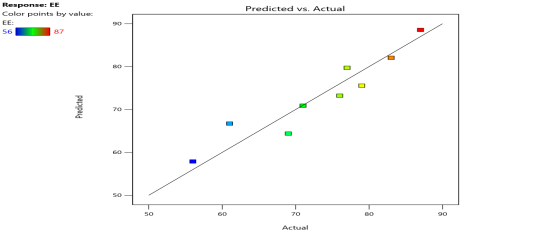 |
 |
 |
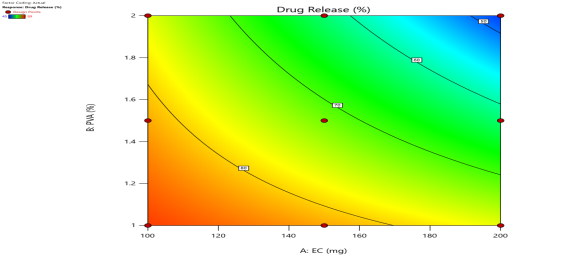
| % Drug Release (Y4) | 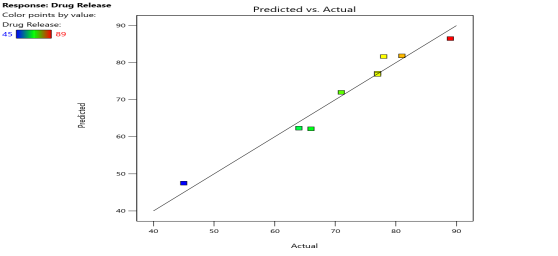 |
 |
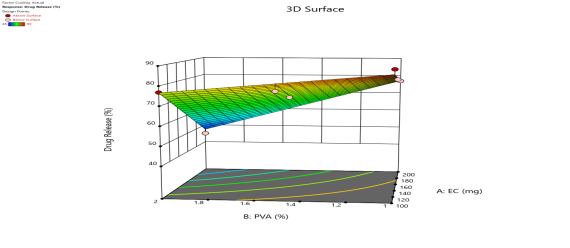 |
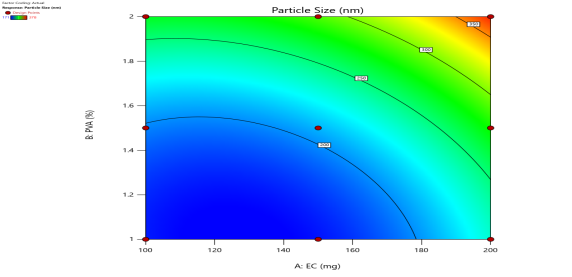
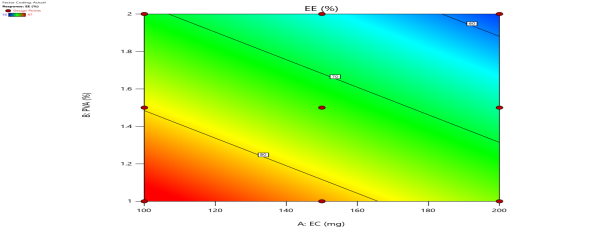
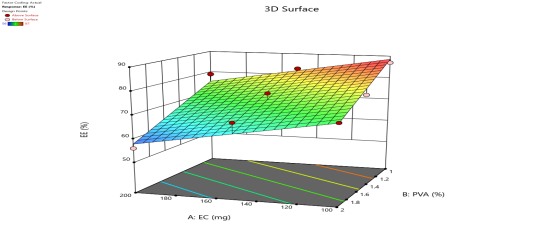
| Fig. 6a: Predicted Vs actual Plots of X1 and X2 with Y1, Y2, Y3 andY4 | Fig. 6b: 2D Contour plots of X1 and X2 with Y1, Y2, Y3 andY4 | Fig. 6c: 3D Response surface plots of X1 and X2 with Y1, Y2, Y3 andY4 |
Fig. 6: Represents the Predicted Vs Actual (fig. 6a), 2D Contour Plots (fig. 6b), and 3D Response surface Plot (fig. 6c) of Y1, Y2, Y3 and Y4. Furthermore, the overall results of ANOVA show the statistical significance of the model as the p-value was found to be less than 0.05. The optimized formulation of FNS1 showed particle size, PDI, % EE, % Drug Release of 171, 0.213, 87 %0 and 89.7 %, respectively. The highest entrapment was observed with a low solvent quantity. It may be attributed to the fact that a low amount of solvent produces a high-viscosity dispersed phase that obstructs the diffusion, increases droplet size, and thereby encapsulates a larger drug amount. Analysis of Variance (table 7) showed that X1 and X2 results obtained exhibited statistically significant difference (p<0.05)
Table 6: Formulation chart which includes dependable and Independable parameters
| Formulation code | Dependable factors | Responses (Independable factors) | ||||
| X1 | X2 | Y1 | Y2 | Y3 | Y4 | |
| NS1 | -1 | -1 | 171±0.15 | 0.213±0.01 | 87±0.85 | 89.7±0.1 |
| NS2 | -1 | 0 | 201±0.14 | 0.312±0.02 | 77±0.14 | 78.1±0.4 |
| NS3 | -1 | 1 | 271±0.68 | 0.451±0.10 | 71±0.56 | 77±0.9 |
| NS4 | 0 | -1 | 181±0.35 | 0.231±0.03 | 83±0.85 | 81.2±1.0 |
| NS5 | 0 | 0 | 211±0.21 | 0.321±0.05 | 76±0.47 | 71±1.3 |
| NS6 | 0 | 1 | 281±0.58 | 0.371±0.02 | 69±0.98 | 66.8±1.0 |
| NS7 | 1 | -1 | 231±0.17 | 0.411±0.04 | 79±0.68 | 77.1±0.5 |
| NS8 | 1 | 0 | 271±0.11 | 0.456±0.08 | 61±0.11 | 64.8±1.1 |
| NS9 | 1 | 1 | 378±0.25 | 0.567±0.05 | 56±0.45 | 45.1±0.6 |
Data are expressed as mean±SD values (n = 3). Based on the results (table 6), it can be confirmed that X1 and X2 exhibited significant effects on Y1, Y2, Y3 and Y4 at p<0.05 with a relatively larger F value (74.52 for Y1, 29.16 for Y2, 24.63 for Y3 and 45.79 for Y4).
Table 7: ANOVA results for responses Y1, Y2, Y3 and Y3
| Source | Y1 | Y2 | Y3 | Y4 | ||||||||
| Coeff. | F-value | p-value | Coeff. | F-value | p-value | Coeff. | F-value | p-value | Coeff. | F-value | p-value | |
Model/ Intercept |
32922.92 | 74.52 | 0.0024 | 0.1021 | 29.16 | 0.0095 | 721.67 | 24.63 | 0.0013 | 1240.83 | 45.79 | 0.0005 |
| X1 | 9361.5 | 105.95 | 0.002 | 0.035 | 49.94 | 0.0058 | 253.5 | 17.31 | 0.0059 | 560.67 | 62.07 | 0.0005 |
| X2 | 20068.17 | 227.12 | 0.0006 | 0.0475 | 67.88 | 0.0037 | 468.17 | 31.96 | 0.0013 | 580.17 | 64.23 | 0.0005 |
| X1X2 | 552.25 | 6.25 | 0.0877 | 0.0017 | 2.4 | 0.219 | 24.63 | 0.0013 | 100 | 11.07 | 0.0208 | |
Checkpoint analysis and optimization of design
Final formulation was prepared from optimum values of factors, overlay plot and desirability of DoE. Preparation of optimized formulation (FNS1) was done for checkpoint analysis and evaluated. The optimized formulation has shown response variable as R1 = 64.41 R2 = 0.1141, R3 = 10.06 and R4 = 12.68. In the checkpoint analysis, values of observed and predicted responses were analyzed and compared. The error was calculated as given in table 8. Reliability of the optimization procedure to prepare formulation as per 3 level factorial designs, which is followed in the present study, was confirmed by above value. X1 and X2 factors with the composition of 100 mg and 1.0 % are best suitable for drug delivery as NS-based topical gel.
Drug and excipients compatibility studies
FTIR studies
The FT-IR spectra of pure drugs FDN, polymer and mixture of drugs were recorded. The functional groups interpreted for the mixture and polymer was found to be in correlation with pure drug peaks.
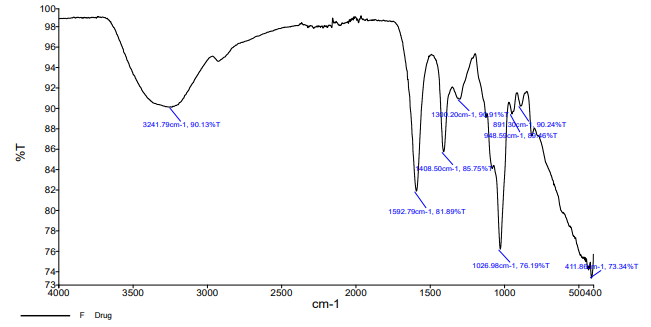 |
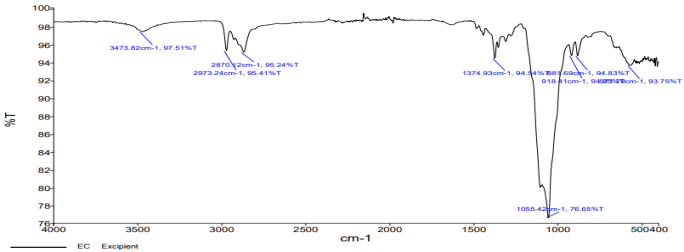 |
| Fig. 7a: IR spectrum of fucoidan | Fig. 7b: IR spectrum of ethylcellulose |
 |
|
| Fig. 7c: IR spectrum of fucoidan+ethylcellulose |
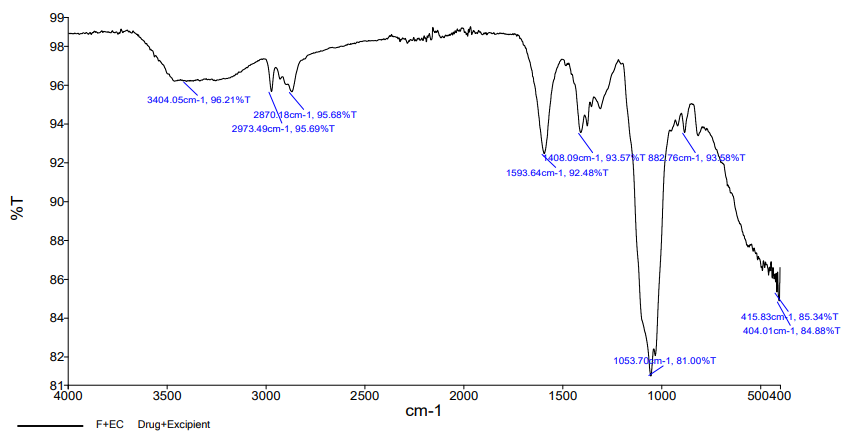
Fig. 7: The prominent peaks of FDN, i. e. 3241 cm-1corresponding to O-H stretching; 1408 cm-1corresponding to aromatic stretching; 1026 cm-1 corresponding to SiO2 were noticed in the physical mixture FT-IR spectra
Table 8: Checkpoint analysis for the optimized formulation
| Responses | Predicted mean | Predicted median | Std dev | SE pred | 95% PI low | 95% PI high |
| Particle size | 174.172 | 174.172 | 9.40006 | 12.2739 | 135.111 | 213.234 |
| PDI | 0.213001 | 0.213001 | 0.02646 | 0.034549 | 0.10305 | 0.322951 |
| % EE | 88.0519 | 88.0519 | 3.82729 | 4.56013 | 76.8937 | 99.2101 |
| % Drug release | 86.1384 | 86.1384 | 3.00555 | 3.84002 | 76.2673 | 96.0095 |
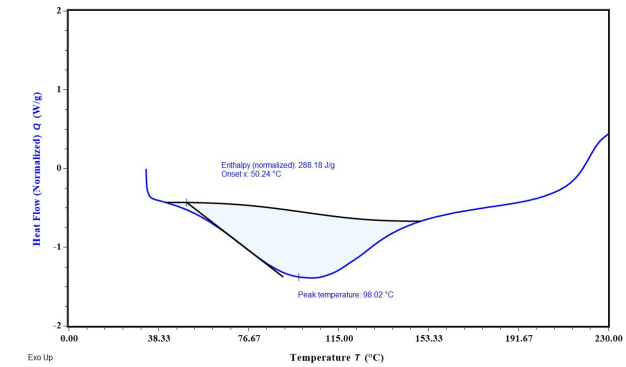
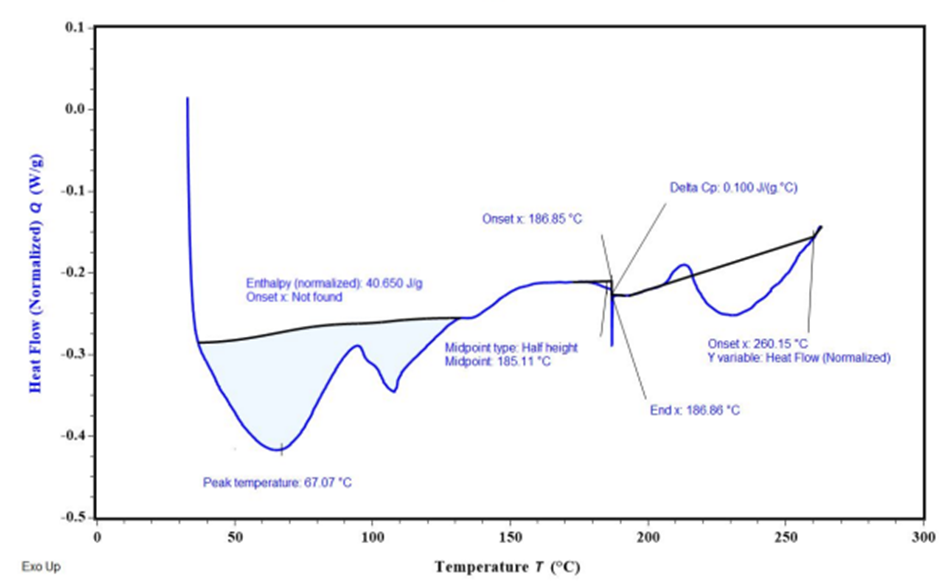
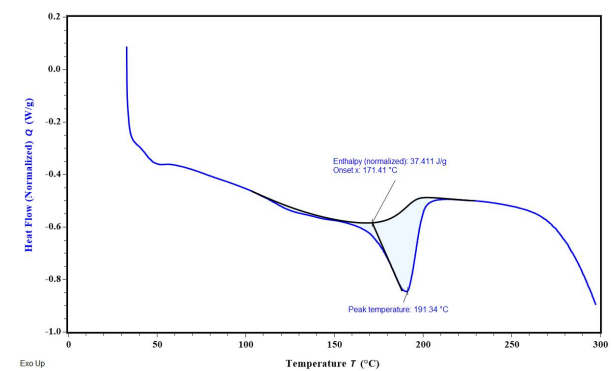
Fig. 8: Overlay DSC thermograms (A) FDN; (B) Ethyl cellulose (C) Polyvinyl alcohol
DSC studies
The DSC results reveal key insights into the thermal behavior of FDN and the encapsulated formulation in NS 1. The endothermic peak at 98.02 °C corresponds to the melting point of FDN, indicating its thermal stability and serving as a reference for evaluating its behavior in formulations. In nanosponge 1, the broad endothermic peak suggests successful encapsulation of FDN, characterized by the coalescence of EC and FDN, which reflects the effective loading of the drug into the porous structure of the NS. Additionally, the observed exothermic peak signifies the fusion of the drug within the polymer matrix, indicating a homogeneous distribution that is critical for consistent release and efficacy (fig. 8).
SEM
SEM analysis of the Nanosponge (NS1) revealed a porous and spongy morphology, likely resulting from the inward migration of the organic phase into the ethyl cellulose polymer matrix during fabrication. This structural characteristic is crucial for enhancing drug loading capacity and controlling release kinetics (fig. 9). A research on ethyl cellulose nanosponges reported a spherical and porous structure, which facilitated sustained drug release over 12 h [18]. The porous nature of these nanosponges was attributed to the emulsion solvent evaporation technique used in their preparation, which aligns with the fabrication method employed for NS1. The size distribution was effectively controlled by adjusting the emulsion agitation rate, highlighting the influence of fabrication parameters on the morphological characteristics of the nanocarriers. The porous architecture observed in NS1 is advantageous for drug delivery applications, as it provides a larger surface area for drug encapsulation and facilitates a controlled release profile.
The inward migration of the organic layer (solvent or surfactant) during the fabrication process creates voids and interconnected pores within the ethyl cellulose matrix, resulting in the spongy, porous structure observed in NS1. This aligns with studies on polymeric nanosponges, where solvent evaporation and surfactants enhance porosity and surface area, improving drug-loading capacity and controlled release behavior. The porous architecture of NS1 is crucial for sustained drug delivery, consistent with findings in similar ethyl cellulose-based systems, highlighting the importance of fabrication parameters in optimizing nanosponge performance.
NS gel evaluation
The optimized gel was evaluated for homogeneity, viscosity, pH, transparency, spreadability and drug content (table 9).
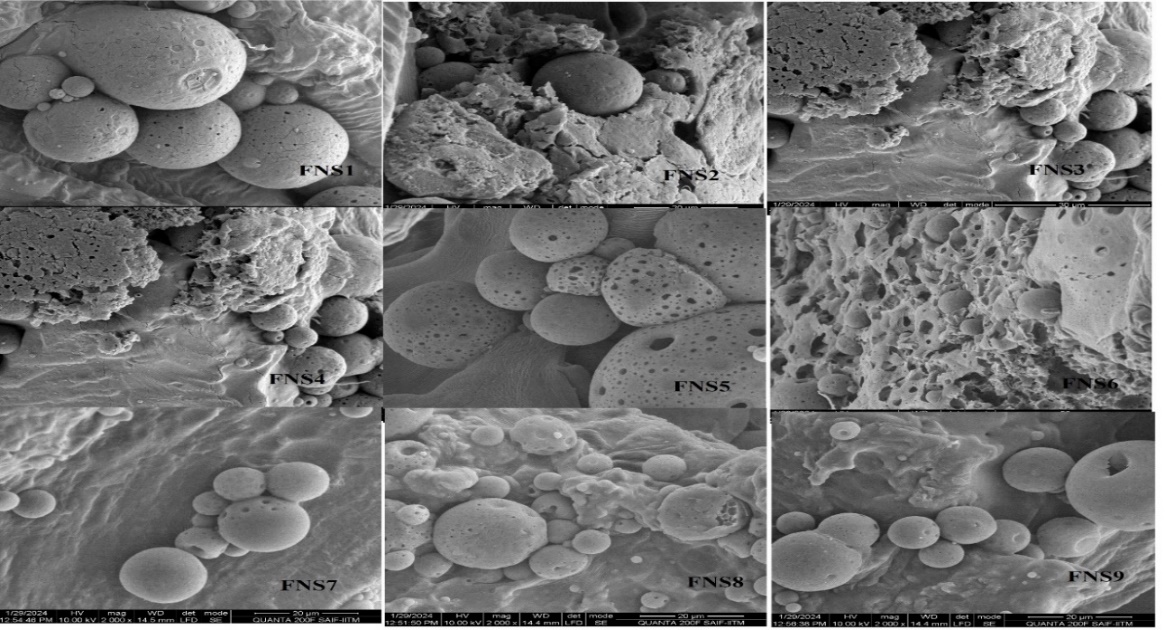
Fig. 9: Scanning electron microscope analysis of nanosponges for their morphology evaluation studies
Table 9: Gel evaluation studies
| Gel evaluation | % Drug content | Viscosity (cps) | Appearance | Homogeneity | pH | Spread ability (cm) |
| FNS1 gel | 98.52±0.02 | 8457.5± 1.2 | Clear, transparent | +++ | 5.1±0.1 | 6.85±0.001 |
| Plain FDN gel | 97.45±0.01 | 8456±0.56 | Clear, transparent | +++ | 5.5±0.25 | 6.45±0.02 |
+++indicates Excellent, data are expressed as mean±SD values (n = 3).
Homogeneity
The prepared NS gel formulations showed good uniformity, with no clumping or settling of particles. This means the nanosponges are evenly spread throughout the gel, ensuring consistent texture and stability. The lack of aggregation helps maintain the effectiveness of the gel and ensures that the active ingredients are evenly distributed, which is important for accurate dosing and performance in applications like drug delivery.
Viscosity
The viscosity of the NS gel formulations, observed in the range of 8,000–9,000 cP, was dependent on the concentration of the polymer used. Higher polymer concentrations led to increased viscosity, making the gel thicker, while lower concentrations resulted in a more fluid gel. This indicates that the consistency of the gel can be controlled by adjusting the amount of polymer in the formulation.
pH
The pH of the NS-based gel formulations, ranging from 5.1 to 5.45, is well within the normal skin pH range of 4.7 to 5.75. This ensures that the gel is suitable for topical application, as it is unlikely to cause irritation or disrupt the skin’s natural balance.
Transparency
The Nanosponge gel formulations were clear and transparent, indicating they are free from any particulate matter. This clarity shows that the nanosponges are well dispersed in the gel, ensuring uniformity. The absence of cloudiness confirms the quality of the preparation and means there are no undissolved particles. This transparent appearance not only makes the gel visually appealing but also assures users of its purity and safety for topical use.
Spreadability
Good spreadability is essential for ensuring that a gel distributes evenly when applied to the skin. An ideal spreadability range is between 5 to 7 cm; a larger spread diameter allows the gel to cover a greater surface area. The spread test results for the NS gel preparation showed values between 6.45 and 6.85 cm, indicating that the gel has excellent spreadability. This suggests that the gel can be easily and effectively applied to the skin, enhancing its usability and effectiveness.
Drug content
The percentage drug content of the nanogel was measured and found to be in the range of 97.45 %-98.52 % (table 9).
Ex vivo skin permeation studies
Ex vivo skin permeation results indicated that the optimized FNS1 gel formulation is an ideal topical nano-drug delivery system that can hinder the permeation of the drug through the skin for a longer period and make it difficult to reach systemic circulation (table 10). The ex vivo skin permeation results indicated that the optimized FNS1 gel formulation significantly hinders drug permeation compared to the plain gel. The permeation profile, with a transdermal flux of 23.48 µg/cm²/h and an enhancement ratio of 1.43, highlights the controlled release characteristics of the formulation (table 10). This finding aligns with previously reported studies on FDN-based delivery systems and nanosponge formulations. Additionally, the enhancement ratio of 1.43 observed for FNS1 is consistent with other FDN-based gels designed with enhancement ratios ranging from 1.3 to 1.5 [30]. The present findings not only corroborate these results but also underscore the potential of FNS1 gel as a localized delivery system that minimizes systemic exposure.
Table 10: Ex vivo characterization of gel formulations
| Time (h) | Nanosponges (FNS1) | Plain gel |
| 0 | 0 | 0 |
| 1 | 13.2±0.1 | 11±0.6 |
| 2 | 18.8±0.6 | 14±0.3 |
| 4 | 26.9±0.5 | 19.1±0.4 |
| 6 | 35.1±0.2 | 25.2±0.8 |
| 8 | 39.5±0.1 | 35.3±0.0.9 |
| 10 | 45.2±0.8 | 39.4±0.3 |
| 12 | 53.6±0.1 | 45.1±0.2 |
| 24 | 72.6±0.2 | 61.9±0.5 |
Data are expressed as mean±SD values (n = 3). The data obtained from skin permeation studies, as shown in fig. 10, revealed the cumulative % drug release of FDN-loaded gel NS1 compared to the plain gel.
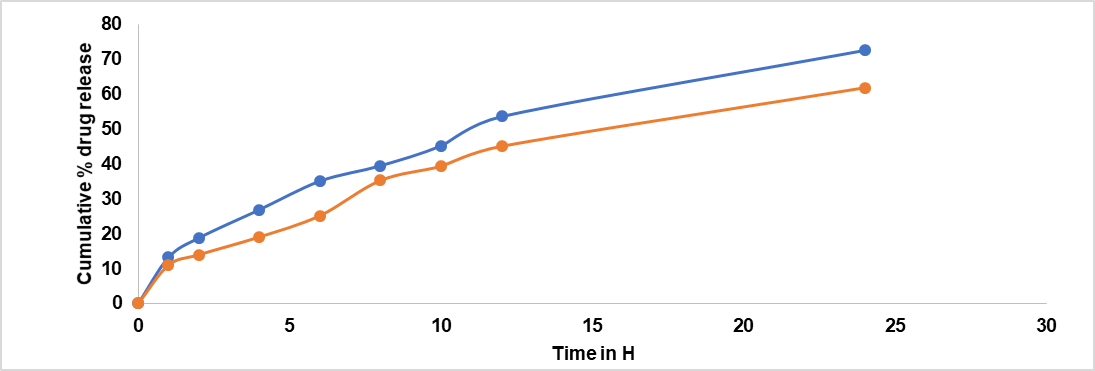
Fig. 10: Ex vivo drug release studies of gels. The graph represents the cumulative percentage of drug release over time. Results are given as mean sample size: n= 3, Permeation profile indicated that Kp of 7.38*10-3, whereas for plain gel it is 5.1*10-3(table 11). The results obtained from skin permeation studies showed that the optimized gel formulation was successful in stopping the drug from permeation through the skin
Table 11: Ex vivo drug permeation and transdermal flux values
| Formulation | Transdermal flux (mg/cm^2/H)* | Permeability coefficient (Kp) | Enhancement ratio |
| FNS1 | 0.0738 ±0.9 | 7.38*10-3 | 1.45 |
| Plain gel | 0.051±0.4 | 5.1*10-3 | 1 |
*Data are expressed as mean±SD values (n = 3).
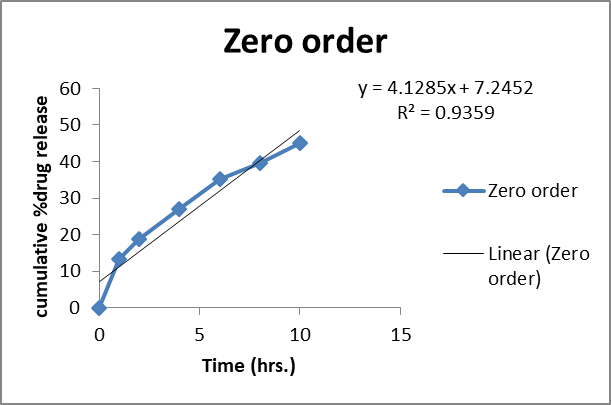
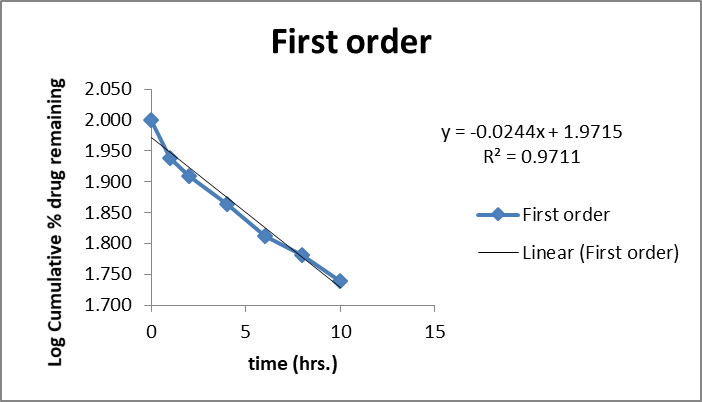
Drug release kinetics
The in vitro release kinetics of the optimized FDN Nanosponges (FNS1) gel formulation were analyzed using various mathematical models to elucidate the drug release mechanism. The regression coefficients (R2R2) obtained were Zero-Order (0.9359), First-Order (0.9711), Higuchi (0.9979), and Korsmeyer-Peppas (0.9377). The rate constants for Zero-Order and First-Order kinetics were 2.627 and 0.031, respectively, with a diffusion exponent (nn) of 0.512, indicating a Fickian diffusion mechanism (fig. 11). Similarly, research on FDN-loaded nanocomposites demonstrated pH-responsive drug release, with higher release rates observed at acidic pH levels, indicative of diffusion-controlled mechanisms [31]. The observed Fickian diffusion mechanism in the current study is consistent with the behavior of other nanosponge-based delivery systems. Nanosponges are known for their ability to modulate drug release profiles, often exhibiting diffusion-controlled release patterns [32]. The high R2 value for the Higuchi model (0.9979) further supports the predominance of diffusion in the drug release process. The alignment of the current findings with existing literature underscores the efficacy of the FNS1 gel formulation in achieving controlled drug release through diffusion mechanisms. This consistency with previous studies highlights the potential of FDN-based nanosponges as effective carriers for sustained and controlled drug delivery applications.
 |
 |
 |
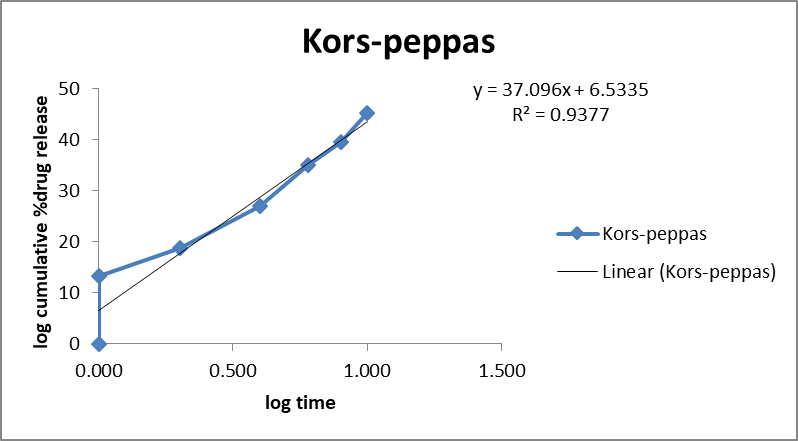 |
Fig. 11: Mathematical models of release profiles of fucoidan. Nanosponges loaded gel using zero-order, higuchi models, first-order kinetics, and Korsmeyer-Peppas models. The data points represent the mean values of cumulative drug release. Sample size: n=3. Error bars represent the standard deviation from the mean
Stability studies
The stability results of the FNS1 gel at room temperature (25±2 °C/60±5% RH) and accelerated conditions (40±2 °C/75±5% RH) over 90 days showed minimal variations in drug content, appearance, homogeneity, pH, and in vitro drug release (table 12). This is consistent with previous reports on FDN-based gel formulations, which demonstrate high stability under similar conditions, maintaining over 95% of their drug content and transparency over time [33]. Also, a study on FDN-loaded hydrogel systems reported sustained stability over three months, with no significant changes in drug content or release profiles under both refrigerated and accelerated storage [34]. This further supports the suitability of FDN as a stabilizing agent in nanostructured delivery systems. The stability under accelerated conditions observed for FNS1 suggests its potential for broader applications in drug delivery, particularly in regions with high temperature and humidity. Compared to conventional gel systems, the FDN-based nanosponge formulation shows enhanced resilience, making it a promising candidate for commercial development.
Table 12: Stability results for the FNS1 gel at room temperature (25±2 °C/60± 5 % RH) and accelerated condition (40±2 °C/75± 5 % RH)
| At refrigeration temperature | |||||
| Duration | Drug content | Appearance | Homogeneity | pH | In vitro drug release |
| Freshly prepared | 98.50% | Clear, Transparent | +++ | 5.4±0.01 | 90% |
| 30 d | 98% | Clear, Transparent | +++ | 5.2±0.7 | 89% |
| 60 d | 97.50% | Clear, Transparent | +++ | 5.1±0.45 | 88.4% |
| 90 d | 97% | Clear, Transparent | +++ | 5±0.23 | 88% |
| At Accelerated temperature | |||||
| Duration | Drug content | Appearance | Homogeneity | pH | In vitro drug release |
| Freshly prepared | 98.52% | Clear, Transparent | +++ | 5.4±0.07 | 89% |
| 30 d | 97.50% | Clear, Transparent | +++ | 5.1±0.98 | 88% |
| 60 d | 97% | Clear, Transparent | +++ | 4.9±0.78 | 87.45% |
| 90 d | 96.50% | Clear, Transparent | +++ | 4.7±0.58 | 87.20% |
+++indicates excellent
CONCLUSION
A novel Risk-based approach was implemented for the development of nanosponge-loaded topical gel of FDN for the treatment of rheumatoid arthritis. Characteristics of prepared NS were influenced by the effect of different CMA (amount of ethyl cellulose and % PVA) on CQA (particle size and % EE and Drug release studies). The overall study reveals the increased permeation of the FDN through the transdermal route in gel formulation, which was evidenced by the drug compatibility studies. The prepared nanosponge-based gel exhibited a release retardation for a more extended period, lack of significant irritation, and greater compatibility, which could help to reduce the dosing frequency and might cause the formulation to occupy the market in nearby future. The consistency of the results with previously reported works highlights the potential of FNS1 gels as reliable, stable, and effective drug delivery systems. Future studies may focus on long-term stability and patient-centric applications to further validate these findings.
ACKNOWLEDGEMENT
Authors thank the management of Sri Ramachandra Faculty of Pharmacy, Sri Ramachandra Institute of Higher Education and Research (DU), Porur, Chennai 600116, Tamil Nadu, India, for providing all the necessary facilities to carry out this work.
FUNDING
Nil
AUTHORS CONTRIBUTIONS
All authors contributed to the study conception and design. Material preparation, data collection and analysis were performed by Vaishnavi. C. E, Ajitha Azhakesan and Narendra Pentu. The first draft of the manuscript was written by Vaishnavi. C. E and all authors commented on previous versions of the manuscript. Ajitha Azhakesan reviewed the manuscript. All authors read and approved the final version of the manuscript.
CONFLICT OF INTERESTS
The authors declare no conflict of interests
REFERENCES
Florence AT. Targeted and controlled drug delivery: novel carrier systems. International Journal of Pharmaceutics. 2003;267(1-2):157. doi: 10.1016/S0378-5173(03)00356-9.
Patra JK, Das G, Fraceto LF, Campos EV, Rodriguez Torres MD, Acosta Torres LS. Nano-based drug delivery systems: recent developments and future prospects. J Nanobiotechnology. 2018;16(1):71. doi: 10.1186/s12951-018-0392-8, PMID 30231877.
Ochubiojo M, Chinwude I, Ibanga E, Ifianyi S. Nanotechnology in drug delivery. In: Sezer AD, editor. Recent Advances in Novel Drug Carrier Systems. In Tech; 2012. doi: 10.5772/51384.
Lv Y, Li W, Liao W, Jiang H, Liu Y, Cao J. Nano-drug delivery systems based on natural products. Int J Nanomedicine. 2024;19:541-69. doi: 10.2147/IJN.S443692, PMID 38260243.
Azhar M, Mishra A. Review of nanoemulgel for treatment of fungal infections. Int J Pharm Pharm Sci. 2024;16(9):8-17. doi: 10.22159/ijpps.2024v16i9.51528.
Rizvi SA, Saleh AM. Applications of nanoparticle systems in drug delivery technology. Saudi Pharm J. 2018;26(1):64-70. doi: 10.1016/j.jsps.2017.10.012, PMID 29379334.
Hami Z. A brief review on advantages of nano-based drug delivery systems. Ann Mil Health Sci Res. 2021;19(1). doi: 10.5812/amh.112274.
Iriventi P, Gupta NV, Osmani RA, Balamuralidhara V. Design and development of nanosponge loaded topical gel of curcumin and caffeine mixture for augmented treatment of psoriasis. Daru. 2020;28(2):489-506. doi: 10.1007/s40199-020-00352-x, PMID 32472531.
Gerlag DM, Borges E, Tak PP, Ellerby HM, Bredesen DE, Pasqualini R. Suppression of murine collagen-induced arthritis by targeted apoptosis of synovial neovasculature. Arthritis Res. 2001;3(6):357-61. doi: 10.1186/ar327, PMID 11714389.
Mitragotri S, Yoo JW. Designing micro- and nano-particles for treating rheumatoid arthritis. Arch Pharm Res. 2011;34(11):1887-97. doi: 10.1007/s12272-011-1109-9, PMID 22139688.
Phull AR, Majid M, Haq IU, Khan MR, Kim SJ. In vitro and in vivo evaluation of anti-arthritic, antioxidant efficacy of fucoidan from Undaria pinnatifida (Harvey) Suringar. Int J Biol Macromol. 2017;97:468-80. doi: 10.1016/j.ijbiomac.2017.01.051, PMID 28104371.
Pineiro Ramil M, Florez Fernandez N, Ramil Gomez O, Torres MD, Dominguez H, Blanco FJ. Antifibrotic effect of brown algae-derived fucoidans on osteoarthritic fibroblast-like synoviocytes. Carbohydr Polym. 2022;282:119134. doi: 10.1016/j.carbpol.2022.119134, PMID 35123730.
Raj PP, Gopal RK, Sanniyasi E. Investigating the anti-inflammatory and anti-arthritis effects of fucoidan from a brown seaweed. Current Research in Biotechnology. 2024;7. doi: 10.1016/j.crbiot.2024.100220.
Rodrigues K, Nadaf S, Rarokar N, Gurav N, Jagtap P, Mali P. QBD approach for the development of hesperetin loaded colloidal nanosponges for sustained delivery: in vitro, ex-vivo, and in vivo assessment. OpenNano. 2022;7:2022.100045. doi: 10.1016/j.onano.2022.100045.
Yang M, Feng X, Ding J, Chang F, Chen X. Nanotherapeutics relieve rheumatoid arthritis. J Control Release. 2017;252:108-24. doi: 10.1016/j.jconrel.2017.02.032, PMID 28257989.
Luthuli S, Wu S, Cheng Y, Zheng X, Wu M, Tong H. Therapeutic effects of fucoidan: a review on recent studies. Mar Drugs. 2019;17(9):487. doi: 10.3390/md17090487, PMID 31438588.
Jayawardena TU, Nagahawatta DP, Fernando IP, Kim YT, Kim JS, Kim WS. A review on fucoidan structure, extraction techniques, and its role as an immunomodulatory agent. Mar Drugs. 2022;20(12):755. doi: 10.3390/md20120755, PMID 36547902.
Ahmed MM, Fatima F, Anwer MK, Ansari MJ, Das SS, Alshahrani SM. Development and characterization of ethyl cellulose nanosponges for sustained release of brigatinib for the treatment of non-small cell lung cancer. J Polym Eng. 2020;40(10):823-32. doi: 10.1515/polyeng-2019-0365.
GS, Chandra GK, KE, Mahapatra DR, AS, ZG. Nanoparticles and bacterial interaction of host-pathogens and the detection enhancement of biomolecules by fluorescence Raman spectroscopic investigation. Eng Sci. 2022;20:341-51. doi: 10.30919/es8d767.
Salunke A, Upmanyu N. Formulation, development and evaluation of budesonide oral nano-sponges using DOE approach: in vivo evidences. Adv Pharm Bull. 2021;11(2):286-94. doi: 10.34172/apb.2021.041, PMID 33880350.
Torne SJ, Ansari KA, Vavia PR, Trotta F, Cavalli R. Enhanced oral paclitaxel bioavailability after administration of paclitaxel-loaded nanosponges. Drug Deliv. 2010;17(6):419-25. doi: 10.3109/10717541003777233, PMID 20429848.
Caldera F, Tannous M, Cavalli R, Zanetti M, Trotta F. Evolution of cyclodextrin nanosponges. Int J Pharm. 2017;531(2):470-9. doi: 10.1016/j.ijpharm.2017.06.072, PMID 28645630.
Yildiz ZI, Uyar T. Fast-dissolving electrospun nanofibrous films of paracetamol/cyclodextrin inclusion complexes. Appl Surf Sci. 2019;492:626-33. doi: 10.1016/j.apsusc.2019.06.220.
Rodrigues K, Nadaf S, Rarokar N, Gurav N, Jagtap P, Mali P. QBD approach for the development of hesperetin loaded colloidal nanosponges for sustained delivery: in vitro, ex-vivo, and in vivo assessment. OpenNano. 2022;7:100045. doi: 10.1016/j.onano.2022.100045.
Shabaraya AR, Sumana G, Vineetha K. Formulation and evaluation of nanosponges-loaded gel of lornoxicam for topical delivery. Int J Drug Deliv Technol. 2022;12(2):634-9. doi: 10.25258/ijddt.12.2.29.
Ghose A, Nabi B, Rehman S, Md S, Alhakamy NA, Ahmad OA. Development and evaluation of polymeric nanosponge hydrogel for terbinafine hydrochloride: statistical optimization, in vitro and in vivo studies. Polymers (Basel). 2020;12(12):2903. doi: 10.3390/polym12122903, PMID 33287406.
Md S, Mehboob SZ, Doddayya H. Preparation and characterization of fluconazole topical nanosponge hydrogel. Int J Pharm Pharm Sci. 2024;16(4):18-26. doi: 10.22159/ijpps.2024v16i4.50589.
KJC, Patil MC, Banerjee M, HMA. Preparation and characterization of ficus lacor metallic particles based nanogel for wound healing activity. Int J Curr Pharm Sci. 2024;16(1):50-5. doi: 10.22159/ijcpr.2024v16i1.4016.
Wadhwa A, Mathura V, Lewis SA. Emerging novel nanopharmaceuticals for drug delivery. Asian J Pharm Clin Res. 2018;11(7):35-7. doi: 10.22159/ajpcr.2018.v11i7.25149.
Barbosa AI, Lima SA, Yousef I, Reis S. Evaluating the skin interactions and permeation of alginate/fucoidan hydrogels per se and associated with different essential oils. Pharmaceutics. 2023;15(1):190. doi: 10.3390/pharmaceutics15010190, PMID 36678818.
Raju P, Natarajan S. Anticancer, anti-biofilm and antimicrobial activity of fucoidan-loaded zeolitic imidazole framework fabricated by one-pot synthesis method. Appl Nanosci. 2023;13(3):1919-37. doi: 10.1007/s13204-021-01881-w.
Moin A, Roohi NK, Rizvi SM, Ashraf SA, Siddiqui AJ, Patel M. Design and formulation of polymeric nanosponge tablets with enhanced solubility for combination therapy. RSC Adv. 2020;10(57):34869-84. doi: 10.1039/D0RA06611G, PMID 35514416.
Obluchinskaya ED, Pozharitskaya ON, Flisyuk EV, Shikov AN. Formulation, optimization and in vivo evaluation of fucoidan-based cream with anti-inflammatory properties. Mar Drugs. 2021;19(11):643. doi: 10.3390/md19110643, PMID 34822514.
Reys LL, Silva SS, Soares da Costa D, Rodrigues LC, Reis RL, Silva TH. Building fucoidan/agarose-based hydrogels as a platform for the development of therapeutic approaches against diabetes. Molecules. 2023;28(11):4523. doi: 10.3390/molecules28114523, PMID 37298999.