
Int J App Pharm, Vol 17, Issue 2, 2025, 432-440Original Article
DEVELOPMENT AND VALIDATION OF AN LC-MS/MS METHOD FOR NITROSAMINE IMPURITY DETECTION IN TAMSULOSIN HYDROCHLORIDE
SWETHA SRI REMIDICHERLA1, 2, GUNTUPALLI CHAKRAVARTHI1*, ARRAM MADHAVI3, NARENDER MALOTHU1
1Department of Pharmaceutical Analysis, College of Pharmacy, Koneru Lakshmaiah Education Foundation, Vaddeswaram, Guntur-522502, India. 2Department of Pharmaceutical Quality Assurance, Sarojini Naidu Vanita Pharmacy Maha Vidyalaya, Tarnaka, Secunderabad-500017, India. 3Department of Pharmaceutical Analysis, Geethanjali College of Pharmacy, Keesara, Hyderabad-501301, India
*Corresponding author: Guntupalli Chakravarthi; *Email: chakra_varthi123@kluniversity.in
Received: 18 Aug 2024, Revised and Accepted: 15 Jan 2025
ABSTRACT
Objective: Regulatory oversight of pharmaceuticals containing nitrosamine contaminants has intensified in the past few years. Unites States Food and Drug Administration (USFDA), European Medicines Agency (EMA) and other regulatory agencies has been quite proactive in sending out warnings, instructions, and safety messages. This study presents a fast, accurate, and selective way to detect and quantify nitrosamine contaminants in Tamsulosin HCl.
Methods: The purification of Tamsulosin using Di Methyl Formamide (DMF) requires monitoring to avoid nitrosamine formation. A 150 × 4.6 mm Symmetry® C18 column (5 µm, 40±1 °C) was used with a mobile phase involving water (98%), acetonitrile (2%) with 0.1% formic acid, where flow velocity was 0.8 ml/min and 10 µl** injection volume. After 1.20 min, the mobile phase composition gradually changed to 90% B (acetonitrile) and 10% A (water). Chromatographic separation took 10 min with a 5±0.5 °C auto-sampler temperature. Atmospheric Pressure Chemical Ionization (APCI) in positive ion mode, with clustering potentials of 36–50 V and collision energy of 9–30 eV, was used for quantification.
Results: Following International Conference Harmonization (ICHQ2R1), showed regression value more than 0.997 and a signal-to-noise ratio of 3.7-4.5 ppm. Approach achieved Limit of Detection (LOD) values over 3.3-12.7 ppm and Limit of Quantification (LOQ) values over 9.9-36.9 ppm, with signal-to-noise ratios greater than 3.7% and greater than 12.9. All of the method recoveries fell between 80% and 120%.
Conclusion: This Liquid Chromatography with Tandem Mass Spectroscopy (LC-MS/MS) technology detects and quantifies nitrosamine impurities in Tamsulosin quickly, sensitively and specifically, assuring regulatory compliance pursuant to USP General chapter<1469>. Impurities in Tamsulosin can be detected at a minimum level using the current technology, which allows for regular analysis.
Keywords: Fragment ion, Tamsulosin, Nitrosamine impurities, APCI (+ve)
© 2025 The Authors. Published by Innovare Academic Sciences Pvt Ltd. This is an open access article under the CC BY license (https://creativecommons.org/licenses/by/4.0/)
DOI: https://dx.doi.org/10.22159/ijap.2025v17i2.52810 Journal homepage: https://innovareacademics.in/journals/index.php/ijap
INTRODUCTION
Benign Prostatic Hyperplasia (BPH), a condition marked by an enlarged prostate, is primarily treated with the pharmaceutical agent Tamsulosin hydrochloride. It is an alpha-1 blocker, a type of medicine. To facilitate urination, Tamsulosin (fig. 1) relaxes the muscles of the prostate and bladder neck. In these regions, muscular contraction is caused by alpha-1 adrenergic receptors, which are specifically blocked. The possible carcinogenic qualities of nitrosamine impurities have made them a major issue in the pharmaceutical sector [1-3]. To guarantee that pharmaceutical products are safe and effective, it is necessary to create and test analytical methods that can identify and quantify these contaminants with high sensitivity and specificity [4]. Di Methyl Formamide (DMF), preferred for its high yield and purity in Tamsulosin synthesis, requires careful monitoring for nitrosamine formation. Secondary amine cluster in Tamsulosin interacts with dimethyl amine, creating a nitrosamine intermediate, further reacts with DMF in the reaction mixture, producing an assortment of nitrosamine impurities [5, 6]. Removing nitrosamine impurities for human consumption has been highlighted by regulatory agencies like the USFDA and the EMA [7-10]. There are a number of methods that have been published for the determination of Tamsulosin in routine analysis, including UV-spectroscopic [11-20], High-Performance Liquid Chromatography (HPLC) [21-26], LC-MS/MS [27-33], High-Performance Thin Layer Chromatography (HPTLC) [34-38] and others [39-40]. There is not a single one that use LC-MS/MS to detect and quantify potential nitrosamine impurities in Tamsulosin. The purpose of this research is to identify and quantify particular nitrosamine contaminants in Tamsulosin Active Pharmaceutical Ingredient (API) by creating and validating a novel sensitive LC-MS/MS technique, addressing a critical public health concern. In addition to providing a trustworthy analytical tool for guaranteeing the quality and safety of Tamsulosin-based products, the approach seeks to conform to rigorous regulatory standards. This technique is critical amid the increased regulatory scrutiny of nitrosamines and their possible health hazards.
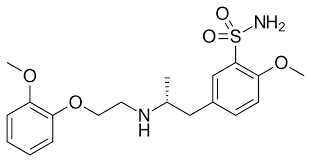
Fig. 1: Molecule of tamsulosin
MATERIALS AND METHODS
Chemicals and reagents
For the making of the mobile phase following USP<621>, analytical grade formic acid from Fluka was used for lowering background noise and any interference. Deployed HPLC grade methanol (lot number DH9DF69917) from Merck and Millipore's Milli-Q water purification device was used to make very clean water, ensures minimum contaminants, offering accurate and trustworthy findings. Sourced entirely from Suven Life Sciences Pvt. Ltd., all of the compounds and experimental materials.
Instruments and equipment
We used high-precision balances that could detect changes as small as 0.01 mg and 0.0001 mg for the weighing process. A Bandelin Sonorex sonicator was used to prepare the samples in the experimental setting. A Symmetry® C18 column with length and I. d of 150 x 4.6 mm and a particle size of 5 µm was used to accomplish the chromatographic separation. A SCIEX 6500+LC-MS/MS system, in conjunction with a Shimadzu Nexera X2, was used to perform the mass spectrometric analysis.
Mobile phase preparation
First mobile Phase (A): Preparation of a solution containing 0.1% formic acid: Combined 1 ml of formic acid with 1000 milliliter of Milli-Q Water and thoroughly blended the both. Second mobile phase (B) constituted 100% Methanol.
Diluent
0.1% formic acid in a mixture of Methanol and water in a 50:50 volume-to-volume ratio.
Preparation of standard stock A
Add approximately 50 ml of methanol to a 200 ml volumetric flask containing approximately 3.3 mg of NDEA, NDIPA, NMIPA, and NEIPA, sonicated to dissolve, and then filled the flask to volume with methanol. Mixed thoroughly.
Preparation of standard stock B
In a volumetric flask with 50 ml marking, add 3 mg of NDMA and 3 mg of NMBA, then sonicated to dissolve. Add 20 ml of methanol, then filled up to volume with methanol, and mixed thoroughly.
Preparation of standard stock C
Kept 1.6 ml of standard stock solutions A and B into a 100 ml volumetric flask, added diluent until the flask was filled to volume, and mixed.
Preparation of standard solution (33 ppm and 120 ppm with respective to sample)
After transferring 2.0 ml of standard stock C to the volumetric flask, mix in 20 ml of diluent.
Preparation of test solution (0.8 mg/ml)
We transferred approximately 16 milligrams of Tamsulosin hydrochloride API to a 20 milliliter volumetric flask, sonicated it to dissolve it, and then added 15 milliliters of diluent, bringing the total volume to 20 milliliters. We mixed everything thoroughly.
Procedure
Diluent was injected once, followed by six injections of the standard preparation and one injection of the test solution into the LC-MS/MS system. Recorded the chromatograms and measured the peak responses.
LC-MS/MS conditions
To get the best possible impurity elution, an extensive number of trials were conducted. Conditions that were optimized were achieved on a Symmetry® C18 column (150 x 4.6 mm, 5 µm particle size) kept at 40±1.0 °C. Mobile phase injection volume was 10 µl**, and flow rate was 0.8 ml/min with polarity changes. For the first 1.20 min, the mobile phase composition consisted of 98% solvent A (water with 0.1% formic acid) and 2% solvent B (acetonitrile). A gradual change in solvent composition was made, resulting in a mix of 10% solvent A (water with 0.1% formic acid) and 90% solvent B (acetonitrile) after 5.80 min. At last, the system was brought back to its original conditions (98% A, 2% B) at 7.10 min and left to stabilize for 2.90 min before the next injection. The whole chromatographic separation process took ten minutes. Between injections, the auto-sampler was maintained at a temperature of 5±0.5 °C and a rinse volume of 1200 µl** was employed, with a dip time of 5 seconds. The APCI source was employed in positive ion mode to detect and quantify target analytes, as it is less prone to ion suppression and simplifies sample preparation [41]. Declustering potentials described by Chidella et al. ranged from 36 to 50 V, while entrance potentials were consistently maintained at 10 V for all analytes. Collision energy, a critical factor influencing fragment ion formation, was varied from 9 to 30 eV depending on the specific nitrosamine structure. The collision cell exit potential was adjusted individually for each compound, ranging from 8 to 26 V, to enhance ion transmission and detection sensitivity. These parameters were optimized to ensure high signal-to-noise ratios and detailed fragmentation patterns for each nitrosamine impurity.
System suitability
The purpose is to ensure that the analytical system runs smoothly correctly. Injected the diluent and a standard impurity solution (100%) and took chromatograms. By using the below formulae calculated each impurity in ppm individually.
NDEA, NDIPA, NMIPA and NEIPA =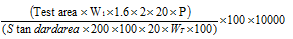
NDMA and NMBA=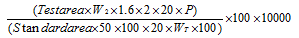
Where,
W1 = Weight of impurity standard NDEA, NDIPA, NMIPA and NEIPA
W2 = Weight of impurity standard NDMA and NMBA (ppm)
P = Potency of the standard
WT = Weight of the test sample
Specificity
Analytical methods are considered specific if they can clearly evaluate the analyte even when other components, like contaminants, degradation products, and matrix components, are present. Performed diluent and placebo interference by injecting three diluent solutions. To check the impurities interference injected all individual impurities at specification level.
Precision
Method precision
A homogeneous sample of a single batch is analyzed six times by preparing two test samples and six spiked test samples from a single batch, assesses the similarity of measurement findings acquired under identical circumstances.
Intermediate precision
To make sure that the analytical results won't change, rehearsed the method's precision setting by various analysts on separate days using columns other than precision. Used six samples of a homogeneous final sample, inspects the variability of the analytical approach.
LOD and LOQ
Both were calculated by S/N ratio method.
Linearity and range
Conducted a linearity analysis starting from the LOQ level up to 200% of impurity.
Accuracy
To ensure the precision of the test, samples were prepared by adding impurities to the test solution at concentrations of LOQ, 50%, 100%, and 200% of the target. Except for the LOQ and 200% levels, we prepared three instances of the accuracy samples for every level.
Batch analysis
Prepared standard and test solution as per test procedure.
RESULTS AND DISCUSSION
Method development
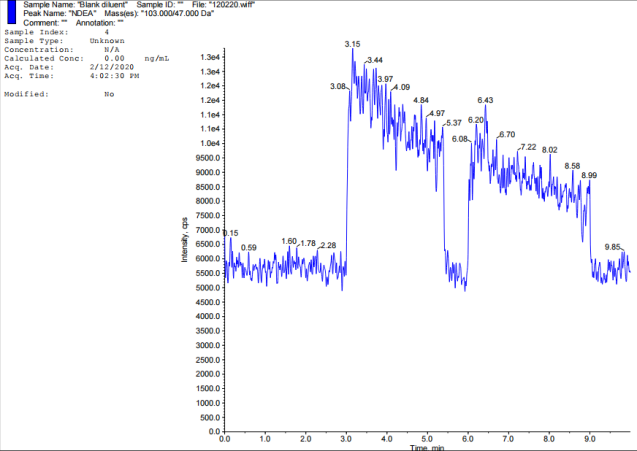
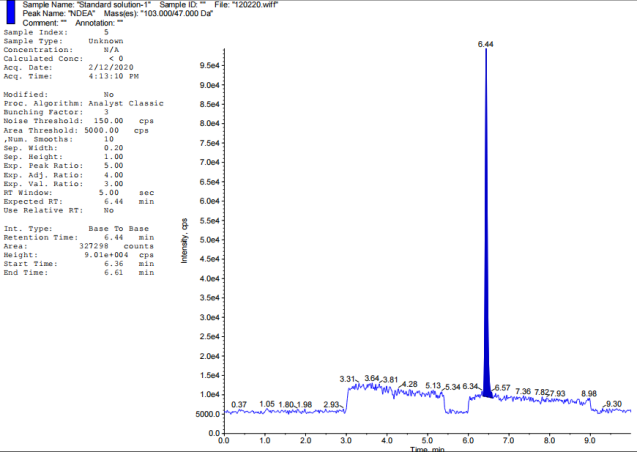
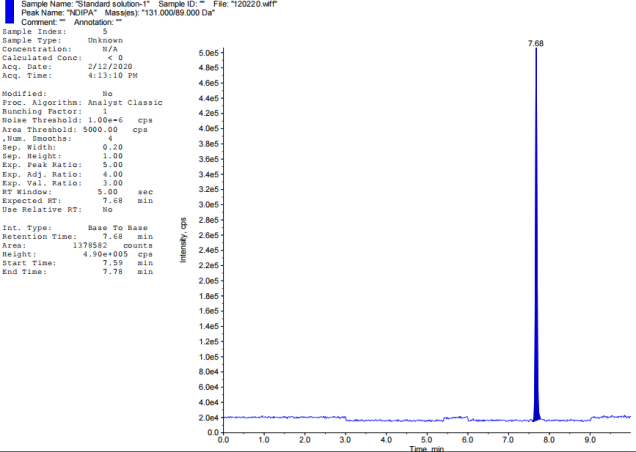
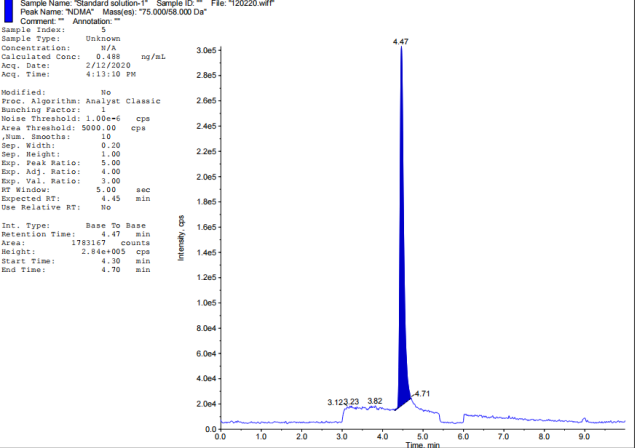
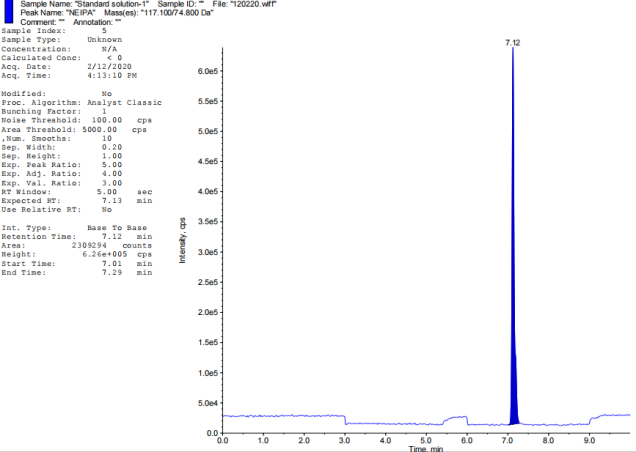
Chromatographic retention duration of 4.47, 6.46, 5.15, 6.35, 7.69, and 7.14 min for the target nitrosamine impurities (NDMA, NDEA, NMBA, NMIPA, and NEIPA) were found. The primary analyte, Tamsulosin, eluted after 5.69 min, Khorolskiy Metal method describes on effective resolution of three sartans [42]. We used multiple reaction monitoring (MRM) for mass spectrometric detection. Each molecule has its own unique transitions between the ions that serve as a precursor and a product. Observed ion transitions included NDMA (m/z 75->58), NDEA (m/z 103->47), NMBA (m/z 147.1->117), NMIPA (m/z 103.1->61), NDIPA (m/z 131->89), NEIPA (m/z 117.1->74.8), and Tamsulosin (m/z 409->228.6). The sensitivity and selectivity of each analyte were improved by selecting these particular ion pairs. Distillation served to recover solvents alongside refining experimental techniques.
System suitability
Plate count (A) and tailing factor (B) values for six nitrosamine impurities (NDMA, NDEA, NMBA, NMIPA, NDIPA, and NEIPA) are included in the details supplied in table 1. The plate count values vary from about 2200 to 6900 for the various nitrosamine contaminants, as shown in the plate count (A). Reasonable peak symmetry is indicated by tailing factor (B) values for nitrosamine impurities, which are often less than 2. Having said that, there are a handful of values higher than 1.3, which could indicate a little tailing of the associated peaks on a whole par with ICH Q2 (R1).
Specificity
Presenting in table 2 the data are the retention duration of diluent solutions and various nitrosamine impurities (NDMA, NDEA, NMBA, NMIPA, NDIPA, and NEIPA). Since the diluent solutions in fig. 2 did not introduce any unwanted noise or overlapping peaks into the analytical process, the selectivity of the approach is further reinforced as per regulatory guidelines.
Table 1: Results for system suitability
| NDMA | NDEA | NMBA | NMIPA | NDIPA | NEIPA | ||||||
| A | B | A | B | A | B | A | B | A | B | A | B |
| 6477 | 0.46 | 3036 | 1.43 | 4346 | 0.13 | 3259 | 0.32 | 4062 | 0.67 | 2271 | 0.12 |
| 6916 | 0.46 | 3049 | 1.43 | 4622 | 0.12 | 3219 | 0.32 | 4316 | 0.67 | 2270 | 0.11 |
| 5573 | 0.47 | 2994 | 1.44 | 4658 | 0.13 | 3156 | 0.32 | 3924 | 0.68 | 2235 | 0.12 |
| 6417 | 0.46 | 3020 | 1.43 | 4827 | 0.12 | 3209 | 0.32 | 3825 | 0.67 | 2219 | 0.11 |
| 5121 | 0.46 | 2956 | 1.43 | 4722 | 0.13 | 3161 | 0.32 | 3881 | 0.67 | 2197 | 0.12 |
| 5878 | 0.46 | 2949 | 1.44 | 4755 | 0.13 | 3133 | 0.32 | 3874 | 0.68 | 2238 | 0.12 |
6064± 661.2 |
0.46±0.0 | 3001±41.6 | 1.43±0.0 | 4655± 661.2 |
0.13±0.0 | 3189±47.3 | 0.32±0.0 | 3980± 183.2 |
0.67±0.0 | 2238±28.9 | 0.12±0.0 |
| 4.1▪ | 0.1▪ | 1.4▪ | 0.1▪ | 3.6▪ | 0.1▪ | 1.5▪ | 0.0▪ | 1.3▪ | 0.1▪ | 1.3▪ | 0.1▪ |
A-USP Count; B-Tailing Factor; n=6 replicates for each impurity, data presented in (mean±SD);▪% Relative standard deviation
Table 2: Results for blank, impurity interference and RT confirmation
| Impurity/Name of solution | Retention time of individual solution▲ | Interference observed (Yes/No) |
| Diluent solution-1 | - | No |
| Diluent solution-2 | - | No |
| Diluent solution-3 | - | No |
| NDMA | 4.46 | No |
| NDEA | 6.43 | No |
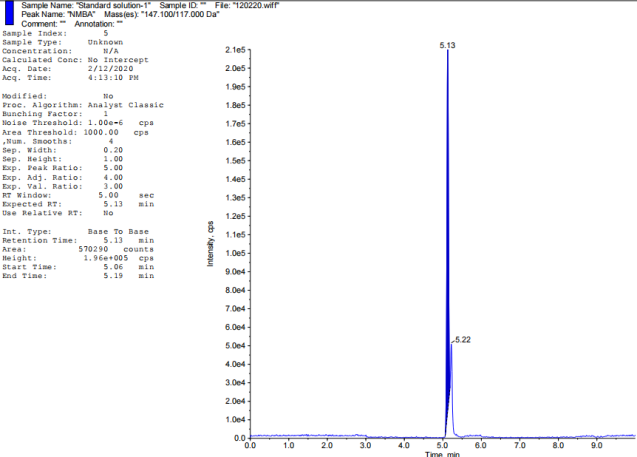
| NMBA | 5.13 | No |
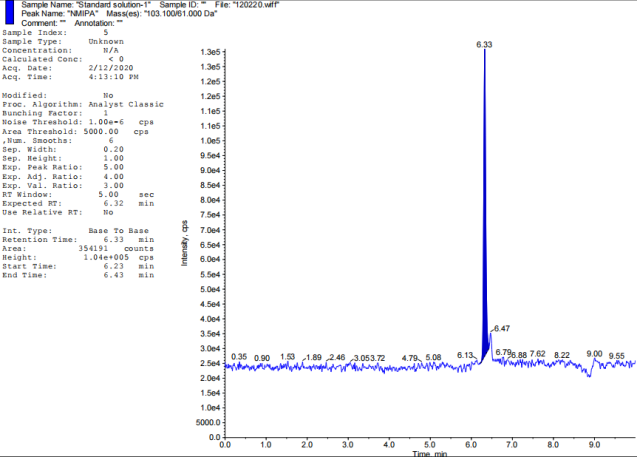
| NMIPA | 6.31 | No |
| NDIPA | 7.67 | No |
| NEIPA | 7.11 | No |
▲in min
Precision
The findings presented in tables 3 and 4 show an usually acceptable level of precision in retention time and peak area measurements is indicated by the extremely narrow range of percent relative standard deviation (%RSD) values for all contaminants, which range from 0.0% to 0.1% and from 0.1% to 1.5%, respectively. Recovery rates align with reported values in previous nitrosamine studies by Gopireddy et al., ensuring the method’s reliability. Excellent repeatability in peak area response is suggested by the lower %RSD values of 0.1–0.4% for NDMA, NDEA, NMBA, and NEIPA. The moderate amount of variability in peak area measurements for NMIPA and NDIPA is shown by slightly higher %RSD values of 1.3% and 1.5%, respectively. The level of contaminants was determined to be not detected in the unspiked preparations. Nitrosamine impurities (NDMA, NDEA, NMBA, NMIPA, NDIPA, and NEIPA) in six spiked test samples (SI-1 to SI-6) are computed in ppm. All contaminants have acceptable %RSD values of 0.0% to 5.5%inline to<1469>. Implications exhibited good precision in assessing spiked samples' nitrosamine impurity concentrations. NDMA, NDEA, NMIPA, and NDIPA have good concentration consistency with %RSD values between 1.3% and 2.3% as that of reported by Tuna Öncü et al. for sartan groups [43]. NMBA has the greatest %RSD (5.5%) of all contaminants, indicating higher quantification variability.
Table 3: Results for RT in system precision
| Retention time (min) | |||||
| NDMA | NDEA | NMBA | NMIPA | NDIPA | NEIPA |
| 4.46 | 6.43 | 5.13 | 6.32 | 7.67 | 7.12 |
| 4.46 | 6.43 | 5.12 | 6.32 | 7.67 | 7.11 |
| 4.47 | 6.44 | 5.13 | 6.32 | 7.68 | 7.12 |
| 4.46 | 6.43 | 5.12 | 6.32 | 7.67 | 7.11 |
| 4.46 | 6.43 | 5.13 | 6.32 | 7.67 | 7.12 |
| 4.46 | 6.44 | 5.13 | 6.32 | 7.68 | 7.12 |
| 4.46±0.004 | 6.43±0.005 | 5.13±0.005 | 6.32±0.000 | 7.67±0.005 | 7.12±0.005 |
| 0.1▪ | 0.1▪ | 0.1▪ | 0.0▪ | 0.1▪ | 0.1▪ |
n=6 replicates for each impurity, Data presented in (mean±SD); ▪% Relative standard deviation
A B
C D
E F
G
Fig. 2: TIC of impurity standards: A-Blank, B-NDEA, C-NDIPA, D-NDMA, E-NEIPA, F-NMBA, G-NMIPA
Table 4: Results for system precision (Area) in precision
| NDMA | NDEA | NMBA | NMIPA | NDIPA | NEIPA |
| 1647757 | 303671 | 434681 | 325926 | 1406216 | 2271702 |
| 1691634 | 304948 | 462296 | 321984 | 1431674 | 2270466 |
| 1557334 | 299437 | 465872 | 315609 | 1392459 | 2235472 |
| 1641760 | 302053 | 482776 | 320981 | 1382505 | 2219916 |
| 1512148 | 295655 | 472255 | 316179 | 1388104 | 2197425 |
| 1587889 | 294911 | 475502 | 313317 | 1387446 | 2238101 |
| 1606420±66119.8 | 300113±4175.9 | 465564±16759.0 | 318999±4744.5 | 1398067±18338.6 | 2238847±28862.9 |
| 4.1▪ | 1.4▪ | 3.6▪ | 1.5▪ | 1.3▪ | 1.3▪ |
n=6 replicates for each impurity, Data presented in (mean±SD); ▪% Relative standard deviation
Intermediate precision
Tables 5 and 6 show that retention periods and peak area for the six nitrosamine impurities (NDMA, NDEA, NMBA, NMIPA, and NEIPA) were properly recorded across six standard injections, and measurements were accurate since the %RSD values for all pollutants were 0.1% to 0.2% and 0.8% to 5.5%, respectively. In unspiked preparations, pollutants were not found as exhibited.
LOD, LOQ establishment
The analytes with the highest sensitivity were NDEA and NMIPA, which had the lowest values at 3.3 and 3.4 ppm, respectively. NDMA and NMBA have reduced sensitivity, as seen in table 7 by their significantly higher LOD values (12.7 and 12.0 ppm). NDEA and NMIPA show improved quantification capability for these analytes with reduced LOQ values (3.4 and 3.3 ppm, respectively). NDMA and NMBA are less accurately quantified at lower concentrations, as their higher LOQ values (36.9 and 36.5 ppm, respectively) suggest.
Linearity
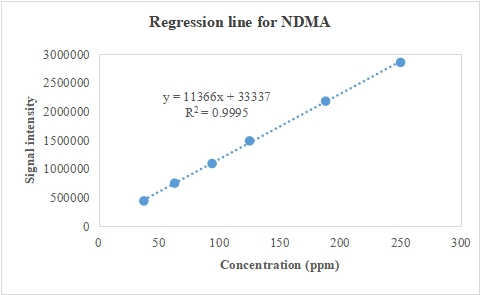
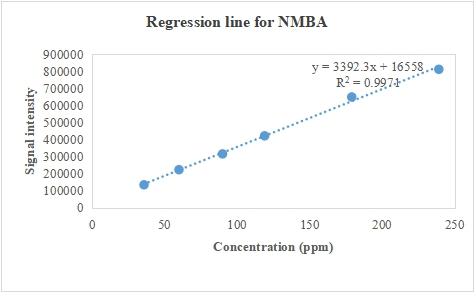
From table 8, we can see that for NDMA, NDEA, NMBA, NMIPA, NDIPA, and NEIPA, there is a very good linear relationship between the concentration of each impurity and its associated peak area throughout the examined range, wherein Baksam et al. reported method for detection of a single nitrosamine impurity [44]. Further evidence as in fig. 3 of strong linearity is the small residual sum of squares, which shows that the data points deviate very little from the regression line, falling inside the bounds.
Table 5: Results for system precision (RT▲) in intermediate precision
| NDMA | NDEA | NMBA | NMIPA | NDIPA | NEIPA |
| 4.46 | 6.44 | 5.12 | 6.32 | 7.67 | 7.12 |
| 4.45 | 6.43 | 5.13 | 6.32 | 7.67 | 7.12 |
| 4.46 | 6.43 | 5.12 | 6.32 | 7.68 | 7.12 |
| 4.46 | 6.44 | 5.12 | 6.33 | 7.68 | 7.13 |
| 4.47 | 6.45 | 5.13 | 6.33 | 7.69 | 7.13 |
| 4.47 | 6.44 | 5.13 | 6.33 | 7.68 | 7.13 |
| 4.46±0.0 | 6.44±0.0 | 5.13±0.0 | 6.33±0.0 | 7.68±0.0 | 7.13±0.0 |
| 0.2▪ | 0.1▪ | 0.1▪ | 0.1▪ | 0.1▪ | 0.1▪ |
n=6 replicates for each impurity, Data presented in (mean±SD); ▪% Relative standard deviation; ▲in min
Table 6: Results for system precision (Area) in intermediate precision
| NDMA | NDEA | NMBA | NMIPA | NDIPA | NEIPA |
| 1652277 | 303522 | 463893 | 325027 | 1395135 | 2211701 |
| 1667913 | 306973 | 425434 | 326151 | 1435701 | 2178375 |
| 1612793 | 312075 | 437059 | 328741 | 1417189 | 2183916 |
| 1593795 | 302188 | 436684 | 327325 | 1415868 | 2180498 |
| 1620847 | 304510 | 417343 | 314462 | 1355915 | 2197932 |
| 1569719 | 304288 | 400026 | 324028 | 1397500 | 2163084 |
| 1619557±36342.3 | 305593±3540.6 | 430073±21553.2 | 324289±5092.9 | 1402885±27368.9 | 2185918±16856.9 |
| 2.2▪ | 1.2▪ | 5.0▪ | 1.6▪ | 2.0▪ | 0.8▪ |
n=6 replicates for each impurity, Data presented in (mean±SD); %RSD; ▪% Relative standard deviation
Table 7: Results for LOD, LOQ Establishment
| Impurityº | LOQ | S/N× | LOD | S/N× |
| ppm | ppm | |||
| NDMA | 36.9 | 14.0 | 12.7 | 4.7 |
| NDEA | 9.9 | 14.5 | 3.4 | 4.5 |
| NMBA | 36.5 | 15.1 | 12.0 | 5.4 |
| NMIPA | 10.0 | 12.9 | 3.3 | 3.7 |
| NDIPA | 9.9 | 13.0 | 3.3 | 3.8 |
| NEIPA | 10.1 | 14.0 | 3.4 | 4.6 |
S/N×-Signal-to-Noise ratio
Table 8: Obtained peak areas for linearity of NDMA NDEA, NMBA, NMIPA, NDIPA, NEIPA
| C | NDMA | C | NMBA | C | NDIPA | NDEA | NMIPA | NEIPA |
| 37.5 | 441173 | 35.9 | 133738 | 10 | 406263 | 88323 | 100093 | 631587 |
| 63 | 751687 | 60 | 222328 | 17 | 677159 | 151262 | 155120 | 1051749 |
| 94 | 1092881 | 90 | 314908 | 25 | 1012846 | 223164 | 248813 | 1601192 |
| 125 | 1487907 | 119 | 420850 | 33 | 1361835 | 297854 | 316885 | 2120967 |
| 188 | 2180313 | 179 | 648753 | 50 | 2026003 | 444691 | 468523 | 3177403 |
| 250 | 2855765 | 239 | 811055 | 66 | 2684513 | 579916 | 607255 | 4165458 |
Concentration in ppm
A
B

C
Fig. 3: Indicator of concentration-peak response relationship for A-NDMA, B-NMBA, C-NDIPA, NDEA, NMIPA, NEIPA
Accuracy
Most impurity recovery values in Tables 9 are within the 85-115% range, which is considered acceptable and shows that the analytical method is accurate at the LOQ and at 200%level. For this particular contaminant, NDMA shows the lowest recovery values (83.7% to 89.1%) at LOQ level, and (88.4-91.8% and 91.7-96.2%, at 200% level respectively) compared to the other impurities as reported by Gopireddy et al. in class of sartans [45]. In comparison, Rao et al. [46] reported recoveries of 90–105% and Remidicherla et al. [47] demonstrated recoveries of 92–104% for nitrosamine impurities in Doxofylline, aligning with trace-level analysis criteria, the current method demonstrates superior sensitivity. Recoveries for the other impurities (NDEA, NMBA, NDIPA, and NEIPA) are more regular and dependable, falling within a tighter range of 91.2% to 102.4% at LOQ and 92.4-101.8% at 200% level inline to criteria.
Batch analysis
Three separate batches, each with two preparations, were tested for the presence of nitrosamine impurities using the developed and validated method. According to table 10, it was found that there were no impurities.
Table 9: Results for each impurity recovery at LOQ (10 ppm) level
| Description | % Recovery | |||||
| NDMA | NDEA | NMBA | NMIPA | NDIPA | NEIPA | |
| Preparation-1 | 91.8 | 100.2 | 97.3 | 94.8 | 96.8 | 97.3 |
| Preparation-2 | 90.8 | 96.4 | 99.8 | 91.7 | 96.2 | 95.8 |
| Preparation-3 | 88.4 | 98.6 | 101.8 | 96.2 | 96.6 | 96.5 |
| Preparation-4 | 90.6 | 96.4 | 95.5 | 93.5 | 93.3 | 96.4 |
| Preparation-5 | 90.8 | 97.7 | 95.9 | 93.9 | 92.4 | 94.0 |
| Preparation-6 | 88.4 | 95.3 | 95.9 | 94.8 | 95.0 | 96.2 |
| Minimum | 88.4 | 95.3 | 95.5 | 91.7 | 92.4 | 94.0 |
| Maximum | 91.8 | 100.2 | 101.8 | 96.2 | 96.8 | 97.3 |
Table 10: Results for batch analysis
| Impurity in ppm | ||||||
| Impurity | Batch A | Batch B | Batch C | |||
| Prep-1 | Prep-2 | Prep-1 | Prep-2 | Prep-1 | Prep-2 | |
| NDMA | NI▲ | NI▲ | NI▲ | NI▲ | NI▲ | NI▲ |
| NDEA | NI▲ | NI▲ | NI▲ | NI▲ | NI▲ | NI▲ |
| NMBA | NI▲ | NI▲ | NI▲ | ND▲ | NI▲ | NI▲ |
| NMIPA | NI▲ | NI▲ | NI▲ | ND▲ | NI▲ | NI▲ |
| NDIPA | ND▲ | NI▲ | NI▲ | ND▲ | NI▲ | NI▲ |
| NEIPA | ND▲ | NI▲ | NI▲ | ND▲ | NI▲ | NI▲ |
▲Not Identified/Detected
CONCLUSION
This is the first ultra-sensitive LC-MS/MS approach for detection of nitrosamines within Tamsulosin, achieving lower LOD and LOQ values compared to existing methods. While numerous methods have been published for nitrosamines in various drug substances, none have been developed to quantify nitrosamines in Tamsulosin using LC-MS/MS. We were able to set up all the necessary validation settings to prove the procedure worked. No detectable levels of the six nitrosamine impurities were observed in the tested Tamsulosin batches. As evidence of the method's sensitive performance, the calculated LOQ (9.9-36.9 ppm) and LOD(3.3-12.7 ppm)values are extremely low for all the nitrosamines. For most nitrosamine contaminants, the recovery data shows satisfactory accuracy at the LOQ and at 200% level. At 0.001% (with respect to test) concentration, the six nitrosamine impurities in Tamsulosin can be routinely quantified using the validated method. Investigating potential matrix effects may provide additional insights on method robustness.
ACKNOWLEDGEMENT
For their kind gifting of Tamsulosin sample and impurity standards, the writers are grateful to Suven Life Sciences Pvt. Ltd., Hyderabad and Clean chem Laboratories LLP, Navi Mumbai, Maharashtra, respectively. At KL University in Vaddeswaram, Guntur, R. Swetha Sri is working on her PhD thesis, which includes this study.
ABBREVIATIONS
Min: Minute; ml: Milli Litre; g: Gram; mg: Milli Gram; µg: Micro Gram; ng: Nano Gram; RSD: Relative Standard Deviation; LOD: Limit Of Detection; LOQ: Limit Of Quantification; LC-MS/MS: Liquid Chromatography Hyphenated With Mass Spectrometry; NDMA: Nitroso Di Methyl Amine; NDEA: Nitroso Di Ethyl Amine; NDIPA: Nitroso Di Iso Propyl Amine; NEIPA: Nitroso Ethyl Iso Propyl Amine; NMBA: Nitroso Methyl Butyric Acid; NMPA: Nitroso Methyl Phenyl Amine; NDBA: Nitroso Di Butyl Amine; ESI: Electron Spray Ionization; API: Active Pharmaceutical Ingredient; S/N: Signal to Noise ratio; USP: United States Pharmacopoeia
AUTHORS CONTRIBUTIONS
SS (Swetha Sri) created the concept, acquired the data, and finished the original draft. AM (Arram Madhavi) procured resources, and NM (Narender Malothu) corrected the data. GC (Guntupalli Chakravathi) oversaw the study. All authors contributed to the completion of the manuscript.
CONFLICTS OF INTERESTS
This study has no competing interests
REFERENCES
United States pharmacopoeia. General Chapter, nitrosamine impurities. USP-NF. Rockville, MD: United States pharmacopoeia; 2022. Available from: doi: 10.31003/uspnf_m15715_02_01.
United States Department of Health and Human Services, Food and Drug Administration. Genotoxic and carcinogenic impurities in drug substances and products: recommended approaches. Silver Spring: United States Department of Health and Human Services, Food and Drug Administration; 2008. Available from: https://www.federalregister.gov/d/E8-29674.
Jih RH, Magendran B, Chakraborty SK, Das AR, Tsay SC, Sheu KW. Process for preparation of tamsulosin and its derivatives. European patent EP1734036A1; 2005.
Guideline IH. Assessment and control of DNA reactive (mutagenic) impurities in pharmaceuticals to limit potential carcinogenic risk M7. International conference on harmonization of technical requirements for registration of pharmaceuticals for human use (ICH): Geneva; 2014. doi: 10.1002/9781119551249.ch2.
Mirvish SS. Formation of N-nitroso compounds: chemistry, kinetics, and in vivo occurrence. Toxicol Appl Pharmacol. 1975;31(3):325-51. doi: 10.1016/0041-008X(75)90255-0, PMID 238307.
Mitch WA, Sedlak DL. Formation of N-nitrosodimethylamine (NDMA) from dimethylamine during chlorination. Environ Sci Technol. 2002;36(4):588-95. doi: 10.1021/es010684q, PMID 11878371.
US Food and Drug Administration. FDA Updates and Press Announcements on Angiotensin II Receptor Blocker (ARB) Recalls (Valsartan, Losartan, and Irbesartan). Silver Spring, (MD): United States Food and Drug Administration; 2019. doi: 10.1002/9781119551249.
European Medicines Agency. Update on review of valsartan medicines following detection of impurity in active substance, EMA/485921/2018. London: European Medicines Agency; 2018.
European Medicines Agency. EMA review of impurities in sartan medicines. EMA/643116/2018. London: European Medicines Agency; 2018.
US Food and Drug Administration. Control of nitrosamine impurities in human drugs: guidance for industry. Silver Spring, (MD): United States Food and Drug Administration; 2021. Available from: https://www.fda.gov/media/141720/download.
Nadendla RR, Mounika M, Ranjithadubba VS, Jahnavi M, Sowjanyasonti S, Yakshithayarra Y. Development and verification of UV spectrophotometric technique for determining N-acetylcysteine in tablet formulations. Int J Pharm Pharm Sci. 2024 Jun 11;16(10):30-5. doi: 10.22159/ijpps.2024v16i10.51004.
Bari SB, Bakshi AR, Jain PS, Surana SJ. Application of UV-spectroscopy and first order derivative method for determination of tamsulosin hydrochloride in bulk and tablets. Pharm Anal Acta. 2011;2(2):1-2. doi: 10.4172/2153-2435.1000120.
Gadhave NA, Ghante MR, Nikam AD, Sawant SD. Simultaneous estimation of tamsulosin hydrochloride and finasteride in combined dosage form by UV spectroscopy method. J Pharm Res. 2011;4(8):2672-4.
Puranik M, Shambharkar S, Nimbalkar S, Mahapatra DK. Comparison of UV-spectrophotometric and RP-HPLC methods for estimation of deflazacort in solid dosage form. J Appl Pharm Sci. 2020 Jul 4;10(07):82-8. doi: 10.7324/JAPS.2020.10711.
El-Henawee MM, Abd El-Hay SS, Attala K, Eissa MS. Smart UV spectrophotometric methods based on simple mathematical filtration and classical methods for the simultaneous determination of tamsulosin and solifenacin: a comparative study of efficacy and spectral resolution. Spectrochim Acta A Mol Biomol Spectrosc. 2021 Feb 15;247:119151. doi: 10.1016/j.saa.2020.119151, PMID 33188970.
Mhaske PD, Bohari BA, Chaudhari SR, Jain PS, Shirkhedkar AA. Implementation UV-spectrophotometry approach for determination of tamsulosin HCl in tablets using area under curve technique. Asian Jour Pharmac Anal. 2020 May 7;10(2):86-90. doi: 10.5958/2231-5675.2020.00015.0.
Amanlou M, Ghazi Moghadam A, Barazandeh Tehrani M, Souri E. Validated spectrophtometric method for determination of tamsulosin in bulk and pharmaceutical dosage forms. Iran J Pharm Res. 2014;13(1):81-6. PMID 24734058, PMCID PMC3985241.
Rezk MR, Tantawy MA, Wadie M, Weshahy SA. Smart spectrophotometric assessment of tamsulosin hydrochloride and tadalafil in their new pharmaceutical formulation for treatment of benign prostatic hyperplasia and erectile dysfunction. Spectrochim Acta A Mol Biomol Spectrosc. 2020 Feb 15;227:117547. doi: 10.1016/j.saa.2019.117547, PMID 31734571.
Thimmaraju MK, Rao V, Gurrala S, Reddy GJ. UV spectrophotometric method for simultaneous determination of finasteride and tamsulosin in combined dosage form. Int J Pharm Biol Sci. 2011;1(3):303-10.
Rani GD, Rao CN, Rao CN, Venkateswarlu P. Development and validation of ultraviolet-spectrophotometric method for the determination of tamsulosin. Indian J Adv Chem Sci. 2015;3(4):323-7.
Chandorkar JG, Kotwal VB, Dhande NS, Gurav SG, Pande VV, Yadav PV. A sensitive HPLC method for simultaneous estimation of tamsulosin hydrochloride and its impurity. Pak J Pharm Sci. 2008 Jul 1;21(3):307-10. PMID 18614430.
TA, RP, Tirunagari M, Buggana SJ, Mitta C, Remidicherla SS. QbD-driven approach to cleaning method development and validation for darunavir analysis in oral films. Int J Pharm Qual Assur. 2024 Aug 31;15(3):1575-80. doi: 10.25258/ijpqa.15.3.72.
Jothula H, Navuluri S, Mulakayala NR. Stability based HPLC method for cyclophosphamide related substances in finished drug products: development and validation. Int J Curr Pharm Sci. 2024 May 1;16(3):42-51. doi: 10.22159/ijcpr.2024v16i3.4061.
Sawant V, Mali C, jain V. Development and validation of novel RP-HPLC method for the simultaneous estimation of salicylic acid and beclomethasone dipropionate in a topical ointment dosage form. Asian J Pharm Clin Res. 2024;17(1):125-8. doi: 10.22159/ajpcr.2024.v17i1.48682.
Sangshetti J, Chivte DK, Anees MI, Langade M, Khan F, Zainuddin R. Development of HPLC method for determination of tamsulosin using quality by design (QbD) approach. Eur Chem Bull. 2019;8(12):409-15. doi: 10.17628/ecb.2019.8.409-415.
Kumari R, Dash PP, Lal VK, Mishra A, Murthy PN. RP-HPLC method for the estimation of tamsulosin hydrochloride in tablet dosage form. Indian J Pharm Sci. 2010 Nov;72(6):785-7. doi: 10.4103/0250-474X.84596, PMID 21969754, PMCID PMC3178983.
Din L, Li L, Tao P, Yang J, Zhang Z. Quantitation of tamsulosin in human plasma by liquid chromatography–electrospray ionization mass spectrometry. J Chromatogr B Analyt Technol Biomed Life Sci. 2002 Feb 5;767(1):75-81. doi: 10.1016/s0378-4347(01)00546-1, PMID 11863298.
Upreti R, Homer NZ, Naredo G, Cobice DF, Hughes KA, Stewart LH. Measurement of tamsulosin in human serum by liquid chromatography-tandem mass spectrometry. J Chromatogr B Analyt Technol Biomed Life Sci. 2013 Jul 1;930:121-8. doi: 10.1016/j.jchromb.2013.04.020, PMID 23743242.
Sunil Mahajan B, Miniyar PB. Identification, separation, and characterization of degradation products of triamcinolone hexacetonide using LC and LC-MS/MS. Int J App Pharm. 2024 Mar 1;16(3):326-31. doi: 10.22159/ijap.2024v16i3.50122.
Mohamed D, Mowaka S, Mostafa A. Simultaneous quantitative analysis of tamsulosin and finasteride in pharmaceutical dosage form by U-HPLC tandem mass spectrometry. Eur J Chem. 2014;5(1):181-5. doi: 10.5155/eurjchem.5.1.181-185.942.
Nageswara Rao R, Kumar Talluri MV, Narasa Raju A, Shinde DD, Ramanjaneyulu GS. Development of a validated RP-LC/ESI-MS-MS method for separation, identification and determination of related substances of tamsulosin in bulk drugs and formulations. J Pharm Biomed Anal. 2008;46(1):94-103. doi: 10.1016/j.jpba.2007.09.009, PMID 17951020.
Matsushima H, Takanuki KI, Kamimura H, Watanabe T, Higuchi S. Highly sensitive method for the determination of tamsulosin hydrochloride in human plasma dialysate, plasma and urine by high-performance liquid chromatography–electrospray tandem mass spectrometry. J Chromatogr B Biomed Sci Appl. 1997 Aug 1;695(2):317-27. doi: 10.1016/s0378-4347(97)00200-4, PMID 9300868.
Ramakrishna NV, Vishwottam KN, Manoj S, Koteshwara M, Wishu S, Varma DP. Rapid, simple and highly sensitive LC-ESI-MS/MS method for the quantification of tamsulosin in human plasma. Biomed Chromatogr. 2005 Dec;19(10):709-19. doi: 10.1002/bmc.498, PMID 15828055.
Patel DB, Patel NJ. Validated stability indicating HPTLC method for the determination of tamsulosin hydrochloride in pharmaceutical dosage forms. Int J Chem Tech Res. 2010 Jan;2(1):646-52.
Choudhari VP, Nikalje AP. Stability-indicating HPTLC method for the determination of tamsulosin in pharmaceutical dosage forms. Chromatographia. 2009 Jun;69(11-12):1463-7. doi: 10.1365/s10337-009-1060-9.
El-Kimary EI, Khamis EF, Belal SF, Abdel Moneim MM. Novel validated HPTLC method for the analysis of two binary mixtures containing tamsulosin hydrochloride with antimuscarinic agents. J Chromatogr Sci. 2018 Jan 1;56(1):81-91. doi: 10.1093/chromsci/bmx081, PMID 28977351.
Patel DB, Patel NJ. Validated reversed-phase high-performance liquid chromatographic and high-performance thin-layer chromatographic methods for simultaneous analysis of tamsulosin hydrochloride and dutasteride in pharmaceutical dosage forms. Acta Chromatogr. 2010 Sep 1;22(3):419-31. doi: 10.1556/AChrom.22.2010.3.6.
Abou El-Alamin MM, Toubar SS, Mohamed DA, Helmy MI. Development of Green HPTLC method for simultaneous determination of a promising combination tamsulosin and mirabegron: stability-indicating assay was examined. BMC Chem. 2023 Sep 30;17(1):130. doi: 10.1186/s13065-023-01043-9, PMID 37777770.
Tuesuwan B, Vongsutilers V. Current threat of nitrosamines in pharmaceuticals and scientific strategies for risk mitigation. J Pharm Sci. 2023 May 1;112(5):1192-209. doi: 10.1016/j.xphs.2023.01.028, PMID 36739905.
Chidella KS, Dasari VB, Anireddy J. Ultra-sensitive LC-MS/MS method for the trace level quantification of six potential genotoxic nitrosamine impurities in telmisartan. Am J Anal Chem. 2021 Jun 10;12(6):227-40. doi: 10.4236/ajac.2021.126014.
Remidicherla SS, Chakravarthi G, Reddy AR, Reddy AR, Rao GK. Method development and validation for quantification of imatinib mesylate spiked in vitro saliva by LC-MS/MS. Indian Drugs. 2024 Apr;61(4):46-56. doi: 10.53879/id.61.04.13917.
Khorolskiy M, Ramenskaya G, Vlasov A, Perederyaev O, Maslennikova N. Development and validation of four nitrosamine impurities determination method in medicines of valsartan, losartan, and irbesartan with HPLC-MS/MS (APCI). Iran J Pharm Res. 2021;20(3):541-52. doi: 10.22037/ijpr.2021.115102.15195, PMID 34904007, PMCID PMC8653666.
Öncü T, Yüksel B, Binay E, Şen N. LC-MS/MS Investigation of nitrosamine impurities in certain Sartan group medicinal products available in Istanbul, Türkiye. Ann Pharm Fr. 2024;82(1):72-83. doi: 10.1016/j.pharma.2023.08.002, PMID 37567559.
Baksam VK, Saritha N, Devineni SR, Jain M, Kumar P, Shandilya S. A critical n-nitrosamine impurity of anticoagulant drug, rivaroxaban: synthesis, characterization, development of LC–MS/MS method for nanogram level quantification. Chromatographia. 2022;85(1):73-82. doi: 10.1007/s10337-021-04115-x.
Gopireddy RR, Maruthapillai A, Mahapatra S. A multi-analyte LC-MS/MS method for determination and quantification of six nitrosamine impurities in sartans like azilsartan, valsartan, telmisartan, olmesartan, losartan and irbesartan. J Chromatogr Sci. 2024;62(2):147-67. doi: 10.1093/chromsci/bmac059, PMID 35830866.
Rao AA, Kumar KP, Rao AN, Malothu N, Kumar Desu BP, Bandaru NR. Rapid quantitative estimation of glipizide and sitagliptin in rat plasma by liquid chromatography and mass spectroscopy (LC-MS). Res J Pharm Technol. 2022;15(4):1675-9. doi: 10.52711/0974-360X.2022.00280.
Remidicherla SS, Chakravarthi G, Malothu N. A validated LC-MS/MS method for determination at trace level of nitrosamine impurities in doxofylline API. Indian J Pharm Educ Res. 2024;58(4s):s1262-70. doi: 10.5530/ijper.58.4s.121.