
Int J App Pharm, Vol 17, Issue 2, 2025, 441-448Original Article
DEVELOPMENT OF LACIDIPINE TRANSFEROSOMAL FORMULATIONS FOR TRANSDERMAL DELIVERY: IN VIVO CHARACTERIZATION IN RATS
SARITHA DUNAKA, KRISHNAVENI JANAPAREDDI*
Department of Pharmaceutics, University College of Pharmaceutical Sciences, Kakatiya University, Warangal-506009, Telangana, India
*Corresponding author: Krishnaveni Janapareddi; *Email: jkrishnaveni@kakatiya.ac.in
Received: 01 Oct 2024, Revised and Accepted: 21 Dec 2024
ABSTRACT
Objective: Lacidipine is a calcium channel blocker prescribed to treat hypertension. Due to first-pass metabolism, the drug has low bioavailability via oral route. The present research aims to enhance bioavailability by developing lacidipine-loaded transferosomes for transdermal delivery and evaluate their efficacy in a rat model.
Methods: Transferosomes were prepared by thin film hydration technique and characterized for physicochemical properties. Permeation studies across rat skin were carried out using Franz diffusion cells. Pharmacodynamic and Pharmacokinetic studies were conducted on male Wister rats. The optimized transferosomal formulation (F3L) contains soya lecithin, tween 80 and drug in proportion of 85:15:4 with labrasol (2%) as permeation enhancer.
Results: The optimized formulation exhibited a vesicle size of 132.6 nm, Polydispersity index (PDI) of 0.174, zeta potential of-33.7 mV and entrapment efficiency 97.5%. The steady-state flux of optimized formulation (F3L) and drug suspension was 83.1µg/cm2/h and 16.9 µg/cm2/h, respectively. The flux of F3L was significantly high (P<0.0001,4.92 times) compared with drug suspension. Scanning electron microscopic images showed spherical-shaped transferosomes. The antihypertensive activity was carried out in fructose-induced rats by tail cuff method. The transferosomal formulation F3L significantly decreased systolic blood pressure (P<0.0001) compared to an oral drug suspension. The antihypertensive effect of transdermal formulation was sustained for up to 24 h. The bioavailability of optimized transferosomal formulation was 3.37 folds compared to oral lacidipine suspension. The histopathological study confirmed the safety of transferosomes.
Conclusion: The results confirmed the potential advantage of employing transferosomes as suitable nanocarriers for the transdermal delivery of lacidipine.
Keywords: Lacidipine, Transdermal drug delivery, Transferosomes, Ex-vivo permeation, Pharmacodynamic activity, Pharmacokinetic activity
© 2025 The Authors. Published by Innovare Academic Sciences Pvt Ltd. This is an open access article under the CC BY license (https://creativecommons.org/licenses/by/4.0/)
DOI: https://dx.doi.org/10.22159/ijap.2025v17i2.52830 Journal homepage: https://innovareacademics.in/journals/index.php/ijap
INTRODUCTION
Hypertension is a chronic condition characterized by persistent elevation of arterial blood pressure above 140/90. Untreated chronic high Blood Pressure (BP) leads to complications like stroke and atherosclerosis. Several factors, such as obesity, physical inactivity, age, high cholesterol levels and blood sugar levels, contribute to the development of hypertension [1, 2]. Patients with hypertension require long-term treatment [3]. However, some drugs undergo first-pass metabolism, resulting in less oral bioavailability. Such medications are attractive candidates for creating transdermal formulations [4].
Lacidipine is a dihydropyridine calcium channel blocker prescribed to treat hypertension [5]. Lacidipine acts by relaxing arteries, allowing blood to flow more freely, thereby decreasing blood pressure. It has low oral bioavailability (10%) due to first-pass metabolism [6]. A novel delivery system must be developed to improve bioavailability and deliver the drug in effective concentrations. Several drug delivery techniques have been investigated to address many shortcomings of conventional oral dosage forms [4]. Among these, transdermal delivery for systemic action avoids first-pass metabolism, the common problem of oral route.
Transdermal delivery minimizes fluctuations in drug concentration and also prolongs the duration of action [7]. The stratum corneum, the outer layer of skin, restricts the passage of many drugs across the skin. To increase permeability, many techniques such as iontophoresis, the use of penetration enhancers, microemulsions, colloidal nanocarriers (liposomes and pro liposomes) and non-ionic surfactant carriers (niosomes) have been studied [8-10]. Among the nanocarriers, microemulsions had limited drug-loading capacity. Niosomes cause hydrolysis of the loaded drug upon storage. Liposomes and pro liposomes usually remain confined to the surface of the skin and, therefore, do not transport drugs efficiently through the skin. To overcome the problems and to improve drug penetration, a special type of nanovesicles called transferosomes was developed by Cevc in 1996 [11].
Transferosomes are ultra-deformable vesicular carrier systems consisting of phosphatidylcholine (vesicle-forming component) and an edge activator (surfactant) responsible for membrane flexibility [12]. They squeeze themselves along the intercellular lipids of the stratum corneum without losing vesicular integrity and improve skin penetration. Flexibility or elasticity of transferosomal membrane was obtained by proper selection of lipid and edge activators in precise ratios. The flexibility of the transferosomal membrane reduces the vesicle disruption in the skin and enables it to traverse through the stratum corneum due to natural water gradient. Flexible membrane enables them to cross various transport barriers efficiently [13, 14].
In this study, transferosomal nanocarriers of lacidipine were employed transdermally to improve systemic bioavailability and therapeutic efficacy. The transferosomes were evaluated for zeta size, PDI and zeta potential. Permeability of the drug across the isolated epidermal layer of rat abdominal skin was performed using vertical Franz diffusion cells. Pharmacodynamic and pharmacokinetic studies were carried out in male Wister rats and compared with drug suspension administered orally. The skin irritation potential of lacidipine transferosomes was evaluated on male Wister rats.
MATERIALS AND METHODS
Lacidipine is a gift sample provided by Dr. Reddy’s laboratories Hyderabad. Soya lecithin was purchased from Tokyo chemical industry, Japan. Tween 80, Tween 20 and dimethyl sulfoxide were purchased from SD Fine Chemicals. Labrasol was purchased from HI Media, Mumbai, India. Methanol, chloroform and dichloromethane are of HPLC grade from Merk, Mumbai, India.
Estimation of lacidipine by UV method
Accurately weighed drug was taken in a volumetric flask, dissolved in methanol and made up to the volume with pH 7.4 Phosphate buffer saline to get stock solution (1 mg/ml). Serial dilutions were made using the stock solution to get concentrations of 2-16 μg/ml. The absorbance was measured at a wavelength of 240 nm using a UV-visible spectrophotometer (Shimadzu UV 3000+). A standard graph was plotted [15].
High-performance liquid chromatography (HPLC)
Plasma samples after extraction were analyzed using HPLC method, as described by Guan J, Huan X, et al. (2019). Lacidipine was extracted from plasma samples by protein precipitation method.100 µl** of plasma and 100 µl** of felodipine solution (internal standard, 0.5µg/ml) were taken in a 2 ml Eppendorf tube. Plasma proteins were precipitated by adding 500 µl** of mobile phase (acetonitrile: water; 83:17) to the above sample and vortexed for 2 min. The sample was subjected to centrifugation at 5000 rpm for 20 min. The supernatant was collected and filtered using syringe filters (0.22 μm). 20 μl of filtrate was injected into C18 column (250 x 4.6 mm, Merk). The flow rate was 0.8 ml/min and the detection wavelength was 240 nm. Dilutions of lacidipine were made from the stock solution (1 mg/ml) to get concentrations 0.05, 0.1, 0.2, 0.5, 1, 2, 4, 6 and 8 μg/ml. A calibration curve was plotted between peak area ratio (drug/internal standard) and concentration [16, 17].
Preparation of transferosomal formulation
Transferosomes were developed by the film hydration technique [18]. The composition of formulations is given in table 1. Edge activators (surfactants), tween 20 and tween 80 were screened at different concentrations [19]. Transferosomal formulations were prepared by mixing the phospholipid with an edge activator and permeation enhancer in a boiling tube [20]. The drug was dissolved in a mixture of chloroform and methanol and added to the lipid mixture, vortexed to get a clear solution. The mixture was evaporated on a rotary flash evaporator (Hei Dolph EMEA Rotavapor®-210, Zurich, Switzerland) at 45 °C and 80 rpm under reduced pressure to form a thin film. Phosphate buffer (pH 6.8) was added to the dried film and hydrated for 30 min at 60 rpm at room temperature. The transferosomal formulation so formed was probe sonicated at 33% amplitude for 3 min (Bandelin Electronic GmbH and Co. KG, Berlin) to reduce the size of transferosomes.
Table 1: Composition of transferosomal formulations of lacidipine (for 1 ml)
| Ingredients | Formulation code | |||||||||
| F1 | F2 | F3 | F4 | F5 | F6 | F7 | F8 | F9 | F10 | |
| Lacidipine(mg/ml) | 4 | 4 | 4 | 4 | 4 | 4 | 4 | 4 | 4 | 4 |
| Soya lecithin (mg/ml) | 95 | 90 | 85 | 80 | 75 | 95 | 90 | 85 | 80 | 75 |
| Tween 80(mg/ml) | 5 | 10 | 15 | 20 | 25 | - | - | - | - | - |
| Tween 20(mg/ml) | - | - | - | - | - | 5 | 10 | 15 | 20 | 25 |
| Chloroform: Methanol (2:1) ml | 3 | 3 | 3 | 3 | 3 | 3 | 3 | 3 | 3 | 3 |
| Phosphate buffer (pH 6.8) ml | 1 | 1 | 1 | 1 | 1 | 1 | 1 | 1 | 1 | 1 |
Preparation of transferosomal gel
Carbopol gel was prepared by adding carbopol 934 (1.5%w/v) to distilled water under continuous agitation on a magnetic stirrer and neutralized to pH 7 using triethanolamine [18]. Transferosomal formulation was incorporated into carbopol gel under continuous mixing.
Characterization of transferosomes
Vesicle size, polydispersity index and zeta potential were determined on 50 times diluted sample using Zeta sizer (Nano-ZS 90, Malvern Instruments Ltd. UK). Zeta size was measured at a light scattering angle of 90. An average of three readings was noted [21, 22].
Drug content
The formulation equivalent to 4 mg of lacidipine was taken in a volumetric flask (10 ml) and made up to volume with methanol. After suitable dilution, the amount of lacidipine was estimated by UV method [21, 23].
Drug entrapment efficiency
About 2 ml of the formulation was placed in a centrisort tube and centrifuged for 30 min at 13,000 rpm in a cooling centrifuge (Biofuge, Heraeus Fresco, Germany). The supernatant was collected and estimated by UV technique [22, 24].
Entrapment efficiency  ×100
×100
Fourier transform infrared spectroscopy (FTIR)
FTIR spectroscopy (Bruker FT-IR Tensor 27) is used for the characterization of lacidipine pure drug and optimized formulation. The spectrum of the pure drug was obtained by the KBr disc method and optimized formulation by the Attenuated total reflectance (ATR) method. The spectra were acquired in a frequency range of 4000-400 cm-1. The resulting spectra were compared and analyzed to identify the peaks corresponding to the functional groups [18, 25].
Scanning electron microscopy (SEM)
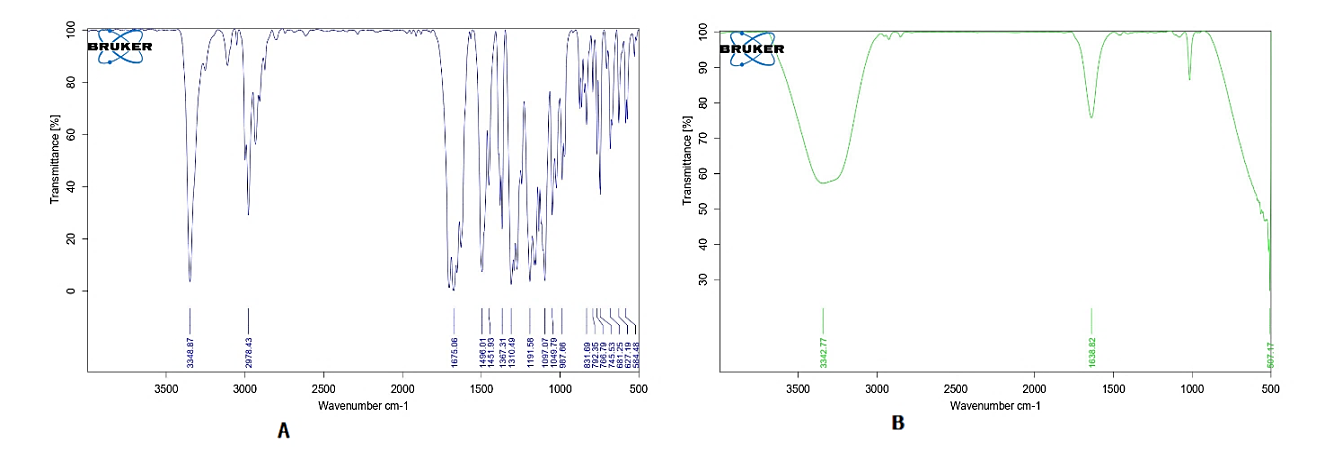
The morphology of transferosomes was observed using scanning electron microscope (SEM; JSM-6510, Japan). The formulation was spread on an aluminum stub precoated with silver glue and air-dried under a high vacuum. SEM images were taken [25].
Measurement of viscosity and pH
The pH of all transferosomal formulations was measured using a digital pH meter (Elico, LI120 India). The viscosity of the transferosomal gel (F3LG) was measured using a Brookfield viscometer with spindle no.64 at 20 rpm [18, 26].
Ex-vivo permeation studies
Drug permeation across the rat epidermis was studied using vertical Franz diffusion cells [27]. The abdominal skin of sacrificed male Wister rats was shaved using an electrical trimmer. The skin was excised and the epidermal layer was isolated by immersing the skin in water at 60 °C for 45 sec (heat shock method) [28]. The epidermal layer was hydrated in phosphate buffer saline of pH 7.4 for 1hr before the study. Phosphate buffer was filled into the receptor cell. The isolated epidermis was placed above the donor cell with the stratum corneum pointing upwards. Formulation/drug suspension equivalent to 4 mg of lacidipine was filled into the donor cell. The fluid in the receptor cell was agitated at 200 rpm speed on a magnetic stirrer. Samples (2 ml) were collected at specified intervals, replaced with fresh buffer and analyzed by UV method. [29]. The following equation calculates the cumulative quantity of lacidipine permeated at any given time.
n-1
Qn = [CnV+ΣCiS]
i=1
Qn= Cumulative drug permeated at nth time
Cn= Concentration of the drug (μg/ml) at time point ‘n’
V= Donor cell volume in ml
ΣCiS = Sum of concentration of the sample (at sampling points 1 to n-1) multiplied by sample volume (s)
A graph was plotted between drug permeated (μg) versus time (h). Steady-state flux (JSS), Permeability coefficient (Kp) and Enhancement ratio (ER) were calculated using the following formulae.
JSS (mg/cm2/h)
Kp  (cm/h)
ER 
In vivo evaluation
Pharmacokinetic parameters and pharmacodynamic activity of optimized formulations were evaluated in a rat model. The approval for the conduct of animal studies was obtained from the Institutional Animal Ethical Committee Kakatiya University. Vide No-IAEC/08/UCPSc/KU/2022. Male Wistar rats, weighing between 200g to 250g were purchased from Vyas Labs, Hyderabad, India. A standard pellet diet and drinking water were given to the animals. The rats were acclimatized to a temperature of 22±2 °C, 12h light and dark cycle and an RH of 55–65% for seven days [27]. A day before treatment, hair on the dorsal side of rat was trimmed off with an electric clipper and a 2 cm2 area was marked. A measured formulation/drug suspension was transferred onto the marked area using a micropipette and evenly spread over the area with the help of a glass rod.
Pharmacodynamic study by non-invasive blood pressure system (NIBP)
The antihypertensive activity was carried out in Wister rats using a Non-Invasive Blood Pressure system (NIBP 200 A; Biopic System, Inc., Goleta, CA, USA) based on the tail-cuff method [22, 30]. The rats were housed in a restrainer by keeping the tail outside. A pneumatic pulse sensor cuff was attached to the tail of the rat to measure its systolic blood pressure. The systolic BP was recorded three times for each rat, and the mean was calculated.
Male Wistar rats were made into 7 groups, each housing 6 rats. Group A (negative control) received normal drinking water. Hypertension was induced in all groups except negative control by placing 10% fructose water for 2 w instead of drinking water [31, 32]. After two weeks, rats with a mean systolic blood pressure of 175-178 mm Hg were chosen for the study. Fructose water was removed during treatment and supplied with normal drinking water. Group B (hypertensive positive control) did not receive any treatment. Groups C and D were treated with drug suspension and marketed formulation (Lacidip® 4 mg tablet), respectively through the oral route. Groups E, F, and G received formulations F3, F3L and F3LG respectively via the transdermal route. The lacidipine at a dose of 4 mg/kg body weight was administered to the groups. After treatment, the systolic BP was determined at time intervals (1, 2, 4, 6, 8, 12,24,48,72 and 96 h) by tail-cuff method. Statistical significance was computed using Graph Pad Prism software, Version 9.5.1 [33].
Percentage reduction in systolic blood pressure was calculated by:
Percentage reduction in systolic BP at nthh 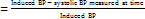 ×100
×100
Pharmacokinetic study
Pharmacokinetic study was conducted in male Wistar rats weighing between 200-250g. The rats were separated into five groups each containing six. Animals were kept fasting overnight before the study. Group A was treated with oral drug suspension and Group B received marketed formulation orally at a dose of 4 mg/kg. Groups C, D and E were subjected to transdermal treatment (4 mg/kg) with formulations F3, F3L and gel (F3LG), respectively. Blood samples (0.5 ml) were collected via retro-orbital vein puncture into EDTA-coated vacutainers at specified time points (0.5, 1, 2, 3, 4, 8, 12, and 24 h) and centrifuged for 20 min at 5,000 rpm. Plasma was separated and preserved at-20 C until analysis [30, 34, 35]. Lacidipine was extracted from plasma samples as described in the methodology [16, 17]. Pharmacokinetic parameters such as Cmax, Tmax, AUCtotal, T1/2 and MRT were calculated using Kinetica software 2000 (version 5.0, Inna phase Corporation, Philadelphia, PA). The statistical significance ‘P’ value was determined using Graph Pad Prism (version 9.5.1). P value<0.01 is considered statistically significant.
Skin irritation and histopathological study
The histopathology of formulation-treated skin was studied in comparison to control. The rats were made into five groups of 3 rats each. Group A is kept as control. Group B (positive control) was treated with a 5% Sodium Lauryl Sulfate (SLS) solution. Groups C, D and E were treated with optimized formulations F3, F3L and transferosomal gel (F3LG), respectively. The treatment was applied twice daily at 3 h intervals for 5 d at a 4 mg/kg dose. After 5 d of treatment, the skin was visually inspected for redness and edema. The skin from treated areas was removed and preserved in a 10% formalin solution. The slides were prepared, stained with hematoxylin and eosin and examined under microscope [33, 36].
RESULTS AND DISCUSSION
The calibration curves of UV and HPLC methods showed good linearity with R2 values of 0.999 and 0.998, respectively.
The transferosomal formulations were optimized by varying concentrations of phospholipid and edge activator between 75-95% and 5-25%, respectively [21]. The prepared transferosomes appeared as milky white.
Characterization of transferosomes
The mean vesicle size, PDI and zeta potential of transferosomal formulations are shown in table 2. Formulations with tween 80 (F1 to F5) showed significantly low vesicle size (below 250 nm) compared to tween 20 formulations (F6 to F10). A longer hydrocarbon chain in tween 80 contributes to generating small vesicles. Similar observations were reported by G. F. Balata et al. [26]. Formulations containing tween 80 showed significantly high zeta potential values (-19 to-41) compared to tween 20 formulations, indicates good stability. This is due to the low HLB value (15) of Tween 80. It can effectively interact with the lipid bilayer and stabilize transferosomes. This was in agreement with Promod et al. [37]. A polydispersity index lower than 0.2 indicates more uniform size distribution [20]. The formulations F1 to F5 were evaluated further for drug content and entrapment efficiency. The results are given in table 2. The entrapment efficiencies of formulations F1 to F5 were found to be between 90.5% to 96.6%. There was no significant increase in entrapment efficiency. The mean vesicle size of formulations F1 to F5 ranged from 155 nm to 235 nm and formulations F6 to F10 ranged from 265 nm to 462 nm. The vesicle size decreased as the surfactant concentration increased from 5% to 15%, and a further increase in surfactant concentration from 15%to25% increased the particle size. This could be attributed to micelle formation at high surfactant concentrations. The observation is in compliance with earlier reports [21]. Formulations F1 to F5 exhibited zeta potential between-19 to-41mV, indicating good stability. The pH of transferosomal formulations ranged between 6.12 and 6.47.
Formulation F3, showed the smallest vesicle size (155.9 nm), low PDI (0.199), zeta potential (-36.1) and flux (69.3 μg/cm2/h). Hence it was selected for further evaluation.
Transferosomes with permeation enhancer
The effect of labrasol (2%) as permeation enhancer was studied. The formulation with labrasol (F3L) showed significantly high permeation compared to other formulations [20]. The optimized formulation F3L was converted to transferosomal gel (F3LG) by adding it to gel of Carbopol 934 (1.5%). The viscosity of gel was found to be 195 mPas.
FTIR
The FTIR spectra of lacidipine and transferosomal formulation (F3L) were shown in fig. 1A and 1B. The functional group peaks observed in the spectrum of pure drug at 3348.87 cm-1(-NH) and 1675.0 6 cm-1 (-C=C) were also observed in transferosomal formulation. This implies that the lacidipine is compatible with the excipients used in the preparation of transferosomes [24].
SEM
Scanning electron micrograph images of optimized formulation F3L are shown in fig. 2. The vesicle surface was smooth and most vesicles are elongated in shape [19].
Table 2: Characterization of transferosomal formulations
| Formulation code | Soya lecithin: edge activator | Vesicle size (nm) | PDI | ZP (mV) | DC (%) | EE (%) |
| F1 | 95:5 | 235.2±3.235 | 0.315±0.12 | -23.5±1.26 | 98.7±0.74 | 91.5±1.63 |
| F2 | 90:10 | 175.6±2.246 | 0.279±0.17 | -28.9±0.96 | 99.1±1.96 | 92.9±0.87 |
| F3 | 85:15 | 155.9±1.315 | 0.199±0.03 | -36.1±0.64 | 99.4 ±0.92 | 96.6±0.51 |
| F4 | 80:20 | 197.6±1.614 | 0.325±0.09 | -19.8±0.91 | 98.9±0.89 | 92.1±1.54 |
| F5 | 75:25 | 200.6±2.515 | 0.295±0.07 | -41.4±1.32 | 98.2±0.91 | 90.5±0.95 |
| F6 | 95:5 | 336.9±3.515 | 0.416±0.26 | -9.5±1.45 | - | - |
| F7 | 90:10 | 272.8±2.169 | 0.336±0.13 | -11.2±1.98 | - | - |
| F8 | 85:15 | 265.6±1.791 | 0.342±0.25 | -13.6±2.13 | - | - |
| F9 | 80:20 | 391.2±2.134 | 0.321±0.12 | -11.6±0.98 | - | - |
| F10 | 75:25 | 462.3±1.543 | 0.331±0.18 | -10.9±1.76 | - | - |
| F3L | 85:15(F3)+labrasol (2%) | 132.6±1.356 | 0.174±0.05 | -33.7±0.95 | 99.6±0.76 | 97.5±0.74 |
Note: Formulations F1 to F5 contain tween 80 and F6 to F10 contain tween 20 as edge activator, ZP: Zeta potential; DC: Drug content; EE: Entrapment efficiency, Data expressed as mean±SD, n=3.
1A. Pure drug 1B. Optimized transferosomal formulation (F3L
Fig. 1: FT-IR spectra showing the characteristic peaks of various functional groups present in drug in terms of wave number
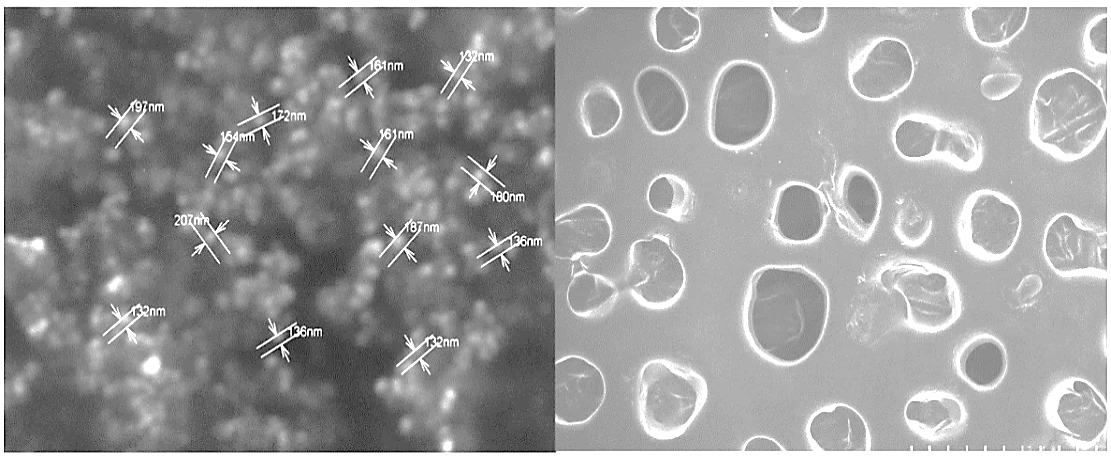
Fig. 2: SEM image of optimized lacidipine transferosomes (F3L) represents the size, shape and surface of transferosomes
Table 3: Ex-vivo permeation parameters of transferosomal formulations and drug suspension
| Formulation code | JSS μg/cm2/h | KP*10−3 cm/h | ER |
| F1 | 49.2±1.4 | 12.3±2.8 | 2.92 |
| F2 | 55.8±1.8 | 13.9±2.4 | 3.31 |
| F3 | 69.3±2.3 | 17.3±1.7 | 4.11 |
| F4 | 51.7±2.1 | 12.9±1.5 | 3.07 |
| F5 | 40.5±2.7 | 10.1±1.8 | 2.41 |
| F3L | 83.1±1.9 | 20.7±2.6 | 4.92 |
| F3LG(gel) | 57.9±1.3 | 14.4±2.5 | 3.42 |
| DS | 16.9±1.1 | 4.2±2.9 | 1 |
Note: DS: Drug suspended in carboxy methyl cellulose (4 mg/ml); JSS: Steady state flux; Kp: Permeation coefficient; ER: Enhancement ratio. Data expressed as mean±SD, n=3.
Permeation across isolated rat epidermis
The permeation profiles of transferosomal formulations and drug suspension are shown in fig. 3. The results are given in table 3. The enhancement ratio of all transferosomal formulations was between 2.41–4.92. When compared to drug suspension, all transferosomal formulations showed significantly high flux. These results are consistent with previous research reported by Ahad et al. [22]. The flexibility of transferosomes enables them to squeeze themselves through the pores considerably smaller than the vesicle diameter more efficiently, which accounts for the enhanced penetration of transferosomal formulations.
Fig. 3: Ex-vivo permeation profiles of transferosomal formulations compared to drug suspension, data represented as mean ±SD, n=3
Note: Graph represents the cumulative amount of drug permeated through rat epidermal layer at different time points. DS: Drug suspension; F1, F2, F3, F4 and F5: Transferosomal formulations; F3L: optimized transferosomal formulation; F3LG: transferosomal gel
Optimization
Optimized transferosomal formulation of lacidipine (F3L) was selected based on the steady state flux. The formulation F3L contained 2% labrasol exhibited significantly higher steady state flux than formulation F3 and drug suspension. The high flux could be due to low vesicle size (132 nm) and enhanced permeation. The presence of saturated polyglycolide C8-C10 glycerides in labrasol could enhance transdermal permeation [20]. The zeta size, PDI, zeta potential, entrapment efficiency, content and steady-state flux of optimized formulation (F3L) were 132.6 nm, 0.174,-33.7 mV, 99.6%, 97.5% and 83.1μg/cm2/h respectively. The steady-state flux of F3L was significantly high compared to F3 (P<0.05), F3LG (P<0.01) and drug suspension (P<0.0001). Enhancement ratios of formulations F3, F3Land F3LG were 4.11, 4.92 and 3.42 folds compared to drug suspension. The flux of transferosomal gel (F3LG) was significantly (P<0.01) lower than the flux of formulation F3L. This could be due to the low thermodynamic activity of vesicles entrapped in the gel structure [35].
Pharmacodynamic activity
Antihypertensive activity of transferosomal formulations was investigated in comparison to lacidipine suspension administered by oral route, and the results are shown in table 4. The percent reduction in systolic BP versus time profiles are shown in fig. 4. Oral administration of drug suspension and marketed formulation showed peak effect within 2 h. However, after the peak effect, the systolic BP increased gradually and reached the initial induced BP at 24 h. Whereas the transdermal transferosomal formulations F3 and F3L showed a gradual decrease in systolic BP with a peak effect at 12 h and the effect was sustained up to 48 h. These results align with the findings of Ahad A et al. [22]. A significantly high percent reduction in systolic BP was observed with F3L (33.8%) and F3 (28.7 %) at 12 h time point. Whereas oral drug suspension and marketed formulation showed 10.2 % and 14.8 % reduction in systolic BP, respectively at 12 h. High efficiency of transferosomal formulations could be due to the enhanced permeability of nanosized ultra-flexible vesicles carrying lipophilic drugs via the intercellular route [10]. The pharmacodynamic activity of F3L was significantly high when compared with F3 at P<0.05, F3LG at P<0.01 and oral drug suspension at P<0.0001. This is because labrasol present in F3L formulation enhanced drug permeation. The significantly low activity of gel formulation could be due to decreased thermodynamic mobility of vesicles entrapped in the gel structure. The transferosomal formulations F3 and F3L could revert rat systolic BP to normal values with sustained effect. The results indicate the advantage of the transferosomal system containing lacidipine in the management of hypertension.
Table 4: Antihypertensive effect on rats after oral and transdermal administration of lacidipine
| Mean systolic blood pressure (mm of Hg) | ||||||||||||
| Groups | Normal | Induced | Duration in hours after treatment | %R (12h) |
||||||||
| 1h | 2h | 4h | 6h | 12h | 24h | 48h | 72h | 96h | ||||
| A(NC) | 118.7±2.9 | - | 120.4±3.5 | 119.6±3.6 | 120.6±3.8 | 119.8±3.1 | 122.8±3.5 | 121.6±2.6 | 120.1±3.2 | 122.4±3.8 | 120.3±2.8 | - |
| B(HC) | 122.1±3.4 | 178.2±2.9 | 178.1±3.3 | 177.3±2.8 | 175.9±3.4 | 173.1±2.8 | 171.9±2.9 | 170.5±2.8 | 167.5±2.8 | 154.2±3.3 | 138.5±3.5 | - |
| C(DS) | 120.9±3.5 | 178.6±3.2 | 158.2±2.7 | 120.5±3.1 | 138.5±3.1 | 149.1±2.5 | 160.2±3.4 | 176.3±2.6 | 163.7±2.6 | 146.4±2.5 | 128.5±2.6 | 10.2 |
| D(MF) | 121.1±2.3 | 177.8±3.6 | 155.7±3.2 | 119.6±3.7 | 123.8±2.5 | 136.7±3.6 | 152.3±3.2 | 170.9±1.7 | 159.8±1.6 | 148.7±2.2 | 126.2±2.8 | 14.8 |
| E(F3) | 120.4±2.1 | 178.2±3.2 | 174.6±2.5 | 169.9±2.8 | 160.3±1.7 | 146.9±3.2 | 127.6±2.5*** | 131.4±2.4 | 147.3±1.8 | 133.8±2.8 | 120.8±3.2 | 28.7 |
| F(F3L) | 119.7±2.7 | 178.1±3.5 | 172.5±2.3 | 167.8±2.6 | 154.4±2.4 | 143.3±3.3 | 118.3±2.5**** | 120.5±2.2 | 132.2±1.4 | 129.9±3.6 | 119.1±1.4 | 33.8 |
| G(F3LG) | 120.1±2.6 | 178.3±2.4 | 175.1±3.8 | 171.9±2.4 | 158.6±2.9 | 152.6±2.2 | 141.5±2.6** | 149.2±1.2 | 158.6±2.5 | 140.8±3.4 | 127.2±2.8 | 20.6 |
| G(F3LG) | 120.1±2.6 | 178.3±2.4 | 175.1±3.8 | 171.9±2.4 | 158.6±2.9 | 152.6±2.2 | 141.5±2.6** | 149.2±1.2 | 158.6±2.5 | 140.8±3.4 | 127.2±2.8 | 20.6 |
Note: %R=Percentage reduction in mean systolic blood pressure; NC: Normal control; HC: Hypertensive positive control; DS: Drug suspension; MF: Marketed formulation. Data expressed as mean ±SD, n=6. **** P<0.0001, ***P<0.001, **P<0.01 significant compared to oral drug suspension
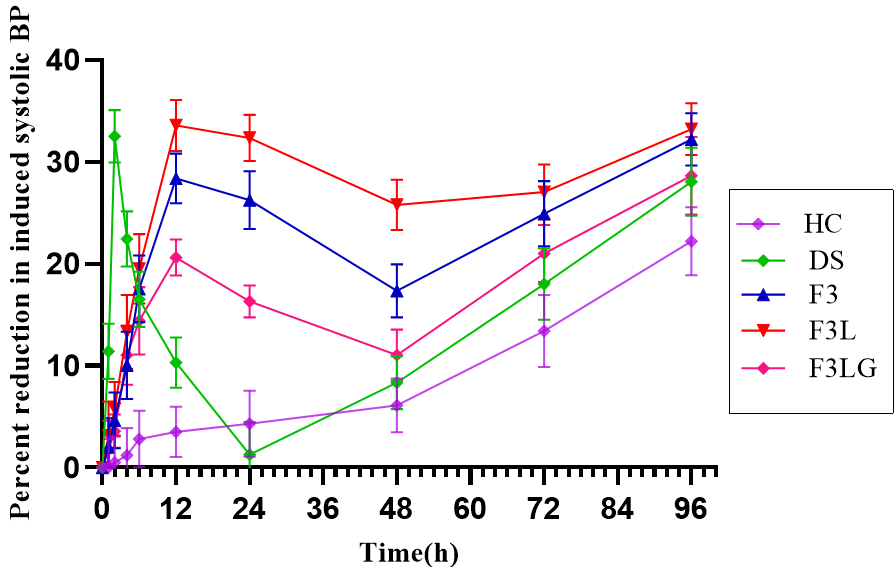
Fig. 4: Reduction in systolic BP at different time points, data represented as mean±SD, n=6
Note: Graph represents the percent reduction in systolic BP with time in groups treated with DS: Drug suspension; F3: Transferosomal formulation; (F3L): Optimized transferosomal formulation; F3LG: transferosomal gel; HC: Hypertensive positive control
Pharmacokinetic activity
The plasma concentration versus time profiles of transferosomal formulations, drug suspension and marketed formulation are shown in fig. 5. The pharmacokinetic parameters were calculated and the results are represented in table 5. The Tmax of an orally administered drug suspension and the marketed formulation was 2h, whereas transdermal transferosomal formulations was 4h. This could be due to the barrier nature of stratum corneum, which delays permeation of nanocarriers [26]. The MRT of the optimized formulation was significantly high (P<0.0001) compared to oral drug suspension and marketed formulation. An increase in bioavailability and prolonged action of transdermal transferosomal formulations were noticed from the pharmacokinetic parameters. The enhanced bioavailability of transferosomes is due to the avoidance of first-pass metabolism by transdermal route. These observations are similar to the reports of Salem HF et al. [33]. The AUC of F3L was significantly high compared to F3 at P<0.05, F3LG at P<0.01, and drug suspension at P<0.0001). Cmax of the transdermal formulation containing labrasol (F3L) was significantly high compared to F3 at P<0.05, F3LG at P<0.01, and drug suspension at P<0.0001. The bioavailability of F3, F3L, and F3LG was 2.6, 3.3 and 2.1 folds higher, respectively, than oral drug suspension. The half-life of lacidipine was prolonged by transdermal absorption [33, 35].
Table 5: Pharmacokinetic parameters of lacidipine formulations after oral and transdermal route
| Groups | Treatments | Cmax (ng/ml) | AUCtotal (ng/ml/h) | Tmax (h) | T1/2 (h) | MRT (h) | F |
| I | DS (oral) | 41.4±3.59 | 415.9±3.61 | 2 | 5.9±0.7 | 8.13±0.6 | - |
| II | MF (oral) | 87.63±5.34** | 628.5±2.89 | 2 | 7.2±0.8 | 9.53±1.3 | - |
| III | F3 | 111.13±4.16*** | 1114.8±6.22*** | 4 | 11.8±1.2*** | 14.46±1.25*** | 2.6 |
| IV | F3L | 119.52±5.33**** | 1404.1±4.23**** | 4 | 14.3±0.9**** | 18.21±1.5**** | 3.3 |
| V | F3LG | 91.73±3.38** | 897.9±3.41** | 4 | 9.3±1.4 | 12.36±0.9 | 2.1 |
Data expressed as mean±SD, n=6. **** P<0.0001, ***P<0.001, **P<0.01 significant compared to oral drug suspension.
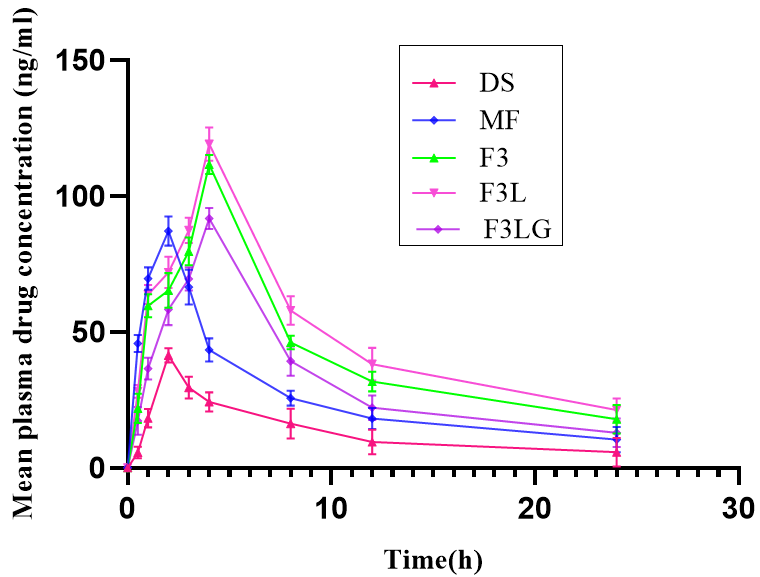
Fig. 5: Plasma concentration versus time profiles of lacidipine formulations, data represented as mean ±SD, n=6
Note: Graph represents the mean plasma drug concentration (ng/ml) with time after treatment with DS: Drug suspension; MF: Marketed formulation; F3: Transferosomal formulation; F3L: Optimized transferosomal formulation; F3LG: transferosomal gel
Skin irritation and histopathological study
The histopathological images of the rat skin untreated, treated with SLS and transferosomal formulations are displayed in fig. 6. The skin of formulation-treated groups showed well-defined dermal and epidermal layers without any tissue damage. No significant changes were observed in the stratum corneum layer of rat skin treated with formulation, indicating the safety of transferosomal formulations. On visual inspection, the redness and edema were not observed in formulation treated skin, suggesting the absence of skin irritation. The positive control showed significant skin damage [33, 36].
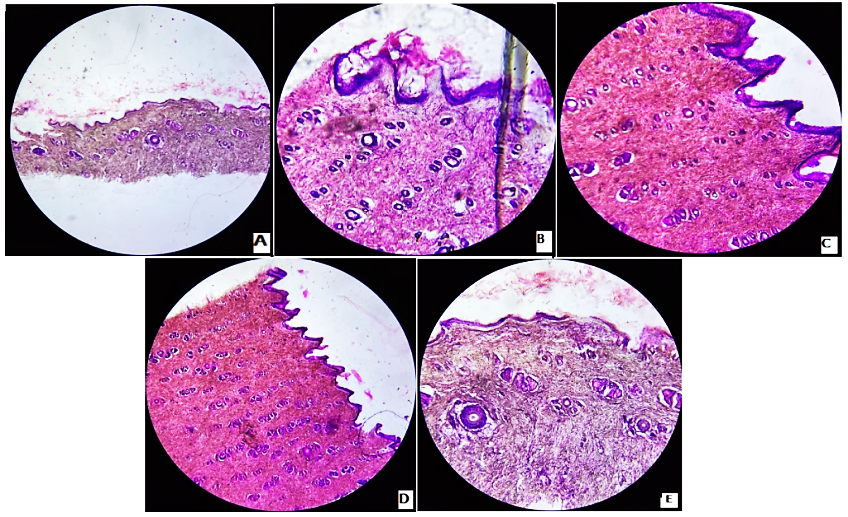
Fig. 6: Photomicrographs of rat skin cross section stained with eosin
Note: Photomicrographs showing the histopathological alterations in the stratum corneum layer after treatment. (A) untreated (B) treated with sodium lauryl sulphate (C) treated with transferosomal formulation (F3) (D) treated with optimized transferosomal formulation (F3L) (E) treated with transferosomal gel (F3LG)
CONCLUSION
In the present study, lacidipine-loaded transferosomes were developed for transdermal delivery. Transferosomal formulations showed significantly high steady-state flux compared to drug suspension. The optimized transferosomal formulation decreased systolic blood pressure significantly and the effect is sustained compared to oral drug suspension. The bioavailability of optimized transdermal formulation F3L was 3.37 folds compared to oral drug suspension and 2.24 folds compared with the marketed formulation given by oral route. Therefore, we conclude that transferosomes administered via the transdermal route could significantly enhance the bioavailability of lacidipine with sustained effect.
ABBREVIATIONS
PDI-Polydispersity Index, BP-Blood pressure, HPLC-High-Performance Liquid Chromatography, FTIR-Fourier transform infrared spectroscopy, SEM-Scanning electron microscopy, NIBP-Non-Invasive Blood Pressure, SLS-Sodium lauryl sulphate.
ACKNOWLEDGMENT
The first author is thankful to the AICTE for providing fellowship under the QIP program. The author is also thankful to the University College of Pharmaceutical Sciences, Kakatiya University, Warangal, for providing the required facilities to carry out research work.
FUNDING
No funding was received for this research work.
AUTHORS CONTRIBUTIONS
SD carried out the above research work and prepared the complete manuscript. KJ guided and monitored the research activities and read and approved the manuscript.
CONFLICT OF INTERESTS
The authors declare no conflict of interest.
REFERENCES
Kjeldsen SE. Hypertension and cardiovascular risk: general aspects. Pharmacol Res. 2018;129:95-9. doi: 10.1016/j.phrs.2017.11.003, PMID 29127059.
Missiriya SM, John J. Assess the prevalence of hypertension and knowledge regarding the prevention of stroke. Asian J Pharm Clin Res. 2017 Apr;10(8):177-80. doi: 10.22159/ajpcr.2017.v10i8.18558.
Baishya BI, Rahman SS, Rynjah DA, Barman KA, Bordoloi SS, Islam JA. Enhancing of oral bioavailability of poorly water-soluble antihypertensive drugs. Int J Curr Pharm Sci. 2021 Jul;13(4):42-7. doi: 10.22159/ijcpr.2021v13i4.42741.
Sharma M, Sharma R, Jain DK. Nanotechnology-based approaches for enhancing oral bioavailability of poorly water-soluble antihypertensive drugs. Scientifica. 2016 Apr;2016(3):8525679. doi: 10.1155/2016/8525679, PMID 27239378.
De Luca MD, Ioele G, Spatari C, Ragno G. Photodegradation of 1, 4-dihydropyridine antihypertensive drugs: an updated review. Int J Pharm Pharm Sci. 2018 Dec;10(1):8-18. doi: 10.22159/ijpps.2018v10i1.22562.
Opie LH, Krum HE, Victor RG, Kaplan NM. Antihypertensive therapies. In: Opie LH, Gersh B, editors. Drugs for the heart. 8th ed. Philadelphia: Elsevier; 2013. p. 224-71. doi: 10.1016/B978-1-4557-3322-4.00016-8.
Reddy YK, Reddy DM, Kumar MA. Transdermal drug delivery system: a review. IJRPB. 2014 Mar;2(2):1094-103.
Upadhyay G, Verma S, Parvez N, Sharma PK. Recent trends in transdermal drug delivery system: a review. Adv Biol Res. 2014 Jan;20148(3):131-8.
Pawar PM, Solanki KP, Mandali VA. Recent advancements in transdermal drug delivery system. Int J Pharm Clin Res. 2018 Mar;10(3):65-73.
Jalajakshi MN, Chandrakala V, Srinivasan S. Recent development in transdermal drug delivery: an overview. Int J Pharm Pharm Sci. 2022 Oct;14(10):1-9.
Kumar RS, kumar PK. An overview on ultra deformable vesicular drug delivery systems in transdermal drug delivery. Int J Appl Pharm. 2023 May;15(3):28-34.
Kumar PK, Kumar RS. Review on transferosomes and transferosomal gels. J Pharm Res Int. 2021 Sep;33(43B):114-26. doi: 10.9734/jpri/2021/v33i43B32532.
Opatha SA, Titapiwatanakun V, Chutoprapat R. Transfersomes: a promising nanoencapsulation technique for transdermal drug delivery. Pharmaceutics. 2020 Sep;12(9):855. doi: 10.3390/pharmaceutics12090855, PMID 32916782.
Namrata M, Vijeta B, Alagusundaram M. Transferosomes: the effective targeted drug delivery system overview. J Pharm Negat Results. 2022 Dec;13(8):4316-21.
Nagaraju PT, Channabasavaraj KP, Kumar PT. Development and validation of spectrophotometric method for estimation of lacidipine in tablet dosage form. Int J PharmTech Res. 2011 Jan;3(1):18-23.
Muralidharan S. High performance liquid chromatographic method development and its validation for lacidipine. Int J PharmTech Res. 2013 Jan;5(1):79-85.
Guan J, Huan X, Liu Q, Jin L, Wu H, Zhang X. Synergetic effect of nucleation and crystal growth inhibitor on in vitro-in vivo performance of supersaturable lacidipine solid dispersion. Int J Pharm. 2019 Jul;566(9):594-603. doi: 10.1016/j.ijpharm.2019.06.010, PMID 31175988.
Velupula S, Velupula R, Janapareddi K. Formulation and characterization of glibenclamide loaded transferosomal gel for transdermal delivery. Eur Chem Bull. 2023;12(4):5536-51.
Pasha I, Khan AB, Sudheer P. Formulation and evaluation of transdermal ultradeformable vesicles of aspirin. Acta Pharm Sci. 2022 Aug;60(4):389-412. doi: 10.23893/1307-2080.APS6025.
Guo P, Li N, Fan L, Lu J, Liu B, Zhang B. Study of penetration mechanism of labrasol on rabbit cornea by ussing chamber, RT-PCR assay, Western blot and immunohistochemistry. Asian J Pharm Sci. 2019 May;14(3):329-39. doi: 10.1016/j.ajps.2018.05.005, PMID 32104463.
Ahad A, Al-Saleh AA, Al-Mohizea AM, Al-Jenoobi FI, Raish M, Yassin AE. Formulation and characterization of Phospholipon 90 G and tween 80-based transfersomes for transdermal delivery of eprosartan mesylate. Pharm Dev Technol. 2018 Sep;23(8):787-93. doi: 10.1080/10837450.2017.1330345, PMID 28504046.
Ahad A, Aqil M, Kohli K, Sultana Y, Mujeeb M, Ali A. Formulation and optimization of nanotransfersomes using experimental design technique for accentuated transdermal delivery of valsartan. Nanomedicine. 2012 Feb;8(2):237-49. doi: 10.1016/j.nano.2011.06.004, PMID 21704600.
Nurfitriyana N, Harmita H, Iskandarsyah I. In vitro study of a transferosomal gel preparation containing lynestrenol as a transdermal drug delivery system. Int J Appl Pharm. 2020 Mar;12(1):242-4.
Pavani K, Babu MK. Formulation and evaluation of lornoxicam transferosomes as carriers for effective transdermal drug delivery. IJRPB. 2015 Nov;3(6):416-22.
Jangdey MS, Gupta A, Saraf S, Saraf S. Development and optimization of apigenin-loaded transfersomal system for skin cancer delivery: in vitro evaluation. Artif Cells Nanomed Biotechnol. 2017 Jan;45(7):1452-62. doi: 10.1080/21691401.2016.1247850, PMID 28050929.
Balata GF, Faisal MM, Elghamry HA, Sabry SA. Preparation and characterization of ivabradine HCl transfersomes for enhanced transdermal delivery. J Drug Deliv Sci Technol. 2020 Dec;60(1):101921. doi: 10.1016/j.jddst.2020.101921.
Nippani AD, Janapareddi K. Development and ex-vivo evaluation of atorvastatin microemulsions for transdermal delivery using box-behnken design. Int J Pharm Biol Sci. 2018 Jul;8(3):81-93.
Onah CM, Mbah CJ, Attama AA. Studies on transdermal delivery of irbesartan: microemulsion as a delivery system. Int J Pharm Sci Res. 2018 Dec;9(12):5463-73.
Albash R, Abdelbary AA, Refai H, El-Nabarawi MA. Use of transethosomes for enhancing the transdermal delivery of olmesartan medoxomil: in vitro, ex vivo, and in vivo evaluation. Int J Nanomedicine. 2019 Mar;14:1953-68. doi: 10.2147/IJN.S196771, PMID 30936696.
Dudhipala N, Veerabrahma K. Candesartan cilexetil loaded solid lipid nanoparticles for oral delivery: characterization, pharmacokinetic and pharmacodynamic evaluation. Drug Deliv. 2016;23(2):395-404. doi: 10.3109/10717544.2014.914986, PMID 24865287.
Dai S, McNeill JH. Fructose-induced hypertension in rats is concentration and duration-dependent. J Pharmacol Toxicol Methods. 1995 Apr;33(2):101-7. doi: 10.1016/1056-8719(94)00063-a, PMID 7766916.
Hwang IS, Ho H, Hoffman BB, Reaven GM. Fructose-induced insulin resistance and hypertension in rats. Hypertension. 1987 Nov;10(5):512-6. doi: 10.1161/01.hyp.10.5.512, PMID 3311990.
Salem HF, El-Menshawe SF, Khallaf RA, Rabea YK. A novel transdermal nanoethosomal gel of lercanidipine HCl for treatment of hypertension: optimization using box-benkhen design, in vitro and in vivo characterization. Drug Deliv Transl Res. 2020 Feb;10(1):227-40. doi: 10.1007/s13346-019-00676-5, PMID 31625026.
Dudhipala N, Veerabrahma K. Pharmacokinetic and pharmacodynamic studies of nisoldipine-loaded solid lipid nanoparticles developed by central composite design. Drug Dev Ind Pharm. 2015 Dec;41(12):1968-77. doi: 10.3109/03639045.2015.1024685, PMID 25830370.
Gannu R, Palem CR, Yamsani VV, Yamsani SK, Yamsani MR. Enhanced bioavailability of lacidipine via microemulsion based transdermal gels: formulation optimization, ex vivo and in vivo characterization. Int J Pharm. 2010 Mar;388(1-2):231-41. doi: 10.1016/j.ijpharm.2009.12.050, PMID 20060457.
Qadri GR, Ahad A, Aqil M, Imam SS, Ali A. Invasomes of isradipine for enhanced transdermal delivery against hypertension: formulation, characterization, and in vivo pharmacodynamic study. Artif Cells Nanomed Biotechnol. 2017 Feb;45(1):139-45. doi: 10.3109/21691401.2016.1138486, PMID 26829018.
Nagaraju PG, Sengupta P, Chicgovinda PP, Rao PJ. Nanoencapsulation of clove oil and study of physicochemical properties, cytotoxic, hemolytic, and antioxidant activities. J Food Process Engineering. 2021 Apr;44(4):e13645. doi: 10.1111/jfpe.13645.