
Int J App Pharm, Vol 17, Issue 2, 2025, 449-455Original Article
SIMULTANEOUS ANALYSIS OF ISONIAZID AND PYRIDOXINE HYDROCHLORIDE IN TABLET DOSAGE FORM USING PARTIAL LEAST SQUARES BASED ON INFRARED SPECTRA PROFILE
LISDA RIMAYANI NASUTION1*, SEREN ERNEST FLAVIA3, YADE METRIPERMATA1, MUCHLISYAM BACHRI1, HAFID SYAHPUTRA1, CHEMAYANTI SURBAKTI2
1Department of Pharmaceutical Chemistry, Faculty of Pharmacy, Universitas Sumatera Utara, Medan, Indonesia. 2Department of Pharmaceutical Biology, Faculty of Pharmacy, Universitas Sumatera Utara, Medan, Indonesia. 3Undergraduate Program, Faculty of Pharmacy, Universitas Sumatera Utara, Medan, Indonesia
*Corresponding author: Lisda Rimayani Nasution; *Email: lisda.rimayani@usu.ac.id
Received: 03 Oct 2024, Revised and Accepted: 07 Jan 2025
ABSTRACT
Objective: The purpose of this research was to simultaneously analyse a mixture of Isoniazid (INH) and Pyridoxine Hydrochloride (PDX) in tablet dosage form using Partial Least Square (PLS) based on infrared spectra profile.
Methods: The calibration models were measured at five concentrations levels (w/w) of INH and PDX within the wavenumber ranges of 779.24-713.66 cm-1for INH and 829.39-763.81 cm-1for PDX. Model performance was evaluated through internal validation using leave-one-out-cross validation (LOO-CV), with accuracy and precision assessed by the coefficient of determination (R2), Prediction Error Sum of Squares (PRESS), and Root mean Square Error of Cross Validation (RMSECV). Divisor approach was applied to separate the spectrum of the individual components within the mixture.
Results: The PLS models for INH and PDX levels showed excellent validation results, with R2 values of 0.9996 and 0.9969, PRESS values of 0.8106 and 0.3129, and RMSCEV values of 0.3675 and 0.2283, respectively. The INH level on INHA® 400 and Pehadoxin Forte® tablets were 102.90% and 105.45% of the labelled amount, while the PDX level was 98.93% and 101.57% of the labelled amount, respectively.
Conclusion: The PLS model based on infrared spectra profiles demonstrated high accuracy, precision, and effectiveness, offering a non-destructive method for simultaneous analysis of INH and PDX in tablet dosage form. This method is applicable to pharmaceutical quality monitoring.
Keywords: Isoniazid, Pyridoxine hydrochloride, Chemometrics, Partial least square
© 2025 The Authors. Published by Innovare Academic Sciences Pvt Ltd. This is an open access article under the CC BY license (https://creativecommons.org/licenses/by/4.0/)
DOI: https://dx.doi.org/10.22159/ijap.2025v17i2.52853 Journal homepage: https://innovareacademics.in/journals/index.php/ijap
INTRODUCTION
A reliable quantitative analysis method is essential for determining the concentration of a substance, which is cost-effective, easy to operate, and provides accurate and precise results. Spectrophotometry an analytical method that meets these criteria and is more in demand than other methods because it requires no complex extraction stages, making it more efficient and less time consuming [1, 2]. However, when standard spectrophotometric methods are used to measure the amounts of complex mixtures at the same time, problems arise because the spectra overlaps, making it harder to accurately measure each component [3]. Therefore, the development of a quantifiable analytical method is required to address this problem.
The development of Fourier Transformed Infrared (FTIR) spectrophotometry has proven to be a viable solution for the quantitative analysis of complex mixtures [4]. FTIR provide numerous benefits for quantitative analysis, such as its rapid nature, non-destructive approach, simple to prepare, and low solvent needs. Moreover, FTIR is gaining recognition as a sustainable alternative, as it reduces environmental issues linked to solvent usage [5]. In its application, FTIR can be used in conjunction with chemometrics techniques, particularly Partial Least Square (PLS) to enhance its analytical capabilities.
Chemometrics is an interdisciplinary field that applies mathematical and statistical techniques to process and analyse multivariate data [6]. The main advantages of chemometrics, particularly PLS, is its capacity to handle overlapping spectra data and predicted component concentration without requiring separation processes. Furthermore, PLS techniques offer ease of use, cost-effectiveness, and higher sensitivity compared to other techniques [7]. In a previous study, the combination of FTIR and PLS provided advantages in terms of high accuracy and precision for the separation multicomponent mixtures, with the calibration model processing only the desired analyte concentrations [8]. However, one limitation of multivariate calibration methods is the potential occurrence of overfitting. Therefore, validation performed using leave-one-out-a cross-validation (LOO-CV) for minimize overfitting also obtain accurate, specific, and reliable results [9]. While the PLS model demonstrates strong predictive capabilities, it does exhibit certain limitations when applied to samples with varying matrix compositions, particularly those containing new excipients that can lead to increased prediction errors [10]. To address this, it is essential to consider strategies such as model optimization or calibration adjustments to improve the accuracy. One such strategy involves using individual calibration curves, as suggested by Pinto et al. [11].
Advancements in scientific knowledge have led to the growing availability of pharmaceutical products. Currently, many pharmaceutical formulations contain multiple active ingredients [12]. A specific example is the combination of isoniazid (INH) and pyridoxine hydrochloride (PDX), which poses challenges in quality control due to the similarities in their physicochemical properties and overlapping absorbance spectra [13]. In previous studies, various techniques have been employed for the quantification of INH and PDX in tablet dosage forms, such as Reverse Phase-High Performance Liquid Chromatography (RP-HPLC) [14]. However, RP-HPLC requires complex sample preparation, costly equipment, and specialized expertise, which limits its widespread application [14]. Other methods, such as zero-crossing derivative ultraviolet (UV) spectrophotometry, offer a simpler approach with less solvent consumption, but involve lengthy derivation processes to ensure reliable results [15]. Similarly, the absorbance ratio UV spectrophotometry method, which relies on iso absorbance points, has demonstrated limitations in specificity and sensitivity, making it less suitable for accurate quantitative analysis [16, 17]. Notably, there has been no prior study utilizing the FTIR-PLS method for the quantification INH and PDX contents.
Given these limitations, the present research aims to develop a more efficient and accurate method for the quality control of INH and PDX in tablet formulations by combining FTIR spectroscopy with PLS regression. This method has been demonstrated in numerous studies to provide high accuracy and precision in the analysis of multicomponent mixtures. It is particularly effective in handling overlapping spectra data and predicting component concentrations without the need for complex separation processes. Furthermore, FTIR spectroscopy is a solvent-minimal technique, making it an ideal candidate for efficient and environmentally friendly analytical applications.
MATERIALS AND METHODS
Materials
INH and PDX standard reference materials were obtained from the Indonesian Food and Drug Administration, potassium bromide (KBr) (Uvasol® Merck FT-IR Grade), and INHA®400 tablets (produced by PT Mersifarma TM), and Pehadoxin Forte® tablets (Produced by PT Phapros)
Instruments
Analytical balance (Mettler Toledo, model AL 104) with sensitivity of 0.01 g, oven (Memmert), FTIR (IR Prestige-21 Shimadzu) using DRS-8000A as accessories, Deuterated L-Alanine Doped Triglycene Sulphate (DLATGS) as detector with a set of Personal Computers (PC) equipped with IR Solution software, Microsoft Excel software version 2013, Minitab Software (version 21.4), OriginPro 2022 software, and other tools required for sampling.
Spectra acquisition
The FTIR spectra of INH, PDX, and samples were acquired using an IRPrestige-21 Shimadzu FTIR spectrophotometer, equipped with IR Solution software for spectra processing. The measurements were performed in the wavenumber range of 4500-400 cm⁻¹, using 32 scans and resolution of 2 cm⁻¹. Background correction was applied using the FTIR spectrum of air and all transmittance values were converted to absorbance due measurements. The wavenumber regions for calibration and validation of INH and PDX were optimized experimentally, selecting 746.45 cm-1 for INH and 796.60 cm-1for PDX. These fingerprint regions were selected based on prior studies by Moffat et al., which identified the fingerprint region (1500-600 cm-1) to improve the model and reduce the effects of spectra overlap [18, 19]. The chosen regions were then further validated through experimental testing. The optimization involved assessing various wavenumber ranges by evaluating the correlation coefficients of calibration curves. Then, PLS model and coefficients were measured within 779.24 to 713.66 cm⁻¹ for INH and 829.39 to 763.81 cm⁻¹ for PDX.
Preparation of standard reference materials
For INH, the standard was dried in an oven at 105 °C for 4 h to remove moisture. After drying, 50 mg of INH was accurately weighed and diluted with KBr up to 500 mg. The resulting mixture was stirred thoroughly to ensure homogeneity, achieving a final concentration of 100 μg/mg. In contrast, 50 mg of PDX was accurately weighed and diluted with KBr up to 500 mg, ensuring thorough mixing to achieve the same final concentration of 100 μg/mg.
Preparation of mixed standard
A mixed standard was prepared by weighed 400 mg of INH standard and 10 mg of PDX standard (concentration of 100 μg/mg). The two standards were thoroughly mixed, and diluted with KBr up to 100 mg. The resulting mixture was stirred until homogeneous. The final concentrations (w/w) of INH and PDX in the mixture were 400 μg/mg and 10 μg/mg, respectively.
Preparation of calibration and validation
Preparation of calibration and validation standard was adopted from approach by Pinto et al., that creating individual calibration curves grouped into a calibration matrix [11]. This method demonstrates that sample preparation for a mixture of analytes is not required for calibration modelling.
For the preparation of the calibration and validation sets, five concentrations of INH (40 μg/mg-80 μg/mg) and PDX (1 μg/mg-21 μg/mg) as shown in table 1 were prepared. These samples were measured across multiple wavenumbers, and the results were validated using leave-one-out cross-validation (LOO-CV) for internal validation, aiming to mitigate the potential risk of overfitting, a common limitation in chemometrics analysis by Rohman et al. [8].
Table 1: Calibration and validation set of INH and PDX in concentration (w/w)
No |
Concentration (w/w) |
|
|
INH |
PDX |
1 |
40 |
1 |
2 |
50 |
6 |
3 |
60 |
11 |
4 |
70 |
16 |
5 |
80 |
21 |
PLS models and coefficients
A total of 35 absorbance values for INH and PDX were selected to building each PLS models along with coefficients and measured within the specific wavenumber ranges for INH (779.24-713.66 cm-1) PDX (829.39-763.81 cm-1) to determine the predicted concentrations. These data were processed using Minitab (version 21.4) to develop PLS models and calculate the corresponding coefficients for determining the actual concentrations in the samples. The statistical analysis was conducted and a 95% confidence interval was used throughout the research.
Method validation
Internal validation using leave-one-out-cross validation (LOO-CV), with accuracy and precision assessed by the coefficient of determination (R2), Prediction Error Sum of Squares (PRESS), and Root mean Square Error of Cross Validation (RMSECV) [9].
The statistic multivariate calibration parameters, determination coefficients (R2), Predicted Residual Error Sum of Squares (PRESS), and Root mean Square Error Cross-Validation (RMSECV) were determined using the following formula:
PRESS = 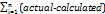 2
2
RMSECV = 
Assay of INH and PDX levels in tablet
INHA 400® and Pehadoxin Forte®, both containing 400 mg of INH and 10 mg of PDX (40:1 ratio), were selected for comparison due to their similar active ingredient composition, despite being produced by different manufacturers. Other formulations with ratio of 400:25 and 300:10 are also available on the market.
Twenty tablets were accurately weighed and then ground in a mortar until smooth and homogeneous powder was obtained. A portion of this powder equivalent to 10 mg of INH was carefully weighed and the PDX content within sample was calculated. Then, diluted KBr up to 500 mg and the mixture was thoroughly homogenized (sixth repetition of weighing). After preparation, acquisition spectra was performed. The measurements were divided by divisor to calculate the respective absorbances of INH and PDX, and to minimize noise while maximizing sensitivity [20]. The resulting absorbance values were then substituted into PLS model coefficients, which were used to determine the actual concentration (w/w) of INH and PDX in tablet sample.
The levels of INH and PDX in tablet dosage forms were calculated using the following formula:
Content =  × purity standard (%)
The calculated data for INH and PDX levels were then statistically one-sample one tail t-test with confidence interval 99%.
RESULTS AND DISCUSSION
INH and PDX standard FTIR spectra profile
The FTIR spectra profiles of INH and PDX presented in fig. 1 were evaluated at a concentration of 100 μg/mg in KBr and examined for mid infrared regions that corresponded to wavenumbers of 4500-400 cm-1. Each peaks in FTIR spectra come from the infrared absorption by functional groups present in these compounds. Table 2 summarizes the interpretation of each peak in relation to functional groups in the FTIR spectra profile. From these results, it can be seen that there is no significant difference between the wavenumber shift obtained and those described in the literature [21-22]. The INH infrared spectrum has its main peaks at wavenumbers 1653 cm-1, 1621 cm-1, 1541 cm-1, 992 cm-1, 845 cm-1, 676 cm-1and PDX infrared spectrum has its main peaks at wavenumbers 1540 cm-1, 1277 cm-1, 1212 cm-1, 1086 cm-1, 1015 cm-1, 870 cm-1with KBr pellets [19].
Among the identified characteristic peaks, the specific wavenumber ranges for quantification in this research were first experimentally tested for both INH and PDX. The testing involved calculating the correlation coefficient for each calibration curve generated at different wavenumbers. The wavenumber regions tested in this research were also based on those identified by Moffat et al. [18], specifically the fingerprint region (1500-600 cm⁻¹). Similarly, Shoukat et al. focused on informative regions, particularly the fingerprint area, to construct more accurate models and minimize the effects of spectra overlap [19]. The fingerprint region provides unique characteristics, as each molecule produces a distinct fingerprint spectrum, differentiating it from other compounds [23]. The correlation coefficients for various wavenumbers for both INH and PDX are presented in table 3.
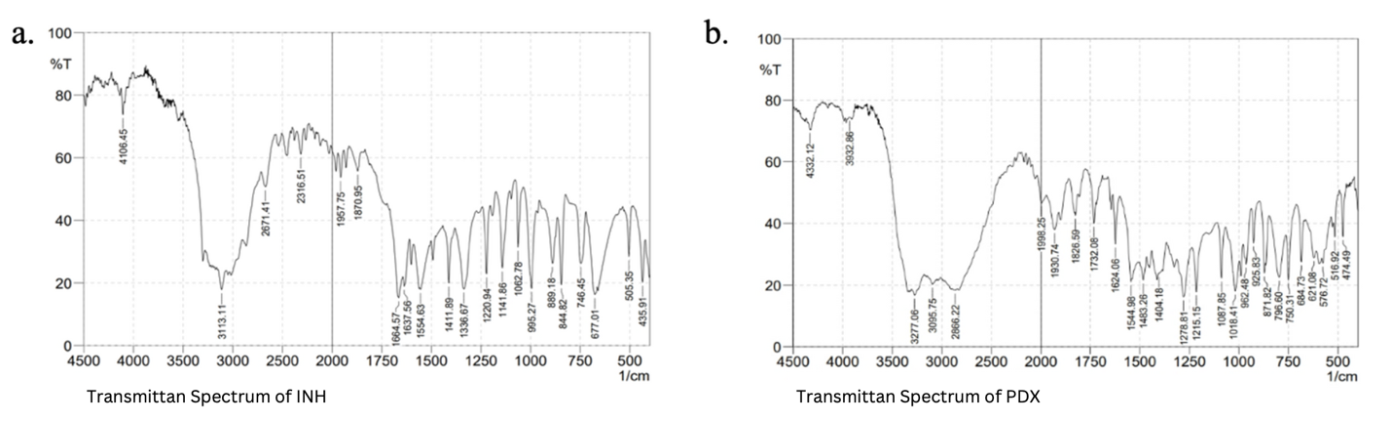
Fig. 1: Peak view of the functional group region of INH (a) and PDX (b)
Table 2: Functional groups responsible for absorption of peaks in INH and PDX
| Compounds | Wavenumbers (cm-1) | Functional groups and vibration modes |
| INH | 3302.13 | N-H, stretching vibration |
| 3113.11 | =C-H (aromatic), stretching vibration | |
| 1664.57 and 1637.58 | C=O (amide), stretching vibration | |
| 1554.63 | N-H, bending vibration | |
| 1411.89 | C=N (aromatic), stretching vibration | |
| 1336.67; 1220.94; 1062.78; 995.27 | C-N (aromatic), stretching vibration | |
| 844.82 | =C-H, bending vibration | |
| 746.45 and 677.01 | Mono-substituted vibration | |
| PDX | 3277.06 | -OH (fenolic), stretching vibration |
| 3095.75 | -CH (aromatic), stretching vibration | |
| 2866.22 | -CH (aliphatic), stretching vibration | |
| 1930.74; 1826.59; 1732.08 | =CN, stretching vibration | |
| 1624.06 and 1544.98 | C=C (aromatic), stretching vibration | |
| 1215.15; 1087.85; 1018.41 | C-O (fenolic), stretching vibration |
Table 3: Correlation coefficients for various wavenumbers of INH and PDX
| INH | PDX |
| Wavenumbers (cm-1) | Correlation coefficient (r) |
| 1664.57 | 0.9647 |
| 1637.58 | 0.9836 |
| 1554.63 | 0.9607 |
| 1411.89 | 0.9800 |
| 1336.67 | 0.9769 |
| 1220.94 | 0.9897 |
| 1141.86 | 0.9891 |
| 1062.78 | 0.9967 |
| 995.27 | 0.9815 |
| 889.18 | 0.9963 |
| 844.82 | 0.9859 |
| 746.45 | 0.9974 |
| 677.01 | 0.9761 |
| 684.73 | |
| 621.08 |
From the data presented in table 3, it can be concluded that the highest correlation coefficients, close to 1 for INH and PDX are 0.9974 at the wavenumber 746.45 cm⁻¹ for INH and 0.9977 at the wavenumber 1483.26 cm⁻¹ for PDX. The selection of wavenumbers with correlation coefficients (r) close to 1 indicates a linear relationship between concentration and absorbance [24].
Furthermore, the selection of wavenumbers also took into account the presence or absence of noise in the peaks observed in the infrared spectra. However, for PDX, some peaks exhibited noise, which could result from fluctuations in light source from instrument, background or environmental condition, sample such as variations from KBr matrix, or errors in interferogram reading [25]. This noise can create false peaks, distort peak shapes, and alter peak positions, thus affecting the accuracy of peak intensity [26]. Consequently, peaks affected by noise were excluded from consideration.
Additionally, the ability of the PLS multivariate calibration model to perform well was evaluated using LOO-CV parameters (R², PRESS, and RMSECV), which are essential for ensuring optimal results [27]. Cross-validation testing was carried out using Minitab software (version 21.4) on the calibration models for both INH and PDX. The calibration model for INH showed low error at the wavenumber 746.45 cm⁻¹. However, the calibration model for PDX at 1087.85 cm⁻¹, with a correlation coefficient of 0.9975, exhibited a higher error compared to the model at 796.60 cm⁻¹, despite the latter having a slightly lower correlation coefficient of 0.9971. Based on these findings, the wavenumber of 746.45 cm⁻¹ for INH and 796.60 cm⁻¹ for PDX were selected for quantification.
Prior to quantification, the absorbance spectra of the INH standard, PDX standard, and their mixture were overlapped, as shown in fig. 2. The concentrations (w/w) of the INH and PDX standards were 100 μg/mg, while the concentration of the standard mixture of INH and PDX was 400:10.
As illustrated in fig. 2, the absorbance spectra of INH and PDX overlap, and the spectrum of their standard mixture differs from that of each individual compound. This overlap makes it challenging to determine the concentration of the drug mixture using conventional spectrophotometric methods. Consequently, to extract meaningful information from the infrared spectra, a multivariate calibration approach, such as chemometrics, are required. Chemometrics techniques are commonly employed in drug analysis because they do not necessitate separation procedures, even when spectra from multiple compounds overlap [28].
In the fingerprint region, where the absorption spectra of INH and PDX are superimposed, both compounds exhibit overlapping vibrations at the same wavenumber of 746.45 cm⁻¹, influencing each other. This interaction forms the basis of research methodology for drug quantification, where focusing on a single wavenumber region allows for the simultaneous measurement of both INH and PDX levels within the same fingerprint area, specifically in the wavenumber range of 779.24–713.66 cm⁻¹, with a 2 cm⁻¹ interval. Wavenumber selection is limited to informative regions within the fingerprint area to enhance the model and minimize the effects of spectra overlap [20]. The fingerprint region is especially valuable because it provides distinct characteristics unique to each compound, as different molecules produce unique spectra patterns [21].
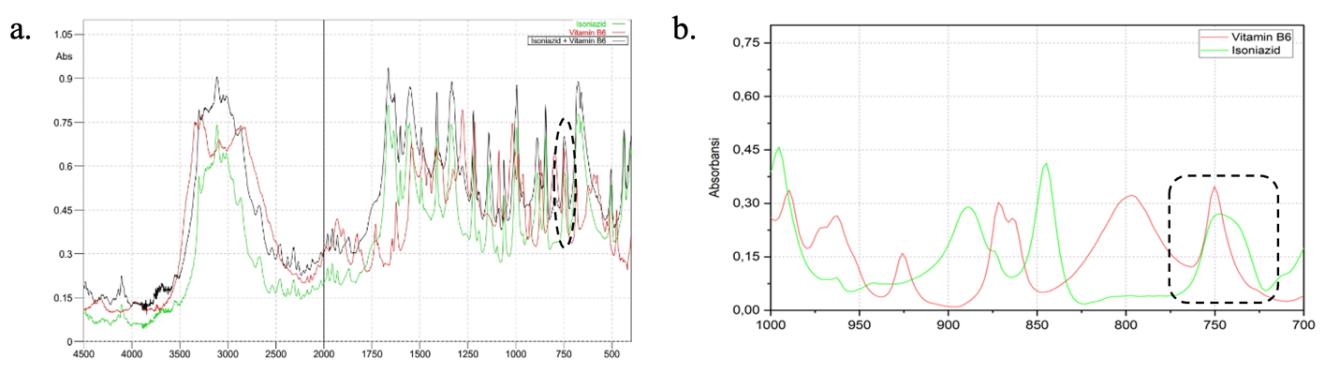
Fig. 2: Overlapping FTIR spectra profile of INH and PDX standard at wavenumbers of mid infrared region (a) and fingerprint region (b)
Fig. 2(b) shows that the PDX peak is slightly more intense than the INH peak at 746.45 cm⁻¹, indicating that the absorption intensity of PDX is higher. This difference can be attributed to the distinct chemical compositions of the two substances [29]. The peak at 746.45 cm⁻¹ corresponds to a mono-substituted vibration group. According to the table presented by Rohman et al., this wavenumber is associated with an aromatic-CH bending vibration, as it falls within the typical range of 900–690 cm⁻¹[30]. The absorption wavenumbers are influenced by the type of bond and the nature of its vibration, with different bonds absorbing infrared radiation at characteristic wavenumbers [31].
Calibration model of INH and PDX
Five concentrations (w/w) of INH standard (40, 50, 60, 70, and 80) μg/mg and PDX standard (1, 6, 11, 16, and 21) μg/mg were measured at wavenumbers of 4500-400 cm-1 to obtain absorbance data. Then, 35 absorbance values were selected in the specific regions for INH (779.24–713.66 cm⁻¹) and PDX (829.39–763.81 cm⁻¹), as shown in fig. 3 and fig. 4, respectively, to calculate the actual concentrations. PLS models and coefficients were then developed. This approach applied two strategies using PLS, one of which involved creating individual calibration curves grouped into a calibration matrix [11]. This strategy shows that sample preparation for a mixture of analytes is unnecessary for calibration modelling. Using pure standard substances to construct the calibration model offers several benefits, such as reducing the number of samples required for calibration and making it easier to update the model when new components need to be quantified.
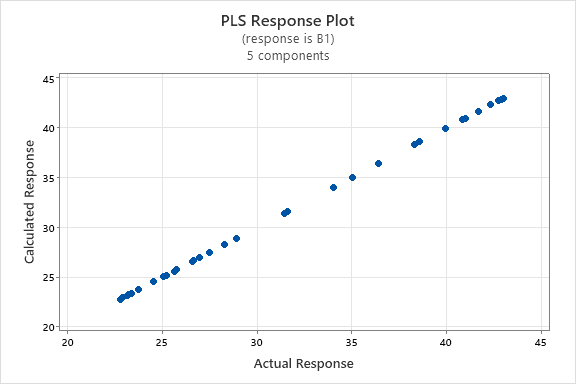
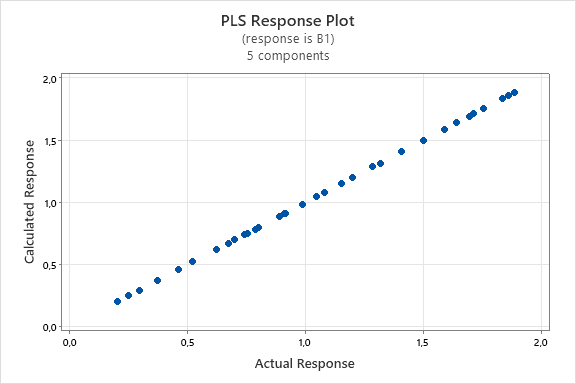
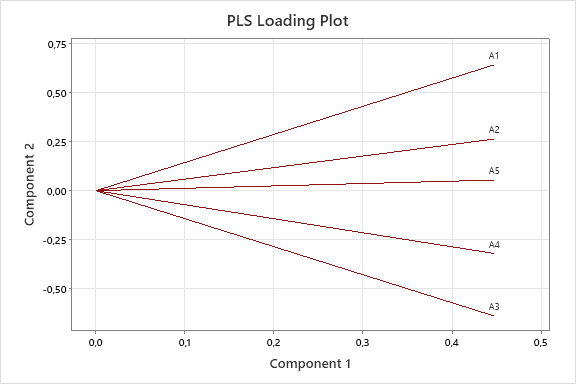
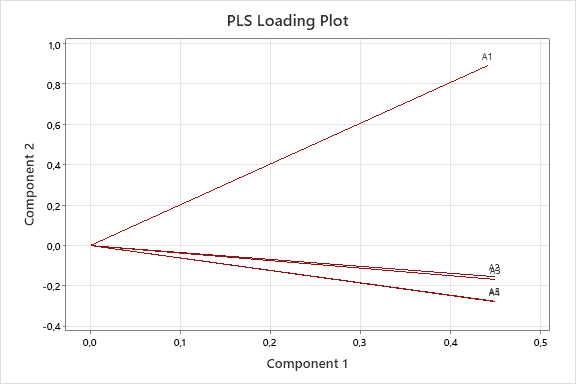
The graph depicting the linear relationship between the actual and predicted concentrations of INH and PDX models shown in the fig. 5, and the graph depicting the relationships between the components/variables and shown in the fig. 6. The fig. 5(a) and fig. 5(b) demonstrates a linear correlation between the actual and predicted concentrations using PLS, indicating that this method can be effectively employed for quantification [32]. On the other hand, fig. 6(a) and fig. 6(b) demonstrate that the predictors have nearly identical lengths, suggesting that they contribute equally to the model. Smaller angles between predictors indicate a high degree of correlation, while predictors with longer vectors, which correspond to greater loadings in the first or second components, are considered more important in the model.
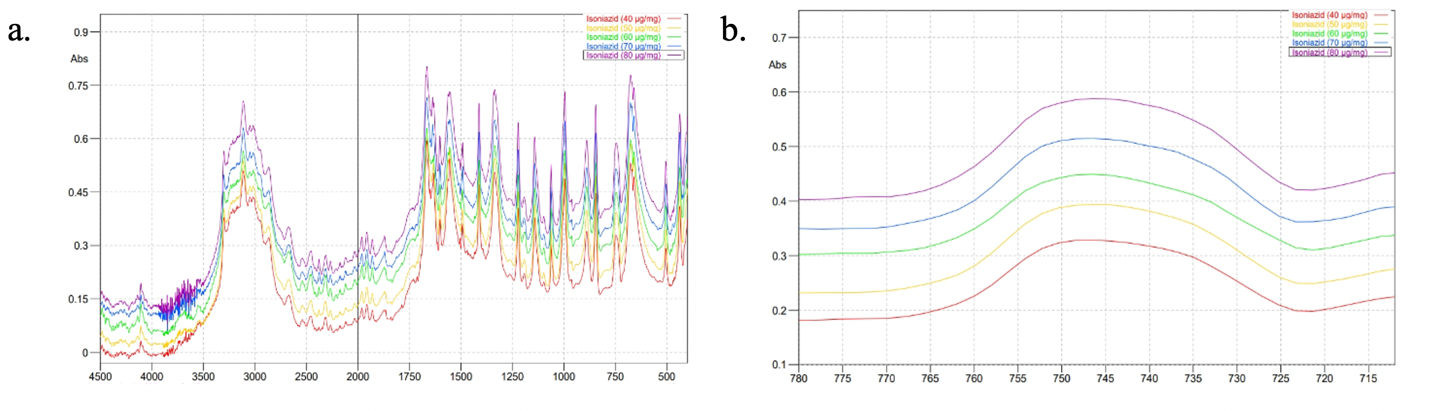
Fig. 3: Absorption spectra of INH at various concentrations in mid infrared region (a) and fingerprint region (b)
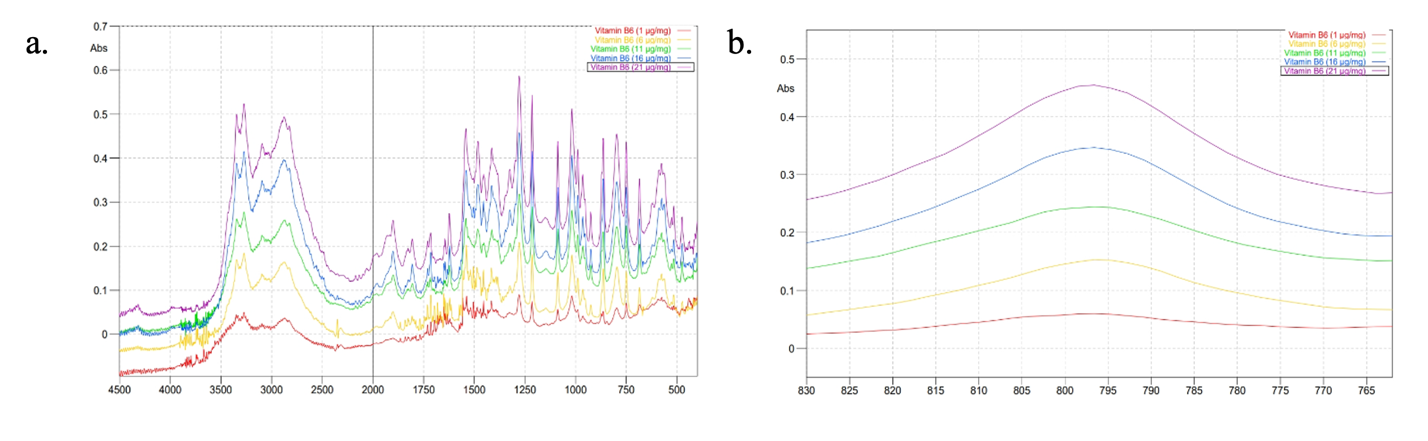
Fig. 4: Absorption spectra of PDX at various concentrations in mid infrared region (a) and fingerprint region (b)
a. b.
Fig. 5: PLS response plot between actual concentration and predicted concentration of INH (a) PDX (b)
a. b.
Fig. 6: PLS loading plot between first and second components of INH (a) PDX (b)
Method validation
One limitation of multivariate calibration methods is the potential occurrence of overfitting. Internal validation is performed using cross-validation techniques, such as leave-one-out cross-validation (LOO-CV), where one data point is removed at a time, and the prediction model is developed using the remaining data to predict the excluded data point [10]. In this research, internal validation was performed at Minitab (version 21.4), and the model selection and validation results, along with the coefficients of INH and PDX were presented in table 4. The calibration model as shown in table 4 was developed by considering the number of components as 1. This choice was made to balance the risk of underfitting and overfitting. Specifically, selecting too few components could result in the loss of essential information (underfitting), while selecting too many components could lead to overfitting, where the model captures not only relevant data but also noise from the dataset, thus impairing its predictive performance [33, 34].
Table 4: Model selection and validation along with the coefficients of INH and PDX
| Compounds | Model selection and validation | Coefficients | ||||||
| Comp onent | X variance | Error | R2 | PRESS | R2 (pred) | RMSECV | Regression equation | |
| INH | 1 | 0.9991 | 0.7276 | 0.9996 | 0.8106 | 0.9996 | 0.3675 | x = 136.986 y – 2.014 |
| PDX | 1 | 0.9891 | 0.2820 | 0.9969 | 0.3129 | 0.9966 | 0.2283 | x = 48.5437 y – 1.0146 |
The PLS calculations for both INH and PDX met the validation requirements, as indicated by the R², PRESS, and RMSECV values presented in table 4. The PRESS values for INH and PDX were 0.8106 and 0.3129, respectively, reflecting the squared differences between predicted and actual values for each sample. PRESS is a commonly used metric to evaluate the predictive performance of a model; smaller PRESS values indicate better predictive accuracy. These results confirm that the PRESS values satisfy the validation criteria [10]. In addition to PRESS, the RMSECV and R² values provide further validation. The RMSECV values for INH and PDX were 0.3675 and 0.2283, respectively, while the R² values were 0.9996 and 0.9969 value of R² approaching 1 and RMSECV approaching 0 indicate a reliable model. Therefore, the R² and RMSECV values for both INH and PDX meet the validation requirements outlined in criterion, confirming the validity of the PLS model for these substances [10]. Based on this result, when compared to the RP-HPLC method, the PLS technique offers several advantages, such as enhancing analysis accuracy, selecting relevant data, and removing uninteresting data [9, 13].
Application of the method in tablet dosage form
This research employed two tablet samples, INHA® 400 and Pehadoxin Forte®, to quantify INH and PDX levels. The concentrations of INH and PDX were determined using divisor. These divisor were used to minimize noise while maximizing sensitivity [21]. The absorbance values of each substance were calculated by dividing the sample spectra by the individual spectra of each INH and PDX standards. For example, to determine the INH content in INHA® 400, the sample spectrum was divided by the PDX spectrum in the defined fingerprint region (779.24–713.66 cm⁻¹). Similarly, PDX was determined by dividing the sample spectrum by the INH spectrum in the same region. The resulting values then were substituted into each PLS models and coefficients to determine each actual concentrations. This procedure was also applied to the Pehadoxin Forte® tablets. The PDX divisor with a concentration of 600 μg/mg was used to measure the INH content in both tablets. Similarly, the INH divisor with a concentration of 706 μg/mg was employed to quantify PDX levels in both tablets. The range of INH and PDX contents in INHA® 400 and Pehadoxin Forte® tablets is presented in table 5.
Table 5: INH and PDX contents in tablet dosage form
| Component of drugs | Sample | Contents (%) | Level requirements (%) |
| INH | INHA® 400 | 101.16-104.63 | 90-110 |
| Pehadoxin Forte® | 102.83-108.06 | 90-110 | |
| PDX | INHA® 400 | 97.21-100.64 | 95-115 |
| Pehadoxin Forte® | 99.01-104.3 | 95-115 |
The levels of INH and PDX obtained can be seen in table 5 above and are still within the range of requirements in the Indonesian Pharmacopeia Sixth Edition. This proves that the levels of INH and PDX obtained meet the standard levels of the Indonesian Pharmacopoeia Edition VI.
CONCLUSION
The FTIR-PLS technique exhibited excellent accuracy, precision, and effectiveness, providing a non-destructive approach. It allows for the simultaneous analysis of INH and PDX in tablet formulations without the need for separation, while meeting all validation criteria. This method is applicable to pharmaceutical quality monitoring.
FUNDING
Nil
AUTHORS CONTRIBUTIONS
Conceptualization: LRN, SEF, YMP; table work: LRN, SEF; Supervision: LRN, YMP, MB, HS; Revision: LRN, SEF; Writing and Editing: LRN, SEF; Proofreading: LRN, YMP, CS.
CONFLICT OF INTERESTS
The authors have no conflicts of interest regarding this research.
REFERENCES
Hladova M, Martinka J, Rantuch P, Necas A. Review of spectrophotometric methods for determination of formaldehyde. Res Pap Fac Mater Sci Technol Slovak Univ Technol. 2019 Jun 1;27(44):105-20. doi: 10.2478/rput-2019-0012.
Lotfy HM, Saleh SS. Recent development in ultraviolet spectrophotometry through the last decade (2006-2016): a review. Int J Pharm Pharm Sci. 2016 Aug 12;8(10):40. doi: 10.22159/ijpps.2016v8i10.13537.
Sayed Saad A, Hamdy A, Merey H, Ibrahim H. Novel spectrophotometric method for the analysis of ternary mixtures. ERU Research Journal. 2022 Oct 1;1(1):75-92. doi: 10.21608/erurj.2022.267925.
Dutta A. Chapter 4. Fourier transform infrared spectroscopy. In: Thomas S, Thomas R, Zachariah AK, Mishra RK, editors. Micro and Nano technologies, spectroscopic methods for nanomaterials characterization. Elsevier; 2017. p. 73-93. doi: 10.1016/B978-0-323-46140-5.00004-2.
Mallah MA, Sherazi ST, Bhanger MI, Mahesar SA, Bajeer MA. A rapid Fourier-transform infrared (FTIR) spectroscopic method for direct quantification of paracetamol content in solid pharmaceutical formulations. Spectrochim Acta A Mol Biomol Spectrosc. 2015 Apr;141:64-70. doi: 10.1016/j.saa.2015.01.036, PMID 25659814.
Windarsih A, Riswanto FD, Bakar NK, Yuliana ND, Dachriyanus RA. Detection of pork in beef meatballs using LC-HRMS based untargeted metabolomics and chemometrics for halal authentication. Molecules. 2022 Nov 29;27(23):8325. doi: 10.3390/molecules27238325, PMID 36500423.
Patel R, Mashru R. Development and validation of chemometric assisted methods and stability indicating RP-HPLC method for simultaneous estimation of rasagiline mesylate and pramipexole in synthetic mixture. Acta Sci Pharm Sci. 2019 Jul 31;3(8):154-68. doi: 10.31080/ASPS.2019.03.0359.
Rohman A, Ramadhani D, Nugroho A. Analysis of curcumin in curcuma longa and curcuma xanthorriza using FTIR spectroscopy and chemometrics. Res J Med Plants. 2015 Apr 1;9(4):179-86. doi: 10.3923/rjmp.2015.179.186.
Munir MA, Inayatullah A, Ibrahim S, Rimba Putri IR, Emelda E, Fatmawati A. A modest Uv spectrophotometric assisted by chemometric approach for verification of acetaminophen level in various manufactured tablets and syrups in Indonesian pharmacies. Int J Appl Pharm. 2023 Jan 7;15(1):195-205. doi: 10.22159/ijap.2023v15i1.46290.
Alaoui Mansouri M, Kharbach M, El Maouardi M, Barra I, Bouklouze A. Quantification of ciprofloxacin in pharmaceutical products from various brands using FT-NIR: a comparative investigation of PLS and MCR-ALS. Spectrochim Acta A Mol Biomol Spectrosc. 2023;303:123268. doi: 10.1016/j.saa.2023.123268, PMID 37597354.
Pinto L, Stechi F, Breitkreitz MC. A simplified and versatile multivariate calibration procedure for multiproduct quantification of pharmaceutical drugs in the presence of interferences using first order data and chemometrics. Microchem J. 2019 May;146:202-9. doi: 10.1016/j.microc.2019.01.014.
Adriyani A, Rifai Y, Yulianty R. Penetapan kadar pseudoephedrine hcl, guaifenesin dan triprolidine hcl secara simultan dalam sediaan sirup dengan metode kckt. MFF. 2018;22(1):5-7. doi: 10.20956/mff.v22i1.5688.
Nasution LR, Bachri M, Putra ED. Simultaneous estimation pf isoniazid and pyridoxine hydrochloride in tablet dosage form by spectrophotometry ultraviolet with Area under Curve Method. Asian J Pharm Clin Res. 2018 May 1;11(5):124. doi: 10.22159/ajpcr.2018.v11i5.24314.
Benjamin T, Ramachandran D. Development and validation of RP-HPLC method for simultaneous estimation of isoniazid and amp; # 38; pyridoxine in bulk and it pharmaceutical formulations. Am J PharmTech Research. 2019 Feb 8;9(1):215-25. doi: 10.46624/ajptr.2019.
Aktas AH, Muhı Allaw Ahbabi A. Simultaneous determination of valsartan and hydrochlorothiazide by first-order derivative-zero crossing UV-visible spectrophotometric method. Univers J Pharm Res. 2022 Sep 15. doi: 10.22270/ujpr.v7i4.808.
Tarigan RE, Yustifin S. Determination of isoniazid and pyridoxine hydrochloride levels in tablets with ultraviolet spectrophotometry by successive ratio derivative. AMSPH. 2022;3(1):95-101.
Lotfy HM, Saleh SS. Investigating advanced approaches based on iso-absorptivity coefficient in unresolved spectral signals of binary mixtures. J Anal Methods Chem. 2019 Feb 3;2019:7924821. doi: 10.1155/2019/7924821, PMID 30863656.
Moffat AC, Osselton MD, Widdop B. Clarke’s analysis of drugs and poisons. 4th ed. London: Pharmaceutical Press; 2011. p. 1530.
Shoukat U, Baumeister E, Knuutila HK. ATR-FTIR model development and verification for qualitative and quantitative analysis in MDEA–H2O–MEG/TEG–CO2 blends. Energies. 2019 Aug 26;12(17):3285. doi: 10.3390/en12173285.
Lotfy HM, Morgan EM, Fayez YM, Abdelkawy M. Different aspects in manipulating overlapped spectra used for the analysis of trimebutine maleate and structure elucidation of its degradation products. Future J Pharm Sci. 2019 Nov 12;5(1). doi: 10.1186/s43094-019-0004-y.
Paris Junior J, Cavicchioli M, Machado R, Pavan F, Nakahata DH, Corbi P. Synthesis, characterization, Dft modeling and in vitro antimycobacterial activity assays of a silver(I)-isoniazid complex. Quim Nova. 2020. doi: 10.21577/0100-4042.20170681.
Hidayati N, Fianti A, Arnela M. Study of boron complexation with pyridoxine: effect of interaction time, temperature, and amount of pyridoxine. Indonesian J Fundam Appl Chem. 2023 Jun 26;8(2):76-81. doi: 10.24845/ijfac.v8.i2.76.
Alauhdin M, Eden WT, Alighiri D. Application of infrared spectroscopy for the analysis of plants and herbal medicines. ISK. 2021;4:15.
Run Ye, Zhou, En Ye H, Ye En, Zhou Joseph, Ye, J. Supplemental table 1 for Relationship between the concentration of green ink in distilled water and integrated photon absorbance measured using a 3D-printed spectrometer; 2023. doi: 10.6084/m9.figshare.21987344.
Andrews SS, Boxer SG. Analysis of noise for rapid-scan and step-scan methods of FT-IR difference spectroscopy. Appl Spectrosc. 2001 Sep;55(9):1161-5. doi: 10.1366/0003702011953414.
Sandt C, Waeytens J, Deniset Besseau A, Nielsen Leroux C, Rejasse A. Use and misuse of FTIR spectroscopy for studying the bio-oxidation of plastics. Spectrochim Acta A Mol Biomol Spectrosc. 2021 Sep;258:119841. doi: 10.1016/j.saa.2021.119841, PMID 33932634.
Brereton RG. Multivariate calibration. Chichester: John Wiley & Sons; 2024. p. 305-19. doi: 10.1002/9781119639398.
Mallah MA, Sherazi ST, Mahesar SA, Khaskheli AR. Simultaneous quantification of ibuprofen and paracetamol in tablet formulations using transmission Fourier transform infrared spectroscopy. Am J Anal Chem. 2012;3(8):503-11. doi: 10.4236/ajac.2012.38067.
Przybył K, Koszela K, Adamski F, Samborska K, Walkowiak K, Polarczyk M. Deep and machine learning using SEM, FTIR, and texture analysis to detect polysaccharide in raspberry powders. Sensors (Basel). 2021 Aug 30;21(17):5823. doi: 10.3390/s21175823, PMID 34502718.
Rohman A. Vibrational spectroscopy: theory and its applications for pharmaceutical analysis. Yogyakarta: Gadjah Mada University Press; 2014. p. 18-21, 28-9, 34-52, 79, 82-3.
Raturandang R, Wenas DR, Mongan S, Bujung C. FTIR spectroscopy analysis for the chemical and physical characterization of Hot Spring fluids in the Pine Forest tourism area of Tomohon, North Sulawesi. J Fis. 2022 May 3;3(1):28-33. doi: 10.53682/fista.v3i1.167.
Taghizade M, Ebrahimi M, Fooladi E, Yoosefian M. Simultaneous spectrophotometric determination of the residual of ciprofloxacin, famotidine, and tramadol using magnetic solid phase extraction coupled with multivariate calibration methods. Microchem J. 2021 Jan;160:105627. doi: 10.1016/j.microc.2020.105627.
Nengsih TA, Bertrand F, Maumy Bertrand M, Meyer N. Determining the number of components in PLS regression on incomplete data set. Stat Appl Genet Mol Biol. 2019 Nov 6;18(6). doi: 10.1515/sagmb-2018-0059, PMID 31693499.
Deng BC, Yun YH, Liang YZ, Cao DS, Xu QS, Yi LZ. A new strategy to prevent over-fitting in partial least squares models based on model population analysis. Anal Chim Acta. 2015 Jun;880:32-41. doi: 10.1016/j.aca.2015.04.045, PMID 26092335.