
Int J App Pharm, Vol 17, Issue 3, 2025, 348-360Original Article
DESIGN, DEVELOPMENT AND EVALUATION OF NOVEL GAULTHERIA OIL MICROEMULSIONS WITH ENHANCED LOADING OF PIROXICAM FOR TOPICAL DELIVERY IN THE TREATMENT OF ARTHRITIS
VANI SETTY1*, VENKATESAN NATARAJAN2, SREEDHAR CHANDANAM3, CHANDRASEKAR SANDANAPALLI BASAVARAJAIAH4
1Sri Balaji Vidyapeeth, Deemed-to-be University, Pondicherry-607402, India. Drugs Testing Laboratory, Drugs Control Department, Government of Karnataka, India. 2School of Pharmacy, Sri Balaji Vidyapeeth, Deemed-to-be University, Pondicherry-607402, India. 3Department of Pharmaceutical Chemistry, Karnataka College of Pharmacy, Bangalore-560064, Karnataka, India. 4Drugs Testing Laboratory, Drugs Control Department, Government of Karnataka, India
*Corresponding author: Vani Setty; *Email: vanisramu@gmail.com
Received: 04 Oct 2024, Revised and Accepted: 12 Feb 2025
ABSTRACT
Objective: In the present research, the plant oil of Gaultheria procumbens (family: Ericaceae), an extensively utilized ethnic drug to treat arthritis and get rid of pain, was selected to formulate Micro Emulsions (MEs). The objective of this research was to examine the suitability of gaultheria oil in formulating MEs containing Non-Steroidal Anti-Inflammatory Drug (NSAID) for topical use.
Methods: A new water-in-oil Piroxicam Micro Emulsions (PMs) consisting of gaultheria oil, tween 20 and Poly Ethylene Glycol (PEG) 600 were formulated using D-optimal design expert software for optimization of formulation and also to enhance the loading capacity of a model NSAID piroxicam has been demonstrated. The pseudo-ternary phase drawing has been depicted on a constant surfactant/co-surfactant (S-mix) ratio (1:1). Then the prepared PMs were evaluated for percentage (%) transmittance, pH determination, refractive index (RI), viscosity measurement, % drug content, particle size, zeta potential, in vitro cumulative drug release and stability studies.
Results: The pre-formulation studies showed high solubility of drug (piroxicam) with gaultheria oil, tween 20 and PEG 600, thereby confirming its suitability for formulation. Fourier Transform Infrared Spectroscopy (FTIR) proved drug excipient compatibility by retaining the characteristic peaks even after formulation. D-optimal design expert software was proved to be beneficial in the formulation and optimization process and matched the experimental results. Optimized Piroxicam Micro Emulsion (PM) formulation PM 8 showed satisfactory results regarding % transmittance (98.84±1.04), pH (7.41±0.01), RI (1.4421±0.002), viscosity (469.53±0.61), % drug content (96.32±0.19), particle size (185.5 nm±0.24 nm), zeta potential (-25.34±0.51), in vitro cumulative drug release in 6 h (42.62 %±0.11 %) and 12 h (86.42 %±0.21 %). The drug release kinetics study showed a zero-order release mechanism confirmed by Korsmeyer-peppas model. Stability studies as per International Council for Harmonization (ICH) guidelines demonstrated the stability of PM 8 for its physical appearance, phase separation, % transmittance, pH and % drug content for 90 d.
Conclusion: Thus, it can be concluded that the present investigation study can be beneficial for improved loading of model NSAID piroxicam in the interfacial film of PM with gaultheria oil as a promising vehicle aimed at the topical conveyance of drugs in the management of arthritis.
Keywords: Microemulsions, Gaultheria oil, Arthritis, Pseudo-ternary phase drawing, Design expert software
© 2025 The Authors. Published by Innovare Academic Sciences Pvt Ltd. This is an open access article under the CC BY license (https://creativecommons.org/licenses/by/4.0/)
DOI: https://dx.doi.org/10.22159/ijap.2025v17i3.52860 Journal homepage: https://innovareacademics.in/journals/index.php/ijap
INTRODUCTION
Arthritis is the most prevailing pain affecting millions of people globally. It develops when the protective cartilage insulating the bones wear out over time [1]. Even though, arthritis can catastrophe any joint, the most affected joints are the spine, hips, knees and hands [2, 3]. The disorders usually progress gradually and deteriorate sometime. Signs and indications of arthritis comprise stiffness, pain and inflammation, grating sensation; loss of elasticity and bone outgrowth leading to swelling. Hence, it should be treated at the earliest to avert bone damage [4, 5].
The genus Gaultheria, consisting of approximately 134 species, is widely engaged as an ethnic drug to treat arthritis and relieve pain. Gaultheria oil is also known as wintergreen essential oil [6]. It is one of the two plants in the world that comprises 'methyl salicylate' (The other plant being Betula lenta, family: Betulaceae) [7]. It is the chemical behind the strong soothing properties of gaultheria oil. Phytochemical investigations of previous works on the genus Gaultheria have shown the presence of extensive methyl salicylate derivatives [8]. Methyl salicylate is considered as a characteristic ingredient for its anti-arthritic effects [9]. In this research, MEs for arthritis using gaultheria oil are explored to establish its potential and advance research [10, 11].
Piroxicam is a NSAID belonging to the oxicam group and Bio pharmaceutics Classification System (BCS) Class II drug employed to relieve the indications of tender inflammatory disorders in arthritis. It acts by checking the production of endogenous prostaglandins that mediate swelling, pain, stiffness and tenderness. It is used in the treatment of certain inflammatory conditions like Rheumatoid Arthritis (RA) and Osteo Arthritis (OA) to relieve moderate to severe pain [12-14]. Its effect usually lessens pain and inflammation by performing as a non-selective Cyclo Oxygenase (COX) 1 and 2 Inhibitors. Piroxicam should be taken with caution in patients with liver disease and severe kidney disease since its half-life is 50 h. Hence it is desirable to use transdermal delivery of piroxicam rather than oral administration, for treating arthritis. Presently available forms of piroxicam topical applications have potency of 0.5 % w/v, which is not sufficient for the chronic treatment of arthritis [15-17].
MEs are clear, thermodynamically stable, transparent, optically isotropic systems consisting of oil, surfactant, co-surfactant and an aqueous phase. They work together to form stable MEs, by lowering the interfacial tension. MEs have been stated to advance the rate and magnitude of absorption of lipophilic drugs. Thus, MEs are used as impending drug delivery vehicles due to their reversibility and thermodynamic stability. It has simple manufacturing and scale-up practicability and does not necessitate any distinct equipment. Water-in-oil (w/o) MEs are the most appropriate form that is projected to enhance the solubility of drugs by dissolving into an oil phase [18-21].
Hence in this research, we used gaultheria oil, the plant oil of the genus Gaultheria procumbens and developed a novel PMs for enhanced loading of piroxicam.
MATERIALS AND METHODS
Materials
Piroxicam acquired as a gift sample from Alcon Biosciences Pvt Ltd, Vapi, Gujarat, India. Gaultheria oil purchased from Tamil Nadu Tea Plantation Corporation Ltd., Ooty, Tamil Nadu, India. Tween 20 purchased from Industrial chemicals, Hyderabad, India. PEG 600 purchased from Matangi Industries, GIDC, Vatva, Ahmadabad, Gujarat, India. The solvents and chemicals employed remained analytical grade. Water employed in the research was High Performance Liquid Chromatography (HPLC) grade. All other chemicals employed were of analytical grade. Instruments employed were UV 1900 Shimadzu corporation Japan, Bruker ATR Germany for FTIR, Shimadzu AUX-224 electronic analytical balance, Consolidated electrical Industries pH meter, Electrolab–Trust E-08 Servewell instrument for dissolution testing, Remi magnetic stirrer, Anton Scientific Franz diffusion cell, Videocon refrigerator, Equitron/7047 DT-043 Ecogain series hot air oven, Check Melt VR melting point apparatus, Zeta sizer ZS nano series for globule size and zeta potential, LVDVE230 model Brookfield viscometer and 2WAJRI model Abbe refractometer.
Methods
Pre-formulation study of piroxicam
Physicochemical properties
The piroxicam Working Reference Standard (WRS) was analyzed for physicochemical properties such as physical appearance, colour and odour, and then compared with piroxicam Indian Pharmacopoeial Reference Standard (IPRS) [22].
Melting point (MP)
MP of piroxicam WRS was found by using an open capillary technique by employing melting point apparatus and compared with piroxicam IPRS [23].
Determination of maximum wavelength λmax by spectroscopy
In 0.1 molar (M) methanol: Piroxicam WRS (10 mg) was precisely weighed, taken into a 100 ml volumetric flask, then made up the volume with 0.1 M methanol to attain the strength of 100 microgram (µg)/ml. It was considered Standard Stock I (SS-I). SS-I was suitably diluted with 0.1 M methanol to get a concentration of 10 µg/ml. It was considered as standard stock II (SS-II). This final SS-II was scanned between 200-400 nm by –Ultra Violet (UV)-visible spectrophotometer.
In 0.1 M methanolic Hydro Chloric Acid (HCl): Piroxicam WRS (10 mg) was precisely weighed and taken into a 100 ml volumetric flask, then made up volume with 0.1 M methanolic HCl to attain the strength of 100 µg/ml. It was considered as SS-I. SS-I was suitably diluted with 0.1 M methanolic HCl to obtain 10 µg/ml (SS-II) concentration. This final SS-II was scanned between 200-400 nm by UV-visible spectrophotometer.
In phosphate buffer solution (PBS) pH 7.4: Piroxicam WRS (10 mg) was precisely weighed and taken into a 100 ml volumetric flask; made up the volume with PBS pH 7.4 to attain 100 µg/ml concentration. This was considered SS-I. SS-I was suitably diluted with PBS pH 7.4 to get a concentration of 10 µg/ml (SS-II). This final SS-II was scanned between 200-400 nm by UV-visible spectrophotometer [24, 25].
Construction of beer-lambert’s plot
In 0.1 M methanol: 10 mg of piroxicam WRS was precisely weighed and taken into a 100 ml volumetric flask and made up the volume with 0.1 M methanol to get a concentration of 100 µg/ml (SS-I). From SS-I, 10 ml was withdrawn and taken into another 100 ml volumetric flask and made up the volume with 0.1 M methanol to obtain 10 µg/ml concentration (SS-II). From SS-II, aliquots 2, 4, 6, 8 and 10 ml were taken into 10 ml volumetric flasks separately and made up the volume with 0.1 M methanol. This provides 2, 4, 6, 8 and 10 µg/ml concentrations of solutions respectively. Then absorbance of UV-visible spectroscopic readings of each resulting solution was recorded at their respective λmax.
In 0.1 M methanolic HCl: 25 mg of piroxicam WRS was precisely weighed and taken into a 100 ml volumetric flask, made up volume with 0.1 M methanolic HCl to obtain 250 µg/ml (SS-I) concentration. From SS-I, 10 ml was taken into another 100 ml volumetric flask and made up the volume with 0.1 M methanolic HCl to obtain 25 µg/ml concentration (SS-II). From SS-II, aliquots 1, 1.5, 2, 2.5 and 3 ml were taken into 10 ml volumetric flasks separately and made-up volume with 0.1 M methanolic HCl. This gives 2.5, 3.7, 5.0, 6.2 and 7.5 µg/ml concentration of solutions respectively. Then absorbance of UV-visible spectroscopic readings of each resulting solution was recorded at their respective λmax.
In PBS pH 7.4: 10 mg of piroxicam WRS was precisely weighed and taken into a 100 ml volumetric flask and made up the volume with PBS pH 7.4 to obtain a 100 µg/ml (SS-I) concentration. From SS-I, 10 ml was withdrawn and taken into another 100 ml volumetric flask and made up the volume with PBS pH 7.4 to obtain 10 µg/ml (SS-II) concentration. From SS-II, aliquots 2, 4, 6, 8 and 10 ml were taken into 10 ml volumetric flasks separately and made-up volume by PBS pH 7.4 to get 2, 4, 6, 8 and 10 µg/ml concentration of solutions respectively. Then absorbance of UV-visible spectroscopic readings of each resulting solution was recorded at their respective λmax.
Then the beer-lambert’s plot in each solution was constructed by taking absorbance on the y-axis and concentration (µg) on the x-axis. Interpretation of the linearity was made based on the linearity coefficient (R2) value [26].
Solubility of piroxicam WRS
An assessment test of the solubility of the drug was considered a test for its purity and it’s an official constraint [27]. Hence, the solubility of piroxicam WRS was carried out by employing various solvents. For testing, 2 ml of the carefully chosen vehicles along with an excess of piroxicam WRS were taken into screw-capped vials and stirred at 100 rotations per minute (rpm) for 72 h at 37 C±0.5 C. After attaining equilibrium, each of the vials were subjected to centrifugation at 3000 rpm for 30 min. Allow to stand for 30 min, decant the clear supernatant liquid and its absorbances was determined in each solvent by UV-visible spectrophotometer at 354 nm and calculate the solubility in terms of mg/ml.
Fourier Transform InfraRed (FTIR) spectroscopy of piroxicam WRS and IPRS
The FTIR spectroscopy was widely employed for comparing the drug substance under examination with their respective IPRS for identification purpose. FTIR finds extensive application in the qualitative and quantitative investigation of a drug sample, since no two compounds (excluding optical isomers) give alike FTIR spectra [28]. It was recorded by placing the sample on the sampler/sample holder of the FTIR spectrophotometer and scanned in the wavelength range of 4000 cm-1 to 400 cm-1. The FTIR spectra of piroxicam WRS were compared with piroxicam IPRS.
Solubility of piroxicam WRS with oils, surfactants and co-surfactants
The solubility of piroxicam WRS was investigated by taking a predetermined quantity (10 mg) of piroxicam WRS and then mixed with 1 ml of selected oils, surfactants and co-surfactants separately in screw-capped bottles and kept it in an orbital shaker for 1 h at 150 rpm. Then, centrifuged (500 rpm) for 20 min and then suitably diluted with PBS 7.4 to get a concentration of 20 µg/ml and observed for any separation of the layers. Then the absorbance of resulting solution in each excipient was determined by a UV-visible spectrophotometer at 354 nm [29].
Partition coefficient (Kp)
It describes the pattern of distribution of a solute/drug between two immiscible liquids. It was used to measure the hydrophobicity and thereby its permeability. It was calculated by partition coefficient between n-octanol/water and cyclohexane/water. It was performed by the shake flask method of centrifugation followed by determining solute concentration by using the formula Kp=C1/C2. (C1= concentration of drug in one phase, C2= concentration of drug in second phase). If the log Kp value was found to be more than 1, then the solute was said to be highly soluble in lipophilic solvents like octanol and if the log Kp value was found to be less than 1, then the solute was said to be highly soluble in hydrophilic solvents like water. This demonstrates the absorption, transportation and distribution pattern [30].
Construction of pseudo-ternary phase drawings
The pseudo-ternary phase drawings were fabricated to find suitable constituents along with their concentrations that give rise to a bulky existence zone of ME. It was performed to optimize the quantity of the oil phase, S-mix and water components that bring about the most stable form of ME [31]. Three proportions of S-mix comprising of surfactant (tween 20) and co-surfactant (PEG 600) were mixed in proportions of 1:1, 2:1 and 1:2. Each S-mix ratio was mixed with oil in the ratios of 1:9, 2:8, 3:7, 4:6, 5:5, 6:4, 7:3, 8:2 and 9:1. Then each formulation was titrated with distilled water and readings were recorded for clarity or turbidity. Once a clear, transparent mixture was envisioned after stirring, it was considered a monophasic system and noted as points while constructing phase drawings. The area covered by these marked points were noticed and considered as a stable ME region of equilibrium. The formulation with maximum equilibrium region was considered as an optimized formulation and selected for PMs formulation.
Optimization protocol by design of experiment (DOE) analysis
Optimization by DOE is a method to explore process variables of input to maximize/minimize/target a response variable [32]. In the present research, the D-optimal DOE model, design expert software was used to achieve the desired output. DOE was designed taking three factors namely oil, S-mix and water to accomplish the responses namely, globule size, % transmittance and in vitro cumulative drug release (%) in 6 h and 12 h as shown in table 1. The DOE analysis of Quality by Design (QBD) optimization predicted 12 experimental runs for the formulation of PMs as shown in table 2. DOE analysis of factors versus responses is shown in table 3, table 4.
Table 1: DOE parameters for PMs
| For PM formulation design |
| QBD |
| Design |
| Model |
| Tool |
| Version |
| Variables |
| Response |
Table 2: Optimization protocol design by DOE for PMs with predicted responses (factors versus responses)
| Run | Factor 1 | Factor 2 | Factor 3 | Response 1 | Response 2 | Response 3 | Response 4 |
| A: Oil | B: S-mix | C: Water | R1: Globule size | R2: Transmittance | R3: in vitro cumulative drug release in 6 h | R4: In vitro cumulative drug release in 12 h | |
| ml | ml | ml | nm | % | % | % | |
| 1 | 7 | 4 | 2 | 190.41 | 95.43 | 41.41 | 81.38 |
| 2 | 6.3 | 3 | 3 | 178.41 | 96.42 | 40.52 | 80.22 |
| 3 | 6 | 3 | 2.3 | 183.43 | 98.25 | 36.71 | 76.51 |
| 4 | 6 | 4 | 2 | 180.21 | 97.25 | 36.48 | 76.32 |
| 5 | 6.4 | 3.4 | 2 | 183.21 | 96.64 | 40.18 | 80.62 |
| 6 | 6 | 3 | 3 | 182.86 | 97.22 | 36.79 | 76.78 |
| 7 | 6.4 | 4 | 2.5 | 180.79 | 96.24 | 41.31 | 81.37 |
| 8 | 7 | 4 | 3 | 189.95 | 95.26 | 41.12 | 80.96 |
| 9 | 6 | 4 | 2 | 185.09 | 97.45 | 36.43 | 76.26 |
| 10 | 6 | 3.6 | 3 | 181.56 | 97.45 | 36.43 | 76.28 |
| 11 | 7 | 3.4 | 2.6 | 191.08 | 97.09 | 40.67 | 80.76 |
| 12 | 7 | 3 | 2 | 193.24 | 95.29 | 40.59 | 80.31 |
Table 3: DOE analysis of factors
| Factor | Name | Units | Type | Sub type | Minimum | Maximum | Coded low | Coded high | Mean | SD |
| A | Oil | ml | Numeric | Continuous | 6.00 | 7.00 | -1 ↔ 6.00 | +1 ↔ 7.00 | 6.5 | 0.4534 |
| B | S-mix | ml | Numeric | Continuous | 3.00 | 4.00 | -1 ↔ 3.00 | +1 ↔ 4.00 | 3.5 | 0.4547 |
| C | Water | ml | Numeric | Continuous | 2.00 | 3.00 | -1 ↔ 2.00 | +1 ↔ 3.00 | 2.5 | 0.4546 |
(SD: Standard deviation) (n=3)
Table 4: DOE analysis of responses
| Response | Name | Units | Observations | Minimum | Maximum | Mean | SD |
| R1 | Globule size | nm | 12.00 | 178.41 | 193.24 | 185.82 | 0.9112 |
| R2 | Transmittance | % | 12.00 | 95.26 | 98.25 | 96.75 | 0.9633 |
| R3 | In vitro drug release in 6 h | % | 12.00 | 36.43 | 41.41 | 38.92 | 0.2284 |
| R4 | In vitro drug release in 12 h | % | 12.00 | 76.26 | 81.38 | 78.82 | 0.2861 |
(SD: Standard deviation) (n=3)
Formulation of gaultheria oil PMs
Gaultheria oil PMs were prepared by water titration technique. Formulations were designed as per the DOE model and the piroxicam quantity was kept constant in all formulations as shown in table 5. Piroxicam was initially dissolved in a pre-measured quantity of gaultheria oil and mixed on a magnetic stirrer at 300 rpm and at a set temperature of 37 ᵒC±0.5 °C for 30 min. S-mix comprising of tween 20 and PEG 600 in different proportions of 1:1, 1:2 and 2:1 were considered as one factor, oil and water as other two factors and pseudo ternary phase drawings were established taking these three factors and the one showing high equilibrium area was selected. Thus, selected proportion of S-mix was then slowly added to the above mixture. Continue stirring for 30 min. After cooling the resulting mixture, titrated with distilled water till clear, transparent homogenous PMs were formed. Thus formed PMs were characterized for various parameters and the experimental results were compared with DOE predicted results [33-37].
Table 5: Formulation table of PMs
| Formulation code | Piroxicam | A: Gaultheria oil | B: 1:1 ratio of S-mix (tween 20: PEG 600) | C: Water |
| % w/v | ml | ml | ml | |
| PM1 | 1 | 7.0 | 4.1 | 1.9 |
| PM 2 | 1 | 6.9 | 4.0 | 2.1 |
| PM 3 | 1 | 6.8 | 3.9 | 2.3 |
| PM 4 | 1 | 6.7 | 3.8 | 2.5 |
| PM 5 | 1 | 6.6 | 3.7 | 2.7 |
| PM 6 | 1 | 6.5 | 3.6 | 2.9 |
| PM 7 | 1 | 6.4 | 3.5 | 3.1 |
| PM 8 | 1 | 6.3 | 3.4 | 3.3 |
| PM 9 | 1 | 6.2 | 3.3 | 3.5 |
| PM 10 | 1 | 6.1 | 3.2 | 3.7 |
| PM 11 | 1 | 6.0 | 3.1 | 3.9 |
| PM 12 | 1 | 5.9 | 3.0 | 4.1 |
Characterization of PMs
% transmittance
% transmittance of PMs was analyzed by measuring the absorbance through UV-visible spectrophotometer at 650 nm with the blank being distilled water [38]. Tests carried out in triplicate for each one of the PMs and mean values were reported.
pH determination
The pH of PMs was analyzed by a digital pH meter [39]. The electrode was directly immersed into the PMs maintained at 25 °C and measurements were taken in triplicate.
RI
RI of MEs ideally ranges from 1.39 to 1.45. If the RI value was nearer to 1.45, the ME was said to be water-in-oil type [40]. A drop of PM was placed on the slide of a refractometer and its RI was measured at 25 °C. Measurements were taken in triplicate.
Viscosity measurement
Generally, MEs were less viscous and transparent systems comprising two immiscible systems of oil and water, which were stabilized through the addition of surfactants and co-surfactants to reduce the interfacial tension. Thus, they exhibit shear-thinning behaviour, by decreasing their viscosity. Brookfield viscometer was used to measure the viscosity of the PMs at 25 °C and 50 rpm by using spindle no 34 [41]. Measurements were taken in triplicate.
Determination of drug content
Estimation of the drug content in the PMs was analyzed by taking a sample of 1 ml and dissolving it in 10 ml of 0.1 M methanol. This is appropriately diluted with 0.1 M methanol to get 5 µg/ml concentration and its absorbance was taken at a wavelength of 333 nm using UV-visible spectrophotometer. Control being piroxicam WRS 5 µg/ml concentration in 0.1 M methanol [42]. The measurements were performed in triplicates for each PM formulation.
Particle size determination
The particle size of MEs usually ranges from 10 to 200 nm, due to which they have a clear transparent appearance [43]. The particle sizes of the prepared PMs were determined by using a particle size analyzer namely, zeta seizer. Samples were positioned in zeta cells of a zeta seizer and recording were made for the particle size. Measurements were taken in triplicate.
Zeta potential
It was determined to find out the surface charge on the drop, which was employed as a tool to determine its stability. Usually positive or negative zeta potential is required for ME stability. Generally, MEs with high zeta potential of ±30 mV were considered as pharmaceutically stable. And in the case of water-in-oil emulsions, the more the zeta potential value, the more stable the emulsion will be. Usually, this negative charge on the drop is owing to the existence of fatty acids [44]. It was measured by placing a drop of PM in the zeta cells of a zeta seizer and recording were made for zeta potential. The measurements were recorded in triplicate.
In vitro drug release
In vitro drug release studies were done to measure the rate and extent of drug release from ME formulations. MEs have been noted to enhance the absorption rate of lipophilic drugs [45]. The in vitro drug release study was performed using a Franz diffusion cell, by taking PBS pH 7.4 in the receptor compartment and PM formulation equivalent to 10 mg drug in the donor compartment which was separated by a cellophane membrane (cutoff weight= 1000 daltons (Da). At predetermined time interims of 30 min, 1 h, 6 h and 12 h aliquots were withdrawn from the receptor section and suitably diluted with PBS pH 7.4 and its drug content were estimated (as described in the determination of drug content) by using UV-visible spectrophotometer at 354 nm.
FTIR spectroscopy of optimized formulation
FTIR spectroscopy was one of the finest techniques to assess the compatibility of WRS of drugs with excipients, checking their purity and to compare with their respective IPRS. It was performed to conclude the interaction of the drug with excipients, thereby providing information regarding the compatibility of the drug and its shelf life [46]. It was recorded by placing the optimized PM formulation on the sampler/sample holder of the FTIR spectrophotometer and scanned in the wavelength range of 4000 cm-1 to 400 cm-1 and compared with the FTIR spectra of piroxicam WRS.
Stability studies
Accelerated stability study of optimized PMs was performed according to ICH guidelines, wherein the samples were placed in a refrigerator (5 °C±2 °C), in a room temperature (30 °C±2 °C and Relative Humidity (RH) 65 %±5 %) and in climatic chamber (40 °C±2 °C and RH 75 %±5 %) for 90 d [47-50]. After every 30 d the samples were observed for physical appearance, phase separation (after centrifugation at 5000 rpm for 10 min and visually observed for creaming or phase separation), % transmittance, pH and drug content.
Statistical analysis
In each experiment after performing thrice, results were expressed as mean±SD. The statistical significance of difference was determined by one-way analysis of variance by means of student’s t-test.
RESULTS AND DISCUSSION
The pain was the most prevalent and severe form in the case of arthritis. OA and RA are the most common types of arthritis, associated with pain and joint damage even though they are different diseases. Thus, NSAIDs were widely prescribed to treat mild to moderate pain, in case of OA, RA, musculoskeletal pain, inflammation and dental pain in the day-to-day management of the patients [51]. Excessive oral administration of these NSAIDs may lead to mucosal ulceration and bleeding, leading to anemia of gastro-intestinal origin or loss of protein. Thereby giving pavement for a common bacterium namely, Helicobacter pylori to induce gastritis and peptic ulcer disease. Thus, increasing the medical expenses of treatment and also decreasing the quality of life of the patients who were mainly on oral intake of NSAIDs. Hence topical administration of NSAIDs was much preferred over oral administration for better stability, drug loading capacity, production feasibility, better absorption and for incorporation of hydrophobic drugs [52]. MEs were highly preferred due to their transparent, optically isotropic, thermodynamically stable properties, increased drug solubility and therapeutic efficacy especially in the case of transdermal delivery when compared to other conventional systems and mainly used for incorporating poorly water-soluble substances [53].
Piroxicam was a NSAID belonging to BCS class II having high permeability and low solubility. Thus, MEs were best suitable form for its administration via topical delivery. Previous studies demonstrated the advantages of piroxicam topical forms over oral administration especially in the treatment of various forms of arthritis [54, 55]. Hence piroxicam was selected as a model drug for the formulation of PMs.
Gaultheria oil was an essential oil (obtained from Gaultheria procumbens L.) mainly comprised of methyl salicylate (96.90%) widely used as an ethnic medicine in the treatment of pain. So far research activities have been performed on gaultheria oil, to study its analgesic, anti-inflammatory, antimicrobial, antioxidant and anti-radical activities and no formulation has been attempted using this oil [56-60]. Hence a successful attempt was made in our research to encapsulate piroxicam in the ME film of gaultheria oil for enhanced loading of the drug, thereby enhancing analgesic, anti-inflammatory and antiarthritic activity [61-63]. Tweens and PEGs were used as successful surfactant and co-surfactant combinations to protect the MEs against agitation-induced aggregation, thereby enhancing its stability. Tween 20 commonly called polysorbate 20 is a non-ionic surfactant widely used in topical formulations owing to its stability, relative non-toxicity and permeation enhanced properties. PEGs were United States Food and Drug Administration (USFDA) approved polymer of choice in topical drug delivery systems, due to their well-established safety profile. PEG was also known as polyethylene oxide or polyoxyethylene comprising polyether compounds with repeated ethylene glycol units [64, 65]. Due to their hydrophilic and non-ionic nature, they were very much preferred as permeation enhancers and employed as co-surfactants in dermatological formulations. Various grades of tweens and PEGs are available depending upon their molecular weight. Previous studies showed that piroxicam with tween 80, tween 20 and PEG 400 had less drug entrapment efficiency. In another study, solid lipid nanoparticles of piroxicam comprising of tweens and PEGs proved it as a novel vehicle for sustained release in case of transdermal delivery. So far studies have shown the entrapment efficiency of piroxicam in various transdermal forms comprising of different oils, tweens and PEGs to be around 84.48 % to 85.15 % only [66-68]. However, no research was performed by taking gaultheria oil, tween 20 and PEG 600 combination with piroxicam.
Thus, our present research work highlights the successful unique combination of piroxicam, gaultheria oil, tween 20 and PEG 600 for high drug entrapment efficiency of about 96.32 %, thereby making it a novel platform technology for increased loading of the drug.
In this present research, during the pre-formulation studies, the drug samples of piroxicam WRS matched with the reported standard of piroxicam IPRS for physicochemical properties such as appearance, colour, odour and MP as shown in table 6 and table 7. Thereby confirming piroxicam WRS as a pure drug. Spectroscopic studies showed that the λmax of piroxicam WRS in 0.1 M methanol, 0.1 M methanolic HCl and PBS pH 7.4 was found to be 334.1 nm, 334.6 nm and 354.1 nm respectively and comparable with that of piroxicam IPRS (reported standard values are 333 nm, 334 nm and 354 nm respectively) as shown in fig. 1, fig. 2 and fig. 3. Linearity was established by plotting concentration versus absorbance (beer-lamberts’ plot) of piroxicam WRS in 0.1 M methanol, 0.1 M methanolic HCl and PBS pH 7.4 was found to be linear as shown in table 8, table 9, table 10 and fig. 4, fig. 5, fig. 6.
Table 6: Comparison of physicochemical properties of piroxicam WRS and IPRS
| Identification test | Observed result of piroxicam WRS | Reported standard of piroxicam IPRS |
| Appearance | Off-white to light yellow powder | Off-white powder |
| Colour | White | White/off-white |
| Odor | Odorless | Odorless |

Fig. 1: Absorption maxima of piroxicam WRS in 0.1 M methanol
Table 7: MP determination of piroxicam WRS and IPRS
| S. No. | MP observed | MP of reported standard |
| 1 | 198 °C | 198 °C-200 °C |
| 2 | 199 °C | |
| 3 | 198 °C | |
| Average | 198.33 °C |

Fig. 2: Absorption maxima of piroxicam WRS in 0.1 M methanolic HCl
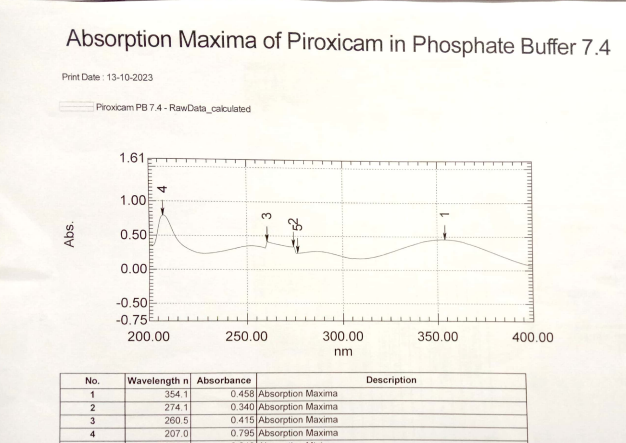
Fig. 3: Absorption maxima of piroxicam WRS in PBS pH 7.4
Table 8: Concentration versus absorbance of piroxicam WRS in 0.1 M methanol
| S. No. | Concentration (µg/ml) | Absorbance (at 334.1 nm) |
| 1 | 0 | 0.000 |
| 2 | 2 | 0.149 |
| 3 | 4 | 0.304 |
| 4 | 6 | 0.458 |
| 5 | 8 | 0.615 |
| 6 | 10 | 0.761 |
(n=3)
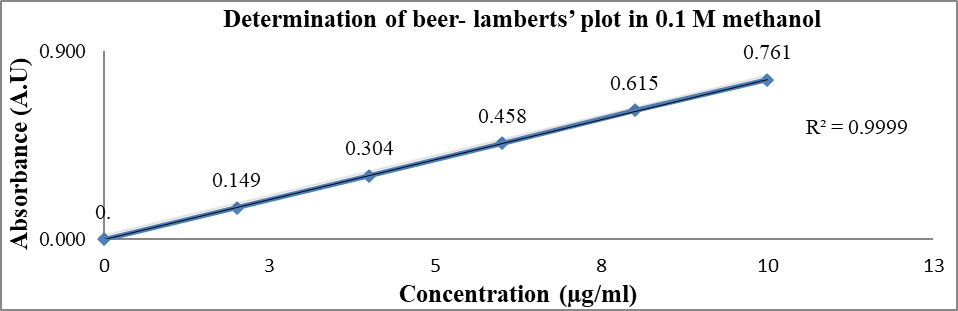
Fig. 4: Determination of beer-lamberts’ plot of piroxicam WRS in 0.1 M methanol
Table 9: Concentration versus absorbance of piroxicam WRS in 0.1 M methanolic HCl
| S. No. | Concentration (µg/ml) | Absorbance (at 334.6 nm) |
| 1 | 0 | 0.000 |
| 2 | 2.5 | 0.181 |
| 3 | 3.7 | 0.275 |
| 4 | 5.0 | 0.378 |
| 5 | 6.2 | 0.468 |
| 6 | 7.5 | 0.559 |
(n=3)

Fig. 5: Determination of beer-lamberts’ plot of piroxicam WRS in 0.1 M methanolic HCl
Table 10: Concentration versus absorbance of piroxicam WRS in PBS pH-7.4
| S. No. | Concentration (µg/ml) | Absorbance (at 354.1 nm) |
| 1 | 0 | 0.000 |
| 2 | 2 | 0.141 |
| 3 | 4 | 0.297 |
| 4 | 6 | 0.449 |
| 5 | 8 | 0.609 |
| 6 | 10 | 0.758 |
(n=3)
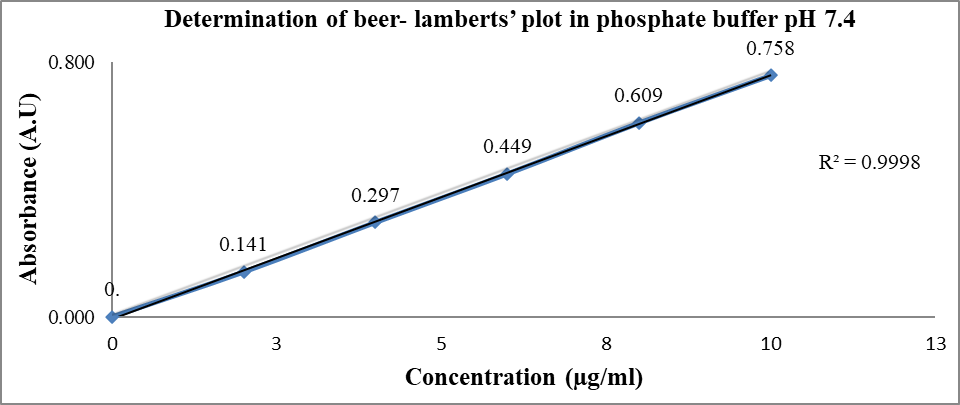
Fig. 6: Determination of beer-lamberts’ plot of piroxicam WRS in PBS pH-7.4
Table 11: Solubility study of piroxicam WRS in different solvents
| S. No. | Solvent | Solubility (mg/ml) |
| 1 | Oleic acid | 5.12±0.20 |
| 2 | IPM | 2.54±0.01 |
| 3 | PG | 5.13±0.01 |
| 4 | DMSO | 5.9±0.45 |
| 5 | PEG 400 | 2.69±0.05 |
| 6 | Lecithin | 2.01±0.31 |
| 7 | Span 80 | 4.3±0.57 |
| 8 | Phosphate buffer (pH 7.4) | 0.595±0.21 |
| 9 | Methanol | 5.29±0.64 |
| 10 | Water | 0.0076 ±0.54 |
(All values are mean±SD, n=3) IPM: Isopropyl myristate, PG: Propylene glycol, PEG: Polyethylene glycol, Span: Sorbitan monolaurate
Further, piroxicam WRS was found to be highly soluble in dimethyl sulphoxide (DMSO), freely soluble in methanol, propylene glycol and oleic acid, soluble in PBS pH 7.4 and very slightly soluble in water as shown in table 11. Overlay of FTIR of piroxicam WRS matched with piroxicam IPRS depicting its characteristic peaks as shown in fig. 7, thereby confirming its purity. During the selection of excipients for enhanced solubility of piroxicam, the highest was found with gaultheria oil, tween 20 and PEG 600 among other oils, surfactants and cosurfactants tested (as shown in table 12, table 13 and table 14) and hence they were taken for construction of pseudo-ternary phase drawings.
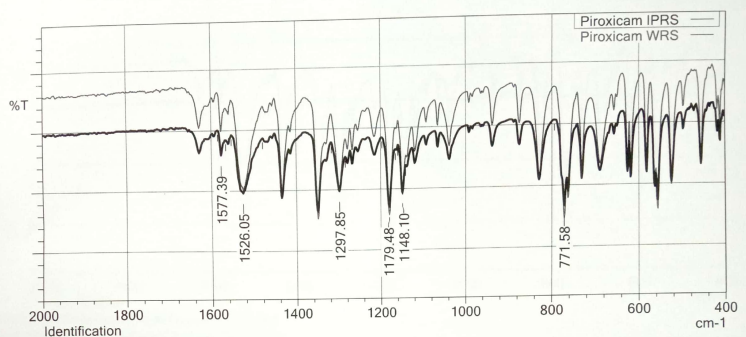
Fig. 7: Overlay of FTIR graphs of piroxicam WRS and IPRS
Table 12: Solubility studies of piroxicam WRS in different oils
| S. No. | Oil | Absorbance (at 354 nm) |
| 1 | Clove oil | 0.6127 |
| 2 | Almond oil | 0.3383 |
| 3 | Cypress oil | 0.6245 |
| 4 | Olive oil | 0.2328 |
| 5 | Gaultheria oil | 0.8127 |
| 6 | Isopropyl myristate | 0.3583 |
(n=3)
Table 13: Solubility studies of piroxicam WRS in different surfactants
| S. No. | Surfactant | Absorbance (at 354 nm) |
| 1 | Tween 20 | 0.2313 |
| 2 | Tween 80 | 0.0020 |
Table 14: Solubility studies of piroxicam WRS in different co-surfactants
| S. No. | Co-surfactant | Absorbance (at 354 nm) |
| 1 | PEG 300 | 0.3158 |
| 2 | Ethanol | 0.2909 |
| 3 | PEG 600 | 0.7513 |
The log partition coefficient (log Kp) of the piroxicam WRS was found to be 3.08 in partitioning solvent n-octanol, indicating lipophilicity and matched with the reported values of piroxicam IPRS as shown in table 15. A drug with low aqueous solubility and high lipophilicity (log Kp= 3 to 4) will have low bioavailability when taken orally. Thereby, affecting its therapeutic efficacy and interfering with the excretion of the drug, resulting in increased systemic toxicity. Thus, such candidates are more suitable for topical delivery.
Table 15: Kp of piroxicam WRS in n-octanol
| S. No. | log Kp of piroxicam WRS | log Kp of piroxicam IPRS |
| 1 | 3.08 | 3.06 |
The pseudo-ternary phase drawings were helpful in selecting optimized proportions of gaultheria oil, S-mix and water, based on maximum emulsification region. It demonstrated the suitability of pseudo-ternary phase drawings for the selection of appropriate concentrations of excipients so as to formulate a most stable ME, which were obtained from the different concentrations of S-mix ratios (1:1, 1:2, 2:1). Based on the highest equilibrium area (shaded area) of phase drawings, S-mix ratio of 1:1 was considered as optimized ratio and selected for piroxicam drug incorporation. The pseudo-ternary phase drawings of various S-mix proportions are depicted in fig. 8.

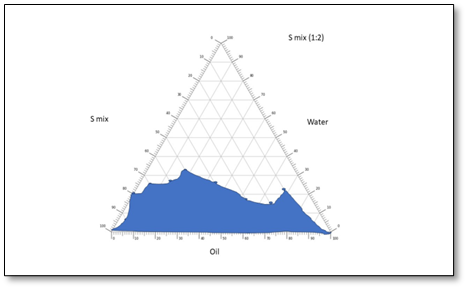
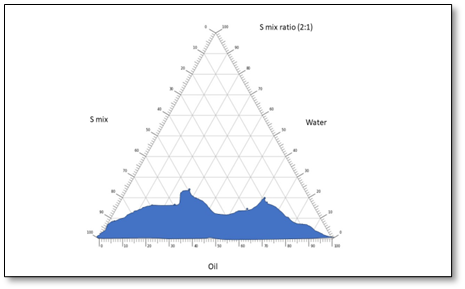
Fig. 8: Pseudo-ternary phase drawings of MEs taking gaultheria oil, S-mix and water
After the selection of the MEs of the S-mix (1:1) ratio, based upon the highest equilibrium area of the pseudo-ternary phase drawings, the piroxicam drug was successfully incorporated to form twelve PMs. The combination of piroxicam, gaultheria oil, tween 20 as surfactant and PEG 600 as co-surfactant resulted in the formulation of PMs which were thermodynamically stable, homogenous dispersions comprising of nano sized particles with improved solubility. The results indicated that among twelve formulated PMs, formulation PM 8 containing piroxicam (1 %), gaultheria oil (63 %), Smix (1:1) (34 %), showed maximum % transmittance of 98.84±1.04 which showed good clarity and pH of 7.41±0.01, making it suitable for transdermal application. RI and viscosity were found to be 1.4421±0.002 and 469.53±0.61 cps and % drug content was found to be 96.32±0.19 (as shown in table 16), thereby indicating maximum drug loading capacity. The zeta potential of optimized PM 8 formulation showed-25.34±0.51 Mv with a particle size of 185.5±0.24 µm and in vitro cumulative drug release (%) in 6 h and 12 h were found to be 42.62±0.11 and 86.42±0.21 respectively (as shown in table 17 and fig. 9, fig. 10), thereby proving sustained release of the drug. The obtained results matched with the D-optimal design expert software projected results, thereby indicating its suitability for the optimization process. The drug release kinetics of optimized PM 8 formulation, demonstrated that the best fit model was found to be zero order with an R2 value of 0.9908 as shown in table 18. The FTIR of optimized PM 8 showed no significant change in the characteristic peaks and thus revealed no interaction between drug and excipient (as shown in fig. 11), thereby confirming drug-excipient compatibility.
Table 16: Characterization of PMs for % transmittance, pH, RI, viscosity and drug content
| Formulation code | Transmittance (%) | pH | RI | Viscosity (cp) | Drug content (%) |
| PM 1 | 84.78±1.19 | 6.24±0.01 | 1.4236±0.004 | 896.36±0.74 | 88.36±0.45 |
| PM 2 | 86.34±1.45 | 6.35±0.02 | 1.4234±0.009 | 810.16±0.57 | 92.32±0.81 |
| PM 3 | 68.61±1.24 | 7.12±0.03 | 1.4187±0.005 | 789.33±0.63 | 86.53±0.73 |
| PM 4 | 76.58±2.17 | 6.84±0.02 | 1.4260±0.007 | 604.66±0.82 | 94.25±0.94 |
| PM 5 | 85.33±1.75 | 7.38±0.01 | 1.4310±0.009 | 671.57±0.74 | 88.28±0.62 |
| PM 6 | 77.51±2.14 | 6.54±0.01 | 1.4187±0.008 | 577.12±0.31 | 87.42±0.41 |
| PM 7 | 68.33±1.61 | 7.34±0.01 | 1.4206±0.006 | 522.71±0.55 | 92.19±0.82 |
| PM 8 | 98.84±1.04 | 7.41±0.01 | 1.4421±0.002 | 469.53±0.61 | 96.32±0.19 |
| PM 9 | 67.36±2.54 | 5.98±0.02 | 1.4311±0.014 | 417.29±0.98 | 84.54±0.84 |
| PM 10 | 77.21±2.85 | 6.57±0.02 | 1.4295±0.021 | 395.74±0.74 | 95.53±0.77 |
| PM 11 | 88.12±2.47 | 7.38±0.02 | 1.4272±0.016 | 363.52±0.94 | 91.33±0.54 |
| PM 12 | 86.50±2.21 | 6.48±0.01 | 1.4275±0.019 | 261.16±0.57 | 84.42±0.35 |
(All values are mean±SD, n=3) cp: Centi poise
Table 17: In vitro cumulative drug release (%) studies of PMs for 6 h and 12 h
| Formulation code | Particle size (nm) | Zeta potential (mV) | In vitro cumulative drug release in 6 h (%) | In vitro cumulative drug release in 12 h (%) |
| PM 1 | 185.1±0.05 | -25.04±1.24 | 41.41±0.12 | 81.38±0.24 |
| PM 2 | 184.9±0.02 | -25.17±2.37 | 40.52±0.32 | 80.22±0.38 |
| PM 3 | 183.2±0.08 | -25.30±1.78 | 36.71±0.25 | 76.51±0.59 |
| PM 4 | 180.1±0.06 | -25.24±1.69 | 36.48±0.45 | 76.32±0.41 |
| PM 5 | 181.5±0.11 | -25.33±1.86 | 40.18±0.64 | 80.62±0.27 |
| PM 6 | 182.2±0.18 | -25.28±2.72 | 36.79±0.21 | 76.78±0.62 |
| PM 7 | 185.0±0.21 | -25.16±2.11 | 40.31±0.37 | 81.37±0.47 |
| PM 8 | 185.5±0.24 | -25.34±0.51 | 42.62±0.11 | 86.42±0.21 |
| PM 9 | 178.9±0.45 | -25.22±1.08 | 36.43±0.28 | 76.26±0.36 |
| PM 10 | 188.7±0.35 | -25.74±1.56 | 36.58±0.51 | 76.67±0.48 |
| PM 11 | 187.5±0.61 | -25.21±1.34 | 40.67±0.95 | 80.76±0.97 |
| PM 12 | 185.6±0.48 | -25.28±1.71 | 40.59±0.99 | 80.31±0.91 |
(All values are mean±SD, n=3) nm: nanometer, Mv: mili volts

Fig. 9: In vitro cumulative drug release (%) studies of PMs
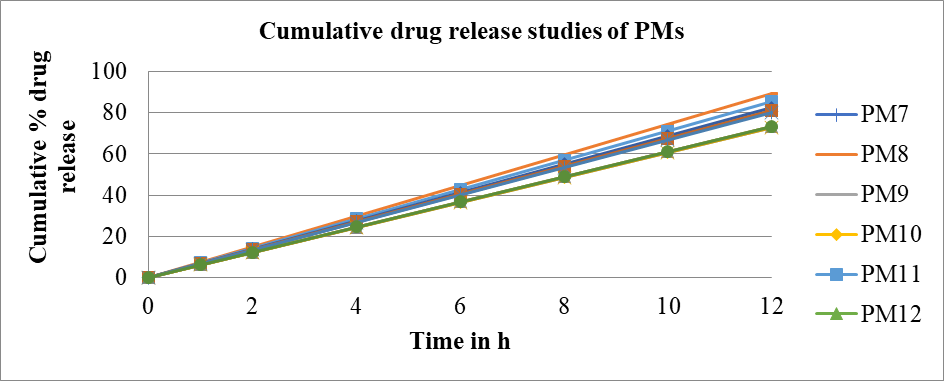
Fig. 10: In vitro cumulative drug release (%) studies of PMs
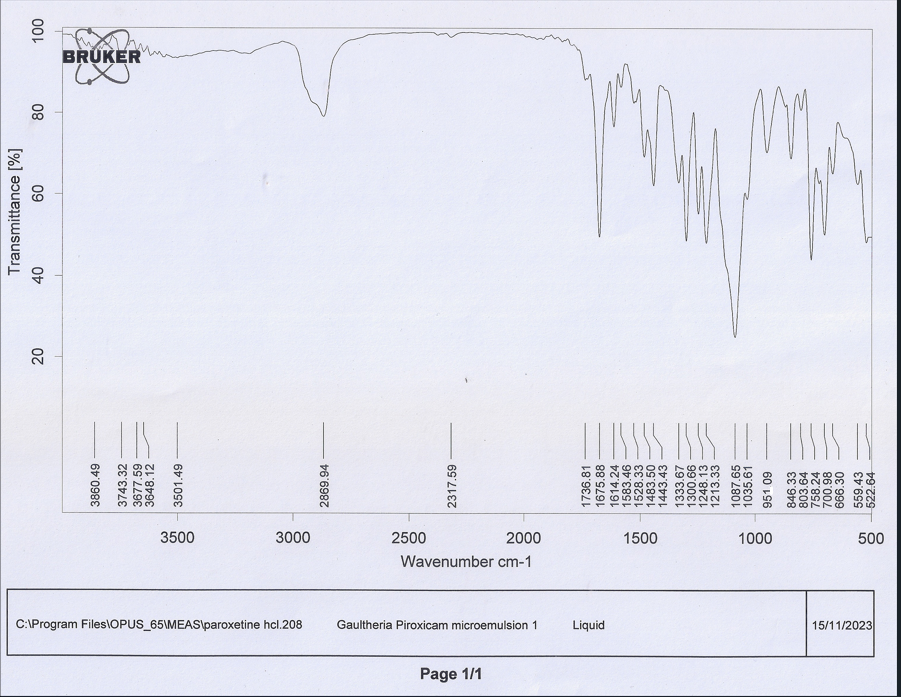
Fig. 11: FTIR graphs of PM 8
Table 18: Drug release kinetics of optimized PM 8 formulation
| Formulation code | R2value | |||||
| Zero order | First order | Higuchi | Hixon crowell | Korsmeyer peppas | ||
| R2value | n value | |||||
| PM 8 | 0.9908 | 0.9102 | 0.9656 | 0.9745 | 0.9784 | 0.3064 |
(PM 8: optimized gaultheria oil-piroxicam microemulsion formulation 8)
The stability studies of optimized formulation PM 8 performed as per ICH guidelines and proved its stability for its physical appearance and phase separation, as the formulation showed no phase separation and retained homogeneity after centrifugation. % transmittance, pH and drug content were also found to be stable throughout the period of testing as shown in table 19.
Table 19: Stability studies of optimized formulation PM 8
| Temperature | Days | Appearance | Centrifuge | % transmittance | pH | Drug content (%) |
| 5 °C±2 °C | 30 | No phase separation | Homogenous | 98.81±0.02 | 7.43±0.01 | 96.27±0.11 |
| 60 | No phase separation | Homogenous | 98.83±0.02 | 7.44±0.02 | 96.31±0.15 | |
| 90 | No phase separation | Homogenous | 98.82±0.03 | 7.42±0.03 | 96.29±0.16 | |
| 30 °C±2 °C and 65 % RH± 5 % RH | 30 | No phase separation | Homogenous | 98.80±0.01 | 7.41±0.02 | 96.30±0.09 |
| 60 | No phase separation | Homogenous | 98.78±0.02 | 7.43±0.01 | 96.29±0.10 | |
| 90 | No phase separation | Homogenous | 98.79±0.03 | 7.42±0.01 | 96.28±0.07 | |
| 40 °C±2 °C and 75 % RH±5 % RH | 30 | No phase separation | Homogenous | 98.83±0.01 | 7.42±0.01 | 96.31±0.18 |
| 60 | No phase separation | Homogenous | 98.81±0.01 | 7.41±0.01 | 96.32±0.14 | |
| 90 | No phase separation | Homogenous | 98.80±0.02 | 7.43±0.02 | 96.30±0.11 |
(All values are mean±SD, n=3)
CONCLUSION
With the successful formulation of PMs, gaultheria oil can be used as a novel encapsulating vehicle for NSAIDs and other categories of drugs in topical drug delivery systems. The prepared PMs showed the highest drug entrapment efficiency with the use of gaultheria oil and showed good promising results for various parameters assessed. Based on the various evaluation parameters, pH, RI, viscosity, drug content, particle size determination, zeta potential, FTIR, in vitro cumulative drug release (%) studies for 6 h and 12 h and stability studies for 90 d, it was concluded that tween 20 and PEG 600 in the ratio of 1:1 may be useful in the preparation of sustained-release formulation. The use of D-optimal design expert software benefitted the study by reducing the number of trials and optimization process. The predicted results of design expert software matched with the experimental results, thereby confirming its suitability in the formulation and optimization process. Hence, our present research emerges with a successful formulation development by combining piroxicam, gaultheria oil, tween 20 and PEG 600, and developed a novel PMs for topical delivery for treating arthritis. The use of gaultheria oil PMs technology in the present research work has evidenced its implication to convert the academic research yield to an industrial application with enhanced stability.
ACKNOWLEDGMENT
The authors acknowledge Sri Balaji Vidyapeeth, Deemed-to-be University, Pondicherry, India and Karnataka College of Pharmacy, Bangalore, Karnataka, India for availing the facilities to carry out the research work. We also acknowledge The Drugs Controller for the state of Karnataka, India and The Principal Scientific Officer of Drugs Testing Laboratories of Government of Karnataka, India for their continuous support and guidance.
FUNDING
Nil
AUTHORS CONTRIBUTIONS
All authors have conceptualized the work. Vani S has conducted the literature survey, carried out the research work and prepared the original draft of the manuscript. Venkatesan N guided the analytical work, revised the manuscript and formatted the references. Sreedhar C contributed towards designing the research work, analyzed manuscript for English and punctuation errors. Chandrasekar SB guided and supervised the findings of the research work, analyzed the manuscript for technical and gmatical errors, performed plagiarism check and point to point revision of the manuscript.
CONFLICT OF INTERESTS
All authors have none to declare
REFERENCESReferences
Hootman JM, Helmick CG, Barbour KE, Theis KA, Boring MA. Updated projected prevalence of self reported doctor diagnosed arthritis and arthritis attributable activity limitation among us adults 2015-2040. Arthritis Rheumatol. 2016;68(7):1582-7. doi: 10.1002/art.39692, PMID 27015600.
Gravallese EM, Firestein GS. Rheumatoid arthritis common origins divergent mechanisms. N Engl J Med. 2023;388(6):529-42. doi: 10.1056/NEJMra2103726, PMID 36780677.
Raghavan PR. Rheumatoid arthritis and osteoporosis: a case study. J Arthritis. 2017;6(3):1-3. doi: 10.4172/2167-7921.1000240.
Singh JA, Saag KG, Bridges SL, Akl EA, Bannuru RR, Sullivan MC. American college of rheumatology guideline for the treatment of rheumatoid arthritis. Arthritis Rheum. 2015;68(1):1-26.
Mamatha GC, Prabhakar T, Madhuri V, Neelima K, Venkatanagaraju E, Chandrasekar SB. Antiarthritic activity of Euphorbia thymifolia Linn. World J Pharm Pharm Sci. 2014;3(2):1323-31.
Milo N, Markovi T, Milo M, Boris P, Savi A, Peri T. Chemical composition and biological activity of Gaultheria procumbens L. essential oil. Ind Crops Prod. 2013;49(1):561-7.
Pawan KO, Darbin KP, Sabita D, Anil R, Sujan T, Prabodh S. Volatile constituent analysis of wintergreen essential oil and comparison with synthetic methyl salicylate for authentication. Plants. 2022 Apr 17;11(2):1090-3.
Michel P, Olszewska MA. Phytochemistry and biological profile of Gaultheria procumbens L. and wintergreen essential oil: from traditional application to molecular mechanisms and therapeutic targets. Int J Mol Sci. 2024;25(1):565. doi: 10.3390/ijms25010565, PMID 38203735.
Binsheng L, Ertan K, Taylan M, Haiping C, Edward K, Chunlin L. Gaultheria longibracteolata: an alternative source of wintergreen oil. Food Chem. 2021;32(4):128244.
Mukhopadhyay M, Bantawa P, Mondal TK, Nandi SK. Biological and phylogenetic advancements of Gaultheria fragrantissima: economically important oil bearing medicinal plant. Ind Crops Prod. 2016;81(1):91-9. doi: 10.1016/j.indcrop.2015.11.042.
Anupam K, Kiran S, Dubey NK, Bhanu P. Microencapsulation of Gaultheria procumbens essential oil using chitosan cinnamic acid microgel: improvement of antimicrobial activity stability and mode of action. Food Sci Technol. 2017;86(2):132-8.
Bindu YV, Haranath C, Prakash CS, Bhargav E. Formulation and in vitro evaluation of piroxicam emulgel. Int J Pharm Sci Drug Res. 2018;10(4):227-32.
Pant S, Badola A, Baluni S, Pant W. A review on emulgel: a novel approach for topical drug delivery systems. World J Pharm Pharm Sci. 2015;4(10):1728-43.
Marks R, Dykes P. Plasma and cutaneous drug levels after topical application of piroxicam gel: a study in healthy volunteers. Skin Pharmacol. 1994;7(6):340-4. doi: 10.1159/000211316, PMID 7946377.
Sindhuri P, Aroon A. Formulation and in vitro evaluation of colon targeted drug delivery of piroxicam tablets. Int J Univ Pharm Biosci. 2017;6(3):16-30.
Mohamed MI. Topical emulgel composition comprising diclofenac sodium. AAPS Pharm Sci Tech. 2004;6(3):26-9.
Shin S, Cho C, OH I. Enhanced efficacy by percutaneous absorption of piroxicam from the poloxamer gel in rats. Int J Pharm. 2000;193(2):213-8. doi: 10.1016/s0378-5173(99)00339-7, PMID 10606784.
Assaf SM, Maaroof KT, Altaani BM, Ghareeb MM, Abu Alhayyal AA. Jojoba oil based microemulsion for transdermal drug delivery. Res Pharm Sci. 2021;16(4):326-40. doi: 10.4103/1735-5362.319572, PMID 34447442.
Muhammad N, Fahad P, Zarqa N, Muhammad Y, Atif A, Nayab K. Quality by design approach: fabrication characterization and evaluation of optimized transdermal therapeutic system for antirheumatic lornoxicam. Acta Pharm. 2017;74(1):249-66.
Fathy I, Allah A, Hamdy M, Dawaba A, Ahmed MS. Preparation characterization and stability studies of piroxicam loaded microemulsions in topical formulations. Drug Disco Ther. 2010;4(4):267-75.
Froelich A, Osmalek T, Kunstman P, Roszak R, Bialas W. Rheological and textural properties of microemulsion based polymer gels with indomethacin. Drug Dev Ind Pharm. 2016;42(6):854-61. doi: 10.3109/03639045.2015.1066799, PMID 26204348.
Ashwini AB, Satish AA, Anil GJ. Preformulation study of piroxicam. Int J Pharm Sci Res. 2019;10(2):811-8. doi: 10.13040/IJPSR.0975-8232.10(2).811-8.
Mehreen Sattar, Somia Sarfraz, Uzma Liaquat, Iqra Shoukat, Bilal Ahmad, Talib Hussain. Formulation and evaluation of topical piroxicam microemulgel for arthritis. JCP. 2023;7(1):16-23. doi: 10.56770/jcp2023713.
Garg V, Singh H, Bhatia A, Raza K, Singh SK, Singh B, Beg S. Systematic development of transethosomal gel system of piroxicam: formulation optimization, in vitro evaluation, and ex vivo assessment. AAPS Pharm Sci Tech. 2017;18(1):58-71. doi: 10.1208/s12249-016-0489-z. PMID 26868380.
Senthil RD, Srinivasan R, Kumarappan C, Shamala N. Development and validation of uv spectrophotometric method for the estimation of naproxen in bulk and semisolid formulation. Int J Res Pharm Biosci. 2013;2(1):49-55.
Hardainiyan S, Kumar K, Nandy BC, Saxena R. Design formulation and in vitro drug release from transdermal patches containing imipramine hydrochloride as a model drug. Int J Pharm Pharm Sci. 2017;9(6):220-5. doi: 10.22159/ijpps.2017v9i6.16851.
Funke AP, Schiller R, Motzkus HW, Gunther C, Muller RH, Lipp R. Transdermal delivery of highly lipophilic drugs: in vitro fluxes of antiestrogens permeation enhancers and solvents from liquid formulations. Pharm Res. 2002;19(5):661-8. doi: 10.1023/a:1015314314796, PMID 12069170.
Huber R, Hartmann M, Bliesath H, Luhmann R, Steinijans VW, Zech K. Pharmacokinetics of pantoprazole in man. Int J Clin Pharmacol Ther. 1996;34(3):185-94.
Garala KC, Shinde AJ, Shah PH. Formulation and in vitro characterization of monolithic matrix transdermal systems using HPMC/Eudragit S 100 polymer blends. Int J Pharm Pharm Sci. 2009;1(1):108-20.
Shivalingam MR, Balasubramanian A, Ramalingam K. Formulation and evaluation of transdermal patches of pantoprazole sodium. Int J App Pharm. 2021;13(5):287-91. doi: 10.22159/ijap.2021v13i5.42175.
Sowmya N, Chandrakala V, Srinivasan S. Review on: effect of oil surfactant and cosurfactant on microemulsion. Int J Curr Pharm Res. 2022;14(4):23-7.
Iyan S, Dolih G, Sriwidodo RKG. Design expert software: an application tool for optimization in pharmaceutical preparations formulations. Int J Appl Pharm. 2022;14(4):55-63. doi: 10.22159/ijap.2022v14i4.45144.
Assaf SM, Maaroof KT, Altaani BM, Ghareeb MM, Abu Alhayyal AA. Jojoba oil based microemulsion for transdermal drug delivery. Res Pharm Sci. 2021;16(4):326-40. doi: 10.4103/1735-5362.319572, PMID 34447442.
Mona A, Shewaiter A, Taha M, Hammady D, Alaa EB, Sami H. Formulation and characterization of leflunomide/diclofenac sodium microemulsion base gel for the transdermal treatment of inflammatory joint diseases. J Drug Deliv Sci Technol. 2020;61(4):102110.
Kullar R, Saini S, Steth N, Rana AC. Emulgel: a surrogate approach for topical use of hydrophobic drugs. Int J Pharm Bio Sci. 2011;4(3):117-28.
Singla V, Saini S, Rana AC, Singh G. Development and evaluation of topical emulgel of lornoxicam using different formulations. Int Pharm Sci. 2012;2:38-44.
Jain NK. Progress in controlled and novel drug delivery systems. CBS Publishers and Distributors; 2004. p. 319-420.
Latiyare KB, Suresh PK, Jain V. Development and in vitro characterization of piroxicam loaded emulgel for topical delivery. Int J Pharm Pharm Sci. 2015;2(3):18-32.
Mirza S, Miroshnyk I, Habib MJ, Brausch JF, Hussain MD. Enhanced dissolution and oral bioavailability of piroxicam formulations: modulating effect of phospholipids. Pharmaceutics. 2010;2(4):339-50. doi: 10.3390/pharmaceutics2040339, PMID 27721361.
Guy RH. Current status and future prospects of transdermal drug delivery. Pharm Res. 1996;13(12):1765-9. doi: 10.1023/a:1016060403438, PMID 8987069.
Barry BW. Novel mechanisms and devices to enable successful transdermal drug delivery. Eur J Pharm Sci. 2001;14(2):101-14. doi: 10.1016/s0928-0987(01)00167-1, PMID 11500256.
Chandrashekar NS, Shobha Rani RH. Physicochemical and pharmacokinetic parameters in drug selection and loading for transdermal drug delivery. Indian J Pharm Sci. 2008;70(1):94-6. doi: 10.4103/0250-474X.40340, PMID 20390089.
Shivaraj A, Selvam RP, Mani TT, Sivakumar T. Design and evaluation of transdermal drug delivery of ketotifen fumarate. Int J Pharm Biomed Res. 2010;4(1):42-7.
Keleb E, Sharma RK, Mosa EB, Aljahwi AZ. Transdermal drug delivery system: design and evaluation. Int J Adv Pharm Sci. 2010;1(5):201-11.
Banker GS, Rhodes CT. Pharmacokinetics. In: Banker GS, Siepmann J, Rhodes C, editors. Modern pharmaceutical. DW B. Boca Raton: CRC Press; 2002. p. 115-65. doi: 10.1201/9780824744694-6.
Mohammad A, Amul M. Review of nanoemulgel for treatment of fungal infections. Int J Pharm Pharm Sci. 2024;16(9):8-17.
Korsmeyer RW, Gurny R, Doelker E, Buri P, Peppas NA. Mechanisms of solute release from porous hydrophilic polymers. International Journal of Pharmaceutics. 1983;15(1):25-35. doi: 10.1016/0378-5173(83)90064-9.
Hirina B, Pallavi B, Dipjyoti D. Evaluation of anti-inflammatory activity of aqueous extract of Mimosa pudica on Swiss albino mice. Int J Pharm Pharm Sci. 2024;16(8):12-6.
Mutalik S, Udupa N. Formulation development in vitro and in vivo evaluation of membrane controlled transdermal systems of glibenclamide. J Pharm Pharm Sci. 2005;8(1):26-38. PMID 15946595.
Avish DM, Swaroop RL. Formulation and evaluation of ointment containing sunflower wax. Asian J Pharm Clin Res. 2019;12(8):115-20.
Asbill CS, Michniak BB. Percutaneous penetration enhancers: local versus transdermal activity. Pharm Sci Technol Today. 2000;3(1):36-41. doi: 10.1016/s1461-5347(99)00225-4, PMID 10637599.
Zhang D, YE D, Jing P, Tan X, Qiu L, LI T. Design optimization and evaluation of co-surfactant free microemulsion based hydrogel with low surfactant for enhanced transdermal delivery of lidocaine. Int J Pharm. 2020 Aug 30;586:119415. doi: 10.1016/j.ijpharm.2020.119415, PMID 32599129.
Wolf M, Klang V, Stojcic T, Fuchs C, Wolzt M, Valenta C. NLC versus nanoemulsions: effect on physiological skin parameters during regular in vivo application and impact on drug penetration. Int J Pharm. 2018;549(1-2):343-51. doi: 10.1016/j.ijpharm.2018.08.007, PMID 30099212.
Funke AP, Schiller R, Motzkus HW, Gunther C, Muller RH, Lipp R. Transdermal delivery of highly lipophilic drugs: in vitro fluxes of antiestrogens permeation enhancers and solvents from liquid formulations. Pharm Res. 2002;19(5):661-8. doi: 10.1023/a:1015314314796, PMID 12069170.
Guy RH. Current status and future prospects of transdermal drug delivery. Pharm Res. 1996;13(12):1765-9. doi: 10.1023/a:1016060403438, PMID 8987069.
Alesandro A, Loredana L, Daniel P, Andre T. Efficacy and safety of piroxicam patch versus piroxicam cream in patients with lumbar osteoarthritis: a randomized placebo controlled study. Nat Lib Med. 2009;59(8):403-9.
Astorga Paulsen G, Baigun S, Galvao DE Figueiredo J, Gomes DE Freitas G. Efficacy and tolerability comparison of etodolac and piroxicam in the treatment of patients with osteoarthritis of the knee. Curr Med Res Opin. 1991;12(6):401-12. doi: 10.1185/03007999109111511.
LI HP, Wei W, Ying HS, Yee SC, Lian Y, Jian QG. Sustained release of piroxicam from solid lipid nanoparticles as effective anti-inflammatory therapeutics in vivo. Drug Ind Pharm. 2017;43(1):55-66.
Mangesh BR, Prashanth U, Ashwini M. Solid lipid nanoparticles incorporated transdermal patch for improving the permeation of piroxicam. Asian J Pharm. 2016;10(1):45-50.
Prapaporn B, Nattakit M, Thanakorn K, Hui Y. Formulation and characterization of piroxicam loaded water in oil microemulsions. Prog Appl Sci Tech. 2020;10(2):43-9.
Milos N, Tatjana M, Milos M, Boris P, Aleksandar S, Tamara P. Chemical composition and biological activity of Gaultheria procumbens L. essential oil. Ind Crops Prod. 2013;49(2):561-7.
Luo B, Kastrat E, Morcol T, Cheng H, Kennelly E, Long C. Gaultheria longibracteolata an alternative source of wintergreen oil. Food Chem. 2021;342:128244. doi: 10.1016/j.foodchem.2020.128244, PMID 33097325.
Anupam K, Kiran S, Dubey NK, Bhanu P. Microencapsulation of Gaultheria procumbens essential oil using chitosan cinnamic acid microgel: improvement of antimicrobial activity stability and mode of action. Food Sci Technol. 2018;86(6):132-8.
Chou DK, Krishnamurthy R, Randolph TW, Carpenter JF, Manning MC. Effects of Tween 20 and Tween 80 on the stability of albutropin during agitation. J Pharm Sci. 2005;94(6):1368-81. doi: 10.1002/jps.20365, PMID 15858848.
Jang HJ, Shin CY, Kim KB. Safety evaluation of polyethylene glycol (peg) compounds for cosmetic use. Toxicological Research. 2015;31(2):105-36. doi: 10.5487/TR.2015.31.2.105.
Coneac G, Vlaia V, Olariu I, Mut AM, Anghel DF, Ilie C. Development and evaluation of new microemulsion based hydrogel formulations for topical delivery of fluconazole. AAPS Pharm Sci Tech. 2015;16(4):889-904. doi: 10.1208/s12249-014-0275-8.
KI TK, Min HK, JU HP, Jae YL, Hyun JC, In SY. Microemulsion based hydrogels for enhancing epidermal/dermal deposition of topically administered 20(s)-protopanaxadiol: in vitro and in vivo evaluation studies. J Ginseng Res. 2018;42(2):512-23.
Mehreen Sattar, Somia Sarfraz, Uzma Liaquat, Iqra Shoukat, Bilal Ahmad, Talib Hussain. Formulation and evaluation of topical piroxicam microemulgel for arthritis. JCP. 2023;7(1):16-23. doi: 10.56770/jcp2023713.