
Int J App Pharm, Vol 17, Issue 3, 2025, 283-303Original Article
QUALITY BY DESIGN-BASED OPTIMIZATION OF FORMULATION PARAMETERS TO DEVELOP NANOSTRUCTURED LIPID CARRIERS OF EZETIMIBE AND FENOFIBRATE FOR IMPROVING ITS BIOPHARMACEUTICAL PROPERTIES
MOHAMMAD BAKHATWAR1*, SUMANT SAINI1, D. PURNIMA YADAV2, K. SWATHI PRIYA3, G. VEDA PRIYA4
*1Department of Pharmaceutics, Lovely Professional University, Punjab, India. *1Department of Pharmaceutics, Gokaraju Rangaraju College of Pharmacy, Hyderabad-500090, India. 1Department of Pharmaceutics, Lovely Professional University, Punjab, India. 2Avanthi Institute of Pharmaceutical Sciences, Visakhapatnam, India. 3Srinivasarao College of Pharmacy, Visakhapatnam, India. 4School of Pharmacy, Aditya University, Surampalem, India
*Corresponding author: Mohammad Bakhatwar; *Email: mohammadbakhatwar93@gmail.com
Received: 04 Oct 2024, Revised and Accepted: 28 Mar 2025
ABSTRACT
Objective: In the current research work, Ezetimibe (EZT) and Fenofibrate (FBT), as they belong to BCS class II, have poor solubility and high permeability nature, which causes poor bioavailability and therapeutic failure. The drugs were formulated as nanoparticulate carrier systems to overcome the solubility problems associated with the drugs. So, the drugs were prepared as nanosuspension in the combination form using a polymer to enhance the drugs' bioavailability parameters.
Methods: A novel technique was employed to prepare the formulation to improve the drugs' dissolution rate and bioavailability. In the current study, the antisolvent precipitation method was employed to formulate an EZT-FBT nanosuspension using a polymer, poloxamer 188. The best formulation was optimized by employing a design of experiments, i.e., a Plackett-Burman design, and an in vitro characterization of the best formulation was performed.
Results: EZT and FBT nanosuspension formulation was successfully prepared by using poloxamer 188, methanol, and water as solvent and antisolvent. The optimized formulation FED-8 underwent characterization, which showed a particle size of 242.9 nm with high zeta potential, i.e.,-17 mV. 32 factorial design and Plackett-Burman design were employed for the optimization of the formulation parameters and the best formulation of nanosuspension. All the predetermined independent variables were found to affect the dependent variables from the resultant nanosuspension. All the studies, like saturation solubility, drug content, Scanning Electron Microscopy (SEM), and Transmission Electron Microscopy (TEM), showed significant characteristic results. The kinetic studies of FED-8 were carried out, which showed 99.2% drug release in 2.5 h compared with the individual pure drugs.
Conclusion: The study concludes that the Plackett-Burman design was effectively employed to identify formulating and processing key parameters affecting the quality of the EZT-FBT nanosuspension. This combinational approach enhanced the solubility and dissolution rate compared with pure drugs.
Keywords: Hyperlipidemia, Statin monotherapy, Fenofibrate monotherapy, Ezetimibe monotherapy, Nanotechnology, Nanosuspension, Solubility, Bioavailability, Optimization, Characterization
© 2025 The Authors. Published by Innovare Academic Sciences Pvt Ltd. This is an open access article under the CC BY license (https://creativecommons.org/licenses/by/4.0/)
DOI: https://dx.doi.org/10.22159/ijap.2025v17i3.52861 Journal homepage: https://innovareacademics.in/journals/index.php/ijap
INTRODUCTION
Hyperlipidemia is characterized by very high cholesterol levels in the blood. It is an increase in one or more plasma lipids, including triglycerides, cholesterol, cholesterol esters, and plasma lipoproteins, including elevated levels of Low-Density Lipoproteins (LDL) and decreased levels of High-Density Lipoproteins (HDL). It is considered one of the significant risks causing Cardio Vascular Diseases (CVD), which accounts for one-third of human deaths around the world [1]. The complications of hyperlipidemia may lead to Atherosclerosis, coronary artery disease, myocardial infarction, and ischemic stroke [2, 3].
Some of the monotherapy studies regarding statin monotherapy, which is first-line pharmacotherapy, [4] fibrate therapy and EZT monotherapy exhibited positive responses in the treatment of hyperlipidemia., but most of the studies regarding statin and fibrate therapy resulted in severe side effects with the drugs, and some studies are stopped due to failure of clinical trials. Statin monotherapy triggers the catabolism of LDL [5], which is mediated through LDL receptors and appears to be the important mechanism for antihyperlipidemic effects. EZT inhibits two different types of sterol transporters in the mouse small intestine [7]. FBT increases lipase activity, which increases triglyceride lipoprotein metabolism and reduces cholesterol biosynthesis, increasing LDL clearance by increasing hepatic LDL receptor activity [8, 9]. Based on the mechanism of action of the drugs EZT and FBT, combining these two drugs can treat mixed hyperlipidemia [5, 6]. EZT and FBT belong to the Biopharmaceutical Classification System (BCS) class II drugs, as they have poor solubility and high permeability nature which causes poor bioavailability and therapeutic failure. The drugs were formulated as nanoparticulate carrier systems to overcome solubility problems associated with the drugs [10].
The nanoparticulate system is a promising approach to increase drug absorption and enhance bioavailability by improving the dissolution rate by keeping the drug in a dissolved state in the biological fluids and showing therapeutic effects [11, 14-16]. Co-administration of EZT and FBT therapy considerably increased the solubility; thereby the dissolution rate and the bioavailability were enhanced [12, 17]. In the current study, the antisolvent precipitation method was employed to formulate as an EZT-FBT nanosuspension by using different polymers, and the best formulation was optimized by employing design of experiments i. e., Plackett-Burman design and in vitro characterization of the best formulation was performed [13, 18], resulting in more significant improvements in multiple kinetic parameters [19, 20].
MATERIALS AND METHODS
The drugs Ezetimibe (EZT) and Fenofibrate (FBT), the polymers poloxamer 188 and poloxamer 407 were purchased from Yarrow Chem Products, Ghatkopar (West), Mumbai-400086, Maharashtra. The surfactants are polysorbate 80, and sodium lauryl sulfate and the stabilizer is polyvinyl alcohol, which was purchased from Molychem, (Mumbai, India). All other materials or chemicals used were of analytical grade.
Methods
Preformulation studies
Preformulation studies are the preliminary studies in developing any pharmaceutical dosage form. It focuses on the physicochemical properties of the drug for the dosage form development with greater efficacy. Sensory organs observed organoleptic characteristics like color, odor, and texture [25].
Melting point
The melting point was determined using the capillary fusion method where a small amount of drug was filled in a capillary sealed from one side and kept inverted i. e., sealed end downwards into the Melting Point Apparatus Model 935 with digit LED display. The temperature at which the drug started liquefying was recorded and compared with the literature value [11, 17, 19].
Solubility studies
The solubility studies of FBT and EZT, respectively were carried out in various solvents. Accurately weighed 20 mg of the drug was added to screw-capped vials containing 10 ml of solvent. The vials were kept in a water bath shaker at 37±0.5 ℃ and shaken for 24 h. The mixtures were then filtered through a Millipore filter membrane of pore size 0.45 µm, diluted, and the drug was analyzed using a UV spectrometer [25].
Fourier-transform infrared spectroscopy (FT-IR)
A drug excipient compatibility study was carried out by Fourier-transform infrared spectroscopy. The FT-IR spectra were obtained using an FT-IR spectrometer (FTIR 8300, Shimadzu). The samples were previously triturated and mixed thoroughly with potassium bromide in a 1:5 (sample: KBr) ratio. KBr discs were prepared by compressing the powders at a pressure of 5 tons for 5 min in a hydraulic press [26].
Differential scanning calorimeter (DSC)
The DSC measurements were performed on a DSC-60 (Shimadzu) differential scanning calorimeter with a thermal analyzer. All accurately weighed samples (about 5 mg of the sample) were placed in a sealed aluminum pan, and the samples were heated under nitrogen flow (100 ml/min) at a scanning rate of 100 °C per minute from 500 to 3000 °C. An empty aluminum pan was used as a reference [25].
X-Ray diffraction studies (XRD)
X-ray diffraction Study was performed in an Advanced X-ray diffractometer (Brucker D 8, India) using Cu K 2α rays with a voltage of 40 kV and a current of 25 mA to estimate the effect on nanoparticles. Samples were scanned for 2Ɵ from 10 to 80°. Diffraction patterns for pure drugs were analyzed [25].
Spectrophotometric analysis
Determination of wavelength of fenofibrate and ezetimibe
1000 µg/ml of stock solutions of Fenofibrate and Ezetimibe were prepared by dissolving 50 mg of the drug in 50 ml of methanol and diluting 1 ml of the above solution to 10 ml with methanol. The 10 µg/ml of drug concentrations were then prepared and scanned using a UV spectrophotometer to determine the λmax of the drug. The observed λmax of Fenofibrate was at 290 nm. In the case of Ezetimibe, it was 235 nm.
Determination of calibration curve of fenofibrate-ezetimibe
A series of Fenofibrate+Ezetimibe solutions ranging from 5 to 30 μg/ml were prepared from standard solution. Different aliquots (0.5, 1.0, 1.5, 2.0, and 2.5 ml) of a standard Fenofibrate+Ezetimibe (1000 μg/ml) solution were transferred into a series of 100 ml calibrated flasks and all were made up to the mark with acetate buffer pH 4.5 (containing 0.45% SLS) and absorbance was measured at 257 nm against blank. A calibration curve was constructed for Fenofibrate+Ezetimibe by plotting absorbance versus concentration [14, 15]. A calibration curve in acetate buffer pH 4.5 was presented in fig. 1 respectively. The optical characteristics such as Beer’s law limit, and molar absorptivity were calculated and summarized in Table. The regression equation, correlation coefficient, slope, and intercept are also shown in table 7.
HPLC instrumentation and conditions
The HPLC system consisted of a quaternary pump and a PDA detector. The chromatographic separation was achieved on a Purospher® 5 μm, 250 mm X 4.6 mm i. e. column using a mobile phase consisting of ACN-water with gradient elution. The eluent was monitored using a PDA detector at a wavelength of 254 nm. The column was maintained at room temperature and an injection volume of 20 μl was used. The mobile phase was filtered through a 0.45 μm Chrom Tech Nylon-66 filter for use.
Preparation of stock and standard solutions
Stock solutions of EZT (equivalent to 100 μg/ml) and FBT (equivalent to 1600 μg/ml) were prepared in ethanol. The stock solution was protected from light using aluminum foil and stored for three weeks at 40 °C with no evidence of decomposition. Aliquots of standard stock solution of EZT and FBT were transferred using A-grade bulb pipettes into 100 ml volumetric flasks and the solution was made up to volume with methanol to yield a final concentration of 2, 4, 6, 8, and 10 μg/ml for EZT and 32, 64, 96, 128 and 160 μg/ml for FBT.
Method validation
Linearity of response
Aliquot portions of standard stock solution were diluted with methanol and subsequently with mobile phase (conc: 2-10 μg/ml of EZT, 32-160 ug/ml of FBT). The chromatographic conditions were set and standard solutions of different concentrations were injected separately and the chromatograms were recorded.
LOD and LOQ
They were performed on samples containing concentrations of analytes, based on the calibration curve method. Standard solutions of EZT and FBT were injected in six replicates. The average peak area of six analytes was plotted against concentration. LOD and LOQ were calculated by using the following equations
![]()
![]()
Where σ = the standard deviation of y-intercepts of regression lines of the calibration curve,
S =the slope of the calibration curve.
Precision
Precision was assessed by using standard solutions prepared to produce solutions of three different concentrations of each drug. EZT and FBT were used in the same solution for these studies. Intra-day precision was investigated by injecting three replicate samples of each of the samples of three different concentrations. Inter-day precision was assessed by injecting the same three samples over three consecutive days. Repeatability was investigated by injecting six replicate samples of each of the samples of five different concentrations.
Preparation of standard curve
Aliquots of standard stock solution of EZT and FBT were transferred using A-grade bulb pipettes into 100 ml volumetric flasks and the solution was made up to volume with methanol to yield final concentrations 2, 4, 6, 8 and 10 μg/ml for EZT and 32, 64, 96, 128 and 160 μg/ml for FBT. 2μl solution was injected to HPLC with a PDA detector, and the graph at 288 nm and 234 nm for FBT and EZT, respectively.
Preparation and optimization of ezetimibe and fenofibrate nanosuspension:
Ezetimibe and Fenofibrate nanosuspension was prepared through the antisolvent precipitation–ultrasonication method [11, 12]. Briefly, Eze timibe and Fenofibrate were dissolved completely in ethanol to prepare the organic phase, and the solution was then filtered through a 0.45 μm filter to remove the precipitated impurities. The antisolvent phase was prepared separately by dispersing stabilizer poloxamer 188 in distilled water. At a fixed temperature, 2 ml of organic solution was injected dropwise by syringe into 20 ml of anti-solvent using a mechanical stirrer (Remi125, 51D, Mumbai) at 3600 rpm for 1 h. The resultant nanosuspension sample was ultrasonicated with a probe sonicator (Pci analytics, 250, Mumbai) 20–25 kHz for the specified period. During the ultrasonication, the temperature was controlled at 4–8 °C using an ice–water bath [27].
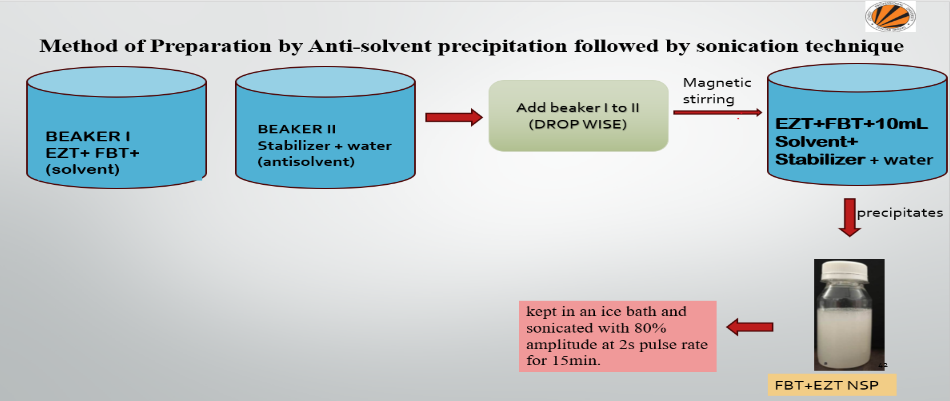
Fig. 1: Optimization of ezetimibe and fenofibrate nanosuspension
Factor screening studies using plackett-burman design
Fenofibrate and ezetimibe nanosuspensions were prepared using Poloxamer 188 as a stabilizer. The three different amounts of Poloxamer 188, viz. 50 mg, 100 mg, and 150 mg were selected. Nanosuspensions were prepared according to the procedure given in the experimental section. Prepared nanosuspensions were evaluated with different parameters like mean particle size and saturation solubility to select the amount of Poloxamer 188 for further formulation work. As shown in table 2, 50 mg Poloxamer 188 was selected, which showed the minimum mean particle size and maximum saturation solubility. Stirring speed is an important processing parameter for the preparation of nanosuspension. For the optimization of stirring speed, 800 RPM, 1000 RPM, and 1200 RPM were selected. Nanosuspensions were prepared according to the procedure given in the experimental section. Prepared nanosuspensions were evaluated with different evaluation parameters like mean particle size and saturation solubility to select the stirring speed for further formulation work, as shown in the table, 1200 RPM stirring speed was selected, which showed minimum mean particle size and maximum saturation solubility. Once the precipitation of drug particles had occurred in suspension, to convert into uniform nanosized particles probe sonicator was used. 10 min, 20 min, and 30 min periods were screened for sonication time. Nanosuspension was prepared according to the procedure given before. Prepared nanosuspensions were evaluated with different evaluation parameters like mean particle size and saturation solubility to select the optimized period of sonication for further formulation work. As shown in Table, 30 min sonication time was selected, which showed minimum mean particle size and maximum saturation solubility [26].
The Plackett-Burman design is suitably used to screen a large number of factors believed to be affecting important product characteristics or attributes. It is generally used during the initial phase of the study. By review of the literature, five factors were selected to affect the quality of nanosuspension. To identify which factor has a prominent effect on the quality, stability as well as efficacy of the nanosuspension, the Plackett-Burman design was used. A total of 8 experiments (preliminary screening formulations) were generated for the screening of five independent factors namely amount of drug in mg (X1), amount of stabilizer in mg (X2), solvent to antisolvent volume ratio (X3), stirring speed in rpm (X4) and sonication time in min (X5).
Saturation solubility in µg/ml (Y1) and mean particle size in nm (Y2) were selected as dependent factors. The net effect of an individual factor was calculated from the value of evaluated parameters from the following equations,
Effect of X1 = [(Y1+Y4+Y6+Y7)-(Y2+Y3+Y5+Y8)]/8
Effect of X2 = [(Y1+Y2+Y5+Y7)-(Y3+Y4+Y6+Y8)]/8
Effect of X3 = [(Y1+Y2+Y3+Y6)-(Y4+Y5+Y7+Y8)]/8
Effect of X4 = [(Y2+Y3+Y4+Y7)-(Y1+Y5+Y6+Y8)]/8
Effect of X5 = [(Y1+Y3+Y4+Y5)-(Y2+Y6+Y7+Y8)]/8
After getting the net effect of individual parameters two key parameters were identified which had maximum effect on product characteristics. These two parameters can be selected for product optimization by factorial design and other three parameters can be optimized by trial-and-error method.
Factorial design for optimization of key parameters
A 32 factorial design was applied for optimization of key parameters, like for amount of drug in mg and solvent to antisolvent volume ratio and stirring speed. Both particle size and saturation solubility, important features of nanosuspension considered to play a significant role in the formulation performance, were taken as dependent parameters in this study. Multiple regression analysis, contour plots, and 3D response surface plots were used to study the main and interaction effects of the variables on the dependent factors. The numbers of experiments required in factorial design studies were dependent on the number of independent variables selected and the number of levels at which they were studied. The response was measured for each trial and then either simple linear equation (1), or interactive equation (2) or quadratic (3) model was fitted by carrying out multiple regression analysis and F-statistics to identify statistically significant terms.
Y= b0+b1X1+b2X2+b11X12+b22X22+b12X1X2
Where b0 is the intercept
b1X1 coefficient of factor 1
b2X2 coefficient of factor 2
B11 coefficient of the quadratic term of factor x1
B22 coefficient of the quadratic term of factor x2
B12 refers to the interaction term between factors x1 and x2
Checkpoint analysis
A checkpoint analysis was performed to confirm the utility of established response surface plots and contour plots in the preparation of nanosuspension. value of independent variables (X1 and X2) were selected and corresponding values of dependent variables were calculated by substituting the values in the reduced polynomial equation. Nanosuspensions were prepared experimentally by taking the amounts of the independent variables (X1 and X2) on the same checkpoints. Checkpoint cum optimized batch was prepared three times and mean values were determined. The difference of theoretically computed values of particle size, as well as saturation solubility and the mean values experimentally obtained for both responses, were compared.
Evaluation of nanosuspensions
Particle size and PDI
Mean particle size and size distribution (polydispersity index) of the prepared nanosuspension were determined by using Zetasizer. [Zetatrac, Microtrac, Japan] Before the measurement, the samples were appropriately diluted with water to a suitable scattering intensity and re-dispersed by shaking measurement.
Zeta potential
The Zeta potential is a measure of the electric charge at the surface of the particles, indicating the physical stability of colloidal systems. The zeta potential values higher than 30mV in magnitude indicate long-term electrostatic stability of aqueous dispersions. In this study, the Zeta Potential was assessed by determining the electrophoretic mobility of the particles using Zetasizer.
Drug content
An aliquot (1 ml) of the prepared nanosuspension was diluted in methanol and filtered with a 0.2 μm filter. Total drug content was determined by UV spectrophotometer at λmax 257 nm of the drug. Formula:
Drug content =  X 100
X 100
Saturation solubility
The saturation solubility of prepared nanosuspension was performed by filling it in a vial and kept for 48 h, stirring with the help of a magnetic stirrer at 100 RPM to ensure saturation. Then, 2 ml of nanosuspension was filled in an Eppendorf tube and centrifuged at 10,000 RPM for 30 min. The supernatant was filtered through a 0.2 μm syringe filter and analyzed by UV-visible spectrophotometer [UV-1800, Shimadzu, Japan] at λmax of the drug after suitable dilution with dissolution media which was used as a blank. A triplicate analysis of each sample was carried out. By using the calibration curve, saturation solubility was calculated.
Entrapment efficiency
To determine entrapment efficiency NS were separated from free un entrapped drug by ultracentrifugation method. Separated vesicles were resuspended in 5 ml ethanol for Ezetimibe+Fenofibrate. Disruption was carried out by sonication (PCI Analytics JIJ 158) for 15 min to get the clear solution and then filtered out. 1 ml of filtrate was further diluted with phosphate buffer (pH 6.8) up to 10 ml. Further dilution was made if needed and drug concentration was analyzed spectrophotometrically. All spectrophotometric analysis was conducted in triplicate and the values were averaged.
Drug entrapment efficiency (DEE %) = 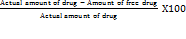
In vitro dissolution study
An in vitro dissolution study was performed using a USP 24-paddle instrument (ELECTROLAB TDT-06P). To minimize the foaming of the medium during the experiment, the medium was gently transferred into the dissolution vessel. Dissolution was performed at 37 °C [11, 12]. Nanosuspension equivalent to a drug dose was added to the dissolution vessels. 5 ml samples were withdrawn at a specific time interval of 2, 4, 6, 8, 10, 15, 30, 45, and 60 min and filtered immediately through a 0.2 μm syringe filter and analyzed spectrophotometrically. Subsequently, 5 ml of fresh medium was added to the dissolution vessel. The experiments were performed in triplicate and the mean values were reported.
Scanning electron microscopy (SEM)
The surface characteristics of lyophilized nanosuspensions were studied by Scanning electron microscopy (EVO-18, ZEISS, Germany) at 3kx to 28kx. The samples were mounted on double-sided carbon adhesive tape that was previously secured on brass stubs and then subjected to gold coating by sputter coater, using a process current of 10 mA for 4 min. The accelerating voltage was 15 kV.
Transmission electron microscopy (TEM)
The particle size and morphology were confirmed by observation with a Transmission Electron Microscope (JEM-2100, 200 kV, Jeol, Japan).
RESULTS AND DISCUSSION
Preformulation studies
Table summarizes different observed and reported values of various parameters.
Table 1: Different observed and reported parameters of fenofibrate and ezetimibe
| Drug substance | Fenofibrate | Ezetimibe |
| Physical Description | white powder | White |
| Solid State Form | Crystalline | Crystalline |
| Melting Point | 83 °C | 167 °C |
| Aqueous Solubility as a function of pH | ||
| 0.1N HCL pH 1.2 (mg/ml) | 0.01 | 0.007 |
| pH 4.5 buffer (mg/ml) | 0.035 | 0.027 |
| pH 6.8 buffer (mg/ml) | 0.093 | 0.025 |
| Ethanol (mg/ml) | 32 | 22 |
| Hygroscopicity | Non hygroscopic | Non hygroscopic |
| Bulk Density (gm/ml) | 0.34 | 0.25 |
| Tapped Density (gm/ml) | 0.51 | 0.38 |
| Carr’s index (%) | 33.33 | 34.21 |
| The angle of repose (°) | 37 | 41 |
| Hausner’s ratio | 1.5 | 1.5 |
Determination of wavelength of fenofibrate and ezetimibe: The observed λmax of Fenofibrate was at 290 nm. In the case of Ezetimibe, it was 235 nm.
An isosbestic point is the wavelength in which the absorbance of two or more species are the same. The appearance of an isosbestic point in a reaction demonstrates that an intermediate is NOT required to form a product from a reactant. Based on the isosbestic point of both the drugs, the wavelength of both the drugs was 257 nm.
FTIR
Scans were obtained at a resolution of 2 cm from 4500 to 400 cm. IR analysis of the drug was carried out and the results showed the presence of the groups (table 2 and 3) in the fig. 5 and fig. 6 in the IR spectra of the drug, which confirmed that the drug molecule was FBT and EZT. IR spectra of the physical mixture of FBT and EZT were similar to IR individual spectra of FBT and EZT (table 4). All characteristic peaks of FBT and EZT were observed. So FBT and EZT were compatible. IR spectra of the physical mixture of FBT and EZT were similar to IR individual spectra of FBT, EZT and poloxamer 188 (fig. 7). All characteristic peaks of FBT, EZT and poloxamer 188 were observed. So FBT, EZT and poloxamer 188 were compatible.
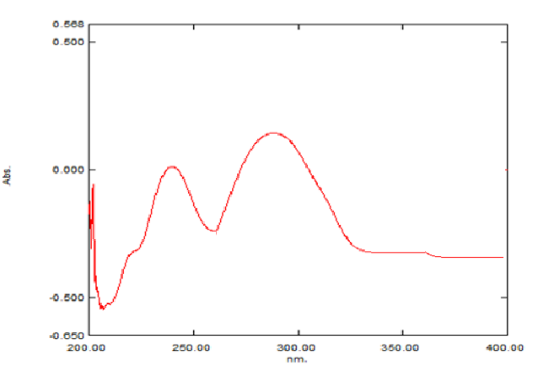
Fig. 2: Wavelength of fenofibrate at 287 nm
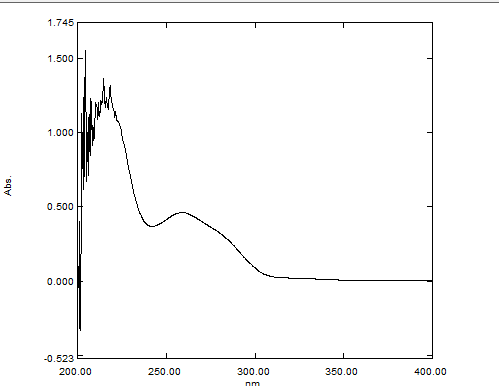
Fig. 3: Wavelength of ezetimibe at 235 nm
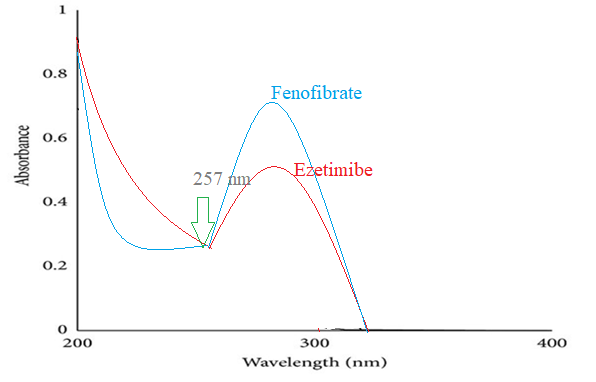
Fig. 4: λmax of Ezt-Fbt was found to be 257 nm
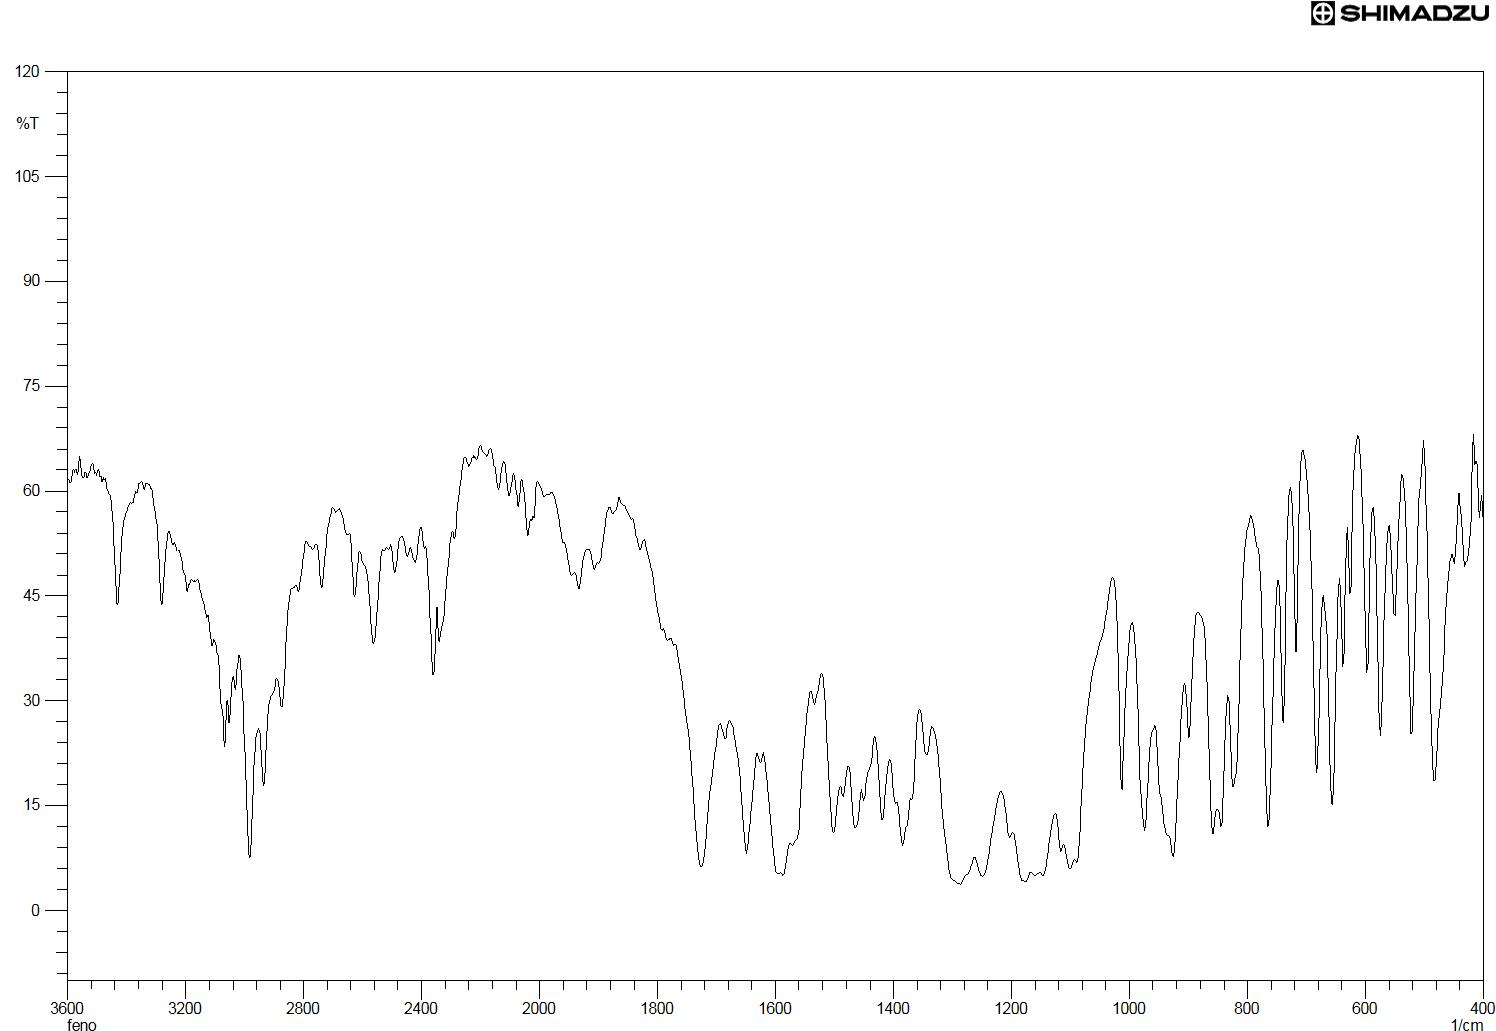
Fig. 5: FTIR of fenofibrate
Table 2: Interpretation of functional group in FBT
| S. No. | Range of I. R(CM-1) | Interpretation of functional group |
| 1 | 2900 | Alkane |
| 2 | 1740 | Format Ester |
| 3 | 1660-1600 | Ketone |
| 4 | 800-600 | Cl2 |
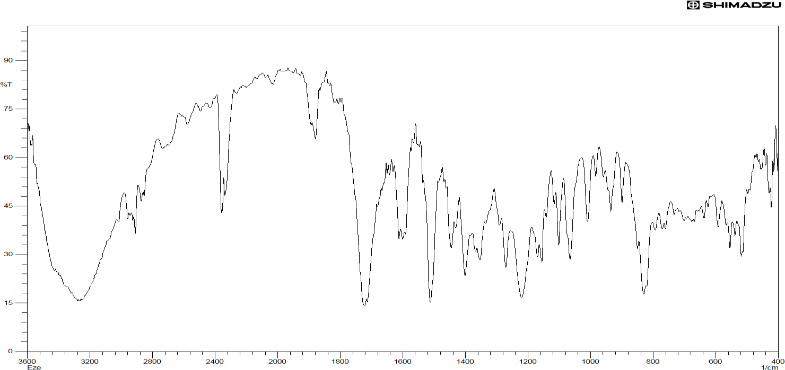
Fig. 6: FTIR of ezetimibe
Table 3: Interpretation of functional group in EZT
| S. No. | Range of I. R (cm-1) | Interpretation of functional group |
| 1 | 1500 | β-Lactam ring |
| 2 | 3000-3200 | -OH |
| 3 | 2400 | 3 -Amine |
| 4 | 1750 | Ketone |
| 5 | 1500-1700 | Di-substituted Benzene |
| 6 | 1200 | F |
(All values are in cm-1, n=3)
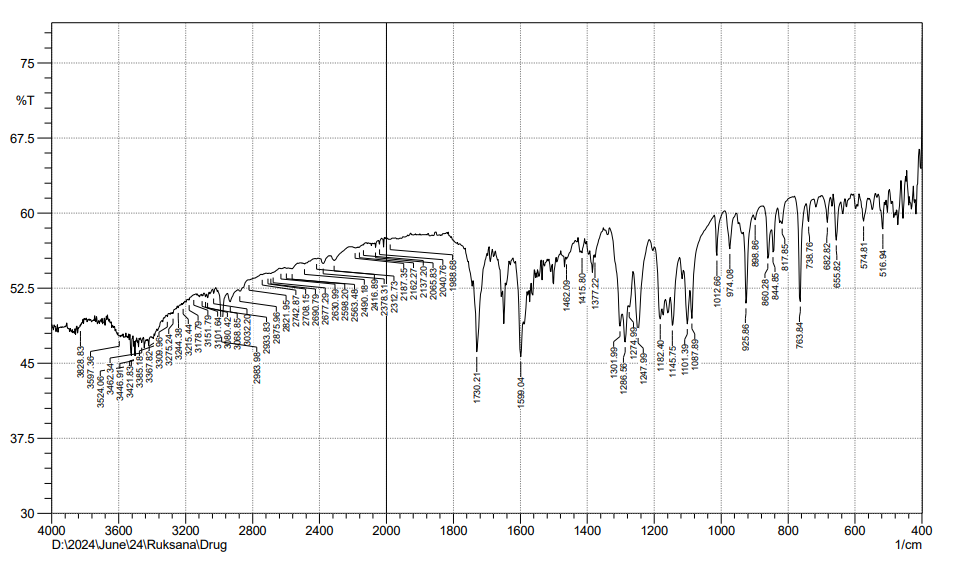
Fig. 7: FTIR of physical mixture of FBT+EZT
Table 4: Interpretation of functional group in EZT-FBT physical mixture
| S. No. | Range of I. R (cm-1) | Interpretation of functional group |
| Fenofibrate | ||
| 81 | 2893 | Alkane |
| 2 | 1726 | Formate Ester |
| 3 | 1599 | Ketone |
| 4 | 800-600 | Cl2 |
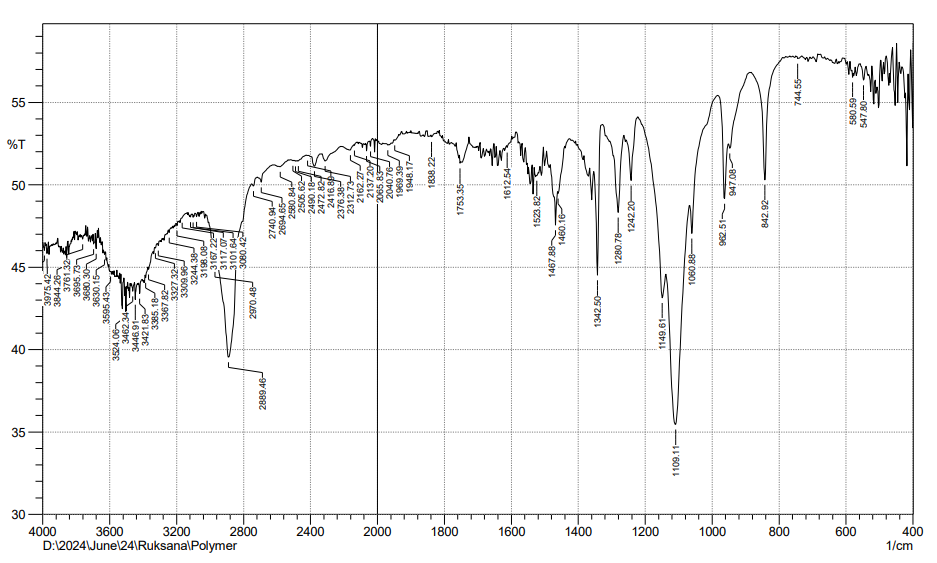
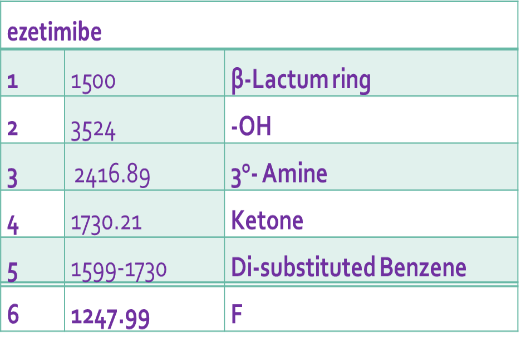
Fig. 8: FTIR of poloxomer 188
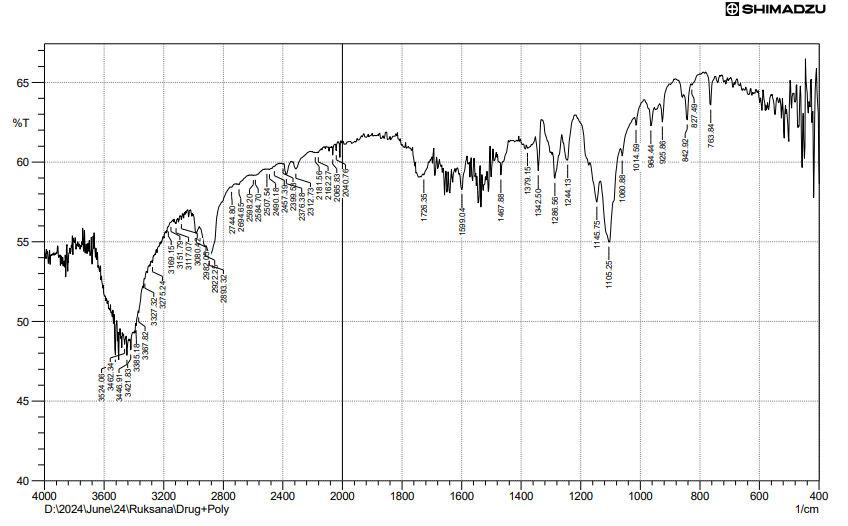
Fig. 9: FTIR of physical mixture of FBT+EZT+poloxomer 188
Fig. 10: DSC of fenofibrate
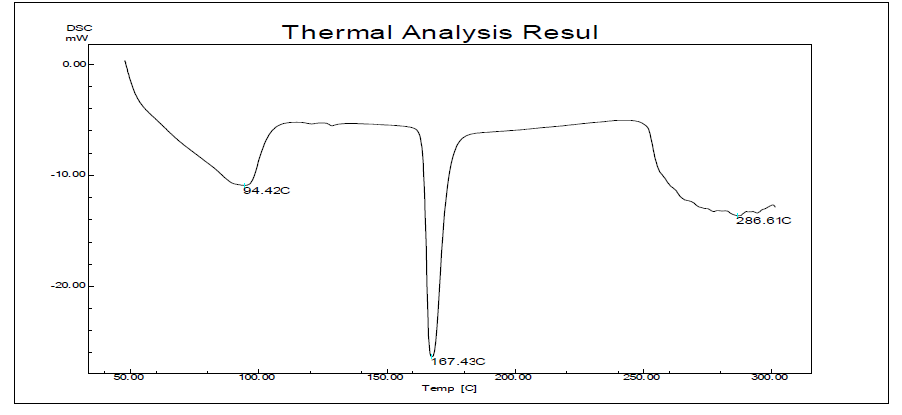
Fig. 11: DSC of ezetimibe
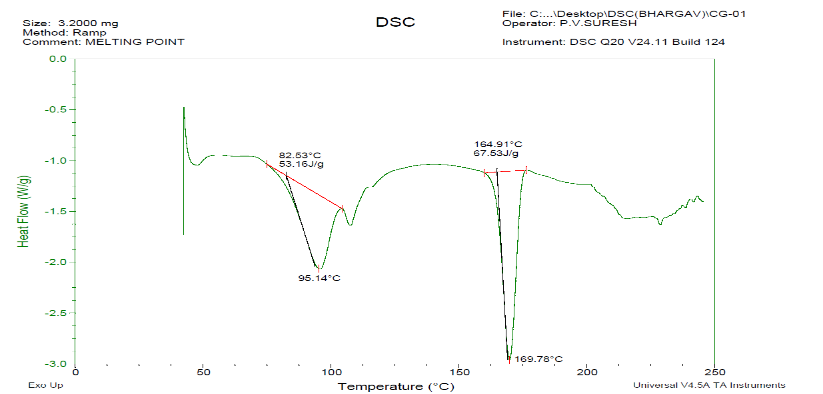
Fig. 12: DSC of ezetimibe and fenofibrate, It was interpreted that when two drugs, EZT+FBT were combined, NOT MUCH deviations compared with the individual drugs
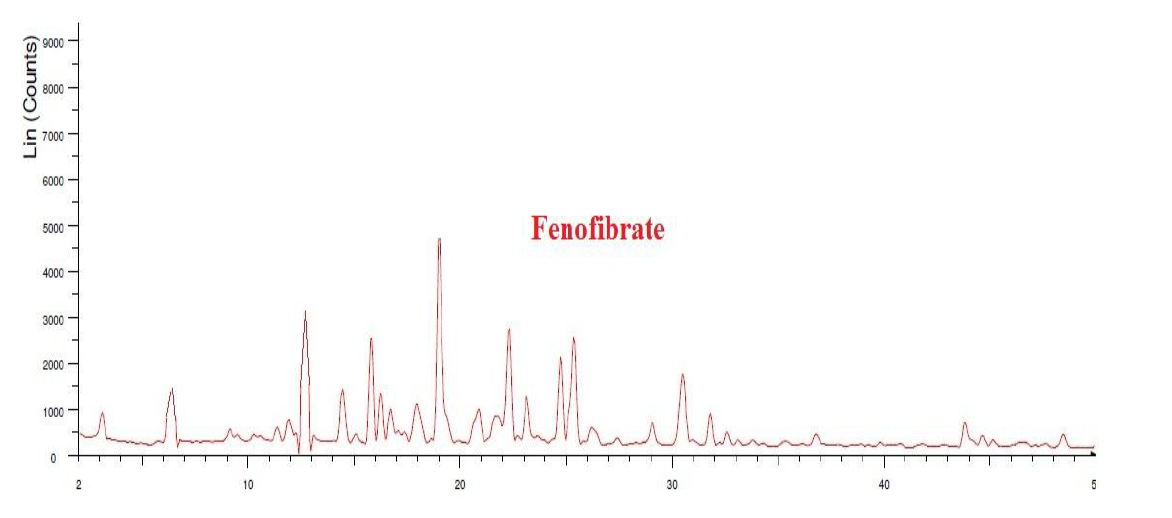
Fig. 13: XRD of fenofibrate
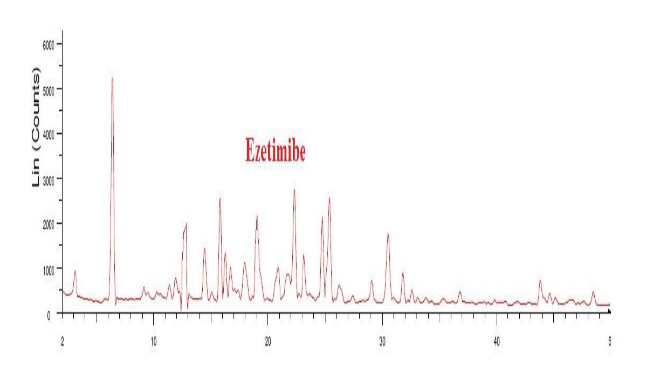
Fig. 14: XRD of ezetimibe
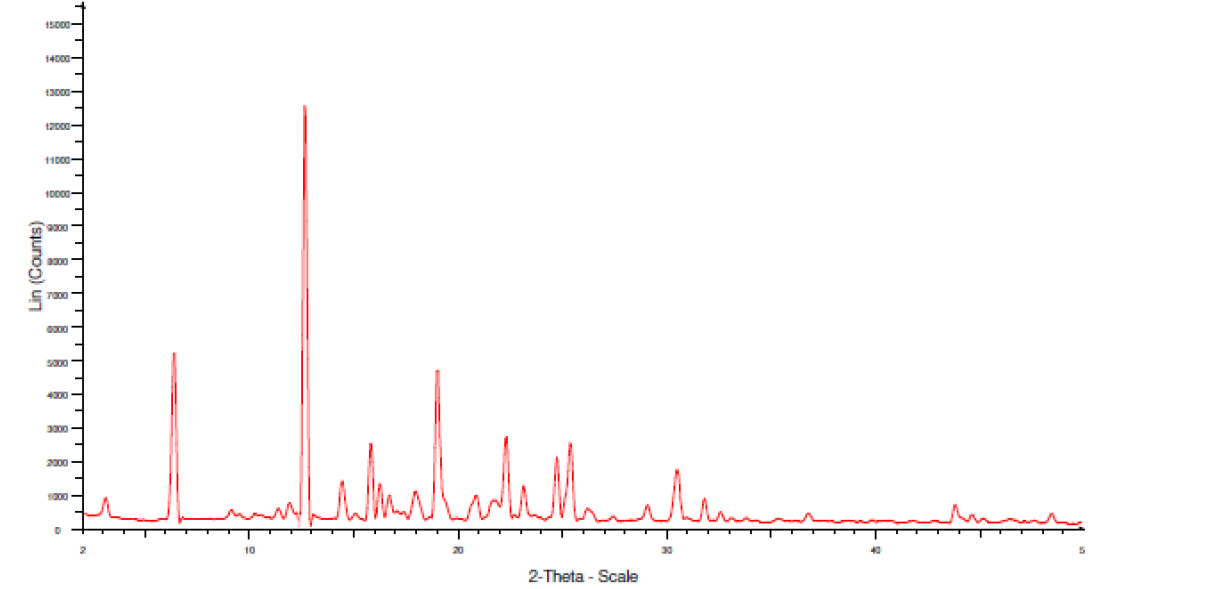
Fig. 15: XRD of physical mixture of FBT+EZT
The area under the peak is high for both EZT and FBT pure drugs, so the peaks are sharp indicating crystalline geometry. The width of the peaks is inversely proportional to the crystal size, here sharp peaks were observed in the physical mixture indicating the retention of crystallinity in both the drugs, there is no change observed in the 2theta values of both the drugs compared to individual XRD spectra.
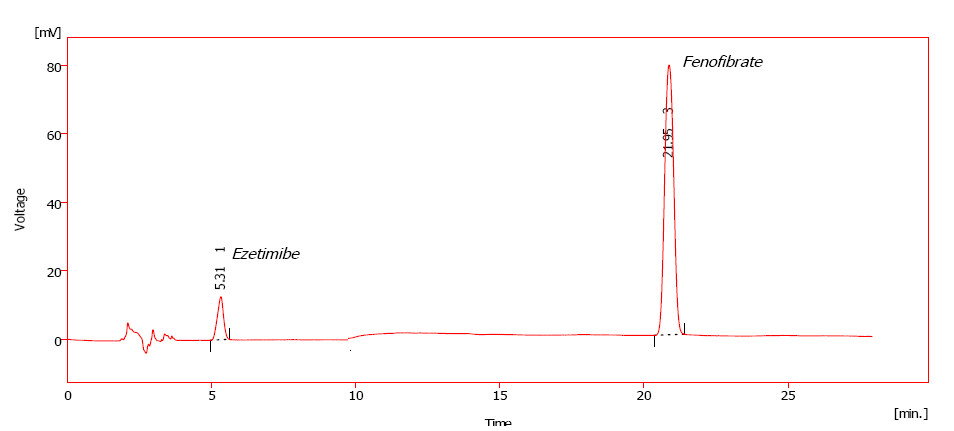
Fig. 16: Representative chromatogram obtained for standard solution corresponding FBT and EZT, respectively
Linearity
Linearity was established by least squares linear regression analysis of the calibration curve. The constructed calibration curves were linear over the concentration range 2-10μg/ml and 32-160μg/ml for EZT and FBT, respectively. Peak areas of EZT and FBT were plotted versus their respective concentrations and linear regression analysis was performed on the resultant curves. Typically, the regression equations were: y = 109.3x –213.2 (R = 0.9903), y=53.97x –1395.9 (R = 0.9942) for EZT and FBT, respectively.
LOD and LOQ
The LOD and LOQ value were found to be 0.1266μg/ml, 1.9544μg/ml and 0.3838μg/ml, 3.6225μg/ml, for EZT and FBT, respectively (table).
Table 5: Statistical data of standard curve of EZT and FBT
| Parameters | FBT | EZT |
| Linear Range | 2-10mcg/ml | 32-160mcg |
| Slope | 80.25117 | 53.9716 |
| Intercept | 155.667 | 1395.667 |
| Standard deviation of slope | 0.7 | 0.2979 |
| Standard deviation of intercept | 3.8364 | 19.551 |
| Limit of Detection (μg/ml) | 0.1577 | 1.9544 |
| Limit of Quantification (μg/ml) | 0.478 | 3.6225 |
| Linear equation | Y=80.25x-155.6 | Y=53.97x-1395.9 |
Precision
% RSD values ranging from 0.8878-1.7754 and 0.5163-1.4090 were found for EZT and FBT, respectively, across the concentration ranges studied.
Determination of calibration curve of FBT+EZT
A series of Fenofibrate+Ezetimibe solutions ranging from 5 to 30 μg/ml were prepared from standard solution. Different aliquots (0.5, 1.0, 1.5 2.0, and 2.5 ml) of a standard Fenofibrate+Ezetimibe (1000 μg/ml) solution were transferred into a series of 100 ml calibrated flasks and all were made up to the mark with acetate buffer pH 4.5 (containing 0.45% SLS) and absorbance was measured at 257 nm against blank. A calibration curve was constructed for Fenofibrate+Ezetimibe by plotting absorbance versus concentration. A calibration curve in acetate buffer pH 4.5 was presented in fig. respectively. The optical characteristics, such as Beer’s law limit and molar absorptivity, were calculated and summarized in table. The regression equation, correlation coefficient, slope, and intercept are also shown in table 7.
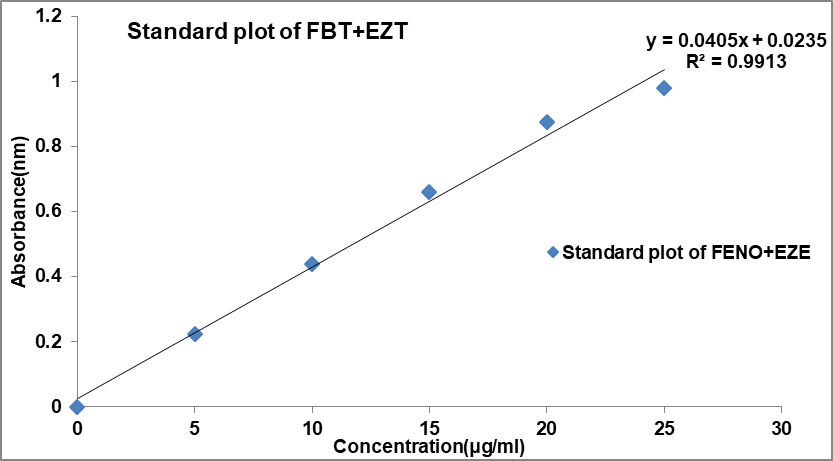
Fig. 17: Calibration curve of FBT and EZT
Table 6: Quantitative parameters of spectroscopic method
| Parameters | Result |
| λmax (nm) | 257 |
| Linearity range (µg/ml) | 0-30 |
| Regression equation | 0.0405X+0.0235 |
| Intercept | 0.0235 |
| Slope | 0.0405 |
| Correlation coefficient (R2) | 0.9913 |
Method of preparation of NS of FBT and EZT
Before proceeding towards the formulation of the (Fenofibrate and Ezetimibe) nanosuspension, a solvent and anti-solvent were selected based on the solubility studies of drugs in different solvents. In the solvent-anti-solvent method, the selected solvent should be a water-miscible solvent and capable enough to dissolve the drug to a greater extent so that a clear solution is obtained. Conversely, the solvent in which the drug was least soluble or was completely insoluble was selected as an anti-solvent. As the drug combination exhibits maximum solubility in ethanol, it was selected as a solvent, and water was selected as an anti-solvent since the drug was least soluble in water.
Table 7: Solubility of FBT and EZT in suitable solvents
| Drug | Solvents | Solubility (mg/ml), (Mean±SD) |
| FBT and EZT | DMF | 10±0.01 |
| DMSO | 15±0.05 | |
| Ethanol | 25±0.02 | |
| Water | Insoluble |
(All values are mean±SD; n=10)
Optimization of other preliminary parameters
Preliminary parameters were optimized by varying one parameter at a time while keeping others constant so that the effect of varied parameters could be evaluated. Each batch was repeated thrice (n=3) for the confirmation of repeatability. The parameters were optimized to achieve minimum particle size and maximum saturation solubility. Optimized parameters were Solvent-antisolvent volume ratio (1:10, 1:15, 1:20), Amount of stabilizer (30 mg, 40 mg, 50 mg), Stirring speed (800 RPM, 1000 RPM, 1200 RPM), Sonication time (5 min, 10 min, 30 min, 60 min) etc.
Selection of solvent and anti-solvent for preparation FBT and EZT nanosuspension
Fenofibrate+Ezetimibe gave particle sizes of 325.7 nm, 504.4 nm, and 645 nm, respectively in Ethanol, DMSO, and DMF, as shown in fig. Hence, Ethanol was selected as a solvent as it produced nanoparticles of smaller size, as shown in fig. 17, 18, 19.
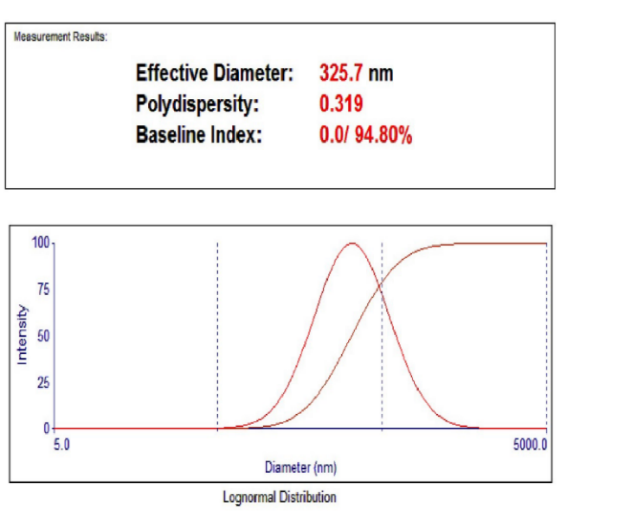
Fig. 18: Particle size using the solvent ethanol
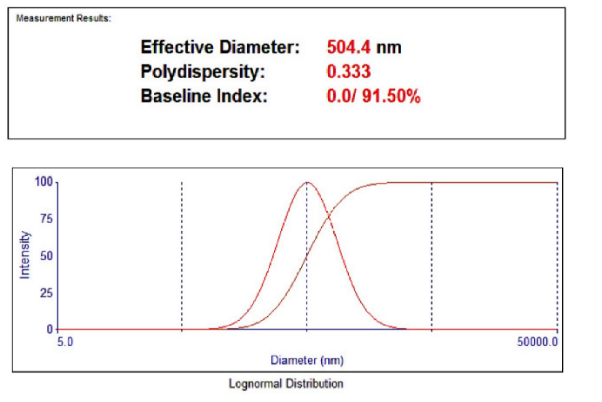
Fig. 19: Particle size using the solvent DMSO
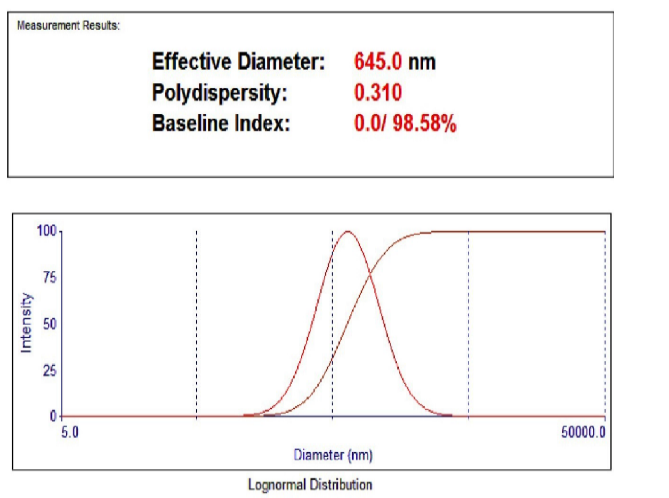
Fig. 20: Particle size using the solvent DMF
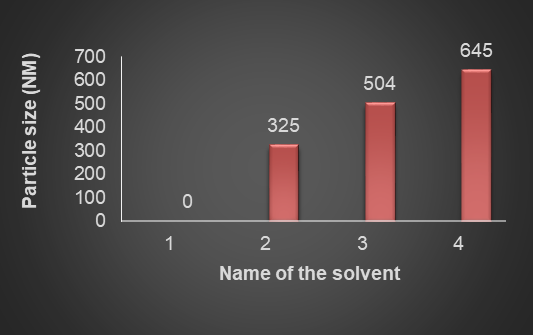
Fig. 21: Impact of solvent on particle size, n=3, 1 is water, 2 is ethanol, 3 is DMSO, 4 is DMF
Selection of stabilizer
Different stabilizers like Polyvinyl Alcohol, PVP K-30 (Polyvinyl Propylene), Sodium Lauryl Sulphate (SLS), Poloxamer 188, and Poloxamer 407 were screened by preparing nanosuspensions and measuring their saturation solubility, mean particle size, Polydispersity Index (PDI) and zeta potential for selection of the best one which can be utilized for further research work. The selection of Poloxamer 188 as a stabilizer significantly contributed to the nanosuspension’s performance. Studies have shown that Poloxamer 188 reduces interfacial tension, inhibits particle aggregation, and enhances wettability, leading to improved drug dispersion and dissolution [29, 30].
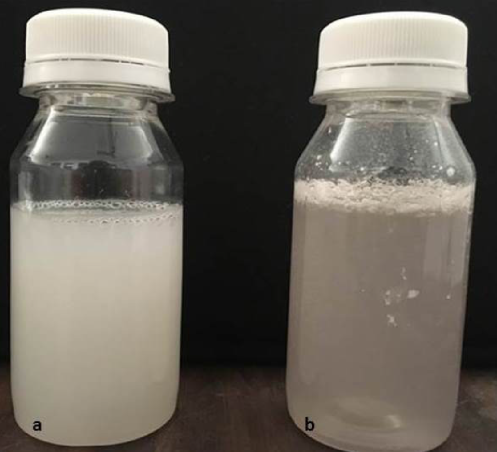
Fig. 22: a: Nanosuspension prepared by using Poloxamer 188 as a stabilizer, b: pure drug
Impact of diffusing drug concentration
The effect of diffusing drug concentration on the particle size was studied. The nanosuspensions were made with different diffusing drug concentrations 20, 40, 60, 80, and 100 mg/ml. The particle size varies with the change in drug concentration. However, at very high concentrations, the particle size increases as very high supersaturation may increase the particle growth by promoting condensation/coagulation due to higher diffusion-controlled growth and agglomeration.
Effect of stirring speed
Stirring speed is an important processing parameter for the preparation of nanosuspension. For the optimization of stirring speed, 800 RPM, 1000 RPM, and 1200 RPM were selected. Nanosuspensions were prepared according to the procedure given in the experimental section. Prepared nanosuspensions were evaluated with mean particle size and saturation solubility to select the stirring speed for further formulation work, the stirring speed was selected, which showed minimum mean particle size and maximum saturation solubility.
Effect of sonication
Once the precipitation of drug particles had occurred in suspension, to convert into uniform nanosized particles probe sonicator was used. 10 min, 20 min, and 30 min periods were screened for sonication time. Nanosuspension was prepared according to the procedure given before. Prepared nanosuspensions were evaluated with different evaluation parameters, like mean particle size and saturation solubility, to select the optimized period of sonication for further formulation work. 30 min sonication time was selected, which showed minimum mean particle size and maximum saturation solubility.
Factor screening studies
The most common screening design is the Plackett–Burman (PB) design which screens a large number of factors and identifies critical ones in a minimal number of runs with a good degree of accuracy. Generally, several runs needed to investigate the main effects is in multiples of 4. It is used during the initial phase of the study. Provided the interaction effects are nil or negligible, the Plackett-Burman design is effective for measuring the main effects. As shown in the table, the selected response parameters showed a wide variation, suggesting that the independent variables had a significant effect on the response parameters chosen.
Table 8: Layout and observed responses of plackett-burman design batches for FBT and EZT (Preliminary screening formulations)
| Batch code | Amount of FENO+EZE (mg) X1 | Amount of poloxamer (mg) X2 | Solvent: antisolvent volume ratio X3 | Stirring speed (RPM) X4 | Sonication time (Min) X5 | Saturation solubility (μg/ml) (mean ±SD)* Y1 | Mean particle size (nm) (Mean±SD)*Y2 |
| FE1 | 120 | 150 | 1:20 | 800 | 30 | 95.13±2.1 | 259.0±4.6 |
| FE2 | 100 | 150 | 1:20 | 1200 | 10 | 89.34±1.8 | 272.1±3.9 |
| FE3 | 100 | 50 | 1:20 | 1200 | 30 | 88.14±1.7 | 370.0±6.1 |
| FE4 | 120 | 50 | 1:10 | 1200 | 30 | 100.43±2.0 | 257.0±5.1 |
| FE5 | 100 | 150 | 1:10 | 800 | 30 | 93.13±0.9 | 337.0±4.1 |
| FE6 | 120 | 50 | 1:20 | 800 | 10 | 117.29±0.7 | 218.4±4.5 |
| FE7 | 120 | 150 | 1:10 | 1200 | 10 | 75.29±0.8 | 467.0±5.8 |
| FE8 | 100 | 50 | 1:10 | 800 | 10 | 45.43±1.3 | 563.0±6.1 |
*(All values are mean±SD; n=8)
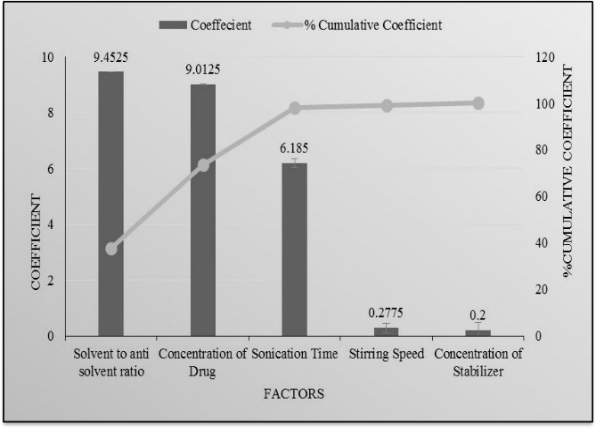
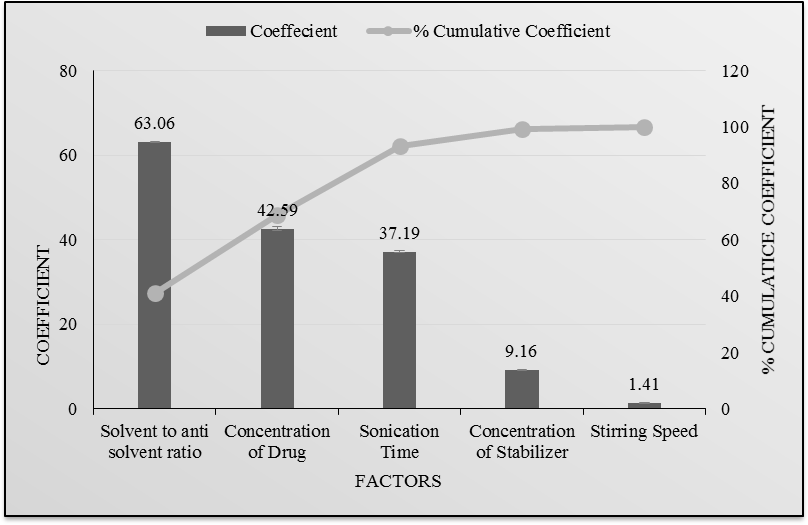
Fig. 23, 24: Pareto chart of the effect of independent variables on saturation solubility and mean particle size of drug
Fig. 22, 23 indicates the amount of drug and solvent to antisolvent volume ratio had maximum effect on mean particle size and saturation solubility as compared to other parameters like amount of Poloxamer 188, stirring speed, and sonication time.
Table 9: Results of optimization of other preliminary parameters for FBT-EZT
| Batch code | Preliminary parameters | Mean particle size (nm) (mean±SD)* | Saturation solubility (µg/ml) (mean±SD)* |
| FE9 | Amount of Stabilizer (mg) |
30 | 328.5±5.1 |
| FE10 | 40 | 301.1±8.2 | |
| FE11 | 50 | 293.5±7.7 | |
| FE12 | Stirring Speed (RPM) | 800 | 389.8±6.7 |
| FE13 | 1000 | 342.2±9.8 | |
| FE14 | 1200 | 251.0±4.6 | |
| FE 15 | Sonication Time (min) | 10 | 382.8±3.8 |
| FE 16 | 20 | 319.0±9.4 | |
| FE 17 | 30 | 244.5±6.2 |
*(All values are mean±SD; n=10)
32 Factorial design
Various formulations were prepared the varying amounts of FBT and EZT and solvent: antisolvent volume ratio. As shown in table 3 a 32 full factorial design was used to evaluate the effect of both independent variables on the predetermined dependent variables viz., mean particle size and saturation solubility.
Statistical analysis
A full model was derived after putting the values of regression coefficients in the equation. Regression analysis was carried out using Microsoft Excel® version 2013 (Microsoft Corporation, Washington, USA); the fitted results are shown in table 5, table 6, equation 1 and 2.
Table 10: Layout and observed responses of 32 factorial designs for FBT-EZT
| Batch code | Level of amount of FENO+EZE X1 | Level of solvent: antisolvent volume ratio X2 | Mean particle size (nm) (Mean±SD) *Y1 |
Saturation solubility (µg/ml) (Mean±SD) *Y2 |
| FED1 | -1 | -1 | 434.0±9.1 | 72.91±2.14 |
| FED2 | -1 | 0 | 342.0±6.0 | 95.12±2.03 |
| FED3 | -1 | 1 | 375.0±8.7 | 85.67±1.67 |
| FED4 | 0 | -1 | 406.0±7.0 | 35.88±0.61 |
| FED5 | 0 | 0 | 309.0±11.0 | 50.94±0.91 |
| FED6 | 0 | 1 | 353.7±5.9 | 38.03±1.11 |
| FED7 | 1 | -1 | 335.7±7.6 | 94.90±1.54 |
| FED8 | 1 | 0 | 240.7±8.2 | 113.92±2.50 |
| FED9 | 1 | 1 | 308.0±9.0 | 101.24±1.32 |
| Translation of coded levels in actual units | ||||
| Variables Level | Low (-1) | Medium (0) | High (1) | |
| X1 | 100 mg | 110 mg | 120 mg | |
| X2 | 1:10 | 1:15 | 1:20 |
(All values are mean±SD; n=10), Some other parameters were also evaluated, like zeta potential, PDI, and % w/w drug content, etc. as shown in table 4.
Table 11: Other evaluation parameters of factorial batches of FBT-EZT
| Batch code | PDI (Mean±SD)* | Zeta potential (mV) (Mean±SD)* | Drug content (%w/w) (Mean±SD)* |
| FED1 | 0.539±0.051 | 18.88±1.52 | 93.29±1.21 |
| FED2 | 0.514±0.059 | -29.41±2.12 | 94.81±2.14 |
| FED3 | 0.654±0.071 | 16.55±1.24 | 95.39±1.33 |
| FED4 | 0.734±0.084 | -24.36±0.98 | 92.74±0.54 |
| FED5 | 0.855±0. 095 | -10.51±0.57 | 99.33±0.86 |
| FED6 | 0.866±0. 101 | 18.74±1.65 | 99.43±1.52 |
| FED7 | 0.521±0.085 | 25.98±1.85 | 98.22±1.43 |
| FED8 | 0.343±0.042 | -17.17±1.88 | 101.1±1.57 |
| FED9 | 0.987±0.058 | 22.14±2.12 | 98.94±1.29 |
*(All values are mean±SD; n=9)
Table 12: Results of regression analysis of mean particle size for FBT-EZT
| Particle | Mean particle size (nm) (Y1) | ||
| Coefficient | Std. error | P-value | |
| b0 | 308.3333 | 5.35182 | 1.15E-05 |
| b1 | -44.6667 | 2.931312 | 0.000614 |
| b2 | -23.1667 | 2.931312 | 0.004223 |
| b11 | -17 | 5.077182 | 0.044114 |
| b22 | 71.5 | 5.077182 | 0.000776 |
| b12 | 8 | 3.59011 | 0.007058 |
| R2= 0.994142 | |||
(All values are mean±SD; n=10)
Table 13: Results of regression analysis of saturation solubility for FBT-EZT
| Saturation solubility (µg/ml) (Y2) | |||
| Coefficient | Std. error | P-value | |
| b0 | 51.7644 | 1.914023 | 0.000111 |
| b1 | 9.3933 | 1.048354 | 0.002934 |
| b2 | 3.5416 | 1.048354 | 0.043145 |
| b11 | 52.3431 | 1.815802 | 9.17E-05 |
| b22 | -15.2217 | 1.815802 | 0.00356 |
| b12 | -1.605 | 1.283966 | 0.299919 |
| R2 = 0.996992 | |||
(All values are mean±SD; R2>0.99, p<0.05, n=10)
For mean particle size (nm) (Y1)
Y1 = 308.3333-44.6667X1-23.1667X2-17X12+71.5X22+8.701X1X 2Eq. 1
For saturation solubility (µg/ml) (Y2)
Y2 = 51.76444+9.3933X1+3.5416X2+52.3431X12– 15.2217X22– 1.605X1X2 Eq. 2
The coefficients in table 5 and table 6 represent the respective quantitative effect of independent variables (X1 and X2) and their interactions on the various responses. It was seen that all the independent variables had a significant effect on the response (p<0.05). The negative sign of the coefficient indicated that an increase in the value of the independent variable decreases the value of response and vice versa. The absolute value of the coefficient indicates the magnitude of the effect of the independent variable on the response; the higher the value, the higher the magnitude.
Table 14: ANOVA for a full model for FBT-EZT
| Source of variation | DF | SS | MS | F | F significant |
| mean particle size (nm) | |||||
| Regression | 5 | 26249.33 | 5249.867 | 101.8293 | 0.001514 |
| Residual | 3 | 154.6667 | 51.55556 | - | - |
| Total | 8 | 26404 | - | - | - |
| Saturation solubility (µg/ml) | |||||
| Regression | 5 | 6558.02 | 1311.604 | 198.9006 | 0.000558 |
| Residual | 3 | 19.78281 | 6.59427 | - | - |
| Total | 8 | 6577.803 | - | - | - |
n=10, f<0.01
The results of ANOVA for the full model suggested that the Fcal value for mean particle size was 101.8293. Ftab value at (5, 3) was 9.0 for Y1. So, the Fcal value for Y1 was higher than Ftab. The results of ANOVA for the full model suggested that the Fcal value for saturation solubility was 198.9006. Ftab value at (5, 3) was 9.0 for Y2. So, the Fcal value for Y2 was higher than Ftab. All dependent variables were found Fcal value significantly higher than Ftab. Therefore, selected factors have a significant effect on all dependent variables. All the determination coefficients R2 are larger than 0.99, indicating that over 99% of the variation in the response could be explained by the model, and the goodness of fit of the model was confirmed. The F-ratio was found to be far greater than the theoretical value, with a very low probability of less than 0.0001 for each regression model, indicating that the regression model was significant with a confidence level of 95%. The observed responses showed a wide variation, suggesting that the selected independent variables had a significant effect on resultant particle size and saturation solubility.
Contour plots
Two-dimensional contour plots were established using design expert software to examine the relationship between independent and dependent variables as shown in Figures. Fig. [A] Shows a contour plot for mean particle size (nm) at prefixed values between 250 to 400 nm. The contour plot was found to be non-linear. So, the relationship between independent variables and particle size was not linear. The minimum is evidenced by a contour plot that specifies the solvent: antisolvent volume ratio and amount of FBT-EZT for the lowest mean particle size. Their respective values are approximately 1:15 (coded value 0) solvent: antisolvent ratio and 120 mg (coded value+1) amount of FBT-EZT. Fig. [B] shows a contour plot for saturation solubility (µg/ml) at prefixed values between 40 to 100 µg/ml. The contour plot was found to be non-linear. So, the relationship between independent variables and dependent variables was not linear. The maximum (dark green part) is evidence from the contour plot which specifies the solvent: antisolvent volume ratio and amount of FBT-EZT for maximum saturation solubility. Their respective values are approximately 1:15 (coded value 0) solvent: antisolvent ratio and 120 mg (coded value+1) amount of FBT-EZT. The maxima of saturation solubility and minima of particle size seem to be overlapping. So, there exists a direct relation between saturation solubility and particle size. The batch showing the lowest particle size also has the highest saturation solubility.
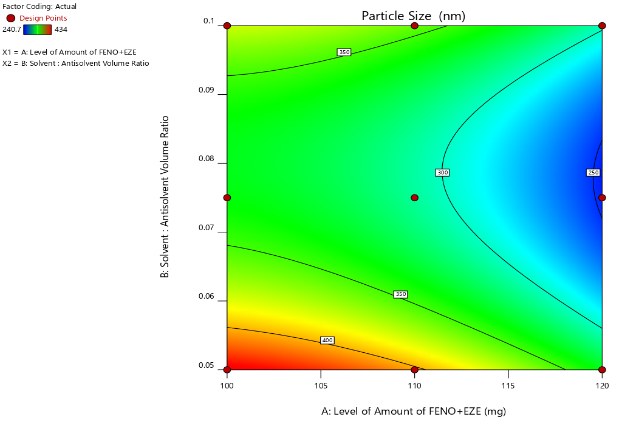
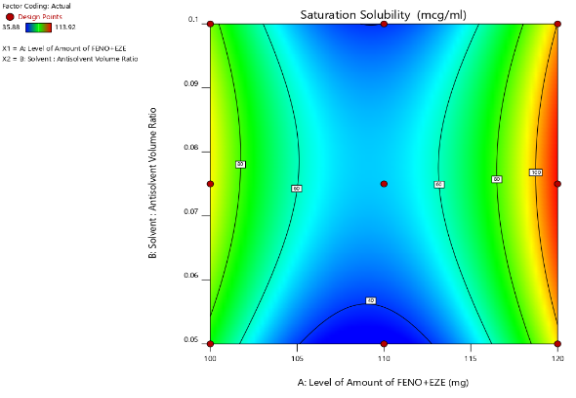
Fig. 25: Contour plot of FBT-EZT for effect on [A] mean particle size and [B] saturation solubility
Surface plots
To find out the main and interaction effects of the independent variables, response surface plots are very helpful. The fig. shows the response surface plot of mean particle size as a function of independent variables mean particle size decreases as the plot comes toward the central part. The center of the plot indicates the minimum particle size, which was obtained by intermediate solvent: antisolvent volume ratio and the highest amount of FBT-EZT. The fig. shows the response surface plot of saturation solubility as a function of solvent: antisolvent volume ratio and amount of FBT-EZT using Design Expert software. Saturation solubility increases as the plot comes toward the central part. The center of the plot indicates the highest saturation solubility, which was obtained by an intermediate solvent: antisolvent volume ratio and the highest amount of FBT-EZT (coded value+1).
Optimization of fenofibrate-ezetimibe nanosuspension by desirability function of design expert
The optimum formulation was selected based on the criteria of attaining the minimum mean particle size (Y1) and the maximum saturation solubility (Y2).
Checkpoint batch cum optimized batch validation
To evaluate the model, a checkpoint batch cum optimized batch FED-8 was prepared at X1=+1 and X2=0 levels. Dependent parameters were determined and compared with predicted values as shown in table.
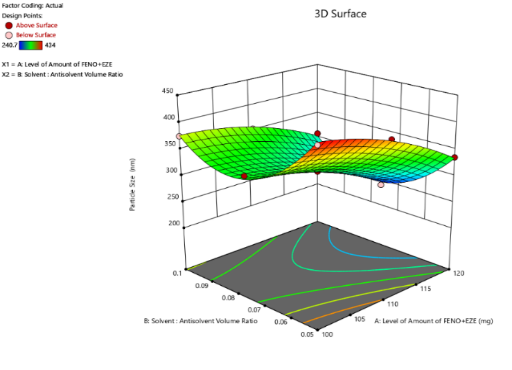
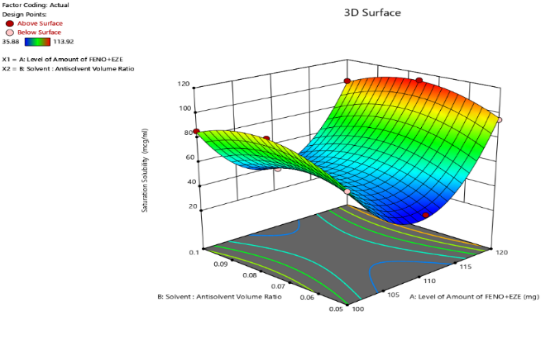
Fig. 26: Response surface plot of FBT-EZT for effect on [A] mean particle size and [b] saturation solubility
Table 17: Formulation and process parameters for an optimized batch of FBT-EZT
| Amount of Fenofibrate+Ezetimibe | 120 mg |
| Amount of Poloxamer 188 | 50 mg |
| Solvent: Antisolvent Volume Ratio | 1:15 |
| Stirring speed | 1200 RPM |
| Stirring time | 4 h |
| Sonication time | 30 min |
Table 18: Composition of checkpoint batch cum optimized batch of FBT-EZT
| Amount of FBT-EZT (mg) (X1) | Solvent: antisolvent volume ratio (X2) | ||
| Coded value | Decoded value | Coded value | Decoded value |
| +1 | 120 mg | 0 | 1:15 |
Table 19: Comparison of calculated data with experimental data of FBT-EZT
| Response | Predicted | Observed | % Bias |
| mean Particle Size (Y1) | 241.38 nm | 242.9 nm | 0.63 |
| Saturation Solubility (Y2) | 113.50 µg/ml | 109.8 µg/ml | 3.7 |
When the batch FED-8 was prepared using the defined level of the amount of Fenofibrate-Ezetimibe and solvent: antisolvent volume ratio using Design expert, the results obtained with checkpoint cum optimized batch (FED-8) were close to predicted values. Thus, it can be concluded that the statistical model is mathematically valid.
Evaluation of optimized batch of FBT-EZT nanosuspension
Size measurement and PDI
The particle size distribution of the optimized batch is shown in Figure. The mean particle size of the optimized batch was 242.9 nm, and PDI was 0.343. FBT-EZT nanosuspension-based final formulation was intended for oral administration, for which PDI and particle size above 5µm is not critical [11]. The mean particle size of a nanosuspension is around 200-1000 nm. From the Table, it was found that the mean particle sizes of all formulations were in the nanometer range. It indicated that all formulations fulfill the requirements of a nanosuspension. For instance, a researcher formulated an Ezetimibe nanosuspension using Poloxamer 188 and reported a particle size of 606 nm with high PDI [13, 25, 26]. Compared to this, the present formulation in combination, achieved a smaller particle size with better PDI.
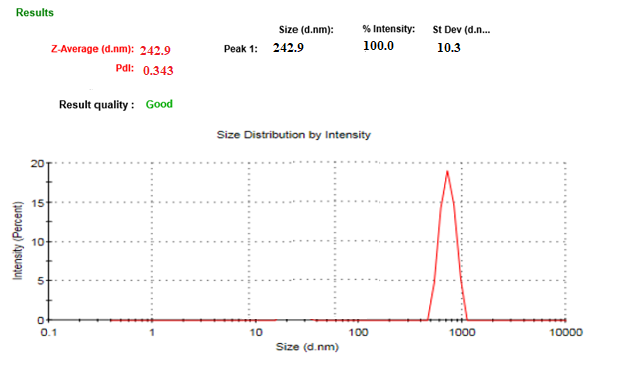
Fig. 27: Particle size and PDI of FBT+EZT nanosuspension
Zeta potential
Poloxamer 188 is a well-known, efficient polymeric stabilizer forming adsorption layers of drug nanoparticles. In general, a zeta potential value of ±30 mV is sufficient for the stability of nanosuspension [25]. The Zeta potential of the optimized formulation was observed at-17.1±1.85 mV, which complies with the requirement of zeta potential. The zeta potential result of the current research work was better than the work performed by a researcher [25, 26] indicating better stability.
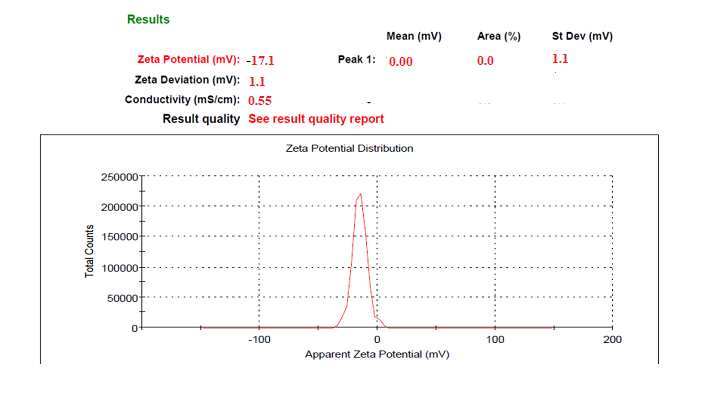
Fig. 28: Zeta potential of FBT+EZT nanosuspension
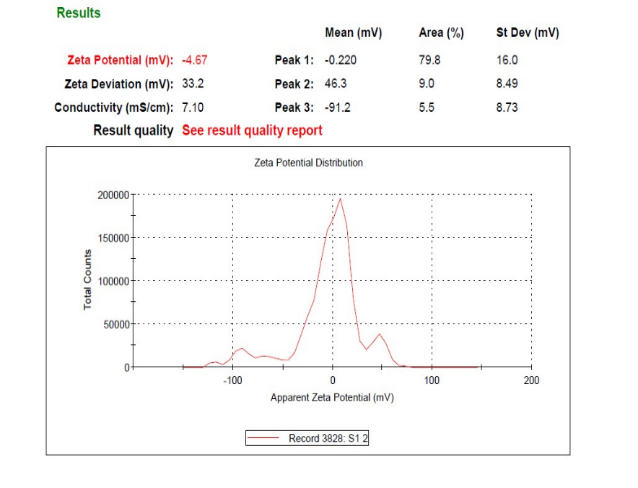
Fig. 29: Zeta potential analysis of pure drugs
Saturation solubility
Saturation solubility of an optimized batch of Fenofibrate-Ezetimibe nanosuspension and the pure drug was found to be 109.8 µg/ml and 1.192 µg/ml, respectively, indicating that the saturation solubility of the nanosuspension was 100 times that of the pure drug. This drastic increase in saturation solubility was a result of a reduction in particle size and a subsequent increase in surface area. So, it can be assumed that this increase in saturation solubility may increase bioavailability. The saturation solubility of the FED-8 was better than the work performed by a researcher [25, 26], indicating good solubility and better bioavailability.
Drug entrapment efficiency (DEE)
The drug entrapment efficiency of the formulation was about 80.49% indicating that there was more entrapped efficacy of the drug in the formulation. Comparing with the previous research work [31, 26] the efficacy of the current formulation was found be more.
Drug Entrapment Efficiency (DEE %) = 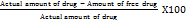
Drug Entrapment Efficiency (DEE %) = 80.49%
In vitro drug release
The in vitro drug release of the current formulation FED-8 had shown greater release of 99.2% in 2.5 h with greater extent when compared to the other research work performed [13, 25, 26], as in that work, the drug release was only 89.6 % in 4 h. Compared to this, the present formulation achieved a smaller particle size and faster dissolution, indicating improved bioavailability potential. In contrast, the EZT-FBT combination nanosuspension in this study exhibited a synergistic enhancement in dissolution, likely due to the combined effects of particle size reduction, improved wettability, and polymer stabilization.
Table 20: Dissolution conditions
| Parameter | Test condition |
| Qty. of media | 900 ml, Sodium phosphate buffer pH 6.8 |
| Apparatus and Type | USP Type 2 (Paddle) |
| Agitation Speed | 50 RPM |
| Temperature | 37°±0.5 °C |
| Time Points | 0,0.5,1,1.5,2,2.5 h |
| Volume Withdrawn | 10 ml |
Table 21: Drug release data of pure drugs and optimized batch
| Time (h) | Cumulative % drug released EZT pure drug | Cumulative % drug released FBT pure drug | Cumulative % drug released of ezt-fbt nsp |
| 0 | 0 | 0 | 0 |
| 0.5 | 4 | 8 | 36.2 |
| 1 | 8.7 | 10 | 79.2 |
| 1.5 | 9.26 | 13 | 83.4 |
| 2 | 10 | 15 | 89.3 |
| 2.5 | 12 | 16.6 | 99.2 |
(All values are in %, n=3)
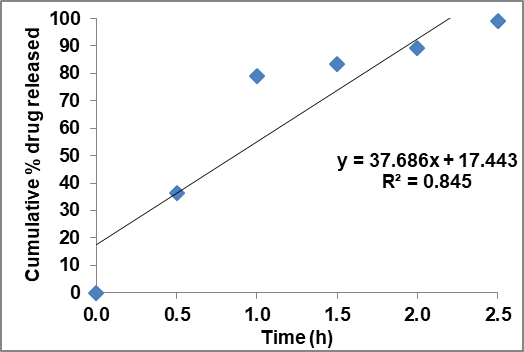
Fig. 30: Zero order plot of optimized FBT-EZT nsp
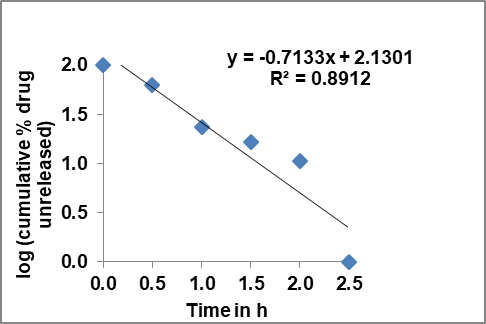
Fig. 31: First order plot of optimized FBT-EZT nsp
Drug content
The absorbance of the optimized formulation is 0.4325, and the Concentration is 1.01 mg/ml. The Drug content (mg) is the product of Concentration (mg/ml) and the Volume of nanosuspension (mL). The percentage of the drug content (%) is the total weight of the formulation (mg) of the drug content multiplied by 100. On substitution, the drug content of the optimized formulation was 101.01%. These results were better than those researched by [21, 27].
Scanning electron microscopy (SEM)
The surface topology as measured by scanning electron microscopy of Fenofibrate-Ezetimibe, was found to be long, thin, and flat with particles larger (5-32µm) in size, as shown in fig. 32. However, after conversion to lyophilized nanosuspension, particles became smaller (about 300 nm), which were adsorbed on the surface of mannitol used as cryoprotectant, may be by hydrophobic interaction.
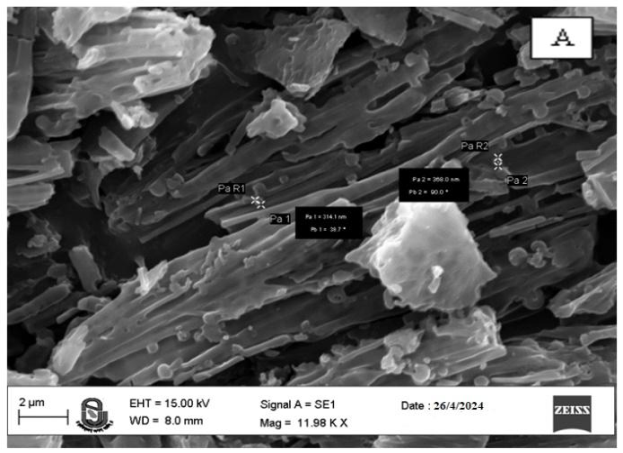
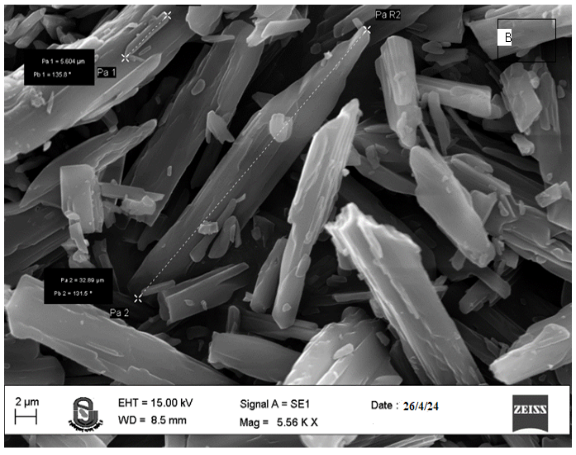
Fig. 32: SEM of FBT+EZT nanosuspension
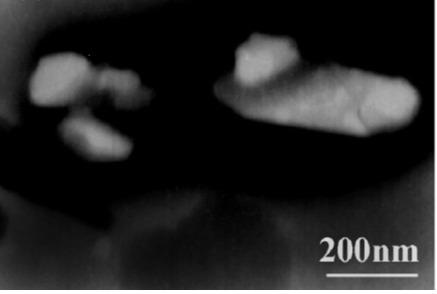
Fig. 33: Transmission electron microscopy
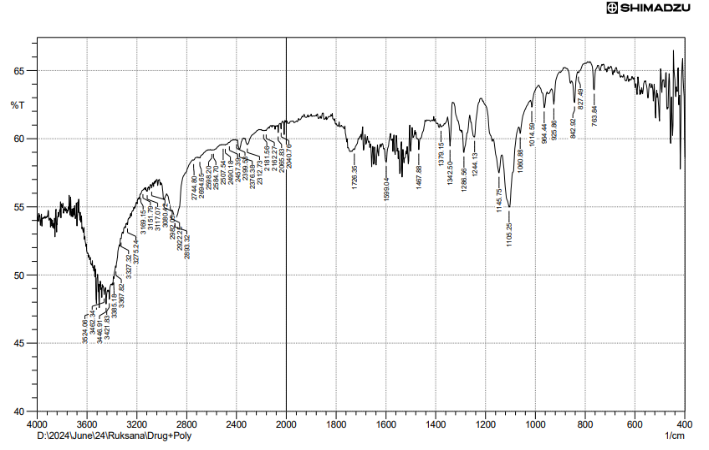
Fig. 34: FTIR of final optimized formulation
Transmission electron microscopy: The sample after suitable dilutions, was fixed with a copper grid and studied without staining at 200 kV.
Fig. 34 of FTIR studies states that no change was found in the functional groups in the optimized formulation compared with the individual drugs and also compared with the physical mixture, which states no interaction between drugs and very much compatible.
XRD of final optimized formulation
The width of the peaks is inversely proportional to the crystal size; here, sharp peaks were observed in the physical mixture, indicating the retention of crystallinity in both the drugs. There is no change observed in 2 theta values of both the drugs compared to individual XRD spectra.
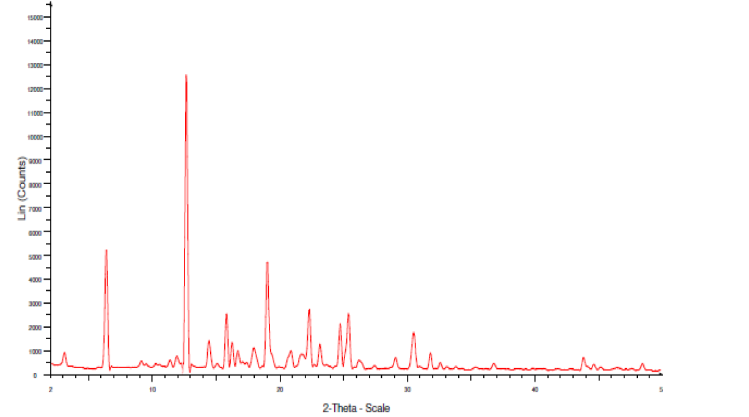
Fig. 35: XRD of final optimized formulation
Table 22: Evaluation parameters of an optimized batch overall results
| Evaluation parameters | Results |
| mean Particle Size | 249.9 nm |
| PDI | 0.343 |
| Zeta Potential | -17.1 mV |
| Drug Content | 101.01 % w/w |
| Saturation Solubility | 109.8 µg/ml |
CONCLUSION
The optimized Ezetimibe-Fenofibrate (EZT-FBT) nanosuspension exhibited superior performance compared to previous formulations. With a smaller particle size (242.9 nm vs. 606 nm) and faster dissolution (99% in 2.5 h vs. 89.6% in 4 h for Ezetimibe nanosuspension with Poloxamer 188), the present formulation indicates enhanced bioavailability potential. The use of Poloxamer 188 contributed to improved wettability, reduced aggregation, and better drug dispersion. The FED-8 formulation followed first-order drug release kinetics, suggesting a dissolution-controlled mechanism. These findings highlight the advantages of the EZT-FBT nanosuspension over conventional and previously reported nanosuspension formulations, reinforcing its potential for improving BCS Class II drug bioavailability.
FUNDING
Nil
AUTHORS CONTRIBUTIONS
Mohammad Bakhatwar and Dr. Sumant Saini have contributed to preformulation, optimization, and in vitro studies. The rest of the authors suggested preparation methods and optimization techniques.
CONFLICTS OF INTERESTS
All authors have none to declare
REFERENCES
Aldeeb MM, Wilar G, Suhandi C, Elamin KM, Wathoni N. Nanosuspension based drug delivery systems for topical applications. Int J Nanomedicine. 2024 Jan 25;19:825-44. doi: 10.2147/IJN.S447429, PMID 38293608.
Sharma S, Singh A, Patel R. A comprehensive review of novel drug delivery systems and its impact on modern therapeutics. World J Pharm Res. 2024;13(13):264-82. doi: 10.20959/wjpr202413-32948.
Kerilos IE, El-Sawy HS, Abu Elyazid SK, Ibrahim M. Nanosponge for enhancing solubility and bioavailability of oral drugs review. Int J Appl Pharm. 2024 Jan;16(1). doi: 10.22159/ijap.2024v16i1.49490.
Mainieri F, LA Bella S, Chiarelli F. Hyperlipidemia and cardiovascular risk in children and adolescents. Biomedicines. 2023;11(3):809. doi: 10.3390/biomedicines11030809, PMID 36979789.
Lipids in Health and Disease Research Team. Distribution of lipid levels and prevalence of hyperlipidemia: data from the NHANES 2007-2018. Lipids Health Dis. 2023. doi: 10.1186/s12944-023-01715-w.
Martin TJ, Sims NA, Seeman E. Physiological and pharmacological roles of PTH and pthrp in bone using their shared receptor PTH1R. Endocr Rev. 2021;42(4):383-406. doi: 10.1210/endrev/bnab005, PMID 33564837.
The effect of statin therapy on LDL-cholesterol total cholesterol and triglycerides in hyperlipidemia. Am J Cardiovasc Drugs. 2023;23(5). doi: 10.1007/s40256-023-00452.
Ezetimibe monotherapy: clinical efficacy and safety in the management of hypercholesterolemia. Cardiovasc Ther. 2023;41(1). doi: 10.1111/1755-5922.12345.
The impact of ezetimibe on HDL cholesterol: a review of clinical data. J Lipid Res; 2023. doi: 10.1194/jlr.R2023-000789.
Van Heek M, Farley C, Compton DS, Hoos L, Alton KB, Sybertz EJ. Comparison of the activity and disposition of the novel cholesterol absorption inhibitor SCH58235 and its glucuronide SCH60663. British J Pharmacology. 2000;129(8):1748-54. doi: 10.1038/sj.bjp.0703235.
Williams R. Caution against using cyclooxygenase 2 inhibitors for pain after cardiac surgery. Nat Rev Cardiol. 2005;2(9):439. doi: 10.1038/ncpcardio0289.
Fruchart JC. Peroxisome proliferator-activated receptor alpha (PPAR alpha): at the crossroads of obesity diabetes and cardiovascular disease. Atherosclerosis. 2009;205(1):1-8. doi: 10.1016/j.atherosclerosis.2009.03.008, PMID 19386311.
Yadav P, Rastogi V, Verma A. Application of box behnken design and desirability function in the development and optimization of self-nanoemulsifying drug delivery system for enhanced dissolution of ezetimibe. Future J Pharm Sci; 2023. doi: 10.1186/s43094-023-00401-6.
Junyaprasert VB, Morakul B. Nanocrystals for enhancement of oral bioavailability of poorly water soluble drugs. Asian Journal of Pharmaceutical Sciences. 2015;10(1):13-23. doi: 10.1016/j.ajps.2014.08.005.
Ran Q, Wang M, Kuang W, Ouyang J, Han D, Gao Z. Advances of combinative nanocrystal preparation technology for improving the insoluble drug solubility and bioavailability. Crystals. 2022;12(9):1200. doi: 10.3390/cryst12091200.
Yadav P, Rastogi V, Verma A. Application of box behnken design and desirability function in the development and optimization of self nanoemulsifying drug delivery system for enhanced dissolution of ezetimibe. Future J Pharm Sci; 2023. doi: 10.1186/s43094-023-00401-6.
Berger J, Moller DE. The mechanisms of action of PPARs. Annu Rev Med. 2002;53:409-35. doi: 10.1146/annurev.med. 53.082901.104018, PMID 11818483.
Heller F, Harvengt C. Effects of clofibrate bezafibrate fenofibrate and probucol on plasma lipolytic enzymes in normolipaemic subjects. Eur J Clin Pharmacol. 1983;25(1):57-63. doi: 10.1007/BF00544015, PMID 6617725.
Goldberg AC, Sapre A, Liu J, Capece R, Mitchel YB, Ezetimibe Study Group. Efficacy and safety of ezetimibe coadministered with simvastatin in patients with primary hypercholesterolemia: a randomized double blind placebo-controlled trial. Mayo Clin Proc. 2004;79(5):620-9. doi: 10.4065/79.5.620, PMID 15132403.
National Cholesterol Education Program (NCEP) expert panel on detection evaluation and treatment of high blood cholesterol in adults (adult treatment panel iii). Third report of the National Cholesterol Education Program (NCEP) expert panel on the detection evaluation and treatment of high blood cholesterol in adults (adult treatment panel iii) final report. Circulation. 2002;106(25):3143-421. doi: 10.1161/circ.106.25.3143, PMID 12485966.
Kosoglou T, Statkevich P, Fruchart JC, Pember LJ, Reyderman L, Cutler DL. Pharmacodynamic and pharmacokinetic interaction between fenofibrate and ezetimibe. Curr Med Res Opin. 2004;20(8):1197-207. doi: 10.1185/030079903125004277, PMID 15324522.
Stein E. Results of phase I/II clinical trials with ezetimibe a novel selective cholesterol absorption inhibitor. European Heart Journal Supplements. 2001;3 Suppl E:E11-6. doi: 10.1016/S1520-765X(01)90107-5.
Mani DN, Bawankule DU, Saroj BK. Hyperlipidemic model: studying lipid profile in the small experimental animal. Int J Pharm Pharm Sci. 2012;4(3):337-40.
Bhowmick M, Basak SC, Kumar KP. Nanosuspension: a review. Int J Pharm Pharm Sci. 2012;4(3):45-53.
Gadad AP, Dandagi PM, Mastiholimath VS, Patel VS. Development and characterization of fenofibrate loaded nanostructured lipid carriers (NLCs) for oral administration. Int J Pharm Pharm Sci. 2019;11(5):95-100.
Singh B, Bandral JD, Gupta V, Vaidya M, Chib S. Design development and evaluation of fenofibrate nanosuspension using box behnken design. Asian J Pharm Clin Res. 2020;13(9):64-72.
Kapadiya N, Chauhan NS, Jain AK, Patel JR. Design and development of fenofibrate nanosuspension using the solvent antisolvent method. Int J Appl Pharm. 2021;13(2):88-94.
Jaiswal SB, Dubey V, Tripathi K. Nanosuspension: a promising approach for the enhancement of bioavailability. Int J Curr Pharm Res. 2018;10(2):1-4.
Chakraborty S, Dey S, Basu S. Ezetimibe and fenofibrate combination in the management of hyperlipidemia: clinical evidence and future perspectives. J Clin Lipidol. 2024;18(1):120-9. doi: 10.1016/j.jacl.2023.11.003.
Patel S, Bhatt N. Nanosuspension based drug delivery system: an overview and its application in the enhancement of bioavailability of poorly soluble drugs. J Drug Deliv Sci Technol. 2023;78:103085. doi: 10.1016/j.jddst.2023.103085.
M Suguneshwari, Shering Anto Azagesh Raj, Bharathi, Sathish. Preparation characterization and evaluation of nanoparticle containing hypolipidemic drug and antihypertensive drug. Int J Pharm Biol Arch. 2011;2(3):949-53.
Bakhatwar M, Ruksana S, Rajeswari Aleti, Mamatha Kola. Fenofibrate nanosuspension: a novel strategy to enhance its bioavailability for the management of hyperlipidemia. J Clin Pharm Res. 2024;4(4)1-4. doi: 10.61427/jcpr.v4.i4.2024.132.