
Int J App Pharm, Vol 17, Issue 2, 2025, 468-482Original Article
QBD APPROACH IN THE ENHANCEMENT OF ORAL BIOAVAILABILITY TELMISARTAN FAST DISSOLVING TABLETS EMPLOYING STARCH HUMATE AS A NEW SUPERDISINTEGRANT
ANIL KUMAR V., SANTOSH KUMAR RADA*
Department of Pharmaceutics, GITAM School of Pharmacy, GITAM (Deemed to be University), Rushikonda, Visakhapatnam-530045, Andhra Pradesh, India
*Corresponding author: Santosh Kumar Rada; *Email: srada@gitam.edu
Received: 04 Oct 2024, Revised and Accepted: 01 Jan 2025
ABSTRACT
Objective: This research focuses to enhance the of oral bioavailability of Telmisartan (TMN) by developing Fast Dissolving Tablets (FDTs) using Starch Humate (SH) as a new superdisintegrant. Quality By Design (QbD) method was employed to assess SH for enhancing the Dissolution Efficiency (DE) of Cardio Vascular Drug (CVD)-TMN.
Methods: Sorghum starch was isolated through an alkaline treating method from sorghum flour, followed by it reacts humic acid to form SH. Various flow characterization techniques were used, including NMR for structural and functional group analysis. Scanning Electron Microscopy (SEM) and X-Ray Diffraction (XRD) for Surface morphology, Fourier transform infrared (FTIR) spectroscopy (FTIR) and Differential Scanning Calorimetry (DSC) for drug-excipient compatibility and thermal behavior. QbD was applied to assess Disintegration Time (DT), Cumulative Percent Drug Dissolution (CPDD), and Dissolution Efficiency (DE), taking SH, Sodium Starch Glycolate (SSG), and Crospovidone (CP) as variables. TMN-FDTs utilized the approach of 23-factorial design in their formulation by direct compression method.
Results: The SS and SH are insoluble in aqueous and organic solvents, with pH shows 5.1-5.8, a good angle of repose. 4.5-5.4 ppm peaks are anomeric protons of glucose, which confirms starch and the 4.8-5.4 ppm region confirms a strong bond in SH through NMR. SEM and XRD confirm crystalline nature, and FTIR and DSC investigations revealed no interaction. Optimized TMN-FDTs with 5% starch humate disintegration time (24±0.06 seconds), %CPDD10 (99.73±0.61%), and %DE (1.31±0.12 to 71.6±0.15%). Pharmacokinetics studies demonstrated improved relative bioavailability (113.09%).
Conclusion: This study revealed that SH could potentially be a new superdisintegrant developed into fast-dissolving tablets by QbD in managing hypertension, exhibiting enhanced relative bioavailability and patient acceptance.
Keywords: Starch humate, Superdisintegrant, QbD, Fast dissolving tablets, Oral bioavailability
© 2025 The Authors. Published by Innovare Academic Sciences Pvt Ltd. This is an open access article under the CC BY license (https://creativecommons.org/licenses/by/4.0/)
DOI: https://dx.doi.org/10.22159/ijap.2025v17i2.52865 Journal homepage: https://innovareacademics.in/journals/index.php/ijap
INTRODUCTION
Telmisartan (TMN) an antihypertensive, belongs to the Biopharmaceutical Classification System (BCS) type II medication that has limited bioavailability [1, 2]. In pharmaceutical research, various methods have been investigated to enhance the dissolution of drugs with water insoluble in fast-dissolving tablets, which will provide more rapid and higher absorption than its usual oral dosage forms. This type of tablet reduces the time between drug disintegration and absorption by dissolving it in saliva and absorbing it before reaching the GIT. Drug absorption happens often in the mouth, throat, especially oral cavity. Pregastric absorption improves bioavailability by passing hepatic metabolism [3-5].
Quality by design (QbD) has recently received a lot of interest in the scientific and industrial communities for its ability to minimize the time required leading to comprehension processes from the least number of experiments for formula development with effective utilization of resources [6]. QbD is a regulatory, methodical, knowledge-based methodology that employs quality management principles to ensure the quality of a designated final product [7]. QbD requires determining the Quality Target Product Profile (QTPP) and Critical Quality Attributes (CQAs), which have a significant impact on the quality of the end product.
The present research work discusses the optimization of the telmisartan fast-dissolving tablets by using the direct compression method as a new superdisintegrants in enhancing the oral bioavailability of the poorly soluble drug. This work involves establishing starch humate as a new superdisintegrant employing a 23-factorial design to predict the optimum percentage for preparing fast-dissolving tablets, a comparative analysis will be conducted between exiting marketed superdisintegrant and the new SH superdisintegrants.
Introduction of SH as a new superdisintegrant in the development of FDTs of the antihypertensive drug TMN is the novelty of this research. It may have better water absorption capacity than SSG and CP and absorbs more efficiently from swelling index that would benefit low solubility drugs, identified by using starch sheet properties with the addition of humic acid (SH) [8] Due to its SH’s unique porous structure attributed to the combination of humic acid and starch, the tablet possessing more water permeated into the tablet led to quick disintegrating [9]. CP is also disintegrating rapidly due to capillary action and wicking; however, SS has a larger surface area and hence SH's surface area and porosity may allow for faster water wicking and distribution than CP through SEM analysis. SH is more biocompatible and safer with the least toxicity. SSG and CP are also discussed as being safe but are chemically crosslinked, so they yield slower biodegradation and will tend to accumulate if applied heavily. Disintegration enhancement with SH to improve wetting and aqueous exposure of particles leads to improved oral bioavailability [10].
MATERIALS AND METHODS
Materials
Telmisartan was obtained from Yarrow Chem Products, Mumbai. Starch Humate and sorghum starch were synthesized in the GIET School of Pharmacy Research Lab. Crospovidone and microcrystalline cellulose, Sodium starch glycolate, and Mannitol were acquired from Yarrow Chem Products, Mumbai, and Loba Chemie Pvt. Ltd., respectively. Talc and Magnesium stearate were sourced from Loba Chemie Pvt. Ltd. and Burgoyne Urbidges and Co., respectively.
Methods
Extraction of sorghum starch
Initially, sorghum millet was collected, and unwanted materials and debris were removed; the isolation of starch from millets is performed using the wet milling method, steeped in water because removing kernel requires 2-4 d. In millet, starch granules are tightly bound to the matrix; therefore, chemical solutions are used during the steeping method to increase starch yield and purity. Alkaline and acid solutions increase steeping efficiency, but the alkali method leads to the easy removal of the protein layer from the tight matrix of millet; hence, it is considered the best method for starch extraction. 0.25% W/V sodium hydroxide used softened grains allowed 18-24 h, removed supernatant layer, followed by several filtration using conventional methods like muslin cloth and continuous centrifugation (REMI P24, Mumbai) at 5000-7000rpm at 10 min to remove protein. The above procedure is repeated several times to increase starch yield. The final residue of starch is subjected to drying in a hot air oven, the contents at 40 °C for 24 h. The yield percentage, chemical composition, and other properties of isolated starch highly depend on the method adopted for isolation [11].
Preparation of starch humate
To begin the process, ten parts of starch were dispersed in 25 parts of distilled water, dispersion of the mixture was stirred using a magnetic stirrer for at least 1 h. Ten parts of humic acid was dissolved in a beaker containing 10 ml of distilled water. The mixture was stirred using a magnetic stirrer for 1 h. The starch-humic acid dispersion was adjusted to a pH of 5-6 by adding 0.1N NaOH, allowed by conditioning for 16 h at room temperature. The supernatant liquid was separated from the collected suspension to eliminate unreacted humic acid. The prepared solid mass underwent washing with distilled water to transfer the collected suspension to a stainless-steel tray at 60 °C. The resulting solid mass was dried and sieved through a #120 sieve, and the dried product was further passed and stored in desiccators [12].
Evaluation of starch humate
The prepared new superdisintegrant undergoes a series of characterization tests to ascertain its suitability for use in the formulation of fast-dissolving tablets (FDTs). The examinations encompass morphological attributes, physical characteristics, and drug-excipient compatibility with the selected drug.
Solubility
Sorghum starch (SS) and Starch Humate (SH) solubility were evaluated in various organic solvents (chloroform, alcohol, petroleum ether, dichloromethane, acetone), water, and buffers (aqueous) with pH ranging from 1 to 7.4.
pH: A 1% slurry of SH was prepared, and the pH was measured using a pH meter.
Melting Point: The melting point was determined using a melting point apparatus.
Viscosity: Viscosity was determined using an Ostwald viscometer with 1% SH dispersions.
Swelling index (S. I.)
Two test tubes containing 200 mg of SH each were mixed with liquid paraffin and distilled water. The swelling index was calculated using the formula:
(Volume of sediment in water-Volume of sediment in light liquid paraffin)/Volume of sediment in light liquid paraffin.
Test for gelling property
A 7% w/v SH dispersion was prepared and heated for 30 min in a water bath to determine its gelling property.
Particle size
This analysis was performed by sifting through standard sieves.
Density
The liquid displacement method with benzene as the liquid was used to determine the density of SH.
Moisture absorption
The hygroscopic nature of SH was assessed at room temperature and 84% relative humidity in a closed desiccator.
Angle of repose
The funnel method was used for calculating the angle of repose. An optimally shaped cone (h) was obtained by pouring the mixture into a vertically adjustable funnel. By obtaining a measurement of the pile's radius (r) and putting the results into the below formula.


θ = angle of repose; h = height of pile; r = radius of pile
Bulk and tapped density
The apparent Bulk Density (BD) was obtained by pouring the contents into a calibrated cylinder. The known mass mixture in the measuring cylinder was tapped for a specific period, and the results were calculated accordingly.
The carr's index
The Compressibility Index (CI), a valuable metric, can be evaluated by contrasting the bulk and tapped densities. The formula indicates that less energy needs to be expended to compress a substance the more fluid it is.

Hausner's ratio
Hausner's ratio is an indirect measure of the powder's flow efficiency. The following formula can be used to obtain this value [13].
Haussner's ratio 
Drug excipient compatibility
Fourier transforms infrared spectroscopy (FTIR)
Samples of SS and SH in KBr discs were analyzed using a BRUKER FTIR instrument under 6 to 8 tons of hydrostatic pressure, scanning 500-4000 cm-1.
Differential scanning calorimetry (DSC)
A mixture in a 1:1 ratio of the selected drug and superdisintegrant (SH) was prepared and analyzed using a Perkin Elmer Thermal Analyzer with a scanning rate of 100 °C/min in the temperature range of 30 – 350 °C [14].
Nuclear magnetic resonance (NMR)
1H NMR spectra (DMSO-d6) and measured by Bruker 400 MHz NMR spectrometer (Bruker).
X-ray diffraction (XRD)
X-ray diffractometry (analytical spectra Pvt. Ltd., Singapore) was employed to determine the diffractions of SH using a diffractometer; target, Cu (λ1.54 A), filters, Ni; voltage, 40 ⱪV; power 30mA; scanned rate 4 °/min; and recorded between 30-150 ° with the full scale 200 [15].
Scanning electron microscopy (SEM)
SEM (Carl Zeiss, Oberkochen, Germany) was utilized to assess the surface morphology of SH with voltage ranging from 0.3 to 40 kV [16].
Formulation of fast-dissolving tablets by using the direct compression method
The direct compression method was performed to formulate telmisartan fast-dissolving tablets. 3 distinct superdisintegrants Sodium starch glycolate, and Crospovidone Starch Humate, were employed in the formulations. Eight different formulations (F1 to F8) were developed, each utilizing a specific combination of superdisintegrants. The tablet manufacturing process involved direct compression, with all ingredients, including Starch Humate, crospovidone, Sodium starch glycolate, mannitol, and MCC, precisely weighed and homogeneously mixed by using a mortar and pestle [17].
To ensure uniformity in particle size, each ingredient underwent screening via a #100 mesh-sized screen before blending. The powder blend was subsequently analyzed for flow properties. The total powder blend was individually weighed for ten tablets per formulation based on calculations derived from the drug content of the powder blend. The individually weighed powders were then compressed using a tablet compressing machine. Finally, magnesium stearate and talc were incorporated into the powder mixture, and the mixed blend underwent compression by using a ten-station tablet compression machine (Shakti, Mumbai, India). The composition of the various formulations of telmisartan fast-dissolving tablets is outlined in table 1.
Table 1: Composition of 23factorial design batches of telmisartan FDTs
| Ingredients (mg/tablet) | F1 | F2 | F3 | F4 | F5 | F6 | F7 | F8 |
| Telmisartan | 40 | 40 | 40 | 40 | 40 | 40 | 40 | 40 |
| SH | - | 10 | - | 10 | - | 10 | - | 10 |
| SSG | - | - | 10 | 10 | - | - | 10 | 10 |
| CP | - | - | - | - | 10 | 10 | 10 | 10 |
| Microcrystalline cellulose | 30 | 30 | 30 | 30 | 30 | 30 | 30 | 30 |
| Mannitol | 122 | 112 | 112 | 102 | 112 | 102 | 102 | 92 |
| Magnesium stearate | 4 | 4 | 4 | 4 | 4 | 4 | 4 | 4 |
| Talc | 4 | 4 | 4 | 4 | 4 | 4 | 4 | 4 |
| Total | 200 | 200 | 200 | 200 | 200 | 200 | 200 | 200 |
Experimental design
A 23 factorial design was used to optimize the superdisintegrant ratio. This design entailed running experimental trials in all eight possible combinations and analysing each of the three components at two separate levels; a factorial design was developed. The design process outlined in this method is elucidated, reproducible, and rational for experimental choices and provides for exploring the interaction between the formulation variables and improving the bioavailability of the drug [18]. It is proposed that it is the superdisintegrants concentration that makes sharp the difference in disintegration time because such degenerating superdisintegrants have a greater capacity for swelling and, thus porosity. For the FDTs, disintegration time is critical, so the superdisintegrant concentration is optimized to achieve effective tablet disintegration. SH (X1), SSG (X2), and CP (X3) were considered independent variables, with each factor tested at values of-1, and+1. Lower concentration may lead to suboptimal disintegration, while higher concentration could affect tablet integrity. The upper limit was set to avoid excessive swelling that could compromise the tablet's stability. The dependent variables under consideration are disintegration time (DT), cumulative percent drug dissolved at the end of 10 min (CPDD10), and dissolution efficiency at the end of 10 min (%DE10). Table 2 shows each of the dependent and independent variable levels employed, as well as the overall factorial design arrangement of the variables. Table 3 shows the design matrix of 23 factorial design.
Table 2: Dependent and independent variable levels employed
| Parameter | Low (-1) | High (+1) |
| Independent variables | ||
| SH (mg) (X1) | 0 | 5 |
| SSG (mg)(X2) | 0 | 5 |
| CP (mg)(X3) | 0 | 5 |
| Dependent variables* | ||
| Disintegration Time (DT), | 8±0.06 to720±0.02 | |
| Cumulative percent drug dissolved at the end of 10 min (CPDD10), | 24.47±0.19 to99.73±0.61 | |
| Dissolution efficiency at the end of 10 min (%DE10). | 1.31±0.12 to71.6±0.15 |
Table 3: A Transformed design matrix of 23 factorial design for TMN-FDTs
| Formula code | A (%) | B (%) | C (%) |
| F1 | 0 | 0 | 0 |
| F2 | 5 | 0 | 0 |
| F3 | 0 | 5 | 0 |
| F4 | 5 | 5 | 0 |
| F5 | 0 | 0 | 5 |
| F6 | 5 | 0 | 5 |
| F7 | 0 | 5 | 5 |
| F8 | 5 | 5 | 5 |
Evaluation of FDTs
Pre-compression parameters
The powder material was evaluated for flow characteristics such as angle of repose, Bulk density, tapped density and Hausner′s Ratio detailed procedure was already explained in the evaluation of SH.
Post-compression parameters
Hardness
The tablet’s hardness, indicative of its strength, was determined by measuring the force required to break the tablet across its surface. This was assessed using a Monsanto hardness tester, and the force was measured in kilograms (kg). A hardness within the range of 3-5 kg/cm² is considered acceptable for uncoated tablets. Hardness values were determined for ten tablets from each formulation.
Thickness and diameter
The thickness and diameter of the tablet were measured using vernier callipers. These dimensions are crucial for ensuring uniformity and consistency in tablet size [19].
Drug content
Five tablets randomly selected from each batch were weighed pulverized, and 10 mg equivalent of the powder was diluted with 10 ml of 6.8 phosphate buffer. The volume was adjusted to 100 ml, and 10 ml of the resultant solution was extracted and further diluted to 100 ml with 6.8 phosphate buffer. The absorbance of the solution was measured using a UV-Spectrophotometer at 296 nm to determine the drug content.
Weight variation test
Twenty tablets were individually and collectively weighed on a digital balance (Scout Pro), and the mean weight of one tablet was determined. As per USP specifications, for tablets with an average weight of 130 mg or less, the maximum permissible percentage difference is 10% [20].
Friability
Friability, indicative of the tablet's capacity to withstand abrasion during packaging, handling, and transport, was determined utilizing a Roche Friabilator. Twenty tablets from each formulation were subjected to rotation at 25 rpm for 4 min. The tablets were subsequently dedusted and reweighed, and the percentage friability was calculated using the formula: Percentage Friability = (Initial weight-Final weight)/Initial weight × 100.
Wetting time and water absorption ratio
Wetting Time (WT) and Water Absorption Ratio (WAR) were determined by placing a tablet on a folded tissue paper in a small Petri dish containing water with amaranth red dye. The time duration required for complete wetting was measured, and the mass of the wetted tablet was subsequently determined. The water absorption ratio (R) was calculated utilizing the following equation:

where Wa represents the mass of the tablet after water absorption, and Wb denotes the mass of the tablet before water absorption.
Disintegration test
The disintegration test was conducted using a USP disintegration apparatus with distilled water at 37±0.5 ℃. The time taken for complete disintegration of six tablets was recorded, and the average disintegration time was reported.
Dissolution studies
The release rate of the formulated telmisartan tablets was characterized using a USP type II (paddle) apparatus at 50 rpm, with phosphate buffer pH 6.8900 ml of distilled water as the dissolution medium. Samples were withdrawn at specified intervals (5, 10, 15, 30, and 45 min), and their absorbance was measured using a spectrophotometer. The results of the dissolution rate were recorded for analysis [21].
Stability studies
The ICH and WHO recommend that an optimum composition of fast-dissolving telmisartan tablets be subjected to expedited testing, which can be achieved by simply storing the tablets in HDPE containers for six months at a temperature of 40 °C and 75° RH. The physical changes and dissolution properties had been evaluated both during as well as after their 6-month storage [22].
In vivo pharmacokinetic studies
The study protocol was approved by the institutional animal ethics committee (IAEC), which approved the experimental protocol (approval number: SVCP/IAE/2023/018). This was carried out in male wistar rats (200-250 g) obtained from Sri Venkateswara College of Pharmacy, Srikakulam, Andhra Pradesh. Rats were divided into two groups; each group had six rats, the first group of rats received the pure drug, and second group of rats was treated with optimized fast-dissolving formulation (F2). Wistar rats were kept together in a house by providing free access to water and food in a clean room, maintaining the temperature at 20-25 °C. For 12 h the animals are kept in a light-dark cycle each day. Randomly selected rats were divided into two batches, each containing six rats. One group was given a pure drug (4.13 mg/kg body weight), and another group was given the F2 formulation (4.13 mg/Kg body weight). All groups received different treatments. The dose was given to the wiser rats by catheter. After the rats were given the drug, they were given moderate ether anesthesia. At predefined intervals, blood was extracted. The blood plasma samples are centrifuged at 5000 rpm and then kept at-20 °C. The samples were assessed using a well-known HPLC approach to look into the pharmacokinetic information [23].
RESULTS AND DISCUSSION
Preliminary studies of starch (Starch humate)
The results of the various tests highlight distinct differences between Sorghum Starch and Starch humate. Starch humate has a lower charring point, suggesting a potential difference in thermal stability. In terms of viscosity, Starch humate exhibits higher viscosity, indicating an altered rheological behaviour compared to Sorghum Starch. Both substances Show no gelling at 100 °C but form clear solutions, suggesting a lack of gel formation at this temperature. Particle size analysis reveals that Starch humate has a smaller particle size compared to Sorghum starch, indicating differences in physical characteristics. Starch Humate also demonstrates higher bulk and tapped densities, implying variations in powder compaction and packing behaviours. Notably, starch humate exhibits a lower angle of repose, suggesting improved flow properties compared to Sorghum Starch.
Table 4: Starch humate physical and micrometric characteristics
| Parameters | Sorghum starch | Starch humate |
| Solubility | SS was insoluble in water and organic solvents | SH is completely Insoluble in both organic (ethanol, dichloromethane, petroleum ether, acetone, chloroform) and aqueous solvents. |
| pH (1% w/v) | 5.1 | 5.8 |
| Melting Point(c) | 145 °C | 138 °C |
| Viscosity (cps) | 3.18cps | 1.24cps |
| Gelling Property | SS Shows gelling property | SH did not Show any gelling property while heat up to 100 c |
| Particle Size µm) | 36 µm | 62µm |
| Bulk density (g/cc) | 0.69±0.13 | 0.37±0.22 |
| Tapped density (g/cc) | 0.85±0.51 | 0.40±0.34 |
| Angle of repose (θ) | 25.55 | 18.55 |
| Compressibility index (%) | 30.16±0.04 | 27.32±0.06 |
*n=3, Data are expressed as mean±SD
Drug excipient compatibility studies
The presence of aliphatic chains, commonly found in the polysaccharide backbone of starch, is indicated by the CH2 stretch at 2925.34 cm⁻¹, 1461.51 cm⁻¹, C-O stretch vibrations at 1080.88 cm⁻¹ and the C-O-C band at 1157.35 cm⁻¹, 1648.38 cm⁻¹ these functional groups are typical of starch, a polysaccharide made up of glucose monomers connected by glycosidic bonds. The presence of carbohydrate chains characteristic of starch molecules in sorghum millet starch is further confirmed by the CH2 and C-O stretches shown in fig. 1.
Humic acid exhibited a broad signal at 3431 cm⁻¹, 1725 cm⁻¹, and 1099 cm⁻¹, which can be attributed to the hydrogen-bonded OH group, C-O stretching of COOH, and C-C double bond. A band was observed at 2924 cm⁻¹ due to the aliphatic C-H group, 1385 cm⁻¹ because of O-H bending shown in fig. 2.
1725 cm⁻¹ band in humic acid and 1648.38 cm⁻¹ band in sorghum starch disappeared and a new peak at 1617.45 cm⁻¹was indicated in the formation of ester (SH) depicts in fig. 3.
The FTIR spectra of TMN, and the drug with SH was obtained to assess potential interactions between the drug and excipients. The characteristic peak values for TMN and key excipients were identified and compared. A distinctive peak at approximately 3347 cm⁻¹ corresponds to the N-H stretching vibration in the amine group. The peak at 1725 cm⁻¹ is attributed to the carbonyl group (C=O) in the carboxylic acid moiety. Peaks at 1583 cm⁻¹ and 1490 cm⁻¹ represent the C=C stretching vibrations in the benzene ring. Starch Humate exhibited characteristic peaks at 3400 cm⁻¹ (O-H stretching) and 1635 cm⁻¹ (C=O stretching) shown in fig. 4. The spectrum of the drug and excipient mixture exhibited all the characteristic peaks of TMN without any additional peaks or shifts shown in fig. 5. No new peaks or substantial changes in peak positions were observed in comparison to the spectra of individual excipients and TMN. The FTIR studies suggest that there are no significant interactions between TMN and the selected excipients.
In NMR 1.05 to 1.5 ppm, this ppm region could indicate the presence of aliphatic protons, 3.1 to 4.1 ppm peaks indicate protons attached to carbons that are directly bonded to oxygen atoms (C-H in CH-OH). This region corresponds to the protons on the glucose units in starch.4.5-5.4 ppm peaks are characteristic of the anomeric protons (H-1) of glucose, confirming starch's presence. This region is crucial for confirming that starch (both amylose and amylopectin) is present. Hydroxyl group (-OH) these are integral to the structure of starch and could appear as broad signals between 3-5 ppm, especially due to Dimethyl Sulfoxide (DMSO) interactions. Shifts in this region confirm the abundant hydroxyl groups typical of polysaccharides like starch anomeric Protons. The distinct signals between 4.5-5.4 ppm indicate the presence of the anomeric (C1-H) proton, which is key for confirming starch structure fig. 6.
To confirm the interaction between starch and humic acid and explore their potential as a new superdisintegrant, esters are typically indicated by peaks in the region of 1.9-2.2 ppm for-CH₃ attached to ester groups and around 4.0-4.5 ppm for-CH₂ or-CH groups attached to oxygen in esters. In the spectrum, the peak at 1.91 ppm could suggest a possible ester interaction. Peaks between 3.1-4.5 ppm also correspond to carbons attached to oxygen, likely confirming the presence of esterified groups. Shifts or broadening of starch-related peaks in the 4.8-5.4 ppm region could indicate strong interaction with humic acid, altering the chemical environment of the starch anomeric protons (fig. 7).
SS, humic acid, and SH-TMN (1:1) thermograms generated by DSC revealed a significant melting endothermic peak at 96.9 C (fig. 8), indicating the melting temperature of SS, endothermic curve at 90.1 C (fig. 9) revealed a melting temperature of SH, a significant melting endothermic peak at 269.7 C (fig. 10) revealed that drug melting temperature. From the DSC spectra, it was concluded that the TMN did not show any interaction with the starch humate. XRD of the starch humate shows a typical spectra’s 2 theta angles were carried out for pure SS and SSH. XRD of SH indicated its typical crystalline pattern (fig. 11). SS has a fine-diffused and slightly crystalline nature (fig. 12). SEM of the SS confirms fine and slightly crystalline in shape. SEM of the SH confirms the crystalline nature shown in (fig. 13 and 14).
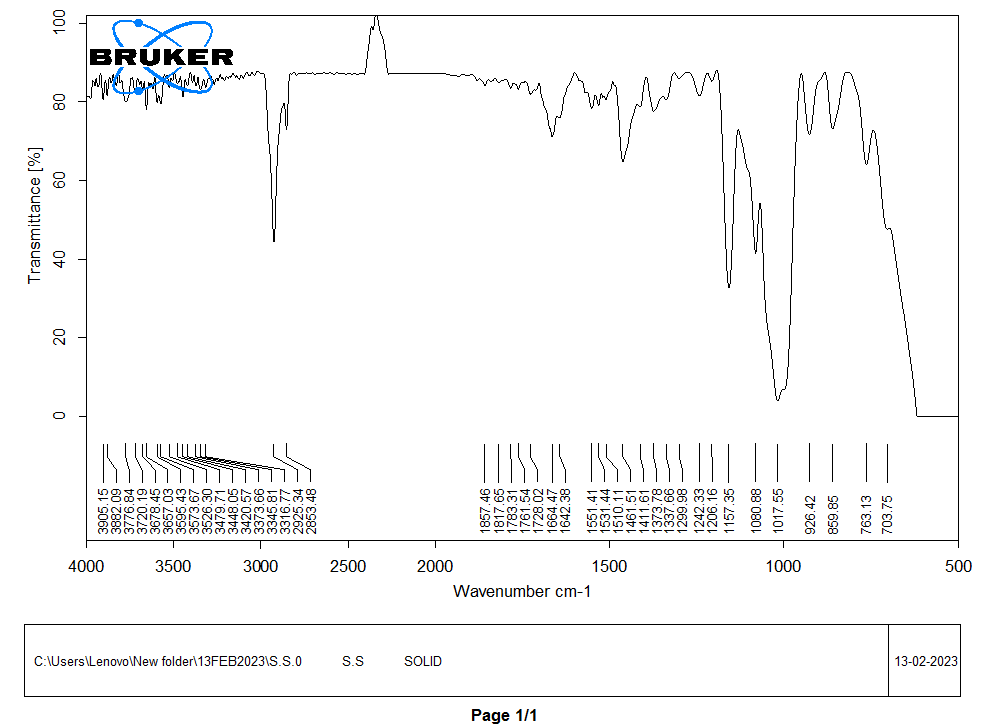
Fig. 1: FTIR of sorghum starch
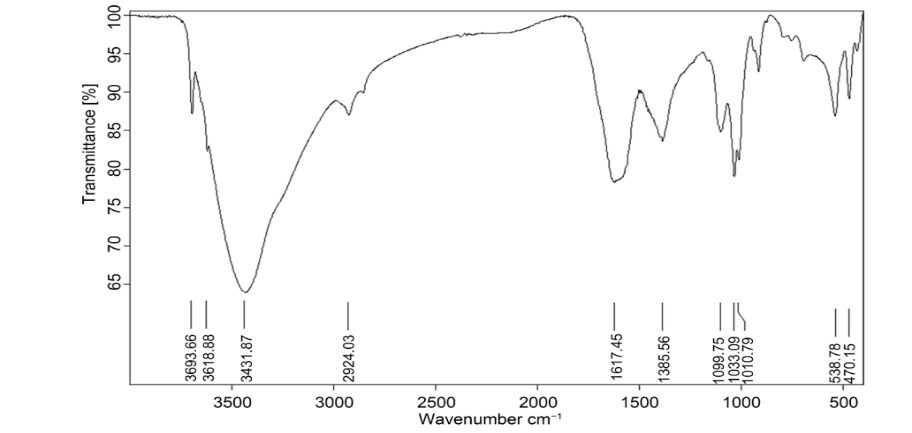
Fig. 2: FTIR of humic acid
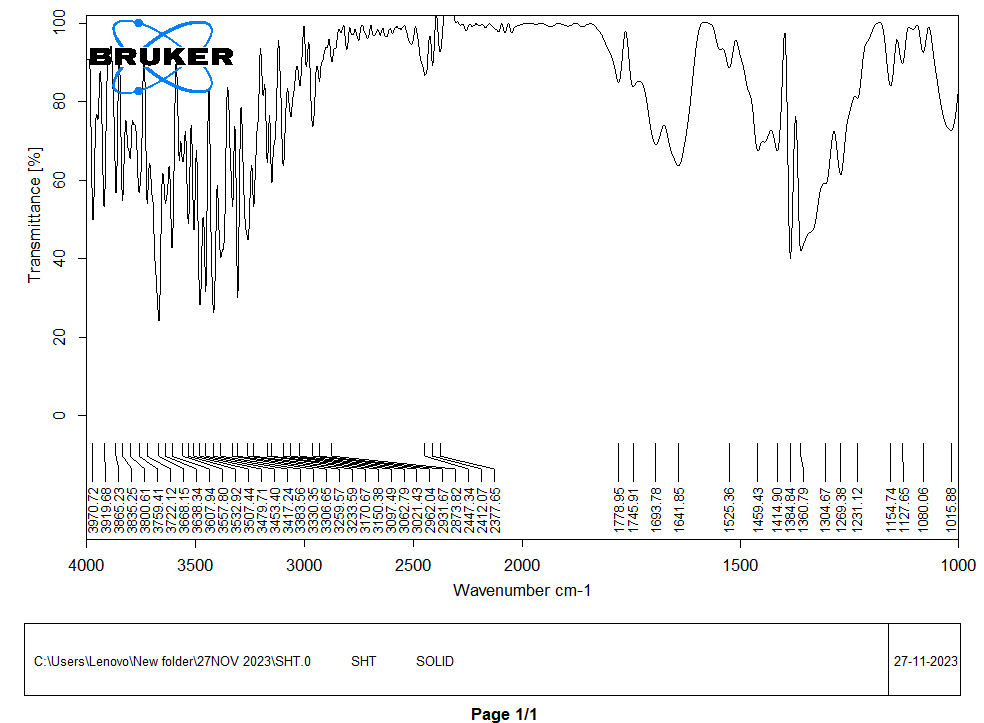
Fig. 3: FTIR spectrum of starch humate
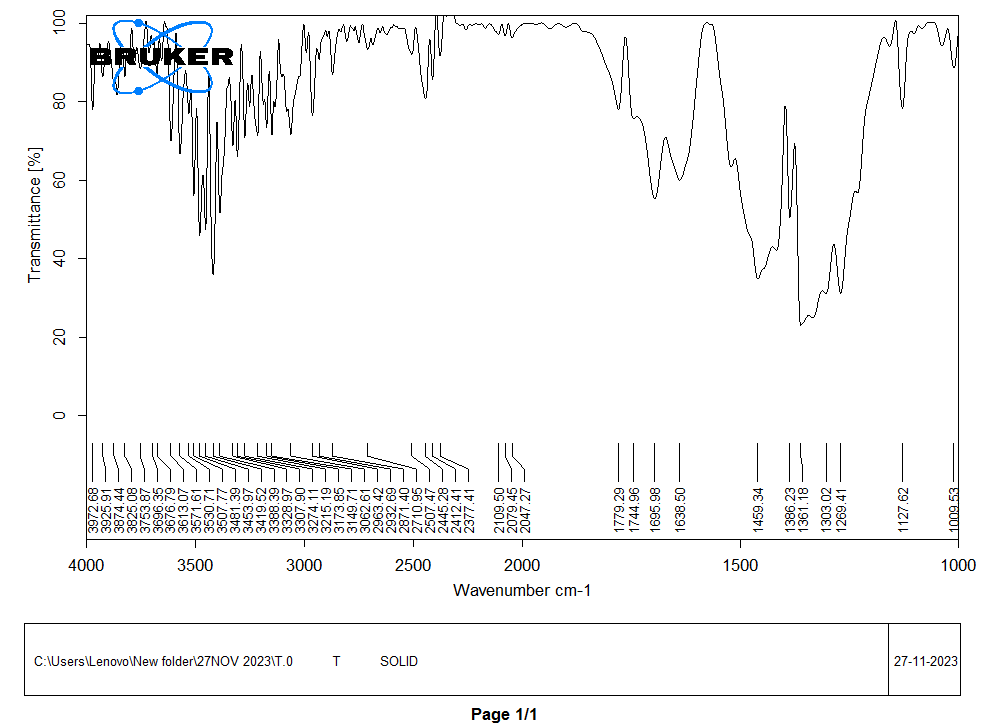
Fig. 4: FTIR of Telmisartan
Fig. 5: FTIR of telmisartan with SH
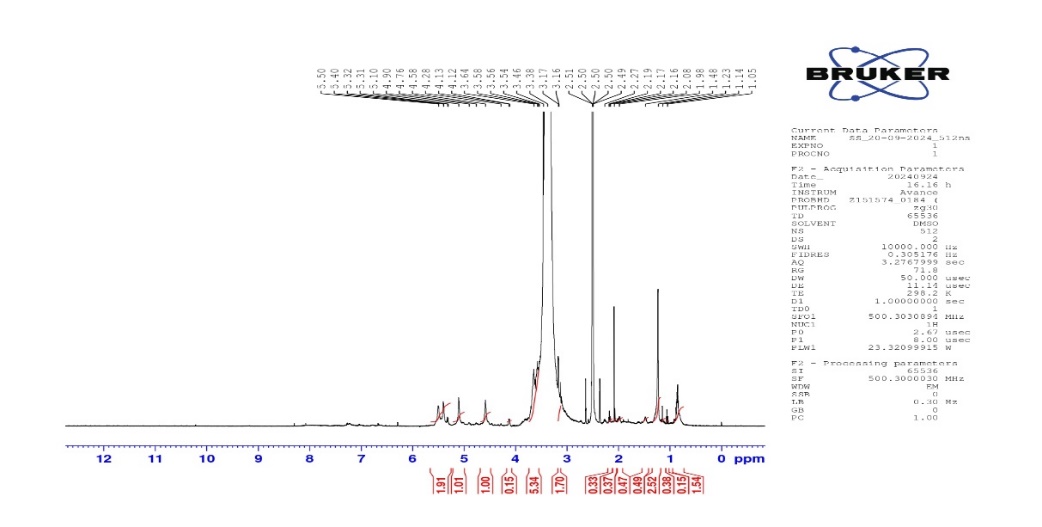
Fig. 6: NMR of sorghum starch
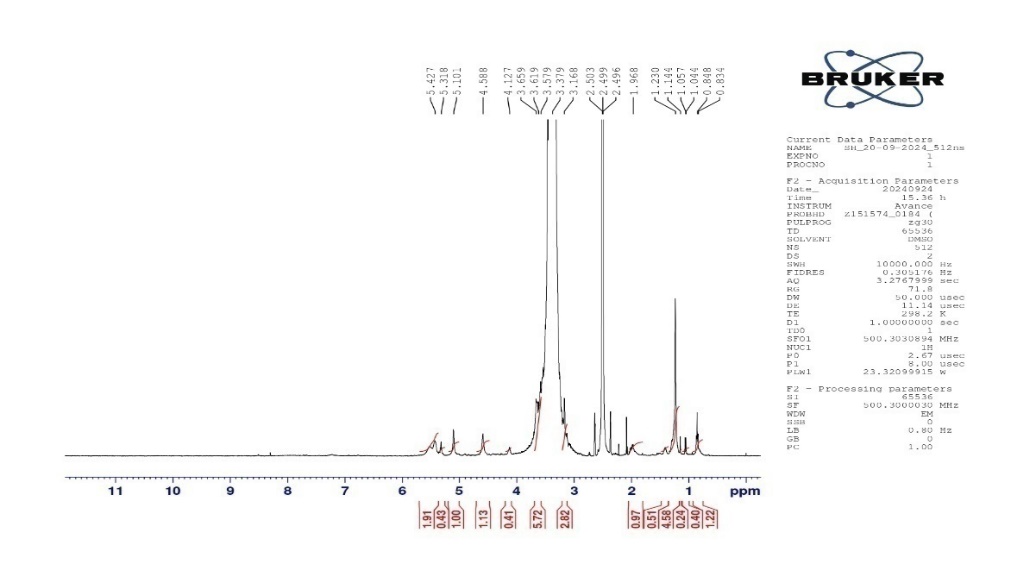
Fig. 7: NMR of starch humate
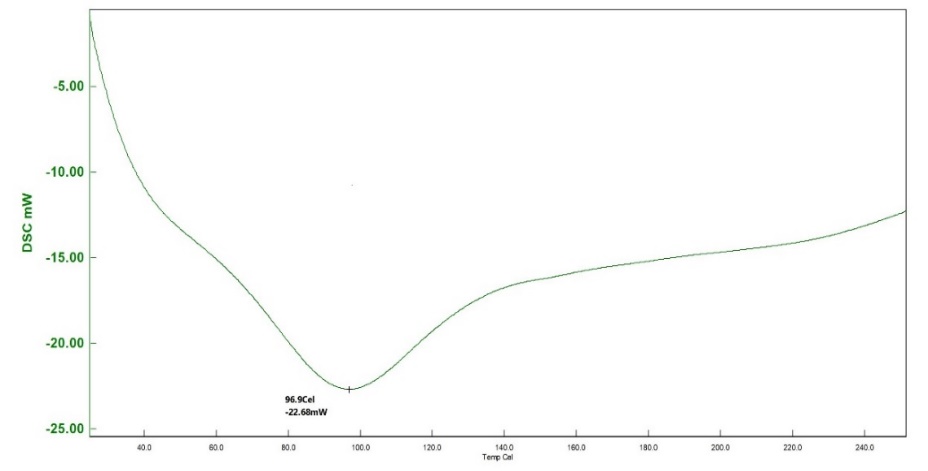
Fig. 8: Differential scanning calorimeter of sorghum starch
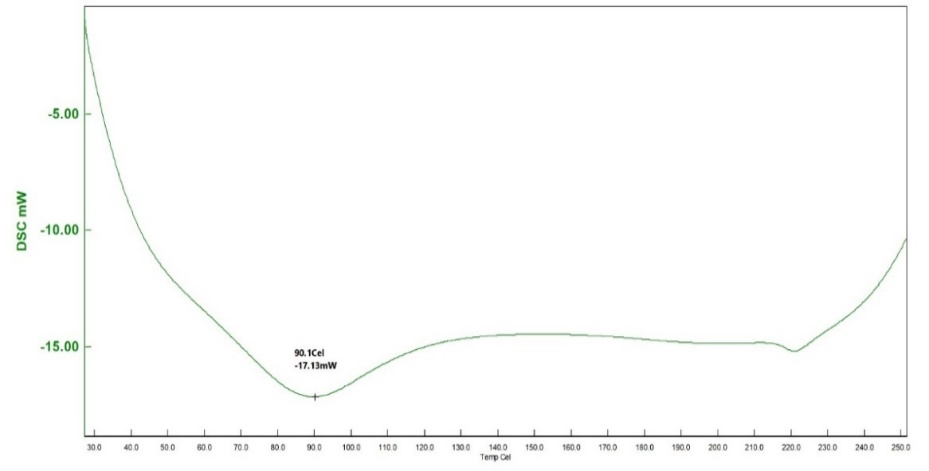
Fig. 9: Differential scanning calorimeter of starch humate
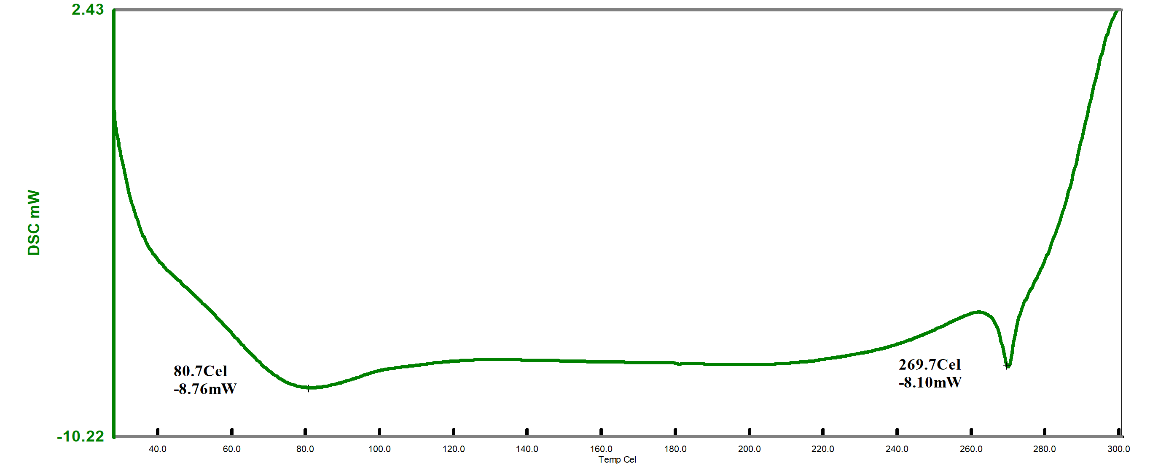
Fig. 10: DSC of starch humate with telmisartan
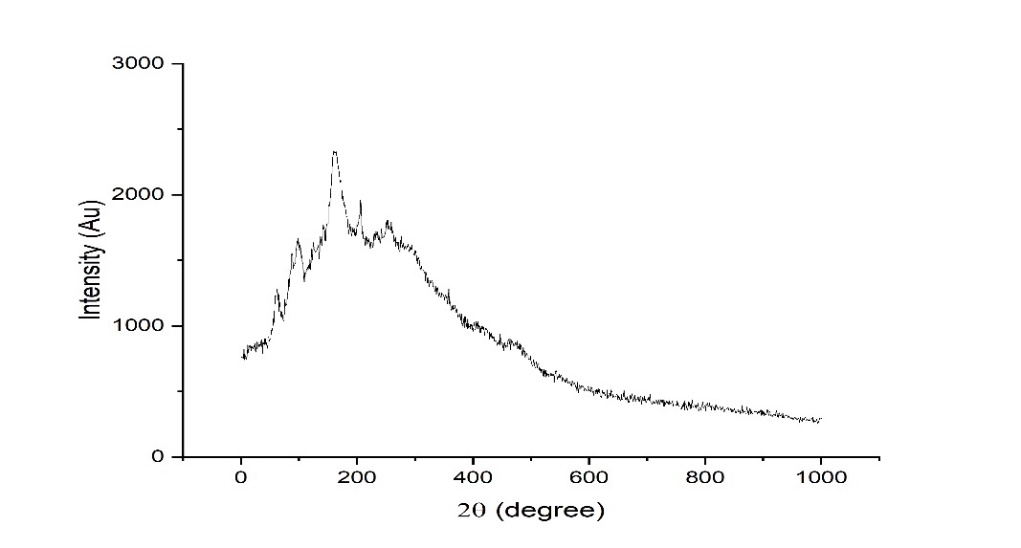
Fig. 11: X-ray diffraction pattern of sorghum starch
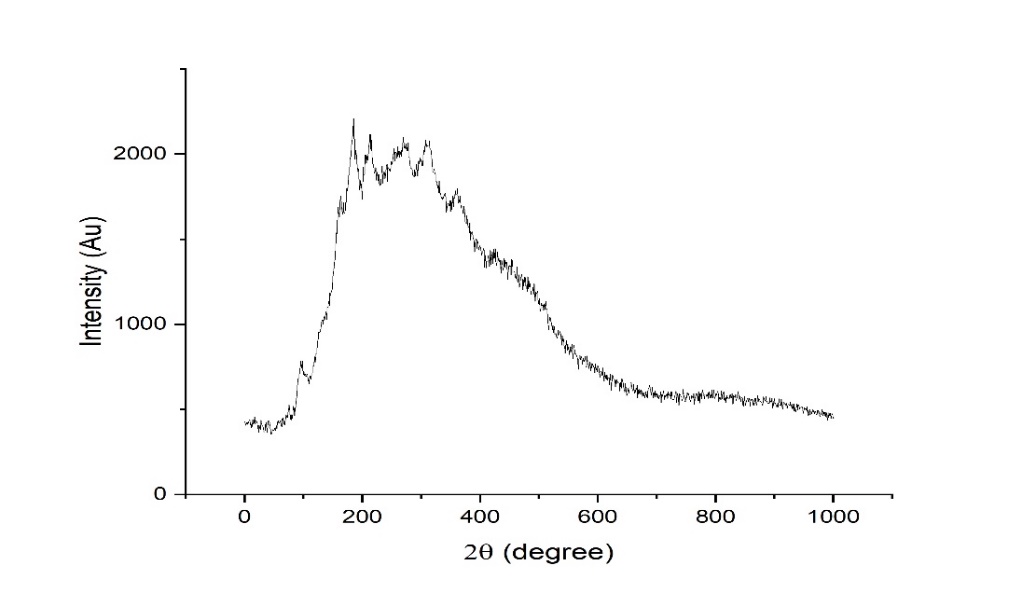
Fig. 12: X-ray diffraction of starch humate
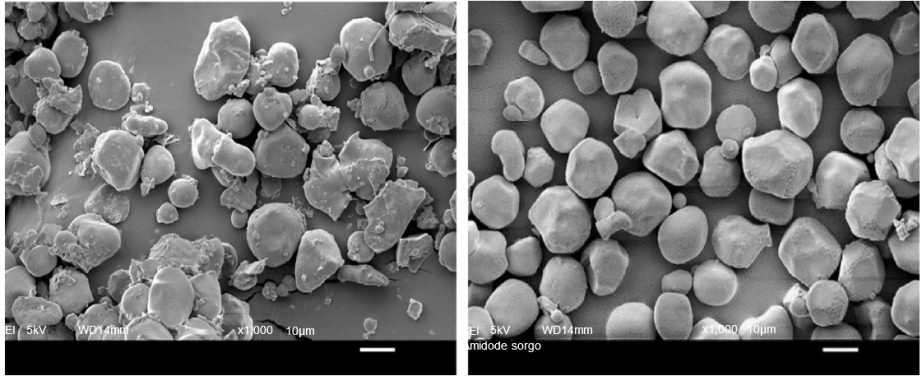
Fig. 13: SEM of sorghum starch
Fig. 14: SEM of starch humate
Results of pre-compression parameters
Before compression, the micrometric characters were studied for the powder blend of each formulation to understand the processability and packing nature of the powder blend during the process. Bulkiness of the powders were studied through bulk density and tapped density of the formulation powder blend that varied from 0.51±0.03 g/cc to 0.61±0.06 g/cc and 0.69±0.15 g/cc to 0.78±0.0 g/cc respectively. The results of compressibility (Carr’s) index found as 11.21±0.7 to 12.62±1.0 and the angle of repose was found to be 21.14±0.3 to 22.58±0.5 indicates the powder blends have good flow properties with acceptable packing ability. All the results of pre-compression parameters are given in table 5.
Table 5: pre-compression parameters of powdered blend
| Formulation | Bulk density | Tapped density | Angle of repose(ϴ) | Carr̕s index |
| Code | (g/cc) | (g/cc) | (%) | |
| F1 | 0.53±0.02 | 0.76±0.03 | 21.14±0.3 | 12.41±0.6 |
| F2 | 0.52±0.04 | 0.77±0.07 | 22.58±0.5 | 11.31±0.9 |
| F3 | 0.53±0.05 | 0.70±0.02 | 21.18±0.1 | 12.23±0.5 |
| F4 | 0.51±0.03 | 0.69±0.08 | 21.43±0.6 | 12.62±1.0 |
| F5 | 0.59±0.05 | 0.79±0.01 | 22.23±0.2 | 11.26±0.9 |
| F6 | 0.56±0.19 | 0.69±0.15 | 22.21±0.4 | 12.23±0.4 |
| F7 | 0.61±0.06 | 0.74±0.01 | 21.49±0.1 | 12.14±0.7 |
| F8 | 0.59±0.04 | 0.78±0.04 | 21.37±0.2 | 11.21±0.7 |
*n=3, Data are expressed as mean±SD
Results of post-compression parameters
Hardness
The tabletexhibits the hardness hardness from 3.8±0.93-4.4±0.65 kg per cm2. It can be attributed to the cohesive properties imparted by this excipient this harness for the 6 mm tablet is found to be good enough to withstand while handling. Data is provided below in table 4. The hardness of TMN-FDTs was higher than that of the tablets made in compliance with Santosh et al., [24].
Friability
As per USP the recommended friability range for the tablet dosage forms is Not More Than (NMT 1.0 %). Each formulation was tested 3 times for friability and data is presented below in Tableno7: The friability data (0.58±0.13 to 0.62±0.09) revealed that the prepared tablets have good mechanical strength during manufacturing, packing, and shipping. These FDT are having higher friability compared to the tab formulated by Annu Kumari et al., (0.15±0.012) [25].
Drug content uniformity
The formulations F1-F8 were well, having the drug content from 96.15 98.19
98.19 , these results are within the limit. So, it is clear that the tablets have a sufficient amount of TMN to produce the pharmacological activity. These results were close to the research by M. G. Deviet al., [26].
Wetting time and water absorption ratio
All the formulations exhibit WT ranges from  to 310, optimized formula F2 having a WT of (21±0.04 seconds). This can be shown that SH can enhance tablet wettability indicating rapid disintegration of a tab. These results were better than the tablets made by Rada et al., having a WT of 74±0.37 sec [27].
WAR is 31 to 82 %. F2 had a WAR of (53
 %). This high-water absorption ratio was essential to its quick disintegration. These results were comparatively better than the tablets made by Santosh et al., having a WAR of 9.81±0.10 % [28]. The exited superdis integrant of SSG and CP show superior water uptake and faster wetting over superdisintegrants. Disintegration and rug dissolution in the GIT are facilitated by efficient water absorption and wetting time. Rapid dissolution should be strongly connected to water absorption capability in bioavailability of clinical performance.
In vitro drug release studies from all formulations of TMN-FDTs
The dissolution results reveal the impact of different excipients on the drug release profile of TMN from FDTs. Notably, SH containing formulation F2, displayed remarkable drug release percentages at 5, and 10 min (99.73±0.61), indicating its efficacy in facilitating rapid drug release. The sudden increase in drug release at 10 min for F2 suggests the effective role played by the chosen excipients in achieving the desired release kinetics. These findings underscore the crucial role of excipients in formulating fast-dissolving tablets with tailored drug release characteristics. These results are better than the tablets made by Sayan Banerjee et al., they had a drug release of 92.46% in 1 h [29].
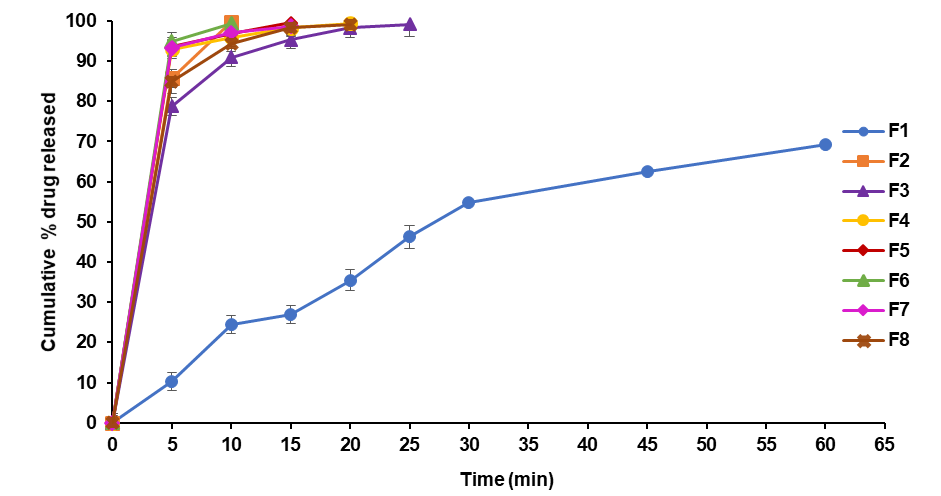
Fig. 15: DE 10% drug release of telmisartan fast dissolving tablets
Table 6: Dissolution parameters of telmisartan FDTs
| Time (Min) | F1 | F2 | F3 | F4 | F5 | F6 | F7 | F8 |
| CPDD10 | 24.47±0.19 | 99.73±0.61 | 90.95±0.73 | 95.94±0.72 | 96.81±0.89 | 99.46±0.61 | 97.06±0.42 | 94.45±0.21 |
| DE10 | 1.31±0.12 | 71.6±0.15 | 59±0.23 | 68.2±0.15 | 65.6±0.24 | 69.4±0.21 | 64.4±0.42 | 62.9±0.26 |
| K(min-1) | 0.0299±0.24 | 0.5891±0.15 | 0.2418±0.28 | 0.2537±0.23 | 0.3456±0.31 | 0.4007±0.32 | 0.2701±0.34 | 0.2878±0.35 |
| No of folds increase in DE | - | 19.7 | 8.08 | 8.48 | 11.55 | 13.40 | 9.033 | 9.625 |
*n=3, Data are expressed as mean±SD
In vitro disintegration time
DT ranged from 720 to
to  seconds, the optimal F2 formulation (containing 5% SH) showed the shortest disintegration time of 27
 seconds, indicated in table 7. Which was shorter than the FDTs prepared by Rani KC et al. and had a disintegration time of 42±02 seconds [30]. SHs effect on disintegration time (relative to control formulations or other exited super disintegrants SSG and CP; faster disintegration time shortens the incongruent time which is critical for bioavailability improvement, especially for poorly soluble drugs. It is emphasized that SH’s rapid disintegration property directly provides supportive evidence towards enhancing bioavailability by accelerating drug release, giving rise to the creation of a high concentration gradient at the absorption.
Table 7: Characterization of telmisartan fast-dissolving tablets
| Formulation | Weight variation (mg/tab)±SD |
Hardness Kg/cm2 |
Friability (%)±SD |
Drug content (mg/tab)±SD |
WAR (%)±SD |
WT (sec)±SD |
DT(Sec) |
| F1 | 199 0.61 0.61 |
3.6 |
0.59 |
98.19 |
31 |
310 |
720 |
| F2 | 201 |
3.8 |
0.62 |
97.18 |
53 |
21 |
27 |
| F3 | 201 |
3.9 |
0.59 |
96.17 |
58 |
 |
32 |
| F4 | 199 |
3.4 |
0.60 |
98.15 |
81 |
10 |
14 |
| F5 | 201 |
3.5 |
0.58 |
97.13 |
69 |
 |
 |
| F6 | 202 |
4.4 |
0.59 |
96.15 |
70 |
 |
 |
| F7 | 200 |
3.50.09 |
0.61 |
97.17 |
65 |
9 |
15 |
| F8 | 201 |
3.8 |
0.60 |
98.13 |
82 |
|
 |
*n=3, Data are expressed as mean±SD; for Weight variation; n=10.
Experimental design
QTPP was used to identify the most important quality parameters including FDTs for TMN administration. TMN-FDTs treat and manage hypertension. The QTPP of TMN comprises a successful and harmless delivery of FDTs That accelerates the onset of medication effects and enhances patient adherence. The process employed to produce FDTs proved stable as well as repeatable; therefore the completed product metal of the requirements for pharmaceutical grade. Table 8 lists the QTPP and explains the reason they were chosen. The main effects and interactions of the selected factors were being measured by ANOVA. We evaluated how each factor had statistical significance to determine how their variables were affected. A 23 factorial design (three factors, two levels) was employed to investigate the interactions and primary influence of the factors, which are independent of dependent responses, as well as to statistically optimize the design parameters. DT (Y1), CPDD10 (Y2), and % DE10 (Y3) were measured at two distinct levels of SSH (X1), SSG (X2), and CP (X3). The factors were selected and their corresponding levels were determined. Analysis of the experimental results was conducted using ANOVA, fitting the response variables within the framework of the factorial design. Design Expert software 12.0.3.0 (State-Ease Inc., Version 12.0.3.0, Minneapolis, USA) was utilized to construct polynomial equations.
Y1 (DT) =+86.19+92.10.14X1+8.28 X2+10.19X3-10.19X1X2-11.37X1X3-10.11X2X3+9.06.88X1X2X3
Y2 (CPDD10) =+58.59+9.64X1+5.94X2+9.21X3-8.11X1X2-9.79X1CX3-7.54X2X3+7.46X1X2X3
Y3 (DE10%)=+58.59+9.64X1+5.94X2+9.21X3-8.11X1X2-9.79X1X3-7.54X2X3+7.46X1X2X3
Table 8: Quality target product profile (QTPP) designated for FDTs of TMN
| QTPP | Target | Justification |
| Dosage form | Fast dissolving tablets | The healthcare industry requires this form of dosage. |
| Administered rout | Oral | To increase drug solubility and avert first-pass metabolism |
| Dosage type | Fast dissolving tablets | Rapid onset of action, improved therapeutic efficacy |
| Stability | Six months with a temp at 40 °C and 75°RH | To safeguard the therapeutic action for the desired period of storage. |
Disintegration time
The disintegration time of FDTs was analyzed using a mathematical model for disintegration time (Y1). The impact of the main variables and their interactions on DT was subsequently examined through contour and 3D response graphs. The contour plot projected a linear relationship. Response and contour plots indicated that increased superdisintegrant amounts may reduce the disintegration time. This phenomenon may be attributed to a higher proportion of superdisintegrants, potentially resulting in faster tablet disintegration. Fig. 16 to 18 depict the effects of response 3D contour plots and surface plots, illustrating the influence between X1 and X2 on DT, X1 and X3 on DT, and X2 and X3 on DT. The plots demonstrate that a superdisintegrant percentage ranging from 3.9% to 5% results in a lower DT of the tablet. Due to its unique porous structure and enahnced swelling properties.
Dissolution efficiency and percent drug dissolved in ten minutes
The contour plots demonstrated a linear association between CPDD10 and DE10%. While the superdisintegrant level varies by 3.9 to 5%, a tablet achieves greater CPDD10 and DE10%. According to the response surface and contour plots, an increased superdisintegrant amount may enhance CPDD10 and DE10%. Effects of response 3D contour plots and surface plots illustrate the influence between X1 and X2 on CPDD10 and DE10%, X1 and X3 on CPDD10 and DE10%, and X2 and X3 for CPDD10 and DE10%, respectively, Superdisintegrants are superior properties of this group because they provided rapid disintegration rate as well as exposure of drug particles in dissolution medium. For higher concentrations (SH) there is further rapid drug release. While SSG and CP tablets exhibited good release, as they did with SH, there may be a slower release rate observed because SSG has a lower water absorption efficiency.
Dissolution efficiency indicates the drug release over time and is the best indicator on how effectively the formulation will improve bioavailability. The higher dissolution efficiency is expected for tablets with SH at a concentration of 5%, because of rapid disintegration and increase in drug release rate with SH's higher swelling capacity. The moderate dissolution efficiency at lower concentrations provides effective release but has potential lower dissolution efficiency below the optimal concentration. depicted in fig. 19 to 24.
Optimal formula
With a 5% concentration of SH, formulation F2 demonstrated a shorter DT, a higher percentage dissolved in 10 min, and DE10%. F2 has a single SH as a superdisintegrant in a concentration range of 5%. Therefore, F2 was considered as an optimized formulation that was more cost-effective. The FDTs of telmisartan tablets formulated with SH as superdisintegrant demonstrated good DT, wetting time, and percent dissolve in 10 min and DE10%. Overall, it was discovered that SH was employed as a superdisintegrant that increased the percentage of drug release in 10 min. so, SH can be utilized as a superdisintegrant in the formulation of FDTs containing poorly soluble drugs.
Table 9: Disintegration time ANOVA for TMN FDTs
| Source of variation | df | Sum of squares | Mean square | F-value | Result |
| Replicates | 2 | 0.5208 | 0.26041667 | 0.00160281 | P>0.05 |
| Treatments | 7 | 1292565.57 | 18.4652.22 | 1136.498 | P<0.05 |
| A-SH | 1 | 21951.41 | 21951.41 | 135.106 | P<0.05 |
| B-SSG | 1 | 21112.76 | 21112.77 | 129.945 | P<0.05 |
| C-CP | 1 | 19181.76 | 19181.76 | 118.059 | P<0.05 |
| AB | 1 | 22601.34 | 22601.34 | 139.106 | P<0.05 |
| AC | 1 | 20097.09 | 20097.09 | 123.693 | P<0.05 |
| BC | 1 | 19904.64 | 19904.64 | 122.509 | P<0.05 |
| ABC | 1 | 18789.36 | 18769.36 | 115.521 | P<0.05 |
| Pure Error | 14 | 2274.64 | 162.47 | ||
| Cor Total | 23 | 143618.39 |
ANOVA-Analysis of variance, Degree of freedom-df. Sum of a square – SS, Non-significant – P>0.05, Significance – P<0.05
Table 10: Percent drug dissolved in ten minutes ANOVA for TMN FDTs
| Source of variation | df | Sum of squares | Mean square | F-value | Result |
| Replicates | 2 | 0.2471 | 0.1235 | 0.473 | P>0.05 |
| Treatments | 7 | 13832.44 | 1976.06 | 7569.24 | P<0.05 |
| A-SH | 1 | 257.32 | 257.32 | 985.68 | P<0.05 |
| B-SSG | 1 | 149.63 | 149.63 | 573.16 | P<0.05 |
| C-CP | 1 | 240.58 | 240.58 | 921.54 | P<0.05 |
| AB | 1 | 249.40 | 249.40 | 955.31 | P<0.05 |
| AC | 1 | 272.29 | 272.29 | 1043.02 | P<0.05 |
| BC | 1 | 191.87 | 191.87 | 734.96 | P<0.05 |
| ABC | 1 | 175.82 | 175.82 | 673.49 | P<0.05 |
| Pure Error | 14 | 3.6549 | 0.261 | ||
| Cor Total | 23 | 1536.938 |
ANOVA-Analysis of variance, Degree of freedom-df. Sum of a square – S. S, Non-significant – P>0.05, Significance – P<0.05
Table 11: Dissolution efficiency in ten minutes ANOVA for TMN FDTs
| Source of variation | df | Sum of squares | Mean square | F-value | Result |
| Replicates | 2 | 1.0030 | 0.5015 | 6.701 | P>0.05 |
| Treatments | 7 | 11226.50 | 1603.78 | 0.2143 | P<0.05 |
| A-SH | 1 | 275.08 | 275.08 | 0.0367 | P<0.05 |
| B-SSG | 1 | 90.94 | 90.94 | 0.0121 | P<0.05 |
| C-CP | 1 | 181.06 | 181.06 | 0.0241 | P<0.05 |
| AB | 1 | 165.30 | 165.30 | 0.0220 | P<0.05 |
| AC | 1 | 252.11 | 252.11 | 0.0336 | P<0.05 |
| BC | 1 | 161.13 | 161.13 | 0.0215 | P<0.05 |
| ABC | 1 | 121.74 | 121.74 | 0.0162 | P<0.05 |
| Pure Error | 14 | 104764.40 | 7483.17 | ||
| Cor Total | 23 | 1247.38 |
ANOVA-Analysis of variance, Degree of freedom-df. Sum of a square – S. S, Non-significant – P>0.05, Significance – P<0.05
In vivo pharmacokinetic studies
Table 12 provides the summary of pharmacokinetic parameters analysed in male Wistar rats by pure drug formulation and optimized FDTs formulation prepared by employing SH as a novel superdisintegrant. The plasma level of TMN pure drug was found to be lower than the Cmax as well as the absorption rate constant (Ka) for the optimized formulation F2. The optimized FDTs had a Cmax of 178.54±0.37μg/ml and a Ka of 0.173±0.56 h-1, while the pure drug had a Cmax value of 128.38±0.14 μg/ml and a Ka of 0.121±0.32 (h-1) SH based FDTs might increase the rate and extent of TMN absorption because of the rate of disintegration and dissolution associated with the superdisintegrant. A higher Cmax suggests faster availability of the drug in the blood circulation at higher concentrations, potentially leading to better therapeutic efficacy. A greater Ka value shows that SH can speed up the dissolution process and that therefore, the onset of action for the drug is faster. The optimized FDTs had an Area Under Curve (AUC) of 1998.38±0.38 (μg. h/ml) and a Kel of 0.468±0.25 h-1, while the pure drug had an AUC of 1767.65±0.35 (μg. h/ml) and a Kel of 0.1437±0.21 (h-1) The relative bioavailability of the optimized formulation was higher than that of the TMN pure drug (113.09%) indicating an approximately 13% increase in bioavailability compared to the pure drug. These results were in line to Kusuma A et al., their tab showed an AUC of 2748.48±15.4 [28]. The pharmacokinetic profile of the optimized FDTs demonstrates the promise of SH as a highly effective superdisintegrant that can improve the bioavailability of a low-soluble drug TMN. SH facilitates rapid disintegration and dissolution which leads to increased Cmax, Ka, and AUC values as exemplified. SH-based FDTs have these pharmacokinetic advantages where FDTs become a promising alternative for drugs with low solubility or limited bioavailability. In rat models, the improved Relative Bioavailability (RBA) suggests further investigation. Nevertheless, as detailed, human trails require proper extrapolation.
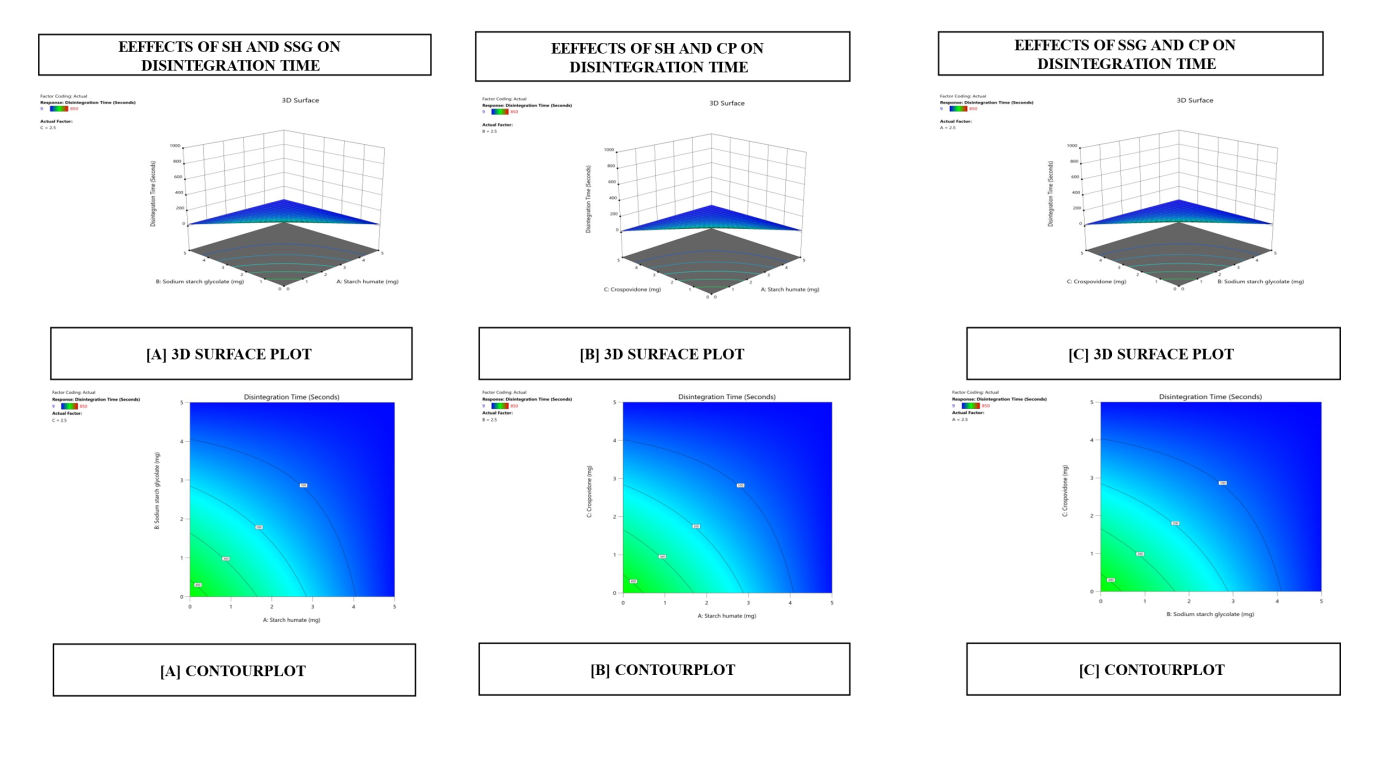
Fig. 16: Images of 3D surface response plots and contour plots displaying the effect ofthe combination of superdisintegration on invitro disintegration time
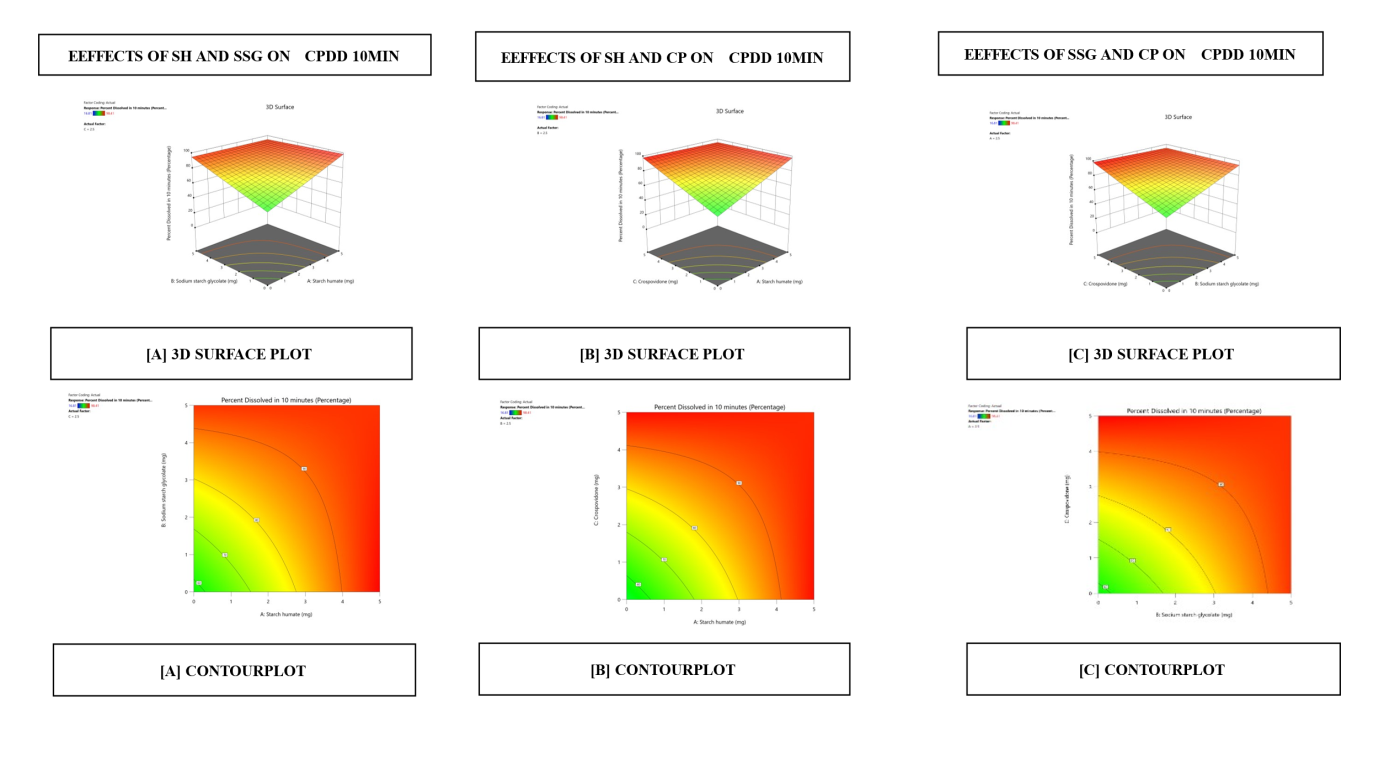
Fig. 17: Images of 3D surface responseplots and contour plots displaying the effect ofthe combination of superdisintegration on CPDD 10 min
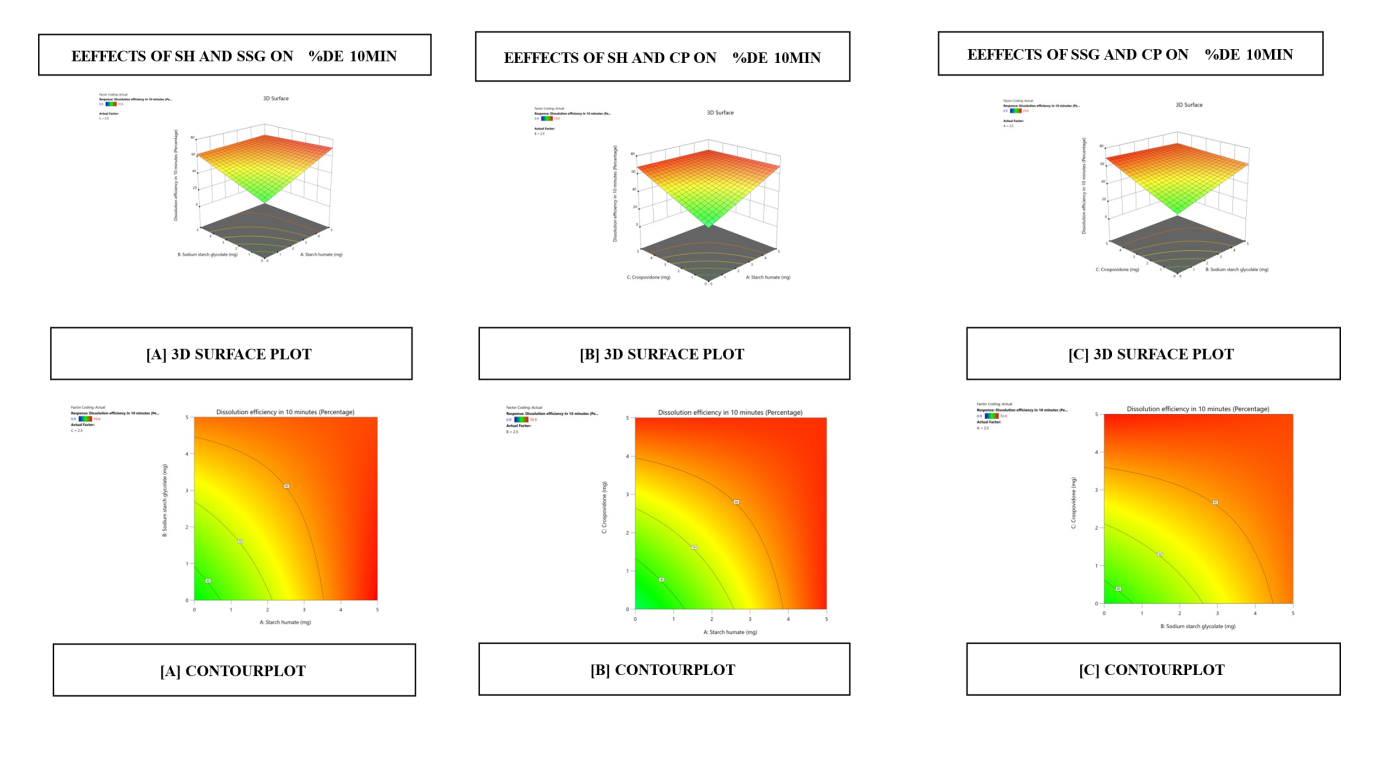
Fig. 18: Images of 3D surface responseplots and contour plots displaying the effect ofthe combination of superdisintegration on %DE 10 min
Table 12: Pharmacokinetic parameters of TMN pure drug, optimized formula F2 Employing SH
| Pharmacokinetic parameter | Pure TMN | Optimized TMNFDTs employing SH |
| Ka (h-1) | 0.121±0.32 | 0.173±0.56 |
| Kel (h-1) | 0.1437±0.21 | 0.468±0.25 |
| AUC0-∞ (ng. h/ml) | 1767.65±0.35 | 1998.38±0.38 |
| Cmax (ng/ml) | 128.38±0.14 | 178.54±0.37 |
| Tmax (h) | 6±0.21 | 1±0.14 |
| RBA (%) | - | 113.09±0.21 |
Data are expressed as mean±SD, n=6
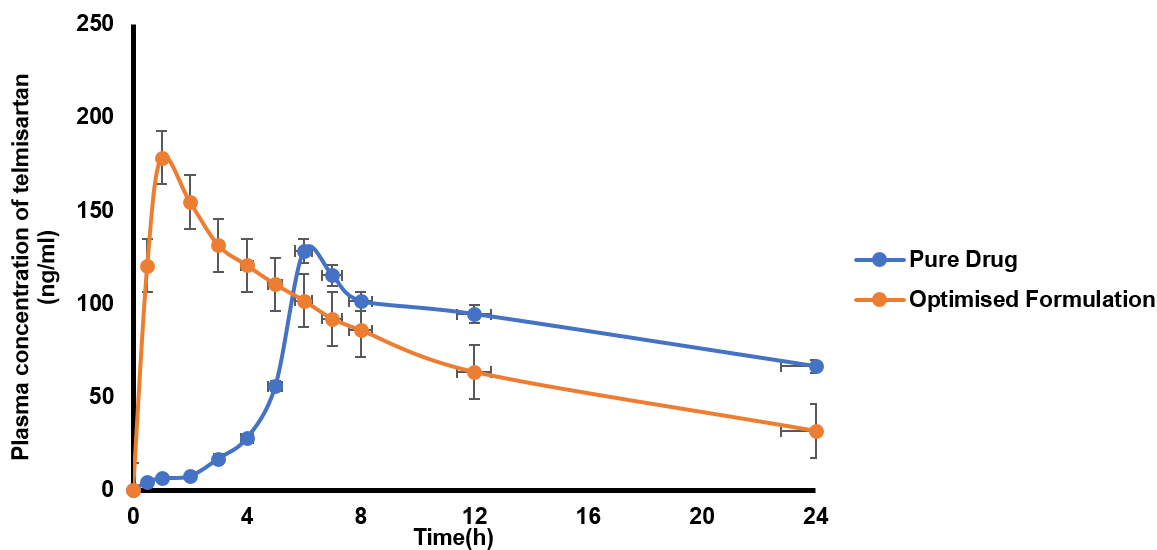
Fig. 19: In vivo pharmacokinetics of optimised formulation vs. pure drug of telmisartan. Error bars indicate the SD values
Stability studies
The final formulation was exposed to accelerated stability conditions as per the ICH stability conditions 40 °C±2 and 75 %±5 RH for 180 d and the formulation was found to be stable. The stability data is provided below: There was No significant difference in any of the CQAs of the drug product till the 180 d study period [32].
Table 13: Accelerated stability studies of F2 formulation
| Retest time for optimized formulation | WT (sec) | DT (Sec) | In vitro drug dissolution profile (%) | Drug content (%) |
| Before Stability (F2) | 21±0.05 | 27±0.06 | 99.73±0.61 | 97.18±0.15 |
| After Stability (F2) | 22±1.21 | 24±0.01 | 98.97±0.76 | 97.89±1.21 |
Data are expressed as mean±SD, n=3
CONCLUSION
In a nutshell, this research successfully formulated fast-dissolving tablets of Telmisartan using innovative approaches, specifically incorporating starch humate as a new superdisintegrant. The fine, crystalline, free-flowing powder known as synthesizing starch humate was developed to possess superdisintegrant properties. Based on the evidence presented, it is possible to infer that QbD is an effective method for optimizing stable TMN-FDTs using SH as a superdisintegrant demonstrated good tablet characteristics, including better dissolution, least DT, stability under accelerated conditions, and relative bioavailability. In vivo, TMN-FDT tablets had much stronger antihypertensive effects than the pure drug formulation, demonstrating its effective formulation. Hence, SH was recommended to be used as a new superdisintegrant to further improve in vitro dissolution, bioavailability, and therapeutic action; thus, quality by design to help, optimization of the new superdisintegrant SH in formulation TMN-FDT with enhanced relative bioavailability.
FUNDING
Nil
AUTHORS CONTRIBUTIONS
Anil Kumar Vadaga-method selection, compilation of data and writing the original draft. Santosh Kumar Rada – Review, compilation of data, editing and supervision.
CONFLICT OF INTERESTS
Declared none
REFERENCES
Zhang Y, Jiang T, Zhang Q, Wang S. Inclusion of telmisartan in mesocellular foam nanoparticles: drug loading and release property. Eur J Pharm Biopharm. 2010;76(1):17-23. doi: 10.1016/j.ejpb.2010.05.010, PMID 20685333.
Park J, Cho W, Cha KH, Ahn J, Han K, Hwang SJ. Solubilization of the poorly water soluble drug telmisartan using supercritical anti solvent (SAS) process. Int J Pharm. 2013 Jan 30;441(1-2):50-5. doi: 10.1016/j.ijpharm.2012.12.020, PMID 23262425.
Anusha K, Rada SK. Oral disintegrating tablets: best approach for faster therapeutic action of poorly soluble drugs. Egypt Pharm J. 2021;20(2):105-14. doi: 10.4103/epj.epj_63_20.
Seager H. Drug delivery products and the zydis fast dissolving dosage form. J Pharm Pharmacol. 1998;50(4):375-82. doi: 10.1111/j.2042-7158.1998.tb06876.x, PMID 9625481.
Makino T, Yamada M, Kikuta JI. Fast dissolving tablet and its production. US Patent; 1998.
Thalluri C, Amin R, Mandhadi JR, Gacem A, Emran TB, Dey BK. Central composite designed fast dissolving tablets for improved solubility of the loaded drug ondansetron hydrochloride. Bio Med Res Int. 2022 Aug 21;2022:2467574. doi: 10.1155/2022/2467574, PMID 36046453.
Vogt FG, Kord AS. Development of quality by design analytical methods. J Pharm Sci. 2011;100(3):797-812. doi: 10.1002/jps.22325, PMID 21280050.
Ismillayli N, Kamali SR, Hadi S, Hermanto D. Synthesis of biodegradable superabsorbent polymers from carboxymethyl cellulose/humic acid. Acta Chim Asiana. 2019;2(2):95-8. doi: 10.29303/aca.v2i2.8.
Song J, MA Z, Niu Y, Huang L, KE R. Humic acid type porous adsorption material and preparation method and application thereof; 2019.
Jamia Hamdard Current Affiliation: Dabur Pharma Ltd. N. D. In: Humic substances in drug development Dr. Rajesh Khanna M. Pharm. Sahibabad, Ghaziabad. India: UP; 2009.
Bangar SP, Balakrishnan G, Navaf M, Sunooj KV. Recent advancements on barnyard millet starch: a sustainable alternative to conventional starch. Starch Starke. 2024;76(9-10)2300232. doi: 10.1002/star.202300232.
Wang FC, Chung DS, Seib PA, Kim YS. Optimum steeping process for wet milling of sorghum. Cereal Chem. 2000;77(4):478-83. doi: 10.1094/CCHEM.2000.77.4.478.
Kumar MU, Babu MK. Design and evaluation of fast dissolving tablets containing diclofenac sodium using fenugreek gum as a natural superdisintegrant. Asian Pac J Trop Biomed. 2014;4 Suppl 1:S329-34. doi: 10.12980/APJTB.4.2014B672, PMID 25183106.
Patel DM, Patel SP, Patel CN. Formulation and evaluation of fast dissolving tablet containing domperidone ternary solid dispersion. Int J Pharm Investig. 2014;4(4):174-82. doi: 10.4103/2230-973X.143116, PMID 25426438.
Jain SK, Shukla M, Shrivastava V. Development and in vitro evaluation of ibuprofen mouth dissolving tablets using solid dispersion technique. Chem Pharm Bull (Tokyo). 2010 Aug;58(8):1037-42. doi: 10.1248/cpb.58.1037, PMID 20686256.
Mohan A, Gundamaraju R. In vitro and in vivo evaluation of fast dissolving tablets containing solid dispersion of lamotrigine. Int J Pharm Investig. 2015 Jan-Mar;5(1):57-64. doi: 10.4103/2230-973X.147235, PMID 25599034, PMCID PMC4286836.
Shirsand SB, Suresh S, Swamy PV. Formulation design and optimization of fast dissolving clonazepam tablets. Indian J Pharm Sci. 2009;71(5):567-72. doi: 10.4103/0250-474X.58189, PMID 20502581.
Koteswari P, Sunium S, Srinivasababu P, Babu GK, Nithya PD. Formulation development and evaluation of fast disintegrating tablets of lamotrigine using liquid solid technique. Int J Pharm Investig. 2014;4(4):207-14. doi: 10.4103/2230-973X.143125, PMID 25426442.
Basu B, Bagadiya A, Makwana S, Vipul V, Batt D, Dharamsi A. Formulation and evaluation of fast dissolving tablets of cinnarizine using superdisintegrant blends and subliming material. J Adv Pharm Technol Res. 2011 Oct;2(4):266-73. doi: 10.4103/2231-4040.90885, PMID 22247895, PMCID PMC3255354.
Shirsand SB, Suresh S, Swamy PV, Para MS, Nagendra Kumar D. Formulation design of fast disintegrating tablets using disintegrant blends. Indian J Pharm Sci. 2010;72(1):130-3. doi: 10.4103/0250-474X.62244, PMID 20582206.
Eisa AM, El Megrab NA, El Nahas HM. Formulation and evaluation of fast dissolving tablets of haloperidol solid dispersion. Saudi Pharm J. 2022;30(11):1589-602. doi: 10.1016/j.jsps.2022.09.002, PMID 36465849.
Gonzalez Gonzalez O, Ramirez IO, Ramirez BI, O Connell P, Ballesteros MP, Torrado JJ. Drug stability: ICH versus accelerated predictive stability studies. Pharmaceutics. 2022;14(11):2324. doi: 10.3390/pharmaceutics14112324, PMID 36365143.
Al Japairai KA, Alkhalidi HM, Mahmood S, Almurisi SH, Doolaanea AA, Al Sindi TA. Lyophilized amorphous dispersion of telmisartan in a combined carrier alkalizer system: formulation development and in vivo study. ACS Omega. 2020;5(50):32466-80. doi: 10.1021/acsomega.0c04588, PMID 33376884.
Sahithi M, Santosh Kumar R. Optimization of statistically designed aceclofenac fast dissolving tablets employing starch glutamate as a novel superdisintegrant. Int J Appl Pharm. 2020;12(1):77-88. doi: 10.22159/ijap.2020v12i1.34987.
Kumari A, Kumar RS. Synthesis and characterization of starch malonate: development of fast dissolving tablets of aceclofenac by 23 factorial designs. Int J App Pharm. 2021;13(3):87-102. doi: 10.22159/ijap.2021v13i3.40538.
Devi MG, Santosh KR. Quality by design supported construction of oral fast dissolving films for telmisartan: reconnoitering the quality attributes. Int J Appl Pharm. 2024;16(2):285-98. doi: 10.22159/ijap.2024v16i2.50094.
Prakash Rao AH, Rada SK, Kandukuri S. Optimization of starch crotonate as a novel superdisintegrant in the formulation of fast dissolving tablets through 23 factorial design. Int J App Pharm. 2021;13(4):247-56. doi: 10.22159/ijap.2021v13i4.41335.
Sahithi M, Santosh Kumar R. Optimization of statistically designed aceclofenac fast dissolving tablets employing starch glutamate as a novel superdisintegrant. Int J Appl Pharm. 2020;12(1):77-88.
Sahithi M, Santosh Kumar R. Optimization of statistically designed aceclofenac fast dissolving tablets employing starch glutamate as a novel superdisintegrant. Int J Appl Pharm. 2020;12(1):77-88.
Preethi GB, Banerjee S, Shivakumar HN, Ravi Kumar M. Formulation of fast dissolving tablets of doxazosin mesylate drug by direct compression method. Int J App Pharm. 2017;9(5):22. doi: 10.22159/ijap.2017v9i5.18168.
Parfati N, Rani KC, Charles N, Geovany V. Preparation and evaluation of atenolol-β-cyclodextrin orally disintegrating tablets using co-process crospovidone sodium starch glycolate. Int J App Pharm. 2018;10(5):190. doi: 10.22159/ijap.2018v10i5.27982.
Acute and sub acute toxicity studies of starch hyaluronate in wistar rats. Trop J Nat Prod Res. 2023;7(5):2965-8. doi: 10.26538/tjnpr/v7i5.19.
Swarnalatha N, Maravajhala V. Formulation in vitro and in vivo evaluation of taste masked oral disintegrating tablets of fexofenadine hydrochloride using semisynthetic and naturalsuperdisintegrants. Int J App Pharm. 2021;13(5):99-108. doi: 10.22159/ijap.2021v13i5.41558.
Malkawi R, Al Olimat S, Tawalbeh J. Unlocking the potential: enhancing solubility and bioavailability of acyclovir through solid dispersion formulations. Int J App Pharm. 2024;16(5):111-8. doi: 10.22159/ijap.2024v16i5.51313.
Dash GS, Murthy PN, Chowdary KA. Selection and optimization of most efficient superdisintegrant for the formulation of dispersible tablets of tramadol hydrochloride. Int J Pharm Pharm Sci. 2022;14(7):21-6. doi: 10.22159/ijpps.2022v14i7.43638.
Farooqui P, Gude R. Formulation development and optimisation of fast dissolving buccal films loaded glimepiride solid dispersion with enhanced dissolution profile using central composite design. Int J Pharm Pharm Sci. 2023;15(6):35-54. doi: 10.22159/ijpps.2023v15i6.47992.
Das S, Biswas P, Dutta C, Biswas DS. Fabrication and release kinetics of piperazine citrate tablets using natural gum. Asian J Pharm Clin Res. 2023;16(6):103-7. doi: 10.22159/ajpcr.2023.v16i6.47323.
Yadav. Formulation and analytical evaluation of fast dissolving tablets of zidovudine somdutt yadav1. Int J Curr Pharm Rev Res. 2024;16(8):1-12.