
Int J App Pharm, Vol 17, Issue 2, 2025, 142-152Original Article
QBD-DRIVEN STABILITY INDICATING RP-HPLC METHOD DEVELOPMENT AND VALIDATION FOR THE ESTIMATION OF NINTEDANIB ESYLATE
SANJAY DINKAR SAWANT, JYOTI BHAGWAN TANGDE*
Department of Pharmaceutical Chemistry, Sinhgad Technical Education Society’s, Smt. Kashibai Navale College of Pharmacy, Pune, Maharashtra, India
*Corresponding author: Jyoti Bhagwan Tangde; *Email: jyotitangde@gmail.com
Received: 05 Nov 2024, Revised and Accepted: 16 Dec 2024
ABSTRACT
Objective: The present research work focuses on evaluation of Nintedanib esylate (NTB) with development and validation of Reverse Phase High-Performance Liquid Chromatography (RP-HPLC) method pertaining to quality by design-based force degradation study.
Methods: A two-level, two-factorial design has been used with predetermined design specifications using design expert software. The RP-HPLC method was developed with isocratic mode using a C-18 column at a 392 nm detection wavelength.
Results: The calibration curve was found to be linear with R² = 0.9996. Retention Time (RT) was obtained at 6.14; Limit of Detection (LOD) and Limit of Quantitation (LOQ) were found to be 1.4121 μg/ml and 4.2790 μg/ml, respectively. Relative Standard Deviation (RSD) for intraday precision was 1.799% and for interday precision 1.563%, respectively. Degradation studies found out the drug is susceptible to acidic, oxidative, and photolytic conditions, while the drug was found to be stable in thermal and alkaline conditions.
Conclusion: The resulting method holds potential for application in routine analysis of nintedanib esylate in capsule formulation in compliance with International Council for Harmonization (ICH) guidelines.
Keywords: Degradation, Design expert, Factorial design, ICH guidelines, Nintedanib esylate
© 2025 The Authors. Published by Innovare Academic Sciences Pvt Ltd. This is an open access article under the CC BY license (https://creativecommons.org/licenses/by/4.0/)
DOI: https://dx.doi.org/10.22159/ijap.2025v17i2.53110 Journal homepage: https://innovareacademics.in/journals/index.php/ijap
INTRODUCTION
Nintedanib (NTB) is chemically ethane sulfonic acid; methyl (3Z)-3-[({4-[N-methyl-2-(4-methylpiperazin-1-yl) acetamido] phenyl} amino) (phenyl) methylidene]-2-oxo-2, 3-dihydro-1H-indole-6 [1]. NTB is an oxindole derivative having methyl ester, which undergoes ester hydrolysis in vivo [2]. It is a BCS-II drug with poor solubility and high permeability [3], commonly used in the treatment of pulmonary fibrosis and Non-Small Cell Lung Cancer (NSCLC) [4]. NTB is a tyrosine kinase inhibitor and acts by inhibiting platelet-derived growth factor receptors, fibroblasts, and vascular growth factors, also interferes with cell proliferation and cell differentiation [5]. This drug was first approved by the US FDA in october 2014 for the treatment of Idiopathic Pulmonary Fibrosis (IPF). It has been found to improve the patient's quality of life by slowing down the forced vital capacity [6]. The National Institute for Health and Care Excellence (NICE) endorses nintedanib in IPF, where the forced vital capacity anticipates 50-80%. However, data conducted from Asia in 2023 indicates 50% of people stop taking NTB in IPF within 12 mo because of its adverse effects [7].
Quality by Design (QbD) is a systematic approach that begins with a predetermined design specification and emphasizes the product and process understanding with quality risk management [8]. Over the last decades, the QbD approach has been involved in pharmaceuticals with the issuing of ICH Q8 (R2) guidelines. ICH Q8 (R2) guidelines state the implementation of structured and organized methods for the determination of factors affecting the process. It is also known as Design of Experiments [9, 10]. The Analytical Quality by Design (AQbD), according to ICH Q14 highlights the summary of performance characteristics for intended purposes. AQbD ensures the robustness and cost-effectiveness of the method, which is applicable throughout the product lifecycle [11, 12]. The current study utilizes the QbD approach with a 2-level, 2-factorial design for RP-HPLC method development and for stability studies of nintedanib esylate using design expert software.
The analytical methods reported for NTB to date include the RP-HPLC method [13, 14], HPLC stability-indicating method [15], QbD-based impurity studies by LC-MS [16], stability-indicating RP-HPLC method [17], Ultra High Performance Liquid Chromatography coupled Mass Spectrometry (UHPLC-MS/MS) [18], stability study by RP-HPLC [19], HPLC-UV in rat plasma [20], RP-HPLC in rat plasma [21], and High-Performance Thin Layer Chromatography coupled Mass Spectrometry (HPTLC MS-MS) [22, 23]. Literature survey reveals that only two stability studies have been reported so far. Out of which, Pasquini et al. have performed QbD-based simultaneous estimation of nintedanib and related impurity profiling. While Purnachand et al. have performed a simple stability study for nintedanib. None of these methods focuses on the implementation of QbD analysis for stability parameters. Therefore, a new RP-HPLC method with a forced degradation study based on a two-level, two-factorial quality-by-design approach for the evaluation of NTB has been attempted.
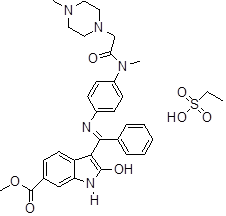
Fig. 1: Structure of NTB esylate
MATERIALS AND METHODS
Materials
NTB (purity 99.96%), a yellow, crystalline solid powder, was obtained as a gift sample from Chemsar Research Centre, Pune, India. Nintedanib (Ofev) 100 mg as a capsule dosage form manufactured by Boehringer Ingelheim Ltd. was purchased from a retail pharmacy in Pune. Methanol, acetonitrile, and ethanol of HPLC grade were procured from Merck Life Sciences, Mumbai. Ammonium formate buffer and triethylamine analytical grade were obtained from Research Fine Chemical Industries, Mumbai.
Instrumentation and chromatographic conditions
The C18 analytical column, waters XBridge, (4.6×250 mm id with particle size 5 µm), UV detection at 392 nm, 20 µl** injection volume, 1.00 ml/min flow rate, and ambient temperature for 10 min run time.
Methods
Recognition of quality target product profile (QTPP)
NTB capsule dosage form was recognized as QTPP, based on literature surveys and previous studies. From QTPP elements, CQA elements were decided [24].
Critical quality attributes (CQA) Retention time, tailing factor, and theoretical plates were chosen as CQA [25].
Experimental design: (22 full factorial design)
Two-level, two-factorial designs were employed using design expert software. Independent variables were selected as the composition of the mobile phase and the pH of the buffer. The mobile phase consists of (acetonitrile: ammonium formate buffer) ranging from 70-90% v/v. Likewise, the range of pH for the aqueous phase was selected from 4 to 6 and the flow rate was constant at 1 ml/min. The dependent variables were selected as retention time (X), theoretical plates (Y), and peak asymmetry (z). Software gave 4 runs for the experiment. After completion of the above trials, optimization was performed based on desirability value. Desirability is an objective function that ranges from zero limits to one. The numerical optimization was used to find the maximum desired function. The desirability value is completely dependent on how closely the lower and upper limits are set relative to the actual optimum. Calculation and data analysis was executed by design expert software, 8.0.6 Stat-Ease Inc [26, 27].
Risk assessment
The ishikawa diagram (fish-bone) diagram was examined to identify the possible risk factor which affects retention time, resolution, and sensitivity of method [25].
Preparation of phosphate buffer
The 0.6306 g of ammonium formate buffer was added in sufficient water to produce 1000 ml; it was sonicated, and pH 6 was adjusted using triethylamine.
Preparation of stock solutions
The 10 mg of NTB was added in 10 ml of methanol to get a 1000 µg/ml concentration. From this 0.1 ml solution was further diluted to make 10 ml using methanol to get 10 µg/ml of NTB esylate.
Detection wavelength
From the standard stock solution further dilutions were performed using methanol and scanned over the range of 200-400 nm. Drug showed considerable absorbance at 392 nm.
Chromatographic procedure
Chromatographic separations were accomplish using C18 analytical column, HPLC system with Waters X-Bridge (4.6× 250 mm id. 5µm particle size), isocratic mode having 20 µl** injection volume, 1.00 ml min-1 Flow rate, Run time 10 min.
Preliminary analysis of drug
The colour of NTB was compared with reported characters mentioned in the drug bank. Melting point was found to be 244 °C. NTB was found to be soluble in water, methanol, acetonitrile, and dimethyl sulfoxide.
RESULTS AND DISCUSSION
Trials given by design expert software
A total of 4 runs suggested by the software with a 2-level (low to high) 2-factorial design was employed. Having a mobile phase, acetonitrile: ammonium formate buffer (70:30, 90:10 at pH 6 and 90.10: 70.30 at pH 6).
Optimized trials based on desirability function suggested by software
The optimized trials based on desirability value for individual response shown in table 1.
Table 1: Optimized trials suggested by software based on desirability value
| S. No. | Amount of ACN: buffer (ml) | Buffer pH | Flow rate (ml/min) | RT (Min) |
Tailing factor | Theoretical plates | Desirability |
| 1. | 70:30 | 6 | 1 | 6.140 | 1.134 | 10877 | 0.976 |
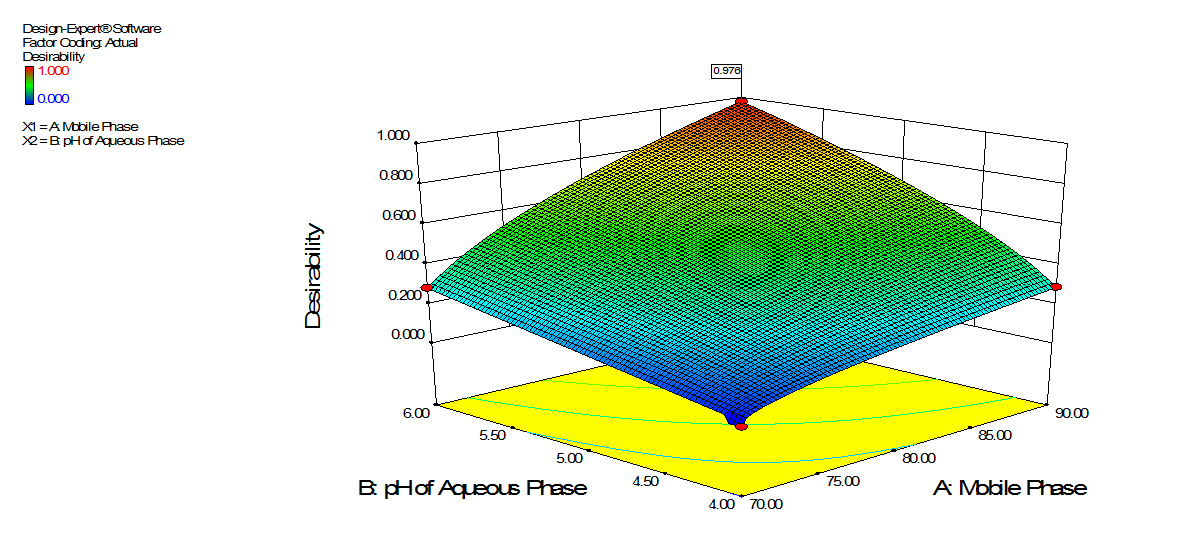
Fig. 2: Optimized plot for desirability
Table 2: Runs and their results (optimized mobile phase)
| S. No. | Mobile phase (Acetonitrile: Amm. formate buffer) | Buffer pH | RT (min) | Asymmetric factor | Theoretical plates |
| 1. | 70.30 | 6.00 | 6.14 | 1.134 | 10877 |
| 2. | 90.10 | 6.00 | 4.62 | 1.235 | 4624 |
| 3. | 90.10 | 4.00 | 4.72 | 1.862 | 7893 |
| 4. | 70.30 | 4.00 | 6.3 | 1.998 | 9844 |
Optimized chromatographic conditions
Mobile phase: Acetonitrile: Ammonium formate buffer (70:30 v/v) at RT 6.140, theoretical plates: 10877, and tailing factor: 1.134, pH 6. The C18 analytical column, 20 µl** injection volume, 1.00 ml/min flow rate, and ambient temperature for a 10 min run time.
Effect of independent variables
After applying experimental design, suggested Response Surface Linear Model was found to be significant; model terms are given in table 3.
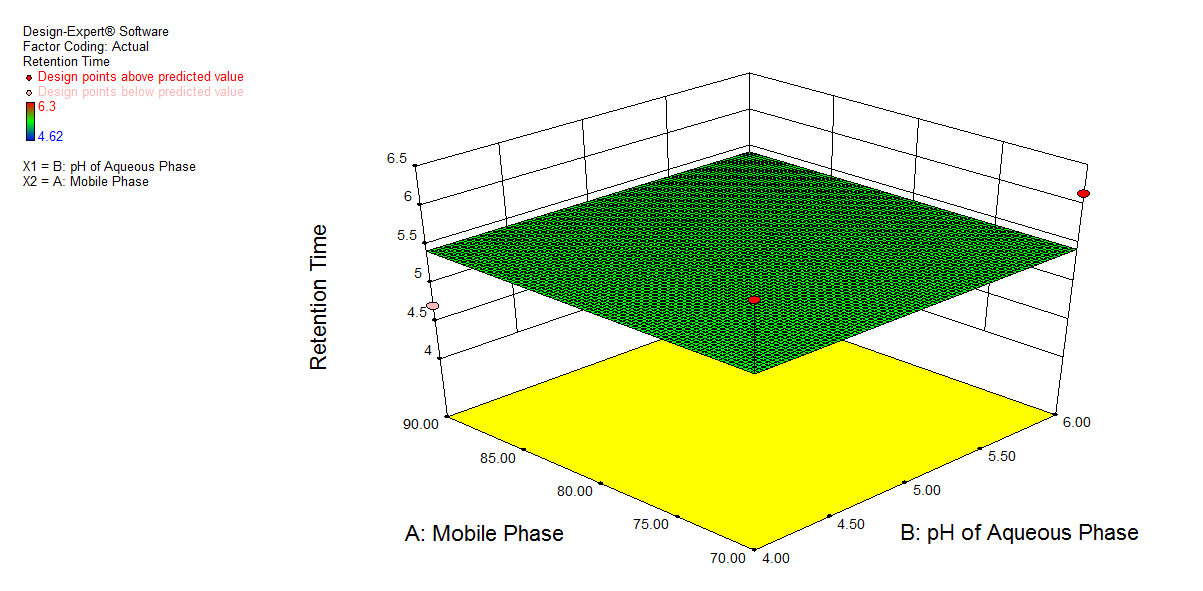
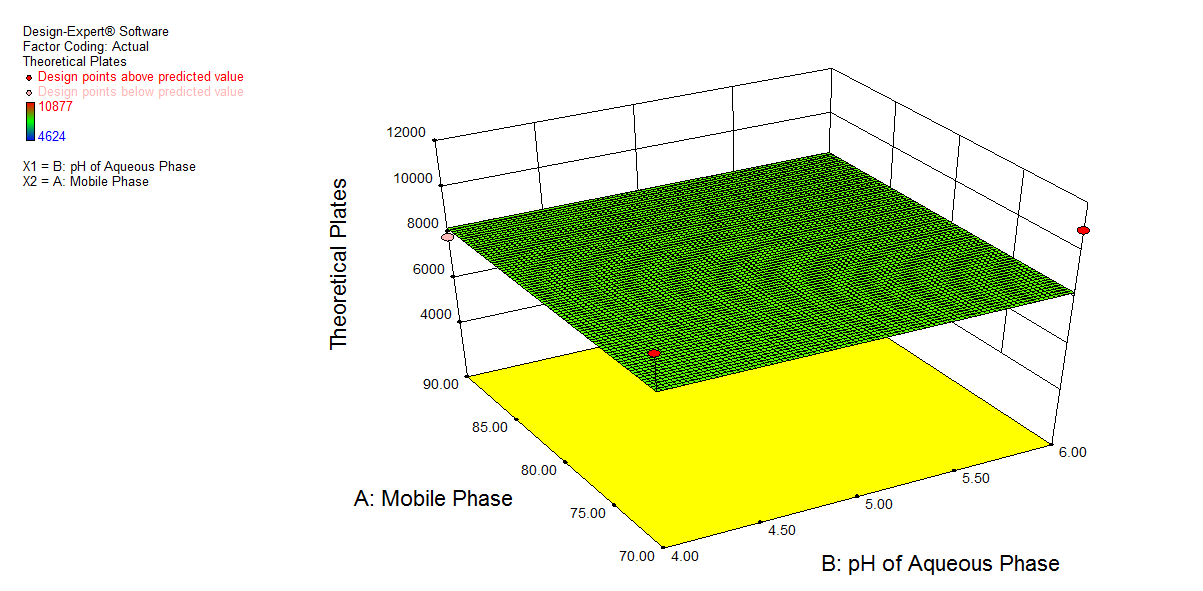
Fig. 3. Shows a graphical representation of the amount of acetonitrile (A), the pH of the buffer (B), and the flow rate (C), which is constant at 1 ml min-1. Graph 3 a) shows a change in pH of buffer showed a slight change in retention time (X), and an increase in the amount of acetonitrile showed a decrease in retention time. 3b) shows a decrease in pH of buffer had a synergistic effect on response (Y), while an increase in the amount of acetonitrile showed a decrease in the asymmetric factor. Graph 3c) shows that a decrease in pH of buffer shows an increase in the number of theoretical plates, and an increase in the amount of acetonitrile shows an increase in response (Z).
a)
b)
c)
Fig. 3: 3D plot for effect of A: Mobile phase composition and B: pH of buffer on a) Retention time, b) Asymmetric factor and c) Theoretical plates
Table 3: Summary of dependent variable with model terms and equation
| S. No. | Dependant variable | Model equation | P value | R2value |
| 1. | Retention Time (X) | +5.445 | 0.005 | 0.90 |
| 2. | Asymmetric Factor (Y) | +1.5572 | 0.005 | 0.77 |
| 3. | Theoretical Plates (Z) | +8309.50 | 0.005 | 0.79 |
Analytical method development
Chromatographic conditions were optimized using a two-level, two-factorial design. The method Sensitivity, solubility, cost of solvents, and method applicability were also considered while selecting media and sample preparation. Peak area and RT of NTB with medium at the specified wavelength were compared with reference standards.
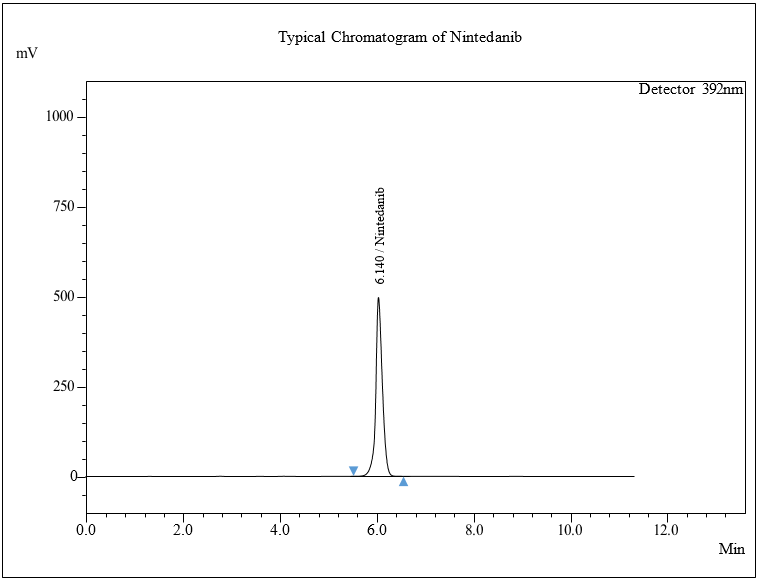
Fig. 4: A typical spectrum for NTB
The optimized chromatogram shows a retention time of 6.140 min, as shown in fig. 4, without decomposition during the analysis. HPLC method validation was performed with the following specifications given in table 4.
Table 4: System suitability parameters
| S. No. | Parameter’s | Observations |
| 1. | Retention time (RT) | 6.140 (min) |
| 2. | Peak area | 125642 |
| 3. | Theoretical plate | 10877 |
Analytical method validation
Calibration study (Linearity)
For performing the linearity study, NTB stock solution was prepared by adding 10 mg of NTB in 10 ml of methanol, and further dilutions were performed using the mobile phase. The final solution was sonicated for 5 min, with linearity from 10 to 60 µg/ml. The calibration curve was plotted and found to be linear with R² = 0.9996. Details are in table 5 [28].
Selectivity
To perform selectivity, NTB formulation (Ofev) 100 mg was used. About 10 capsules of NTB formulation 12.04 mg (10 mg) with excipients were transferred in a volumetric flask to make up 10 ml volume using methanol. Retention time and peak parameters were compared with the NTB. A chromatogram was recorded at RT of 6.141 min, area 527322, asymmetric factor 1.134, and theoretical plates were found to be 8307. Results concluded that formulation excipients do not interfere in the separation of drugs using the mobile phase [29].
Table 5: Result of linearity
| S. No. | Concentration (µg) | Peak area | Peak properties | Retention time | Asymmetric factor | Theoretical plates |
| 1 | 10 | 527322 | 6.140 | 1.136 | 10532 | |
| 2 | 20 | 1054644 | 6.142 | 1.134 | 10511 | |
| 3 | 30 | 1531966 | 6.141 | 1.136 | 10628 | |
| 4 | 40 | 2109288 | 6.140 | 1.135 | 10022 | |
| 5 | 50 | 2636610 | 6.141 | 1.134 | 10100 | |
| 6 | 60 | 3163932 | 6.140 | 1.134 | 10996 | |
| Slope | 52875.06 | Six replicates | ||||
| Standard error | 22625.31 |
(n=6, n-number of observations)
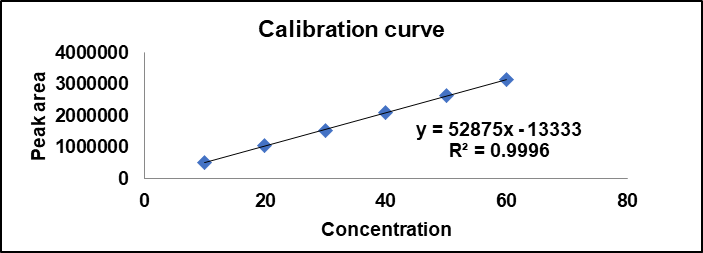
Fig. 5: Calibration curve of NTB
Sensitivity
The method’s sensitivity was determined by calculating LOD and LOQ, which were found to be 1.4121 μg/ml and 4.2790 μg/ml, respectively.
Accuracy
Accuracy was performed at 3 different levels, i. e., 80, 100, and 120%. It was carried out by preparing 3 solutions of 32, 40, and 48 μg/ml concentrations. Results showed recoveries of NTB ranges from 99.96 to 100.18%, shown below in table 6.
Precision
The precision was performed using six replicates of 40 µg/ml solution. RSD was found as 1.9559% and 1.865% for intraday and interday precision. Results of precision comply with the ICH guideline. The details are shown in table 7.
Specificity
Chromatogram of NTB in capsule formulation, Ofev (having label claim 500 mg) results showed peak with RT at 6.14 min. Resolution of the drug was very efficient, and detection of wavelength was carried out at 392 nm. The peak characteristics of the formulation were collated with the standard; results show an adequately resolved peak without the interference of the excipient.
Repeatability
System precision was performed with six repeated injections of nintedanib standard solution, and the % RSD of the replicates was calculated. Results are given in table 8 [30].
Table 6: Accuracy results of NTB
| S. No. | Concentration μg/ml | Peak area (mAU*min) | Found concentration μg/ml | % Recovery |
| 1. | 32 | 1713034.4 | 31.99 | 99.96 |
| 2. | 40 | 2141293 | 39.99 | 99.98 |
| 3. | 48 | 1284775.8 | 48.09 | 100.18 |
(n=3, n-number of observations)
Table 7: Precision study result for nintedanib by RP-HPLC
| S. No. | Concentration in μg/ml | Intraday | Interday |
| 1 | 40 | 2022764 | 2022127 |
| 2 | 40 | 2058789 | 2063037 |
| 3 | 40 | 2085402 | 2048450 |
| 4 | 40 | 2004769 | 2028080 |
| 5 | 40 | 2102524 | 2108990 |
| 6 | 40 | 2045975 | 2074711 |
| Average | 2053370 | 2057565.8 | |
| Standard deviation | 36945 | 32176.8 | |
| % RSD | 1.799 | 1.563 |
(n = 6, ±n-number of observations, % RSD-percentage relative standard deviation, the results are shown as mean±SD 0.80)
Table 8: Repeatability results of NTB
| S. No. | Concentrations μg/ml | Peak area (mAU*min) |
| 1. | 40 | 2114506 |
| 2. | 40 | 2094506 |
| 3. | 40 | 2114519 |
| 4. | 40 | 2107632 |
| 5. | 40 | 2164506 |
| 6. | 40 | 2112294 |
| Average | 2117993.8 | |
| Standard deviation | 21905.7 | |
| %RSD | 1.034 |
(n=6, n-number of observations, % RSD-percentage relative standard deviation, the results are shown as mean±SD 0.99)
Robustness
A robustness study was performed with deliberate changes in experimental conditions at 3 different levels. The chromatogram was evaluated with variation of mobile phase composition, flow rate, wavelength, and pH. No change in RT of the chromatogram (10 μg/ml) solution indicates the method is robust, and the results are given in table 9.
Table 9: Robustness result
| S. No. | Parameters | Responses | Parameters | Responses |
| Acetonitrile: Buffer (V/V) | RT (min) | Wavelength (nm) | Peak area (mAU*min) | |
| 1. | 69 | 31 | 6.043 | 389 |
| 2. | 70 | 30 | 6.14 | 391 |
| 3. | 71 | 29 | 6.239 | 393 |
| Average | 6.141 | Average | ||
| SD | 0.080 | SD | ||
| RSD | 1.303 | RSD | ||
| Flow Rate (ml/min) | RT (min) | Buffer pH | ||
| 1. | 0.9 | 6.271 | 5.8 | |
| 2. | 1 | 6.14 | 6 | |
| 3. | 1.1 | 6.026 | 6.2 | |
| Average | 6.146 | Average | ||
| SD | 0.1001 | SD | ||
| RSD | 1.629 | RSD |
(n=3, n-number of observations, % RSD-percentage relative standard deviation, the results are shown as mean±SD 0.50)
Stress degradation studies
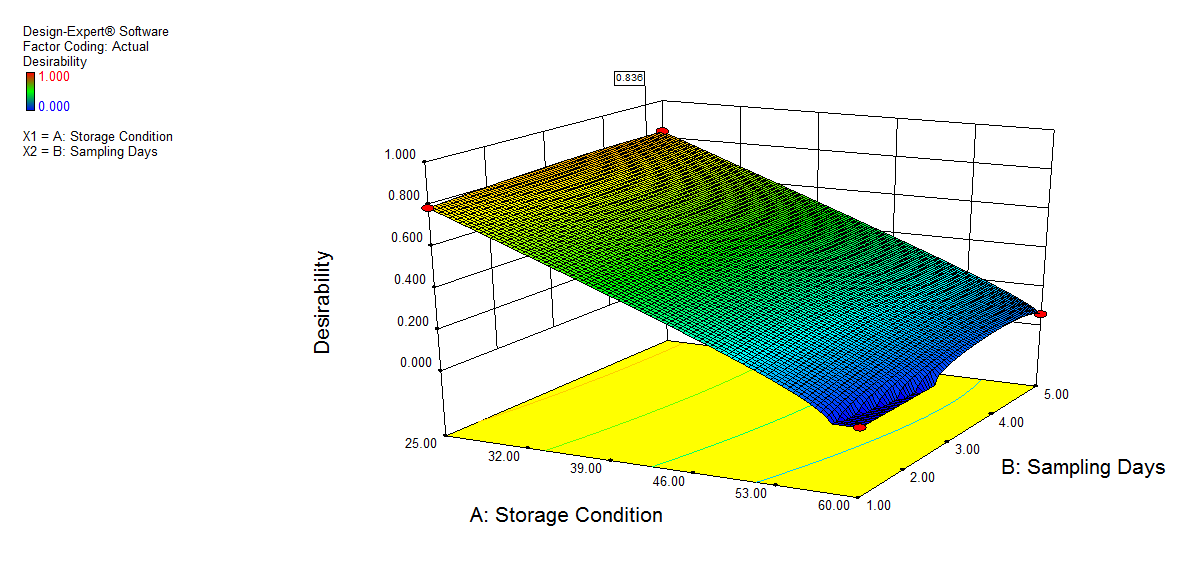
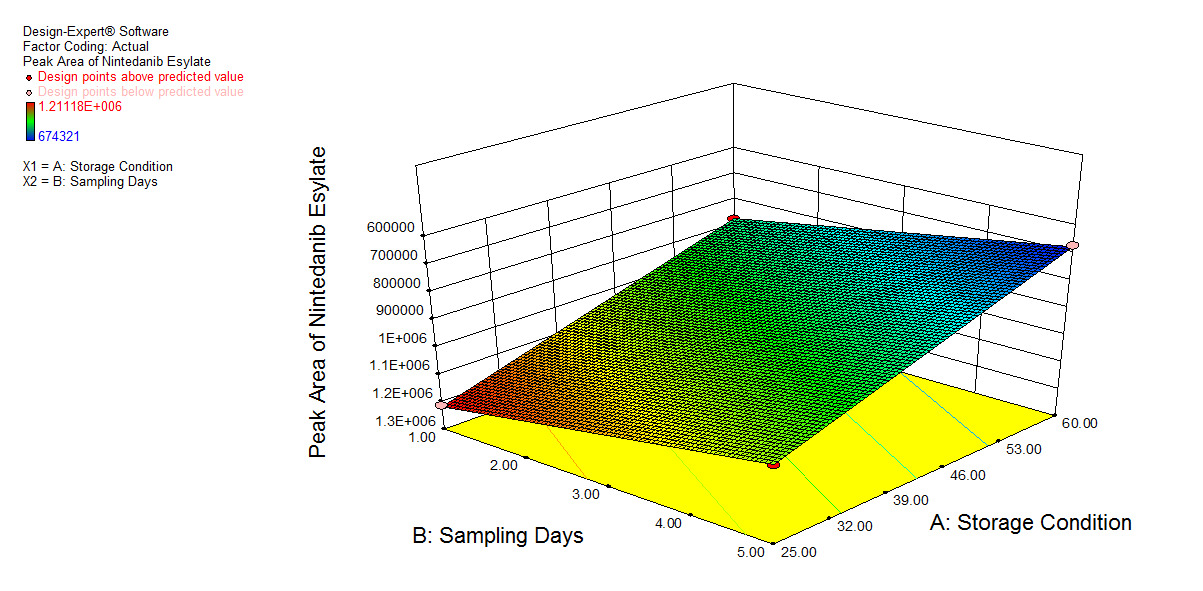
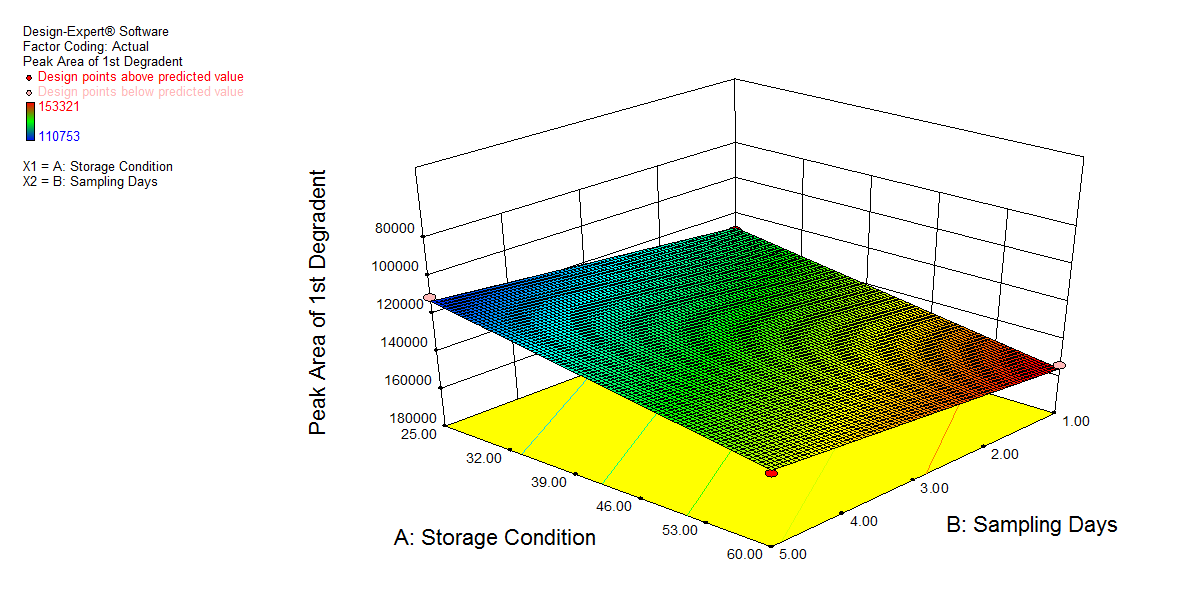
We also conducted stress degradation studies using the AQbD approach. Dependent variables were selected as retention time and peak area, while independent variables were selected as storage conditions and sampling days. The 3D plots for desirability and the effect of independent variables are shown in fig. 6 and 7.
Acid hydrolysis
According to conditions suggested by the software shown in table 10, to perform acid hydrolysis, approximately 1 ml of stock of NTB was prepared, followed by the addition of 1 ml of 1 N HCl, then refluxed for 30 min at 40 °C/60 °C for 1 to 5 sampling days. A 50 μg/ml solution was prepared from the above solution, and a 0.30 μl solution was injected into the HPLC system to record the chromatograms for the sample stability study.
Results of hydrolysis by 1 N HCl at 40 °C and 60 °C
The percentage degradation of NTB for day 1 at 40 °C was found to be 3.7% and at 60 °C, 4.32%. For day 5 at 40 °C, 5.95%; at 60 °C, degradation was found to be 7.11% in an acidic condition, which is within acceptable criteria (NMT 10%). The extra peaks were eluted at retention times of 5.112 min, and the chromatogram is shown in fig. 8a.
Alkali degradation
Approximately 1 ml of NTB stock solution was added, along with 1 ml of 1 N NaOH, and the mixture was refluxed for 30 min. at 60 °C. A 50 μg/ml solution was prepared, and 0.30 μl was injected into the HPLC system, and chromatograms were recorded. According to the conditions and trials suggested by software with the correct desirability function for alkali degradation, studies of hydrolysis by 1 N NaOH at 40 °C and 60 °C show no degradation as the drug is basic in nature. No extra peak was observed in the chromatogram, as shown in fig. 8b.
Peroxide degradation
In 1 ml of NTB stock solution, 1 ml of 20% hydrogen peroxide (H2O2) was added at 25 °C to 60 °C for 30 min for days 1 to 5. The resulting solution was diluted to create 50 μg/ml; 0.30 μl was injected in HPLC, and chromatograms were recorded to study sample stability. Software given condition shown in table 11.
Results of oxidation studies by 20 % H2O2 at 25 °C and 60 °C
The % degradation of NTB for day 1 at 25 °C was found to be 54.063% and at 60 °C 66.84%. For day 5 at 25 °C, 61.15%, and at 60 °C, 74.42% in the oxidative condition. The extra peaks were eluted at 2.56 and 12.32 in the given run time. Chromatogram shown in fig. 8c.
Table 10: Software-given conditions for acid degradation studies
| S. No. | Storage condition temp in C |
Sampling time (Days) | RT of NTB (min) |
Peak area of NTB (mAU*min) |
RT of DP1 (min) |
Peak area of DP1(mAU*min) | % Degradation |
| 1. | 60.00 | 1.00 | 6.140 | 2522708 | 5.112 | 113902 | 4.32% |
| 2. | 40.00 | 5.00 | 6.141 | 2479732 | 5.112 | 156878 | 5.95% |
| 3. | 60.00 | 5.00 | 6.140 | 2449147 | 5.111 | 187463 | 7.11% |
| 4. | 40.00 | 1.00 | 6.140 | 2539055 | 5.112 | 97554.60 | 3.7% |
| Standard peak area of NTB 50ug/ml: 2636610 |
Table 11: Software given condition for peroxide degradation studies
| S. No. | Storage condition temp in C |
Sampling in time (days) |
RT of NTB (min) | Peak area of NTB (mAU*min) | RT of DP1 (min) | Peak area of DP1 (mAU*min) |
RT of DP2 (min) | Peak area of DP2 (mAU*min) |
% Degradation |
| 1 | 60.00 | 1.00 | 6.140 | 874163 | 2.564 | 153321 | 12.321 | 122189 | 66.845 |
| 2 | 25.00 | 5.00 | 6.140 | 1024171 | 2.563 | 110753 | 12.321 | 101241 | 61.156 |
| 3 | 60.00 | 5.00 | 6.140 | 674321 | 2.564 | 142198 | 12.321 | 121411 | 74.425 |
| 4 | 25.00 | 1.00 | 6.140 | 1211178 | 2.563 | 128908 | 12.321 | 106843 | 54.063 |
| Standard peak area of NTB: 50 ug/ml: 2636610 |
Thermal degradation studies
The standard sample of NTB was kept in an oven at 30 °C to 105 °C for 6 h to investigate dry heat degradation from days 1 to 5. HPLC analysis was carried out by diluting the resulting solution to a 50 μg/ml solution, injecting 0.30 μl of the solution into the HPLC system, and chromatograms were set down to determine the sample stability. No major degradation was observed. Software given condition shows 0.00% degradation for thermal degradation studies. The results for thermal degradation studies show no degradation was found, which indicates NTB shows thermal stability. The chromatogram is shown in fig. 8d.
a)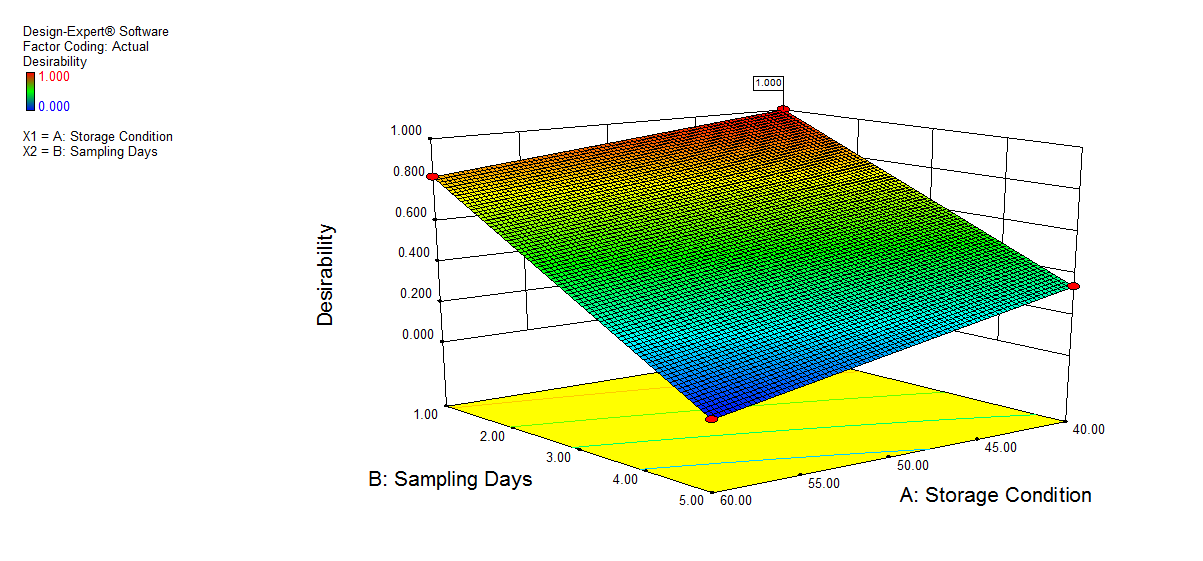 |
|
b) |
c) |
d) |
e) |
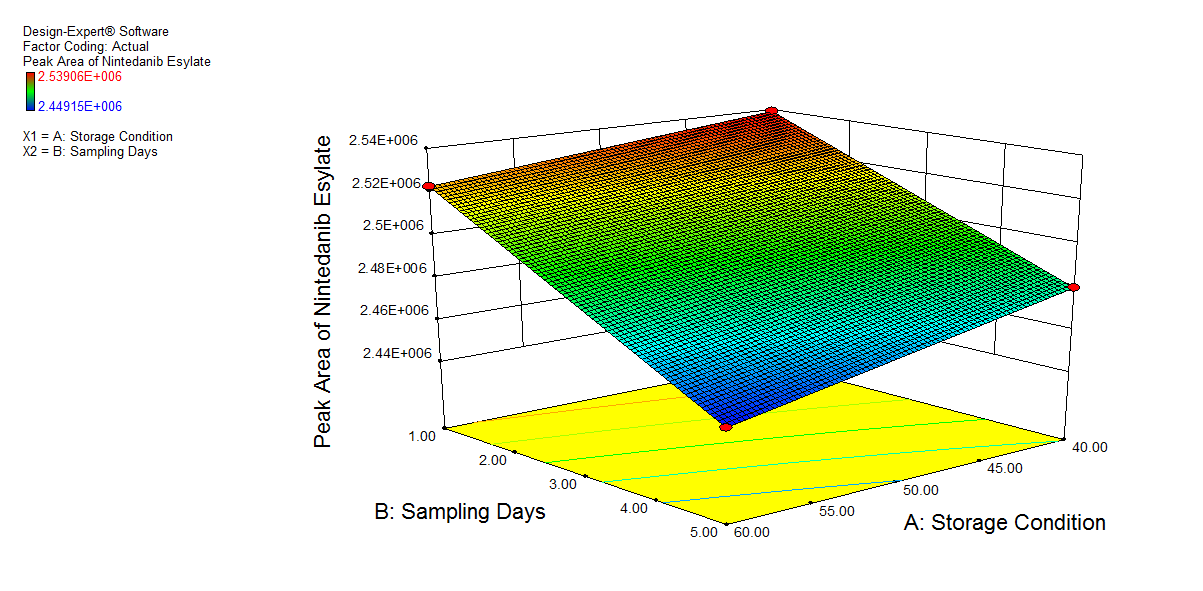
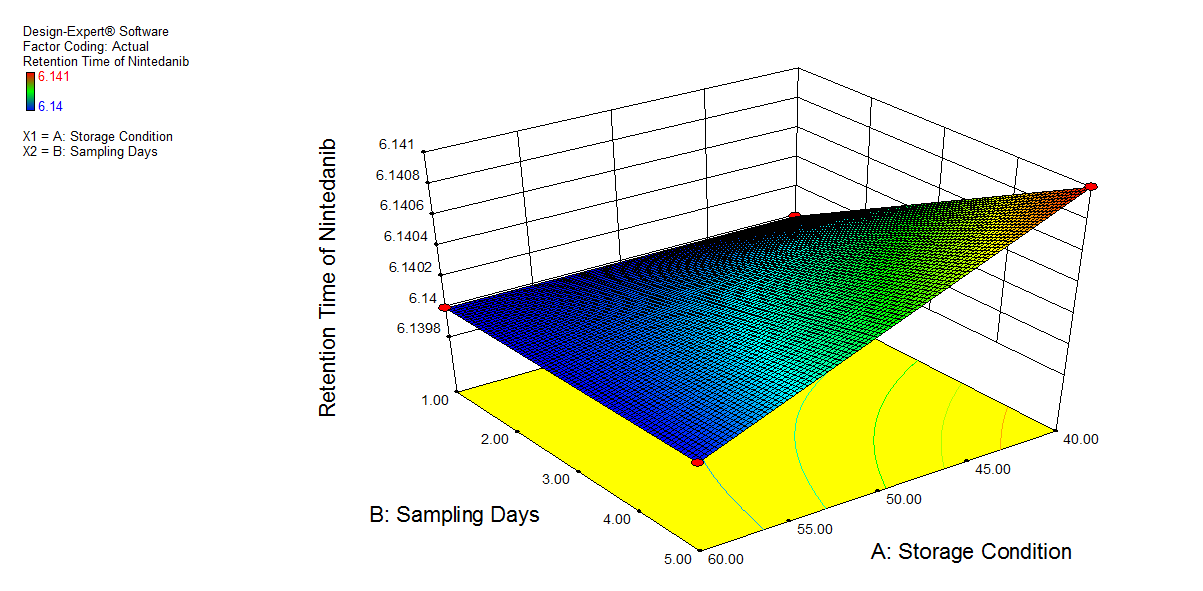
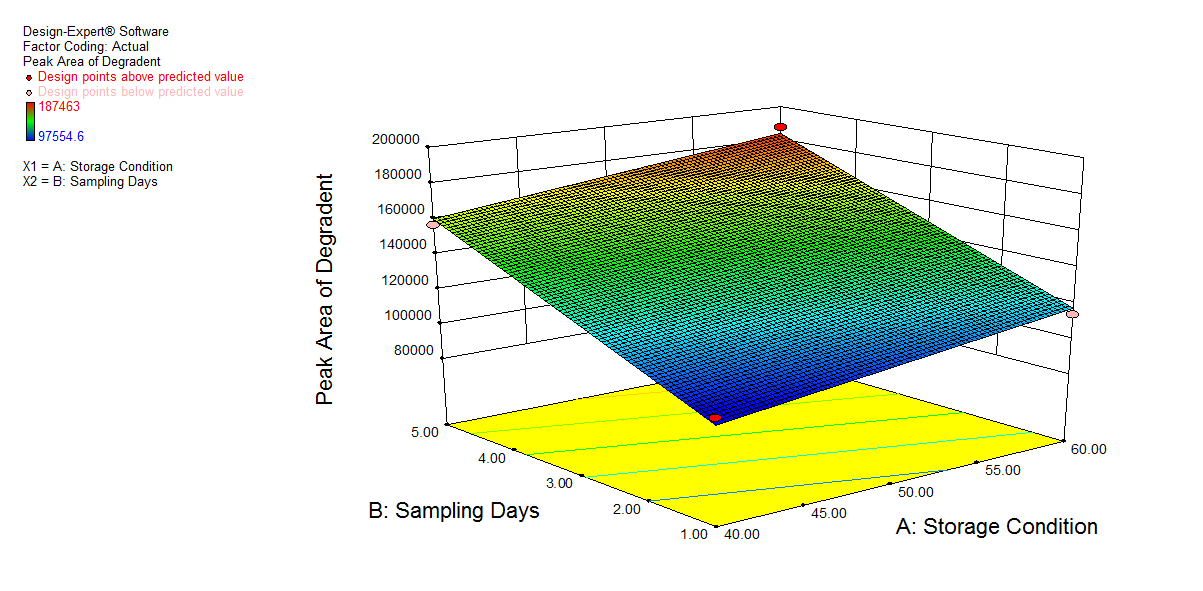
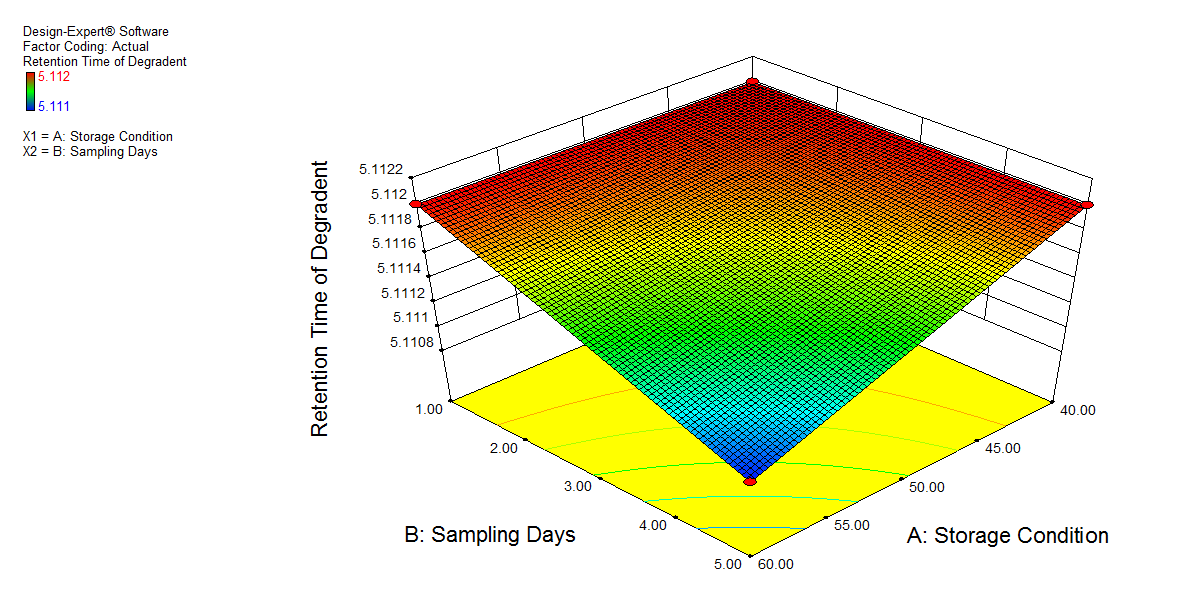
Fig. 6: 3D plot of acidic hydrolysis a) Desirability, b) Peak area of NTB, c) RT of NTB, d) Peak area of degradant, e) RT of degradant. (A: Storage condition and B: is sampling days)
Table 12: Software-given conditions for photolytic degradation studies
| S. No. | Storage condition (Lux h) | Sampling time in days | RT of NTB (min) |
Peak area of NTB (mAU*min) | RT of DP1 (min) | Peak Are of DP1 (mAU*min) |
% Degradation |
| 1 | Light 1 | 1.00 | 6.141 | 2438864 | 9.621 | 197745 | 7.5 |
| 2 | Light 3 | 5.00 | 6.141 | 2378222 | 9.626 | 258387 | 9.8 |
| 3 | Light 1 | 5.00 | 6.141 | 2420407 | 9.621 | 216202 | 8.2 |
| 4 | Light 3 | 1.00 | 6.140 | 2407224.93 | 9.626 | 229385 | 8.7 |
| Standard peak area of NTB 50 ug/ml: 2636610 |
Photolytic degradation studies
The photolytic stability study of the NTB was investigated by exposing the API powder to UV light at 200-Watt h/m2 and fluorescence light (1-3 lux h) for 1 to 5 d in a photochemical stability chamber. The resulting solution was diluted to generate a 50 μg/ml solution. The 0.30 μl of each solution was administered in the HPLC system, and the chromatogram was recorded for determination of whether the sample had retained its stability. No major degradation was observed. Software-suggested conditions are given in table 12.
Results of photolysis by Light 1 lux h and 3 lux h.
The percentage degradation of NTB for day 1 under 1 lux h was found to be 7.5% under 3 lux h, 8.7%. For day 5, under 1 lux h, 8.2% and under 3 lux h, 9.8% in photolytic condition. The extra peaks were eluted at retention times of 9.62 min. The chromatogram is shown in fig. 8e.
 |
 |
 |
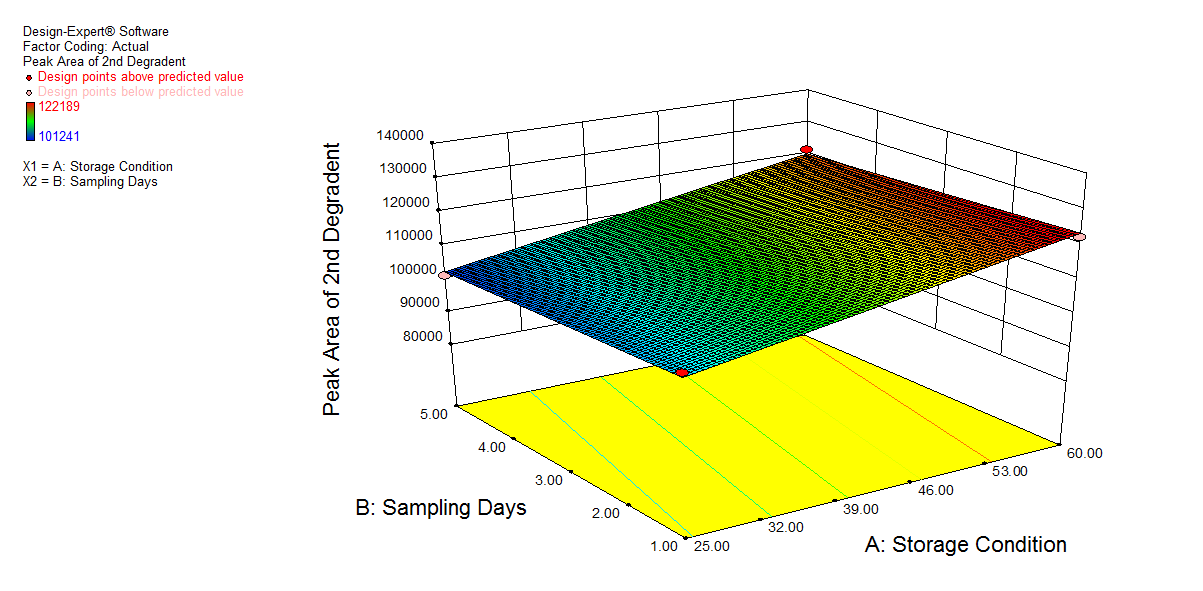 |
Fig. 7: 3D plot of peroxide degradation a) Desirability, b) Peak area of NTB, c) Peak Area of 1st degradant, e) Peak area of 2nd degradant. (A: Storage condition and B: Sampling days)
a) |
b) |
c) |
d) |
e) |
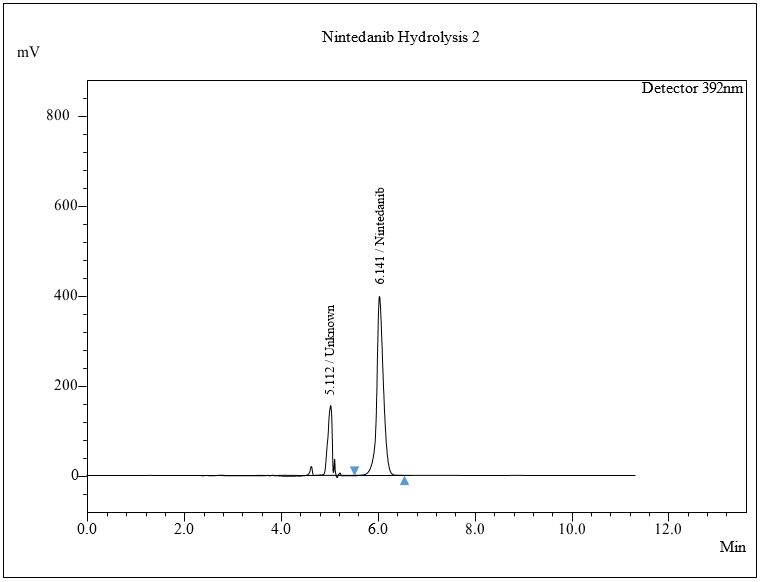
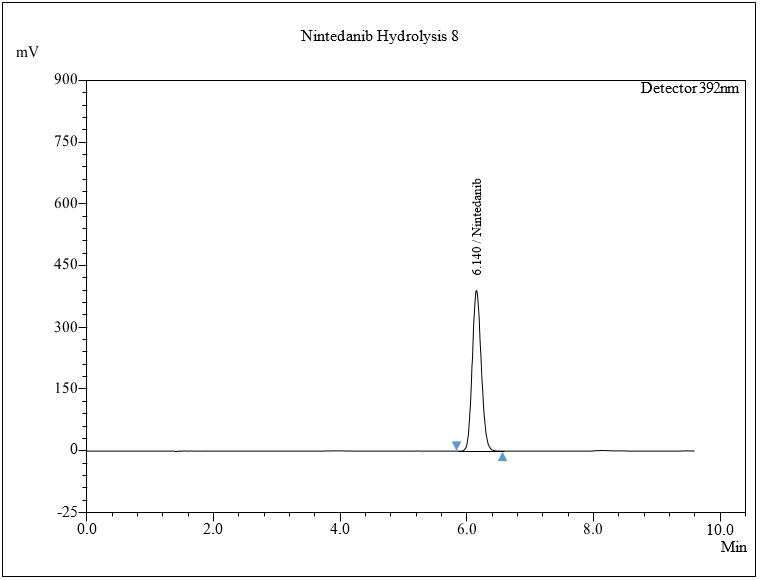
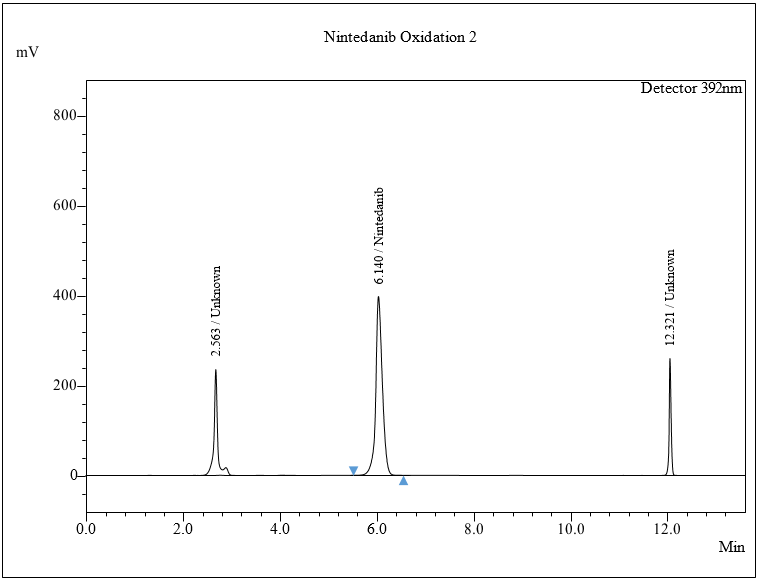
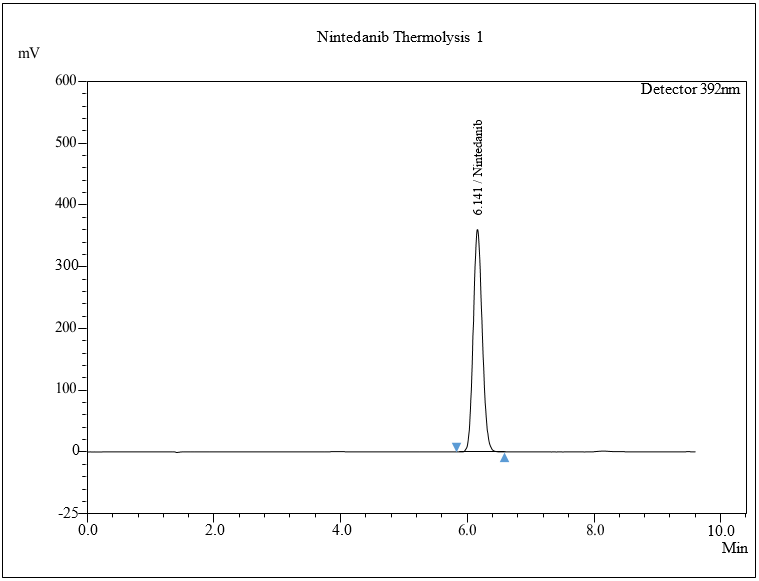
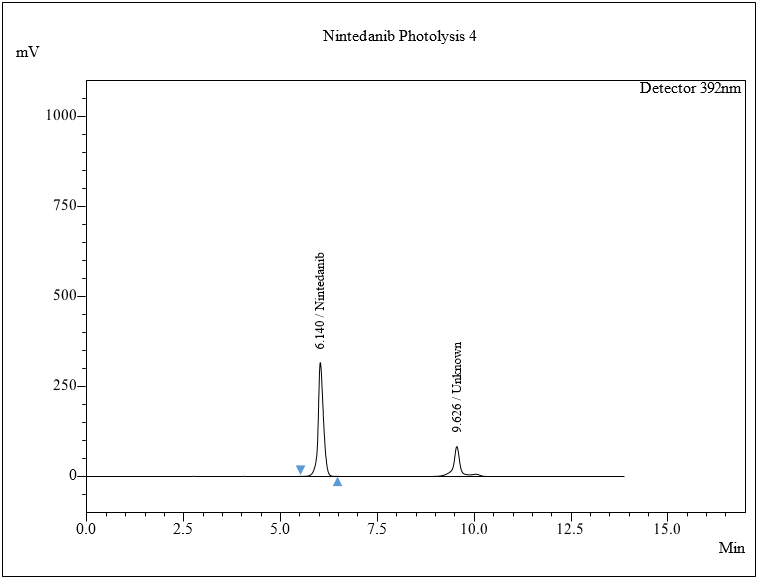
Fig. 8: Chromatogram of a) Acidic, b) Alkaline, c) Oxidative, d) Thermal, e) Photolytic degradation
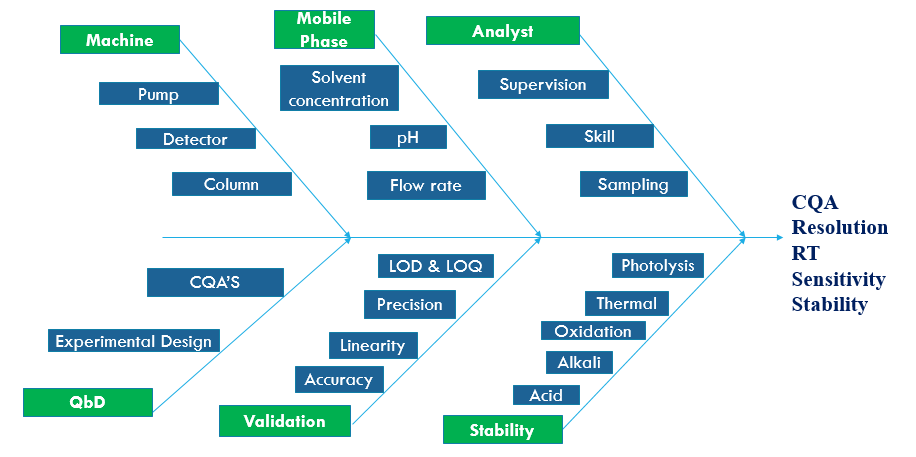
Fig. 9: Ishikawa (fishbone) diagram for risk identification and assessment
Table 13: Summary of stress degradation of NTB
| S. No. | Stress condition | Treatment | Degradation products with RT in min | % Degradation |
| 1. | Acidic degradation | 1N HCl at 40 °C and 60 °C reflux for 30 min, for 1 to 5 d | DP1 at 5.1 min | 3.7-5.9 % |
| 2. | Alkaline degradation | 1N NaOH at 40 °C and 60 °C reflux for 30 min, for 1 to 5 d | - | - |
| 3. | Oxidative degradation | 20% H2O2 at 25 to 60 °C for 30 min. for 1 to 5 d | DP2 at 2.5 min DP3 at 12.32 min |
54 – 66 % |
| 4. | Thermal degradation | kept in oven 30 °C to 105 °C for 6 h from 1 to 5 d | - | - |
| 5. | Photolytic degradation | UV light of 200-Watt h/m2florescence light1-3luxhourfor 1 to 5 d | DP4 at 9.6 min | 7.5-9.8 % |
Statistically significance of stability study
After applying the experimental design, the p-value of all models was found to be less than 0.005, indicating the model's significance. The ANOVA values of the developed factorial model are significant.
CONCLUSION
A new simple, accurate, and precise QbD-based method was developed for estimation of nintedanib esylate in capsule dosage form. The QbD-based stability studies were performed, and four degradation products were observed during forced degradation studies of nintedanib esylate. The above method signifies flexibility of method for optimization and stability studies for less batch failure with more efficient and controlled analysis of nintedanib esylate.
ACKNOWLEDGEMENT
Author would like to thank to Smt. Kashibai Navale College of Pharmacy for providing the facility to conduct this the research work.
FUNDING
Nil
ABBREVIATIONS
NTB: Nintedanib Esylate, RT: Retention Time, HPLC: High-Performance Liquid Chromatography, QbD: Quality by Design, NICE: National Institute for Health and Care Excellence, IPF: Idiopathic Pulmonary Fibrosis, RSD: Relative Standard Deviation, LOD: Limit of Detection, LOQ: Limit of Quantitation, CQA: Critical Quality Attributes, QTPP: Quality Target Profile, CPP: Critical Process Parameter.
AUTHORS CONTRIBUTIONS
Jyoti Tangde: Review of literature and writing of original draft; Dr. Sanjay Sawant: design of work and evaluation.
CONFLICT OF INTERESTS
The authors declare they do not have a competing interest
REFERENCES
Parmar Y, Shah D, Yashraj A, Majmudar Y, Patel A, Kanakad P. The novel analytical method development and validation for related substances of nintedanib esylate by RP-HPLC method. World J Pharm Res. 2021;10(1).
Dudhat KR, V Patel H. Novel nanoparticulate systems for idiopathic pulmonary fibrosis: a review. Asian J Pharm Clin Res. 2020;13(11):3-11. doi: 10.22159/ajpcr.2020.v13i11.39035.
Jinju M, Jingyi H, Zidan C, Jiao S, Renren S, Haixia H. Solubility measurement and thermodynamic properties of Nintedanib Esylate hemihydrate in pure solvents. J Mol Liq. 2022;352. doi: 10.1016/j.molliq.2022.118624, PMID 118624.
Shiratori T, Tanaka H, Tabe C, Tsuchiya J, Ishioka Y, Itoga M. Effect of nintedanib on non-small cell lung cancer in a patient with idiopathic pulmonary fibrosis: a case report and literature review. Thorac Cancer. 2020 Jun;11(6):1720-3. doi: 10.1111/1759-7714.13437, PMID 32285615.
Bhat D, Rane S. QbD approach to analytical RPHPLC method development and its validation. Int J Pharm Pharm Sci. 2011;3(1).
Cameli P, Alonzi V, d’Alessandro M, Bergantini L, Pordon E, Guerrieri M. The effectiveness of nintedanib in patients with idiopathic pulmonary fibrosis, familial pulmonary fibrosis and progressive fibrosing interstitial lung diseases: a real-world study. Biomedicines. 2022;10(8):1973. doi: 10.3390/biomedicines10081973, PMID 36009520.
Ogura T, Inoue Y, Azuma A, Homma S, Kondoh Y, Tanaka K. Real-world safety and tolerability of nintedanib in patients with idiopathic pulmonary fibrosis: interim report of a post-marketing surveillance in Japan. Adv Ther. 2023 Apr;40(4):1474-93. doi: 10.1007/s12325-022-02411-y, PMID 36692681.
Yu LX, Amidon G, Khan MA, Hoag SW, Polli J, Raju GK. Understanding pharmaceutical quality by design. AAPS J. 2014 Jul;16(4):771-83. doi: 10.1208/s12248-014-9598-3, PMID 24854893.
International Conference on Harmonisation of Technical Requirements for Registration of Pharmaceuticals for Human use, ICH Harmonised Tripartite. Guideline pharmaceutical. Development Q8 (R2) Current Step. 4th version dated Aug; 2009.
Pasquini B, Orlandini S, Furlanetto S, Gotti R, Del Bubba M, Boscaro F. Quality by design as a risk-based strategy in pharmaceutical analysis: development of a liquid chromatography-tandem mass spectrometry method for the determination of nintedanib and its impurities. J Chromatogr A. 2020;1611:460615. doi: 10.1016/j.chroma.2019.460615, PMID 31630831.
Ramalingam P, Jahnavi B. QbD considerations for analytical development. In: Pharmaceutical quality by design. Elsevier; 2019. p. 77-108. doi: 10.1016/B978-0-12-815799-2.00005-8.
Verch T, Campa C, Chéry CC, Frenkel R, Graul T, Jaya N. Analytical quality by design, life cycle management, and method control. AAPS J. 2022;24(1):34. doi: 10.1208/s12248-022-00685-2, PMID 35149913.
Divya B, Sankar PR, Latha BH, Teja GS, Sravanthi SS, Viharika N. Development and validation of RP-HPLC method for the determination of nintedanib in pharmaceutical dosage form. Int J Pharm Sci Rev Res. 2023;80(2). doi: 10.47583/ijpsrr.2023.v80i02.008.
Kumar R, Kumar V, Singh R, Warde S. Validated RP-HPLC method for determination and quantification of nintedanib in pharmaceutical formulation, Journal of Adv. Pharmacol CR J. 2020;1(1):38-47.
Jadhav S, Bachhav R, Jadhav V. Stability Indicating RP-HPLC method development and validation for estimation of nintedanib esylate in bulk and pharmaceutical dosage form. WJPPS. 2023;12(7):2278-4357. doi: 10.20959/wjpps20237-25229.
Yenda P, Katari NK, Satheesh B, Gundla R, Muchakayala SK, Rekulapally VK. Development, stability-indicating assessment, and evaluation of influential method conditions using a full factorial design for the determination of nintedanib esylate-related impurities. J Sep Sci. 2023 Jun;46(11):e2200770. doi: 10.1002/jssc.202200770, PMID 36976154.
Velagacherla V, Nayak Y, Bhaskar KV, Nayak UY. A stability indicating method development and validation of a rapid and sensitive RP-HPLC method for Nintedanib and its application in quantification of nanostructured lipid carriers. F1000Res. 2023;12:1389. doi: 10.12688/f1000research.138786.2, PMID 38948504.
Dhiman V, Balhara A, Singh S, Tiwari S, Gananadhamu S, Talluri MV. Characterization of stress degradation products of nintedanib by UPLC, UHPLC-Q-TOF/MS/MS and NMR: evidence of a degradation product with a structure alert for mutagenicity. J Pharm Biomed Anal. 2021;199:114037. doi: 10.1016/j.jpba.2021.114037, PMID 33836462.
Dasari P, Arava V, Ramadevi B, Kameswarrao ChV. Development and validation of a simple and sensitive stability-indicating RP-HPLC assay method for determination of nintedanib and stress degradation studies. J Chem Pharm Res. 2015;78:774-82.
Togami K, Fukuda K, Yamaguchi K, Chono S, Tada H. Facile and sensitive HPLC-UV method for determination of nintedanib in rat plasma. Int J Pharm Pharm Sci. 2018;10(6). doi: 10.22159/ijpps.2018v10i6.25504.
Waghmare SA, Sumithra M. QbD based development and validation of RP-HPLC method for nintedanib esylate: application to bioanalytical and stability study in plasma. Analytical Chemistry Letters. 2021;11(3):392-408. doi: 10.1080/22297928.2021.1930581.
Bhole R, Zambade T, Bonde C, Zambre Y. Identification and characterization of degradation products by using MSMS studies for developed and validated stability indicating HPTLC method for estimation of nintedanib esylate in pharmaceutical dosage form. Eurasian J of Anal Chem. 2019;14(2):60-70.
Bhole R, Chadar K, Zambare Y, Bonde CG. Development and validation of HPTLC method for estimation of dofetilide in pharmaceutical dosage form and determination of its degradation profile by MS-MS method. Istanb J Pharm. 2020;50(2):71-8. doi: 10.26650/IstanbulJPharm.2019.0052.
Namjoshi S, Dabbaghi M, Roberts MS, Grice JE, Mohammed Y. Quality by design: development of the quality target product profile (QTPP) for semisolid topical products. Pharmaceutics. 2020 Mar 23;12(3):287. doi: 10.3390/pharmaceutics12030287, PMID 32210126.
Vora R, Shah Y. Investigation of quality target process parameters (QTPP) and critical material attributes (CMA) of nanocellulose as a potential excipient. Int J App Pharm. 2019;11(4):386-95. doi: 10.22159/ijap.2019v11i4.33656.
Babar SA, L. Padwal S. QBD approach to analytical method development and its validation for estimation of lenvatinib in bulk and pharmaceutical formulation. Int J App Pharm. 2021;13(5):183-8. doi: 10.22159/ijap.2021v13i5.41786.
Jayagopal B, Murugesh S. QbD-mediated RP-UPLC method development invoking an FMEA-based risk assessment to estimate Nintedanib degradation products and their pathways. Arab J Chem. 2020;13(9):7087-103. doi: 10.1016/j.arabjc.2020.07.014.
ICH harmonized tripartite guideline. Stability testing: photo stability testing of new drug substances and products Q1B; International. Geneva, Switzerland: Conference on Harmonization, International Federation of Pharmaceutical Manufacturers Associations; 1996.
ICH harmonized tripartite guideline; stability testing of new drug substances and new drug products; International conference on Harmonization. Vol. Q1A. Geneva, Switzerland: International Federation of Pharmaceutical Manufacturers Associations; 2003. p. R2.
ICH harmonized tripartite guideline; validation of analytical procedures: text and methodology; International conference on Harmonization. Vol. Q2. Geneva, Switzerland: International Federation of Pharmaceutical Manufacturers Associations; 2005. p. R1.