
Int J App Pharm, Vol 17, Issue 2, 2025, 204-224Original Article
COMPUTATIONAL MULTI-FACTOR MODELING TO THE SIMULTANEOUS DETERMINATION OF ASSAY AND RELATED SUBSTANCES METHOD DEVELOPMENT, VALIDATION, AND IDENTIFICATION OF MAJOR DEGRADATION PRODUCT OF COVID-19 DRUG MOLNUPIRAVIR BY HPLC: A STRATEGIC RESEARCH USING AQBD
SANDIP KUMAR DEY, SUMANTA MONDAL*
Department of Pharmaceutical Chemistry, School of Pharmacy, GITAM (Deemed to be University), Visakhapatnam-530045, Andhra Pradesh, India
*Corresponding author: Sumanta Mondal; *Email: msumanta@gitam.edu
Received: 15 Nov 2024, Revised and Accepted: 10 Jan 2025
ABSTRACT
Objective: In the current study, a new approach was developed for the simultaneous determination of molnupiravir with its degradation products using RP-HPLC by following the Analytical Quality by Design (AQbD) approach, a proactive strategy for advancing pharmaceutical research.
Methods: Development was carried out by applying the two levels of fractional factorial design [25-1] with Resolution: V, four center points, and no replicates) to the five independent factors. The separation was achieved using liquid chromatography, equipped with XBridge BEH Shield (250 mm x 4.6 mm, 3.5 µm) RP18 column at 260 nm with gradient elution. A force degradation study was performed in different stressed conditions and a major degradant was identified using modern analytical techniques.
Results: The dependent factors were assessed against independent factors using the H-N plot, Pareto chart, and 3D surface plot applied through ANOVA. Major degradant obtained from stress study was identified and characterized using LC-MS, NMR, and FTIR techniques. The analytical method was found to be specific, precise (% RSD ≤ 2.0), linear (r = 0.9999) and accurate (99.2-101.4 %) with a 0.2-0.6 mg/ml range. The LOD and LOQ were 0.02 % (0.08 µg/ml, S/N ratio ≥ 3) and 0.05 % (0.2 µg/ml, S/N ratio ≥ 10, % RSD: 2.2) respectively. The analytical solutions were stable for 48 hour in the clear glassware at room temperature. The study depicts the successful development and validation of a simultaneous determination of assay and related substances by RP-HPLC using Design of Experiments (DoE) approach.
Conclusion: A Fractional Factorial Design (FFD) experiment explored the interactions of dependent with independent factors using Design Expert software, version 13.0. This AQbD-driven approach provided an in-depth understanding of chromatographic separation factors, ensuring method reliability and effectiveness for simultaneously determining the purity and impurity of molnupiravir, assisting in regulatory compliance.
Keywords: Molnupiravir, Quality by design, AQbD, Degradation, Validation, LOD, LOQ, Identification
© 2025 The Authors. Published by Innovare Academic Sciences Pvt Ltd. This is an open access article under the CC BY license (https://creativecommons.org/licenses/by/4.0/)
DOI: https://dx.doi.org/10.22159/ijap.2025v17i2.53192 Journal homepage: https://innovareacademics.in/journals/index.php/ijap
INTRODUCTION
Molnupiravir (MK-4482/EIDD-2801) is an investigational substance that acts as a powerful ribonucleoside analog, effectively blocking the viruses for COVID-19 and its selective replication of SARS-CoV-2. Research indicates that molnupiravir (MPV) is therapeutically in various preclinical SARS-CoV-2 models, serving purposes such as prevention, treatment, and halting transmission [1, 2]. Molnupiravir was released by DRIVE, LLC which is owned by Emory University biotechnology company. The drug has been marketed by Merck and Co., Inc., in partnership with Ridgeback Biotherapeutics [3]. MPV the drug chemically known as 3,4-dihydroxy-5-(4-(hydroxyamino)-2-oxopyrimidin-1(2H)-yl)tetrahydrofuran-2-yl) methyl isobutyrate fig. 1, is a groundbreaking oral antiviral that has demonstrated significant efficacy in reducing hospitalizations and deaths in COVID-19 cases, making it a vital weapon against SARS-CoV-2 and the candidate is undergoing phase III trials for treating COVID-19 patients. MPV works by mutating the virus, ultimately leading to its destruction. This oral medication shall be taken for five days, making it simple to administer in outpatient settings and promoting better patient compliance. Key advantages are large-scale production capabilities and no cold transfer and administration requirements outside of hospital settings. Clinical trials have shown to be well-tolerated, safe, and free of major adverse events, at least in the short term. These emerging findings suggest that MPV could potentially be a groundbreaking solution in the fight against SARS-CoV-2. As an oral antiviral medication, it would offer a highly valuable treatment option [4, 5].
Traditional quality control methods for pharmaceutical products have proven inadequate, highlighting the need for a more comprehensive approach. Total quality assurance can only be achieved through in-process testing and analysis. To address this, the QbD concept has been widely adopted globally, aligned with the International Conference on Harmonization (ICH) Guidelines. ICH Guidelines Q8 (pharmaceutical development) [6], Q9 (quality risk management) [7], and Q10 (pharmaceutical quality systems) [8] provide a framework for integrating quality into product development. Analytical science is integral to pharmaceutical product development, spanning the entire product lifecycle. AQbD is a risk-based approach that optimizes method development by controlling critical variables, ensuring robust, rugged, and flexible methods for continuous improvement. The primary goal of AQbD is to identify potential failure modes and establish a robust design space, an approach that has been successfully applied to High-Performance Liquid Chromatography (HPLC) methods, ensuring reliable operation and continuous lifecycle management. Simultaneous determination plays a significant role in defining the critical quality attributes (e. g., Purity, Impurities, etc.) of drug substance/drug product as it is considered highly efficient in stability prediction, cost-effective, and timesaving too [9]. The present techniques provide a high degree of specificity and selectivity. It also provides the greatest assurance by analyzing purity and impurities collectively by establishing mass balance (Purity+Impurity) according to the "Law of conservation of mass". Stability indicating nature and mass balance study are extremely important parameters for an analytical method which helps us to understand possible degradants, degradation pathway, guidance to packaging/formulation development, intrinsic stability of drug substance/drug product, which finally decides the shelf life to drug substance/drug product [10]. The extensive survey of the literature shows the existence of very few articles reported on the current research following AQbD approach [11-13]; however, none of them was the simultaneous determination of purity and impurity together. Among them, Kalpana et al. 2022, developed [14] an HPLC method but no force degradation study was conducted. Recber et al. 2022, found a stability-indicating [15] for MPV nano-formulation but identification of degradant was not performed, and it has specific applicability for that formulation variant. The purity determination was not suitable for using the same method. Kumar et al. 2021, performed [16] degradation studies and only explained the degradation patterns in various stressed conditions; however, a major degradant was not identified. Therefore, all the previously reported methods have some lacunas which impeded this work.
Fig. 1: Chemical structure of molnupiravir
In the present research, all the loopholes of most previous reports have been addressed with the empirical evidence, namely the simultaneous determination of purity and impurity together in the same method by following QbD approach, which involved defining critical parameters to ensure robustness and ruggedness and matching regulatory compliances. Therefore, no separate runs were necessary to prove purity and impurity. The major degradant peak eluted at RRT 0.37 has been characterized and the establishment of the structure has been done using chromatographic (HPLC) and spectroscopic techniques (IR, LC-MASS, 1H NMR, 13C NMR). The chromatographic method has been developed [17] and validated [18] according to the norms of ICH guidelines. The current method ensures its sensitivity towards the quantification of MPV and its related impurities accurately from reporting limit with the greatest precision and also ensures its stability indicating nature, ruggedness and robustness hence, it can be employed throughout the product lifecycle. As the current method also describes the degradant and its pathway, gaining insight into these degradation processes is essential to guaranteeing the efficacy, safety, and quality of the product, making this method superior as compared to the previously reported analytical methods.
MATERIALS AND METHODS
Reagents and chemicals
The MPV standard has been provided by TCG Lifesciences Pvt. Ltd., Salt Lake City, Kolkata, West Bengal. Perchloric acid (70 %) of AR grade was obtained from Spectrochem, Mumbai, methanol (99.9 %) of gradient grade was procured from Finar Labs, Mumbai, and acetonitrile (99.9 %) of gradient grade was from Merck, Mumbai. HPLC-grade purified water (99.9 %) was collected from the water purifier of Sartorius. Hydrochloric acid, sodium hydroxide, hydrogen peroxide (30 %), and sodium chloride of analytical grade were procured from Merck, Mumbai.
Instruments
The analytical balance and microbalance were of Mettler toledo with model no. XS205DU and XP6, respectively. The ultrasonicator bath was of Bandelin (model: DT514), the Refrigerator used of Samsung, and the vacuum pump was Divac, 13500. Waters Alliance e2998 (HPLC-UV and HPLC-PDA), equipped with XBridge BEH Shield RP18 (250 mm x 4.6 mm, 3.5 µm) (Part No: 186003964), with Empower 3 software, Milford, USA, was utilized during this study. The photostability chamber (Newtronic) and vacuum oven (Memmert) were used during stress studies, and the digital thermohygrometer was from Mextech. NMR of Bruker i. e. Ultrashield 400 MHz spectrometer (Bremen, Germany), LC-MS of Agilent infinity lab LC/MSD (California, USA), FTIR of Perkin Elmer model-Spectrum-Two (California, USA) were employed for the experiments.
Development and optimization of analytical method
Selection of mobile phase
Perchloric acid was chosen as the eluent in this chromatography due to its acid strength and ion exchange capacity, which was beneficial for separating close eluting peaks that may interfere with the main peak or degradant peak. Following a thorough evaluation, perchloric acid was found to be highly beneficial due to its remarkable enhancement of analyte response and peak shape, surpassing the performance of other buffers. 1.0 ml of perchloric acid was transferred into a 1000 ml container, then mixed well and permeated through a 0.45 µm membrane filter and finally sonicated to degas (Mobile phase A), for the preparation of mobile Phase B, water: acetonitrile (10:90 % v/v) was transferred volumetrically to the 1000 ml container, mixed well and sonicated to degas. Water was used as a diluent and for the needle wash, water: acetonitrile (70:30 % v/v) was used and water: acetonitrile (90:10 % v/v) solution was used for the seal wash. Both mobile phase A and mobile phase B were used as gradient programs.
Selection of detection wavelength
Utilizing HPLC-PDA, the detection wavelength was determined by scanning a standard solution of 0.4 mg/ml in diluent. The resulting spectral analysis revealed a maximum absorption wavelength of 260 nm, which was subsequently selected for analytical detection.
Chromatographic conditions
X Bridge BEH Shield RP18 (250 mm x 4.6 mm, 3.5 µm) (Part No: 186003964) column was utilized with a detector wavelength of 260 nm, and the volume of injection was 10 μl, with a flow rate of 0.6 ml/minute. The column temperature was 20 ᵒC along with the sample temperature of 25 °C. The total run time was 45 min. These conditions were considered as the center point for DoE.
Preparation of reference standard solutions
Weighed accurately about 40 mg of MPV standard and transferred it in a 100 ml volumetric container. After the addition of 90 ml diluent, sonicated the mixture till the MPV was completely dissolved in the solution. The solution was made up to the mark with diluent mixed well to achieve the 0.40 mg/ml concentration.
Preparation of sample solution
Weighed accurately about 40 mg of MPV sample and transferred it in a 100 ml volumetric container. After the addition of 90 ml diluent, sonicated the mixture till the MPV was completely dissolved in the solution. The solution was made up to the mark with diluent mixed well to achieve the 0.40 mg/ml concentration.
Confirmatory analytical method study employing quality by design principles
To develop and optimize the method, we utilized an AQbD framework [19, 20], implementing a strategic and systematic approach. Leveraging Design Expert software (version 13.0), we structured our method development process to ensure a rigorous and efficient optimization.
Selection of analytical target profile (ATP)
An ATP is a detailed concept that defines the required analytical performance characteristics for a specific method. It provides a concise and comprehensive outline of the method's intended purpose, accuracy, precision, selectivity, sensitivity and other critical attributes. By establishing a clear ATP, we can ensure their method meets the necessary standards for reliable results. The analytical method's performance characteristics [21] are summarized in table 1, outlining its intended purpose, system suitability, specificity, linearity, precision, accuracy, and solution stability criteria.
Determination of critical analytical attributes (CAA)
Critical Analytical Attributes (CAA) encompass a range of physical, chemical, biological, and microbiological characteristics that can be reliably measured and quantified. Each CAA includes a clear definition, an acceptable statistical limit, range, or distribution. By aligning critical design processes with CAA goals, we can minimize deviations, rapidly troubleshoot problems and ensure consistent product quality. The critical analytical attributes for the proposed HPLC method [22, 23] included tailing factor, theoretical plates, resolution, % RSD of replicate injections of standard solution, % assay, % related substances, and retention time, ensuring the desired analytical performance i. e. analytical target profile.
Table 1: Analytical target profile
| S. No. | Parameter | Performance criteria |
| 1. | System suitability | USP Tailing factor of MPV: NMT 2.0 USP Theoretical plates of MPV: NLT 20,000 RSD of five replicate standard injections: NMT 2.0 % |
| 2. | Specificity and Forced degradations | No interfering peak should be observed at the retention time of MPV in the blank. The peak due to MPV should be well resolved from other peaks, if any (USP Resolution: NLT 2.0) The peak purity of MPV should be demonstrated (purity angle<purity threshold) by using a photodiode array (PDA) detector. |
| 3. | Limit of detection | The signal/noise ratio should be NLT 3.0. |
| 4. | Limit of quantitation | The signal/noise ratio should be NLT 10.0. % RSD for the area of six replicate injections should be ≤ 5.0. |
| 5. | Linearity | The correlation coefficient (r) should be greater than or equal to 0.999. |
| 6. | Method precision | % RSD for the assay from six sample preparations should be ≤ 2.0. |
| 7. | Intermediate precision | % RSD for the assay from six sample preparations should be the same as the criteria given in method precision. The overall % RSD for the assay from twelve sample preparations (six from method precision and six from intermediate precision) should be the same as the criteria given in method precision. |
| 8. | Accuracy | Individual and mean recovery: 98.0-102.0 %. % RSD for each recovery level: ≤ 2.0. |
| 9. | Solution stability | Standard solution: The similarity factor should be between 98.0 to 102.0 |
Sample solution: Relative changes of assay value with initial results should be ≤ 2.0 %. |
Determination of critical method parameters (CMP)
A Critical Method Parameter (CMP) refers to a method variable in an analytical procedure that directly affects a Critical Analytical Attribute (CAA). Effective monitoring and control of CMPs are essential to ensure the final drug product meets the desired quality standards. Through analysis, key independent analytical variables influencing critical analytical attributes have been pinpointed. These variables, deemed critical method parameters, directly affect the method's performance. To ensure the analytical target profile remains within acceptable limits [24], the following critical method parameters must be tightly controlled; these are detection wavelength (±5 nm), flow rate (±0.1 ml/min), column oven temperature (±5 °C), the volume of perchloric acid in mobile phase-A (±0.2 ml/1000 ml), change in the minor component in mobile phase-B (±20 ml/1000 ml).
Determination of critical method material attributes (CMMA)
Critical Method Material Attribute (CMMA) refers to any material variation that can impact a Critical Analytical Attribute (CAA). As such, it is essential to monitor or control CMMAs to guarantee the desired quality standard. Although material characteristics – such as reagent purity, column stationary phase properties, and glassware quality- significantly affect critical analytical attributes [25, 26], the subsequent DoE investigation focused on other factors, excluding the following material attributes. These are, the high purity grade of solvents and reagents were used during the experiments and these grades remained unchanged throughout the experiment. The effect of column stationary phase variations, having been already characterized during intermediate precision studies, was considered controlled. Glassware type differences (amber/clear), having been previously investigated for solution stability, were considered controlled. Given prior evaluation in separate investigations, these attributes were deliberately excluded from the DoE scope.
Factorial study
Following the definition of the Analytical Target Profile (ATP), Critical Analytical Attributes (CAAs), and Critical Method Parameters (CMPs), a two-level FFD [25-1] with Resolution V was employed to investigate five independent factors. The Design Expert software (Version 13, Stat-Ease, Inc., MN 55413) was utilized to create the design, which included four center points and no replicates. The addition of center points enabled curvature assessment across continuous factors and enhanced statistical power. This design ensured orthogonality, where the main effects were independent of two-way interactions, and two-way interactions were independent of each other i. e. of other two-way interactions; refer to table 2 for details.
Table 2: Factorial effects aliases
| Estimated term | Aliased terms | Estimated term | Aliased terms | Estimated term | Aliased terms |
| Intercept | = Intercept | AB | = AB+CDE | BD | = BD+ACE |
| A | = A | AC | = AC+BDE | BE | = BE+ACD |
| B | = B | AD | = AD+BCE | CD | = CD+ABE |
| C | = C | AE | = AE+BCD | CE | = CE+ABD |
| D | = D | BC | = BC+ADE | DE | = DE+ABC |
| E | = E |
To investigate the interaction effects of five factors on analytical performance, an FFD consisting of 20 experiments was employed, augmented with four center points. Refer to table 3 for details.
The factors (flow rate, column oven temperature, detection wavelength, volume of perchloric acid in mobile phase-A, change in a minor component in mobile phase-B) interaction effects were evaluated on the following responses (tailing factor, theoretical plates, resolution, % RSD of replicate standard injections, % assay, % related substances, retention time).
This design facilitated the evaluation of interaction effects between multiple factors, providing insights into their combined impact on analytical performance.
Evaluation of DoE results
Utilizing an FFD approach, the study evaluated the impact of method conditions on key analytical performance parameters: tailing factor, theoretical plates, resolution, % RSD of replicate standard injections, % assay, % related substances, and retention time.
Results indicated that the center point of the design space fell within acceptable limits, demonstrating a robust region where intentional variations in method parameters do not significantly affect % assay. Notably, detection wavelength changes significantly impacted % related substances, advising against wavelength adjustments. Importantly, none of the investigated method parameters showed a practically significant effect, ensuring the method's reliability and minimizing the risk of failure during subsequent validation testing. Refer to table 4 for the Coefficients table and fig. 2 to fig. 22 Half-Normal plot, Pareto charts and 3D surface response plots.
Table 3: Investigated factors and their levels with coded factors
| Run | Space type | Factor 1: flow rate (ml/min) | Factor 2: column temperature (°C) | Factor 3: detector wavelength (nm) | Factor 4: perchloric acid: MP-A (ml/1000 ml) | Factor 5: water: MP-B (ml/1000 ml) |
| 1 | Center | 0.6 (0)* | 20 (0) | 260 (0) | 1.0 (0) | 100 (0) |
| 2 | Factorial | 0.7 (+1) | 25 (+1) | 265 (+1) | 0.8 (-1) | 80 (-1) |
| 3 | Center | 0.6 (0) | 20 (0) | 260 (0) | 1.0 (0) | 100 (0) |
| 4 | Factorial | 0.5 (-1) | 15 (-1) | 255 (-1) | 1.2 (+1) | 80 (-1) |
| 5 | Factorial | 0.7 (+1) | 15 (-1) | 255 (-1) | 0.8 (-1) | 80 (-1) |
| 6 | Center | 0.6 (0) | 20 (0) | 260 (0) | 1.0 (0) | 100 (0) |
| 7 | Factorial | 0.5 (-1) | 25 (+1) | 255 (-1) | 1.2 (+1) | 120 (+1) |
| 8 | Factorial | 0.7 (+1) | 15 (-1) | 255 (-1) | 1.2 (+1) | 120 (+1) |
| 9 | Factorial | 0.5 (-1) | 15 (-1) | 265 (+1) | 0.8 (-1) | 80 (-1) |
| 10 | Factorial | 0.5 (-1) | 25 (+1) | 255 (-1) | 0.8 (-1) | 80 (-1) |
| 11 | Factorial | 0.5 (-1) | 15 (-1) | 255 (-1) | 0.8 (-1) | 120 (+1) |
| 12 | Factorial | 0.7 (+1) | 25 (+1) | 255 (-1) | 0.8 (-1) | 120 (+1) |
| 13 | Factorial | 0.5 (-1) | 25 (+1) | 265 (+1) | 1.2 (+1) | 80 (-1) |
| 14 | Factorial | 0.5 (-1) | 25 (+1) | 265 (+1) | 0.8 (-1) | 120 (+1) |
| 15 | Factorial | 0.7 (+1) | 25 (+1) | 265 (+1) | 1.2 (+1) | 120 (+1) |
| 16 | Factorial | 0.5 (-1) | 15 (-1) | 265 (+1) | 1.2 (+1) | 120 (+1) |
| 17 | Factorial | 0.7 (+1) | 25 (+1) | 255 (-1) | 1.2 (+1) | 80 (-1) |
| 18 | Center | 0.6 (0) | 20 (0) | 260 (0) | 1.0 (0) | 100 (0) |
| 19 | Factorial | 0.7 (+1) | 15 (-1) | 265 (+1) | 0.8 (-1) | 120 (+1) |
| 20 | Factorial | 0.7 (+1) | 15 (-1) | 265 (+1) | 1.2 (+1) | 80 (-1) |
*Coded factor values are given in brackets.
Table 4: Coefficients table
| Coefficients | Intercept | A | B | C | D | E | AB | AC | AD | AE | BC | BD | BE | CD | CE | DE |
| USP Tailing factor | 0.8975 | -0.045 | -0.0175 | 0.01875 | 0.01375 | |||||||||||
| p-values | <0.0001 | 0.0041 | 0.0025 | 0.0179 | ||||||||||||
| UPS theoretical plates | 229602 | -30442.3 | ||||||||||||||
| p-values | 0.0037 | |||||||||||||||
| USP Resolution | 70.6 | 3.6625 | -5 | |||||||||||||
| p-values | 0.0269 | 0.0042 | ||||||||||||||
| % RSD of replicate injections | 0.385 | -0.2625 | 0.275 | -0.325 | ||||||||||||
| p-values | 0.0025 | 0.0018 | 0.0004 | |||||||||||||
| % Assay | 99.455 | |||||||||||||||
| p-values | ||||||||||||||||
| % Related substances | 0.8925 | 0.069375 | ||||||||||||||
| p-values | <0.0001 | |||||||||||||||
| Retention time (min) | 22.2358 | -1.53763 | -0.238125 | 0.1135 | ||||||||||||
| p-values | <0.0001 | <0.0001 | 0.0231 |
P-values shading: p<0.05, 0.05≤ p<0.1 p≥ 0.1
Probability is a fundamental tool for data scientists, enabling us to model and analyze scenarios where repeated experiments under similar conditions yield varying results. By applying probability concepts, we can assess the likelihood of different outcomes, evaluate the certainty of results and make informed decisions based on data-driven insights. In data science, an experiment refers to a meticulously planned study conducted under controlled conditions to test hypotheses, explore relationships, and gather meaningful data. ρ-value less than 0.05 indicated the statistical significance of factors on the responses.
Half-normal plot
The half-normal plot is a visual tool that utilizes ordered estimated effects to facilitate the identification of significant factors that substantially impact the outcome and insignificant factors with minimal or no impact. By using this plot, analysts can effectively distinguish between important and unimportant factors, guiding informed decision-making.
Pareto chart
In the pareto chart, two key thresholds help determine the significance of effects. The Bonferroni limit is the threshold above which the effects are considered highly significant, and the t-limit is the threshold below which the effects are deemed insignificant. Effects that fall between the t-limit and the Bonferroni limit may be considered moderately important (possibly significant).
3D surface response plot
A 3D surface plot is a powerful visualization tool that helps illustrate the relationship between a response variable and two predictor variables. This three-dimensional graph enables us to explore how response values change in response to variations in predictor variables, identify optimal operating conditions and desirable response values and gain deeper insights into complex relationships between variables.
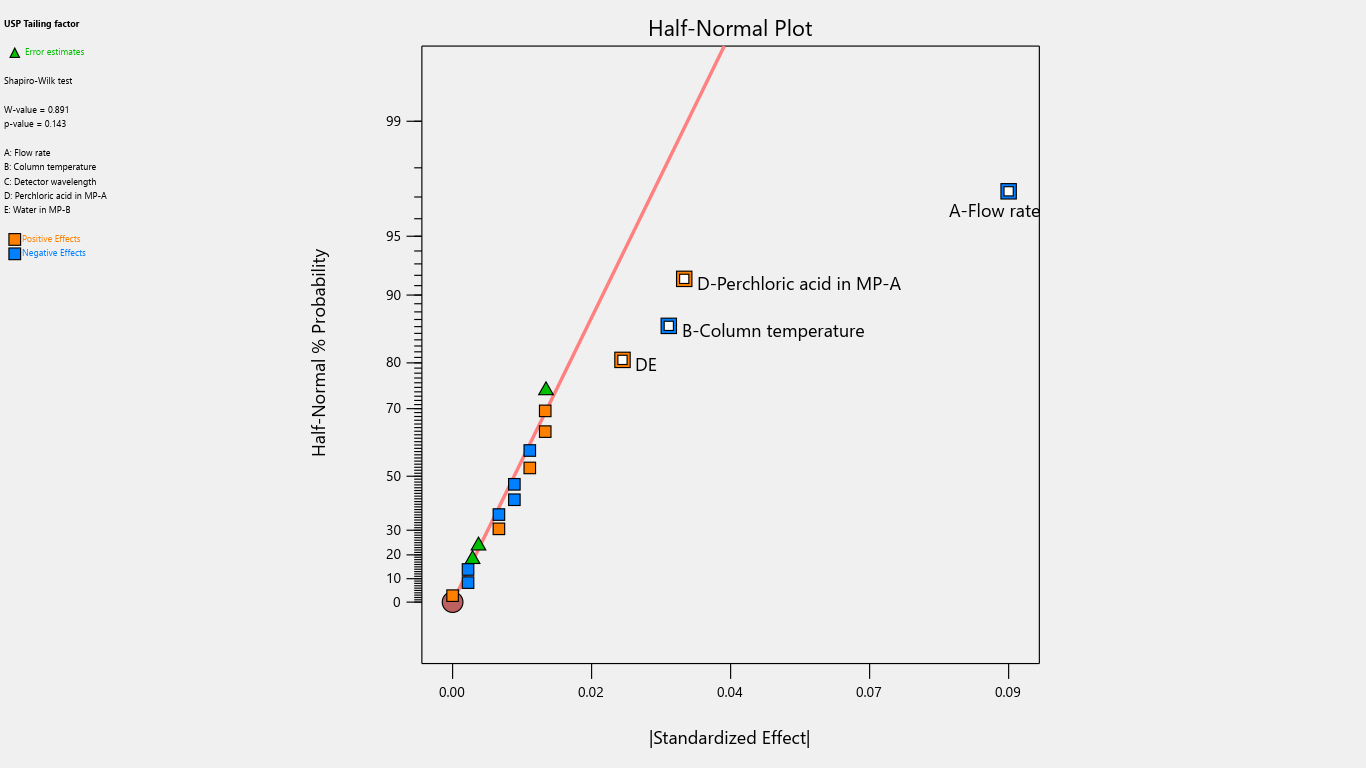
Fig. 2: Half-normal plot for the effects on tailing factor
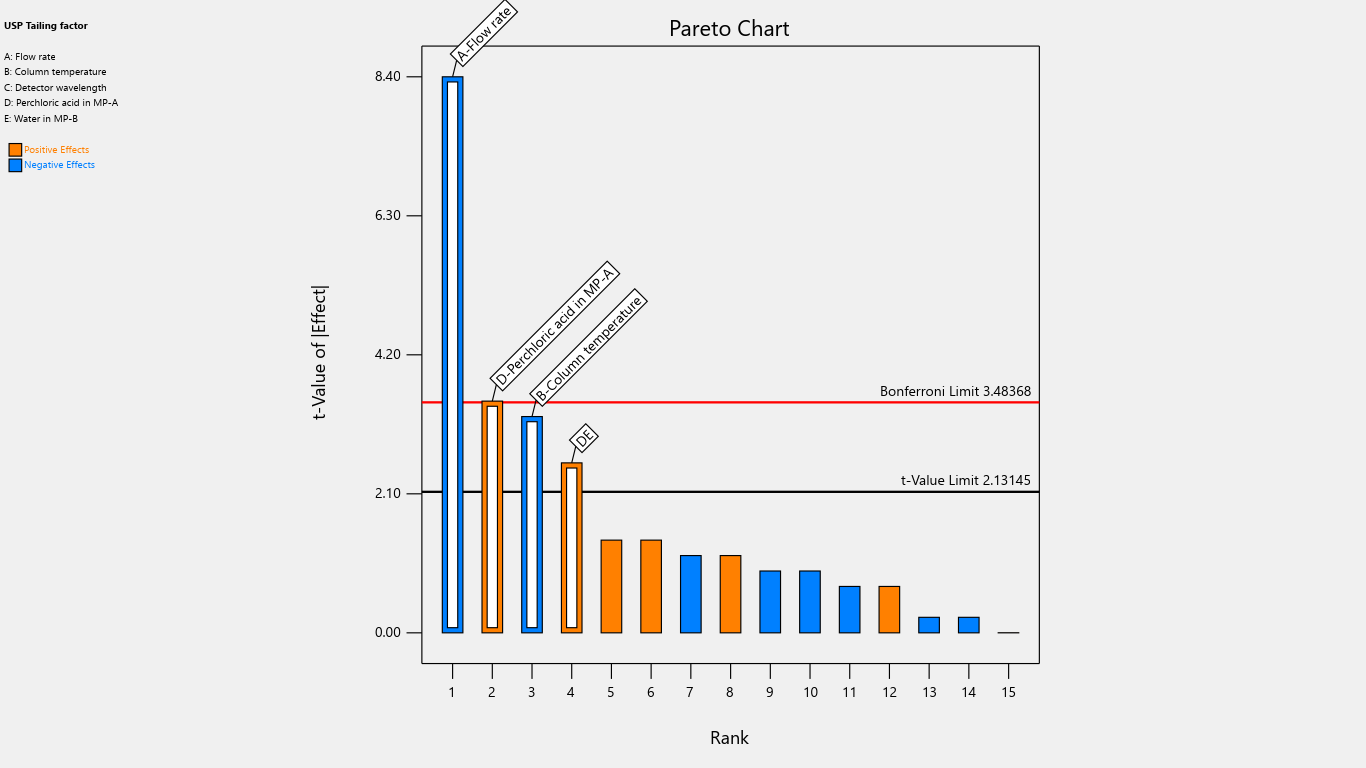
Fig. 3: Pareto chart for the effects on tailing factor
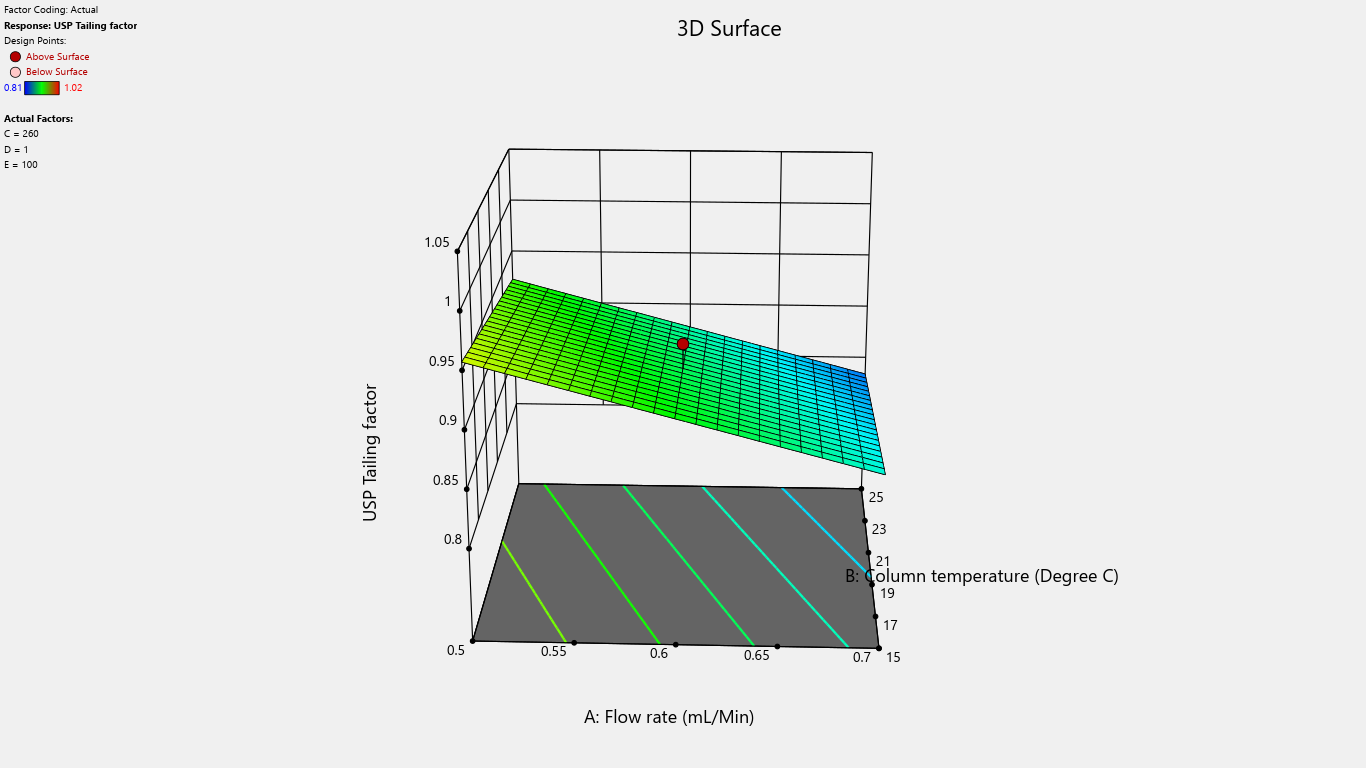
Fig. 4: 3D surface response plot for the effects on tailing factor
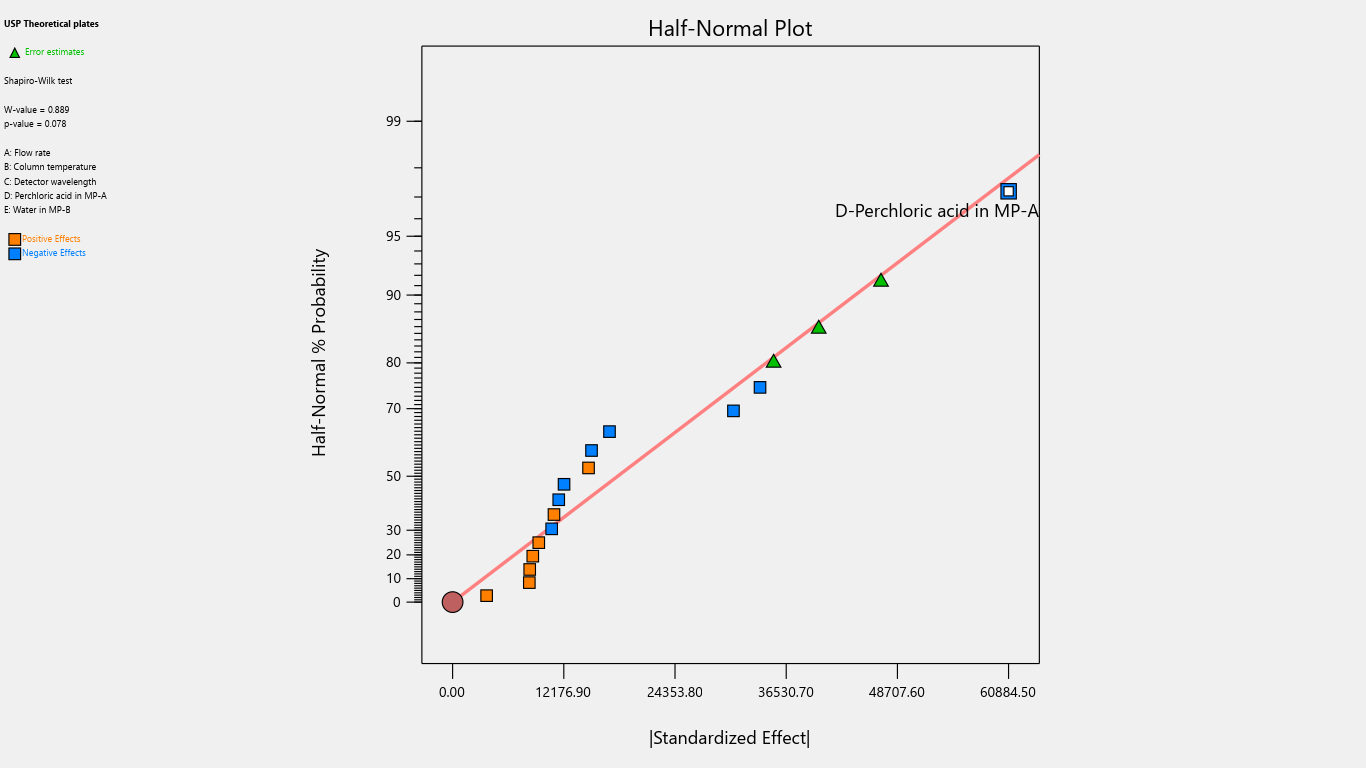
Fig. 5: Half-normal plot for the effects on theoretical plates
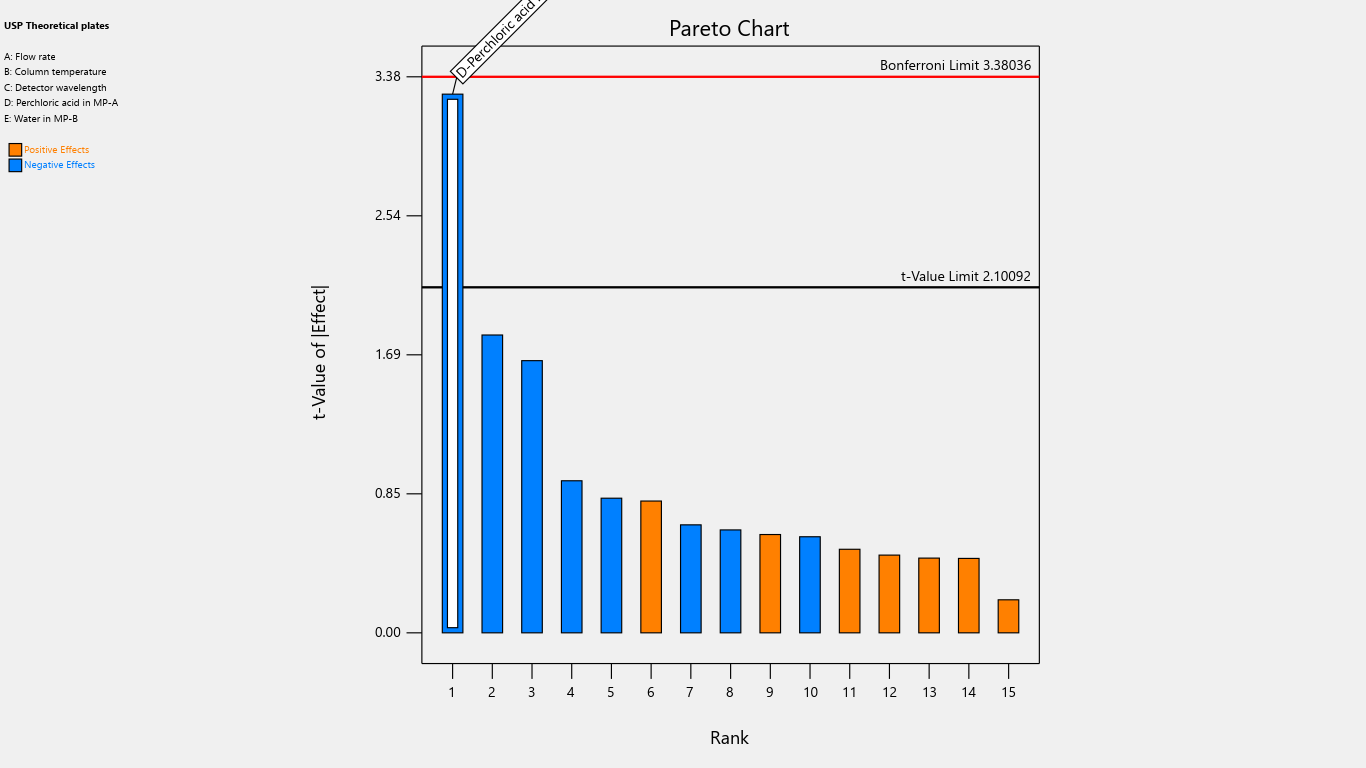
Fig. 6: Pareto chart for the effects on theoretical plates
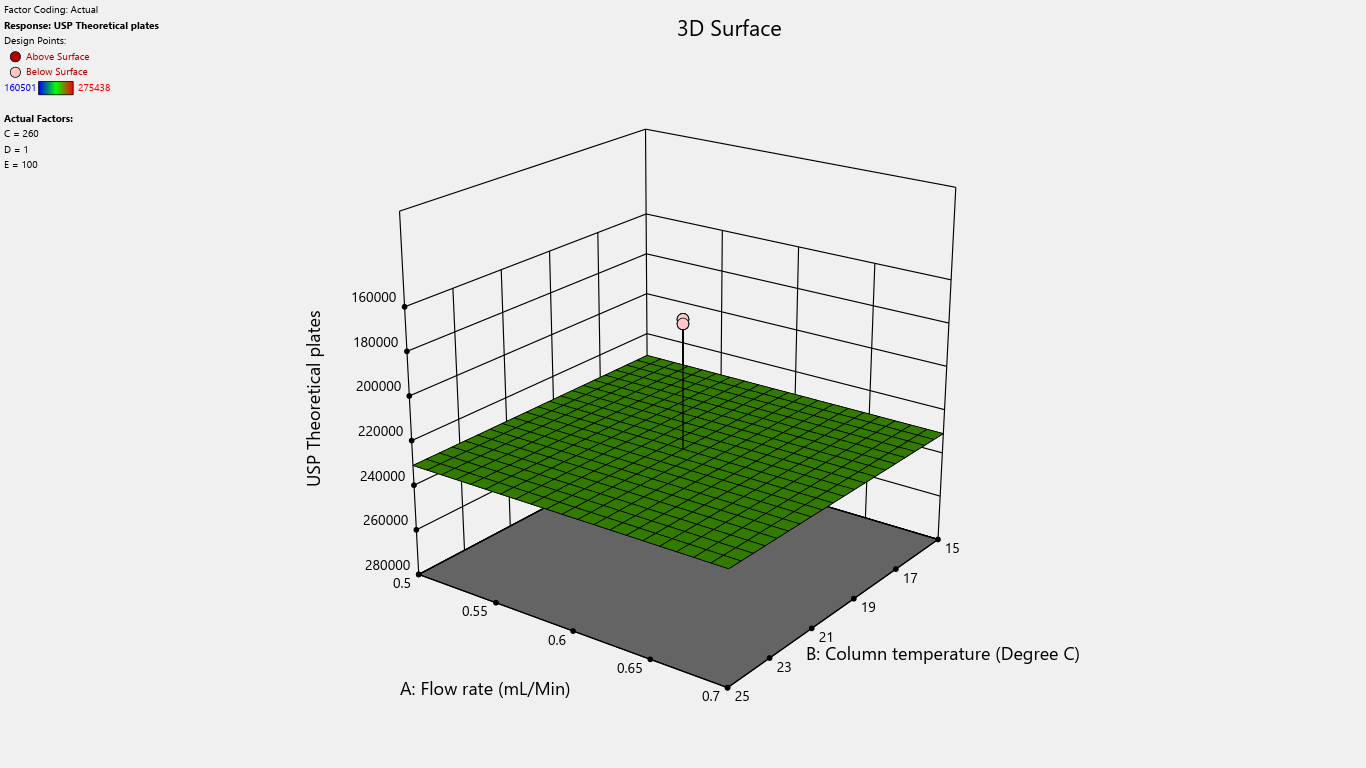
Fig. 7: 3D surface response plot for the effects on theoretical plates
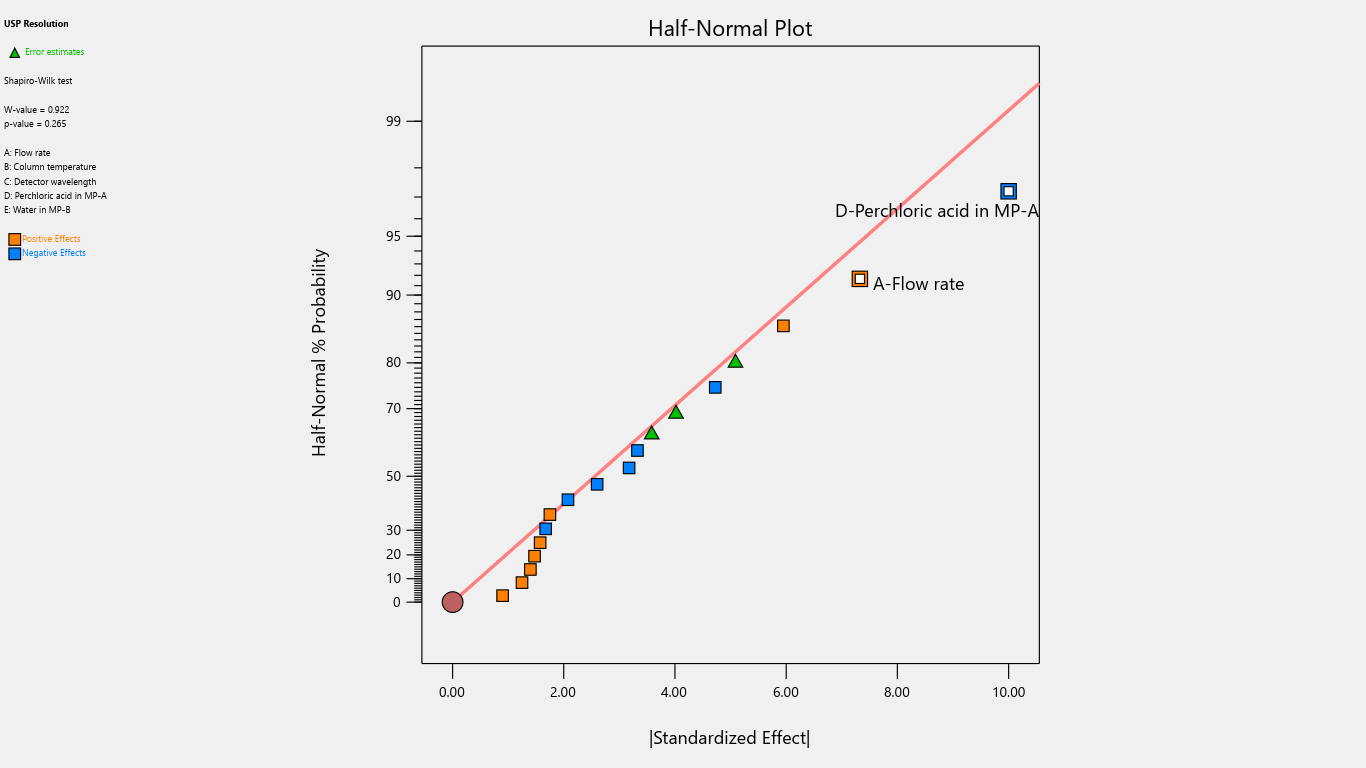
Fig. 8: Half-normal plot for the effects on resolution
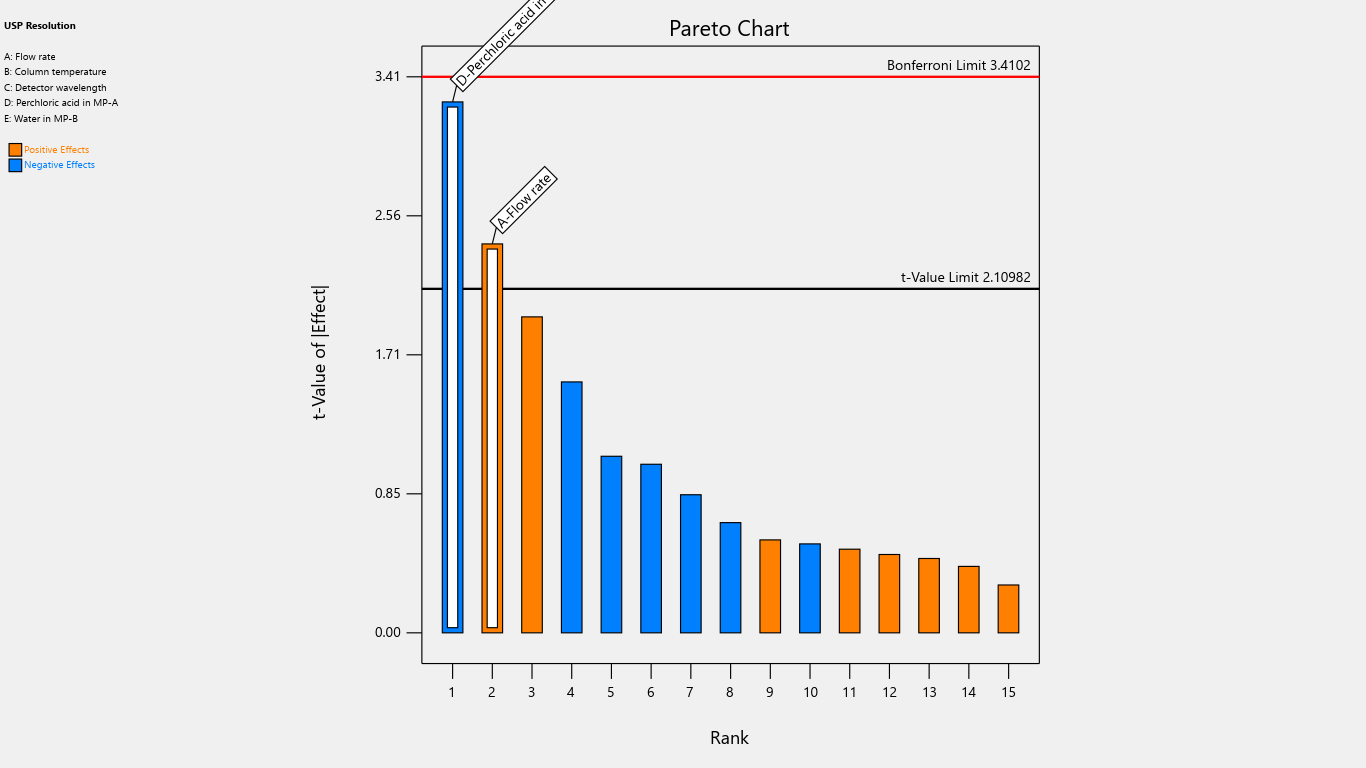
Fig. 9: Pareto chart for the effects on resolution
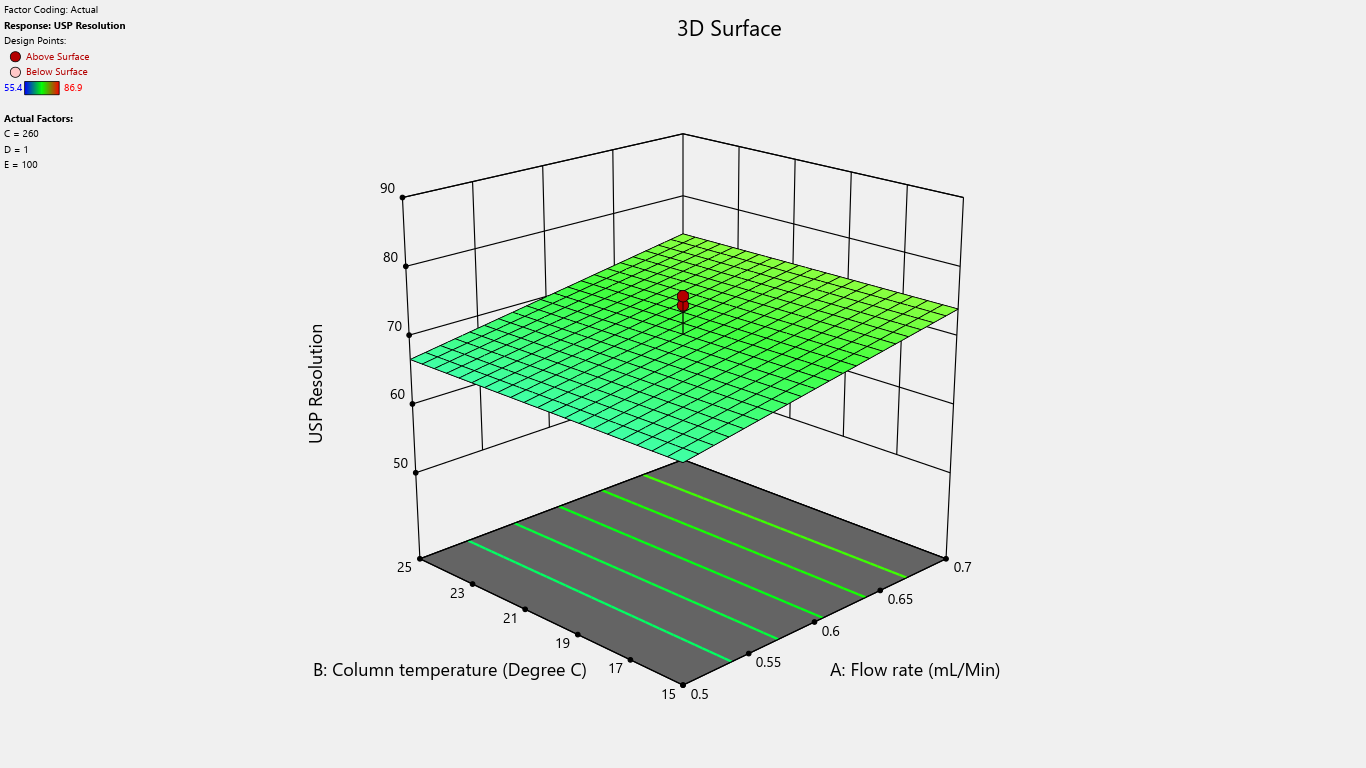
Fig. 10: 3D surface response plot for the effects on resolution
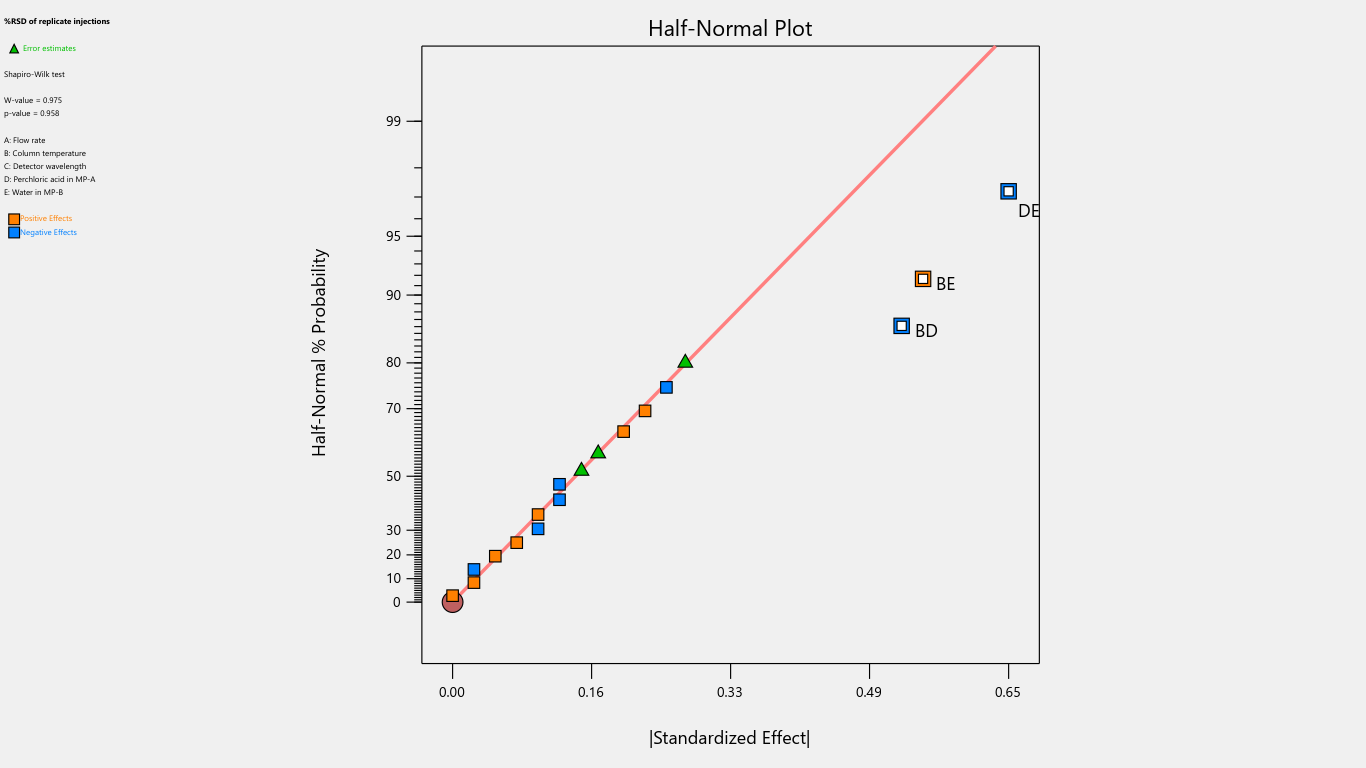
Fig. 11: Half-normal plot for the effects on % RSD of replicate injections
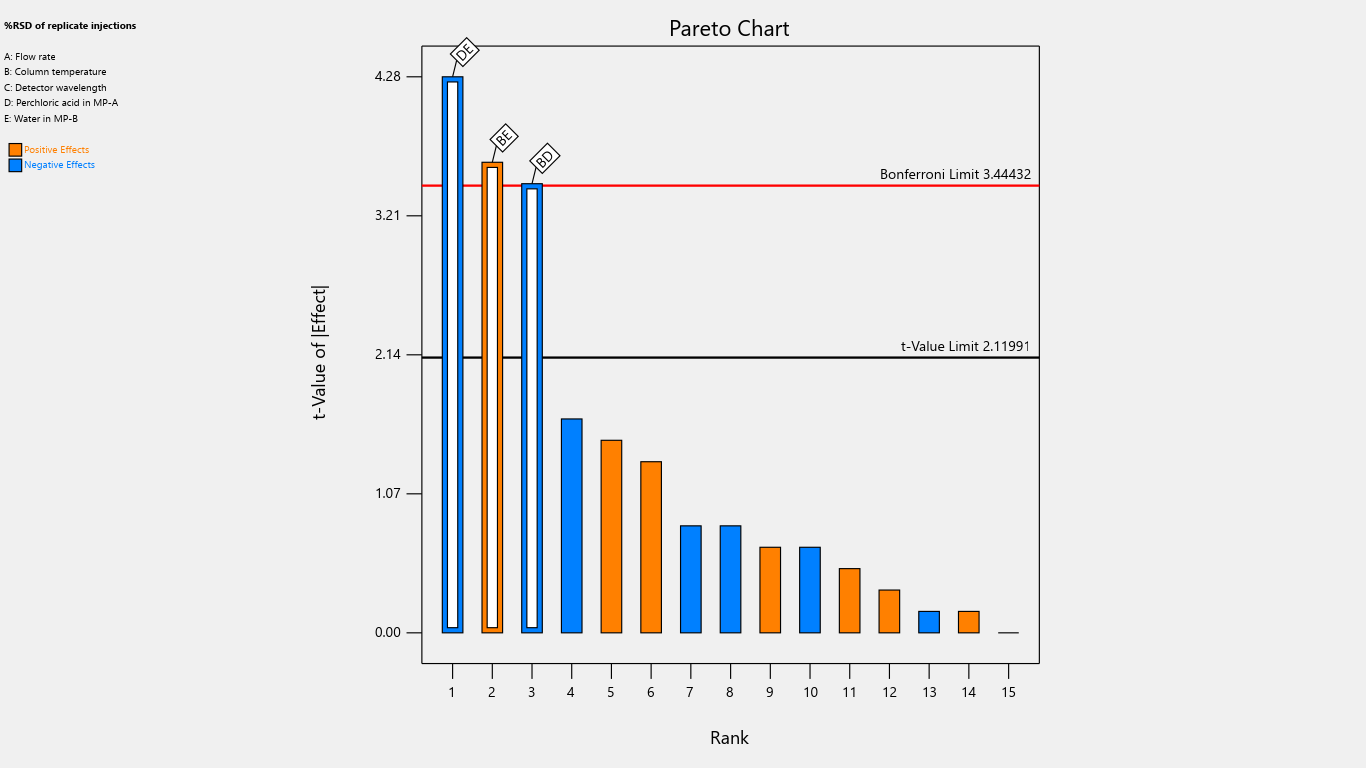
Fig. 12: Pareto chart for the effects on % RSD of replicate injections
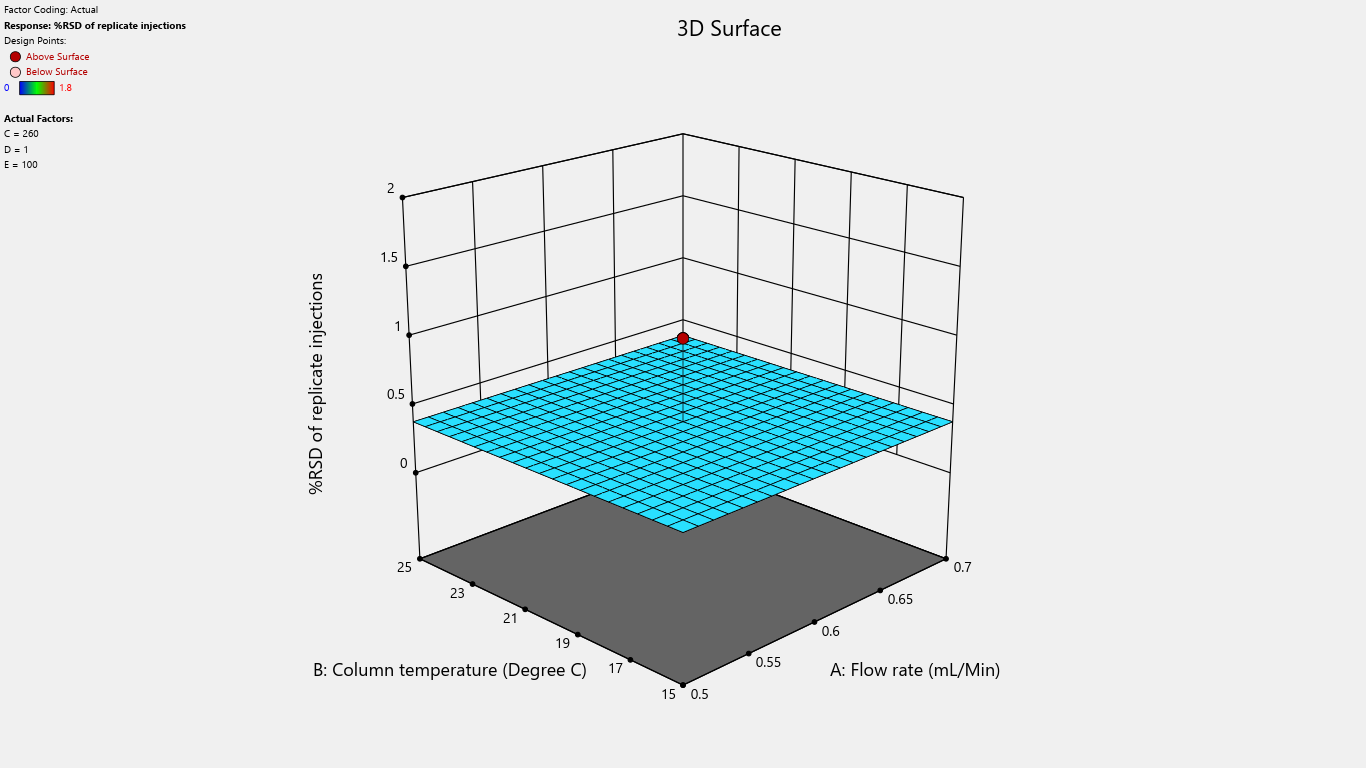
Fig. 13: 3D surface response plot for the effects on % RSD of replicate injections
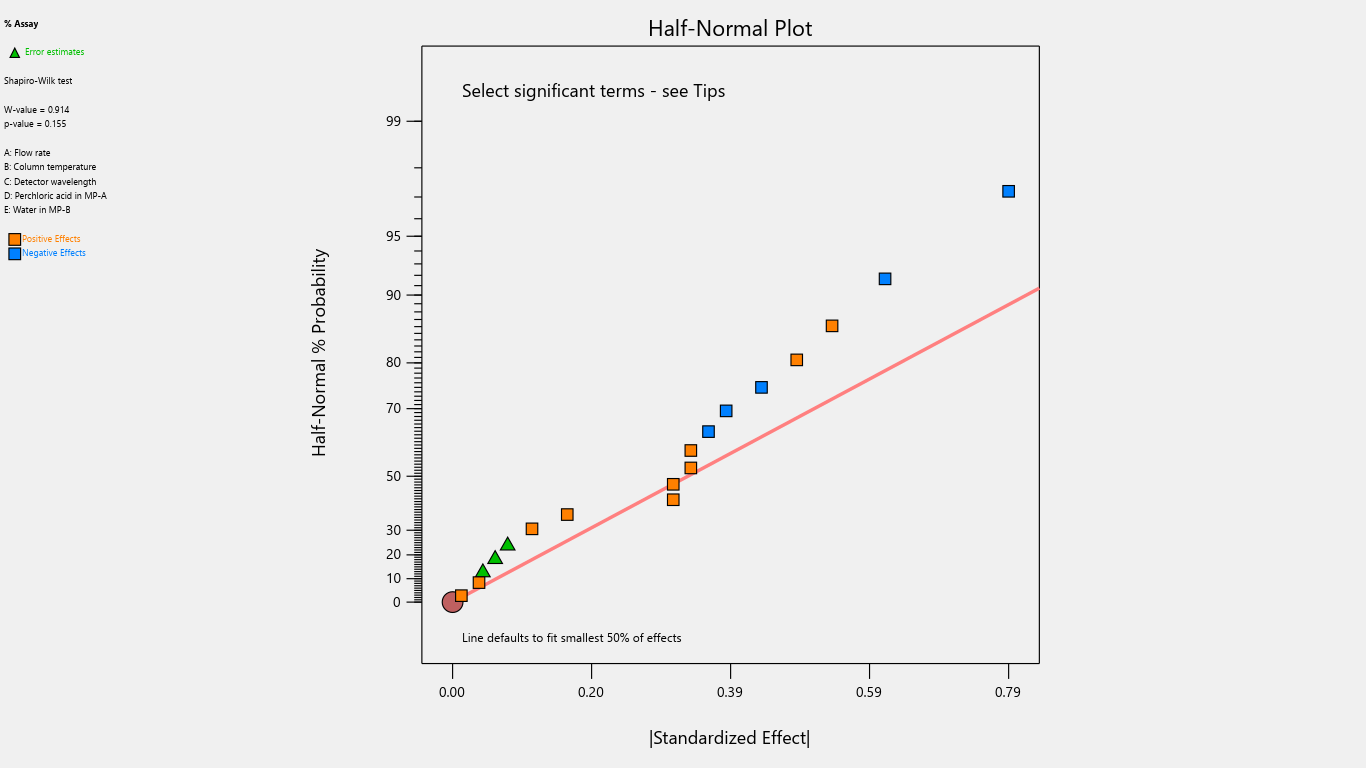
Fig. 14: Half-normal plot for the effects on % assay
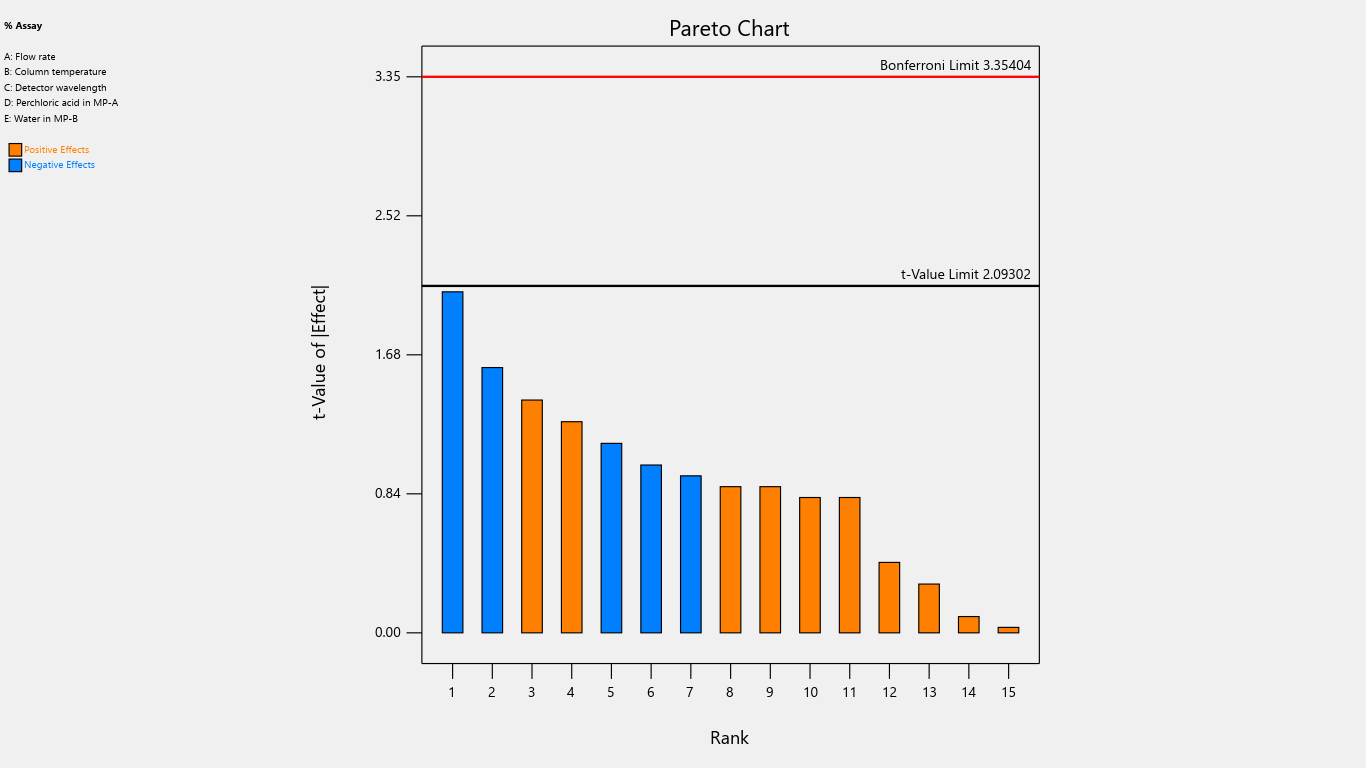
Fig. 15: Pareto chart for the effects on % assay
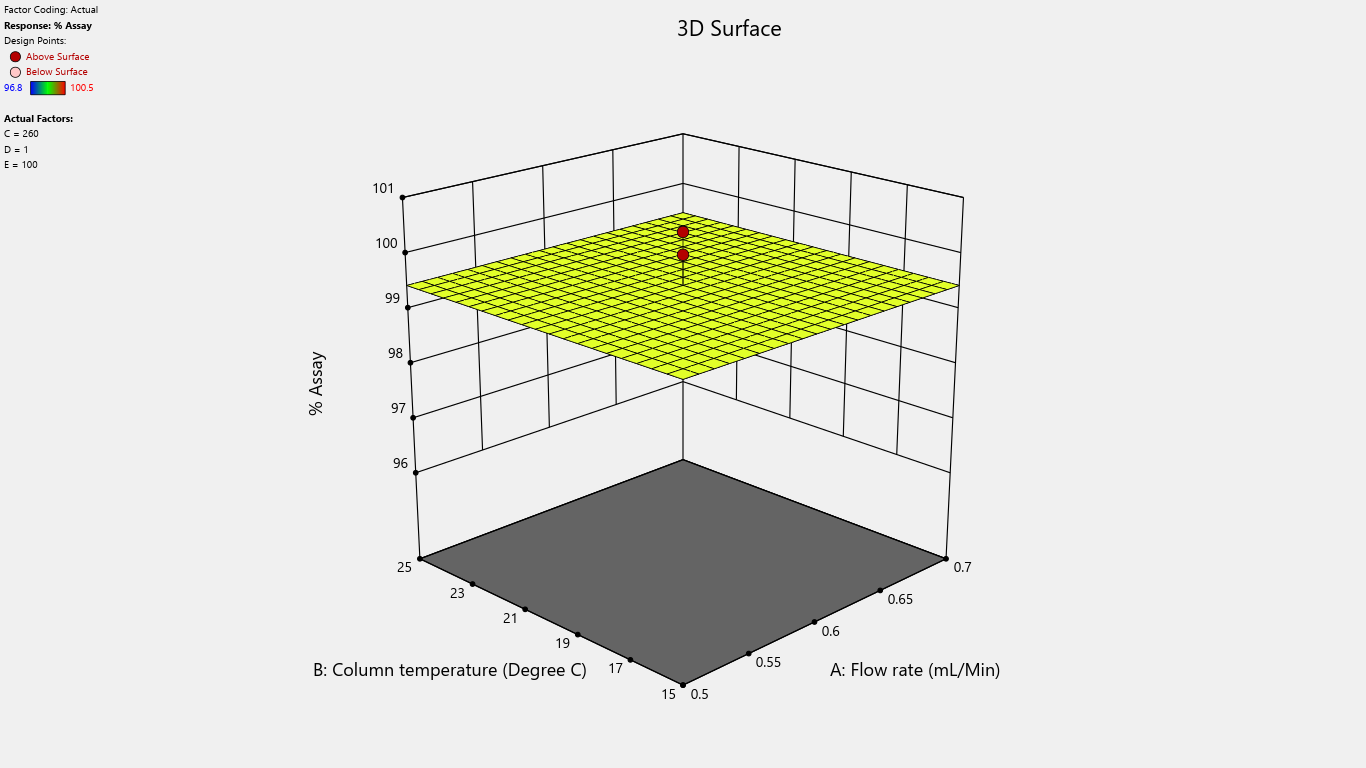
Fig. 16: 3D surface response plot for the effects on % assay
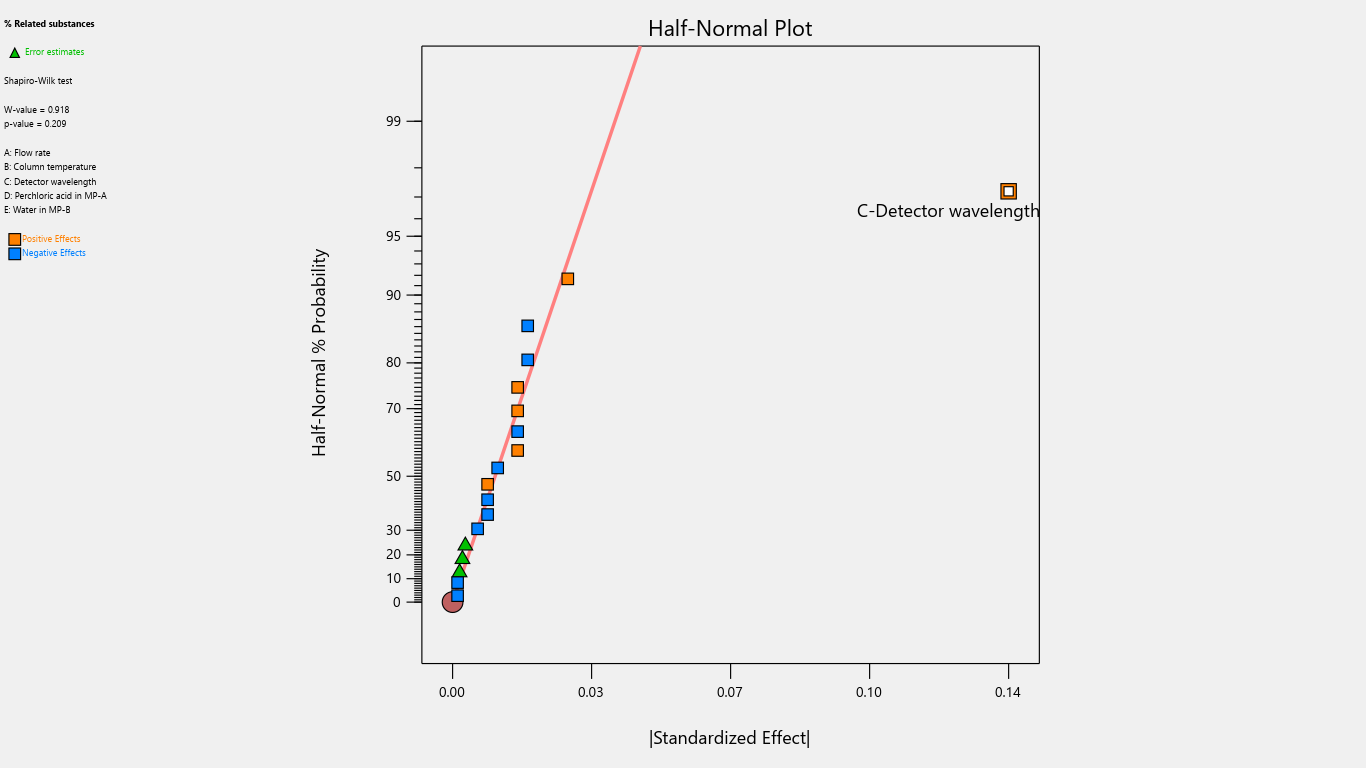
Fig. 17: Half-normal plot for the effects on % related substances
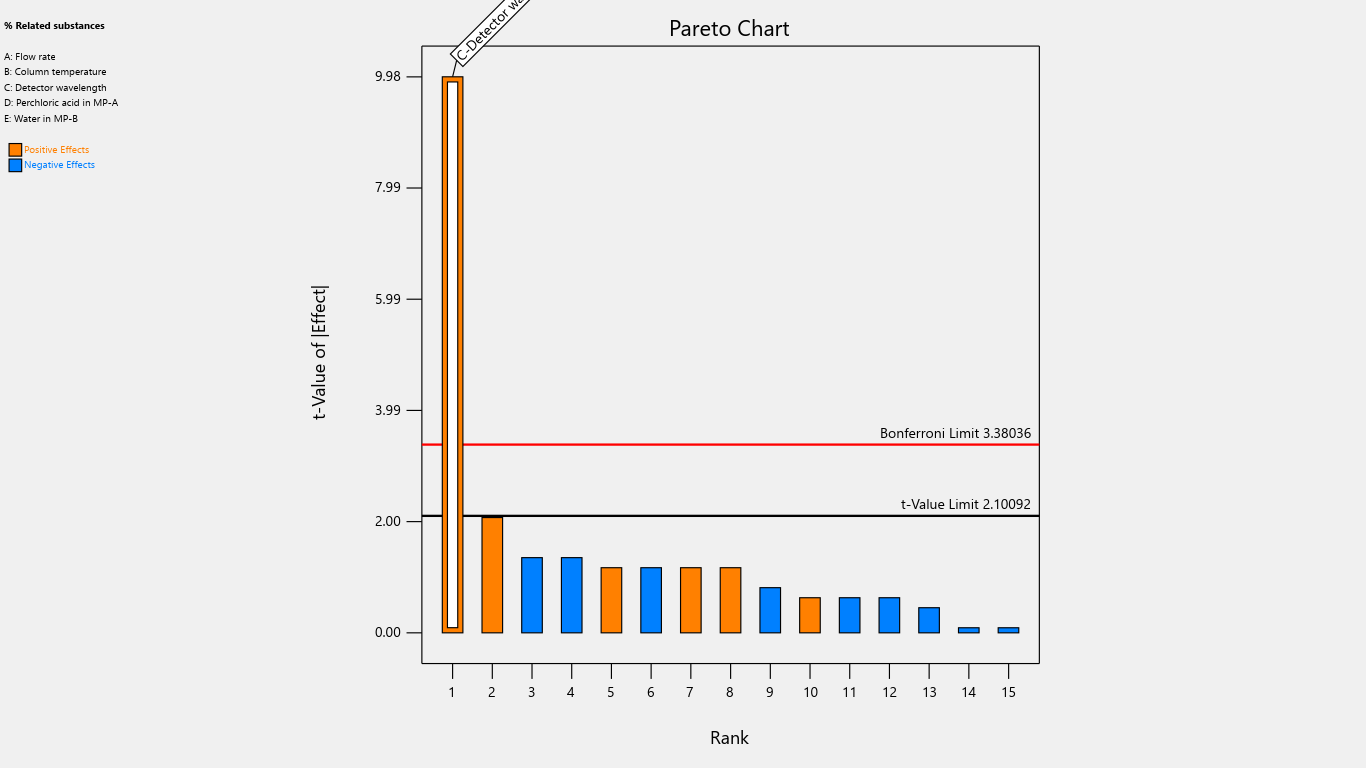
Fig. 18: Pareto chart for the effects on % related substances
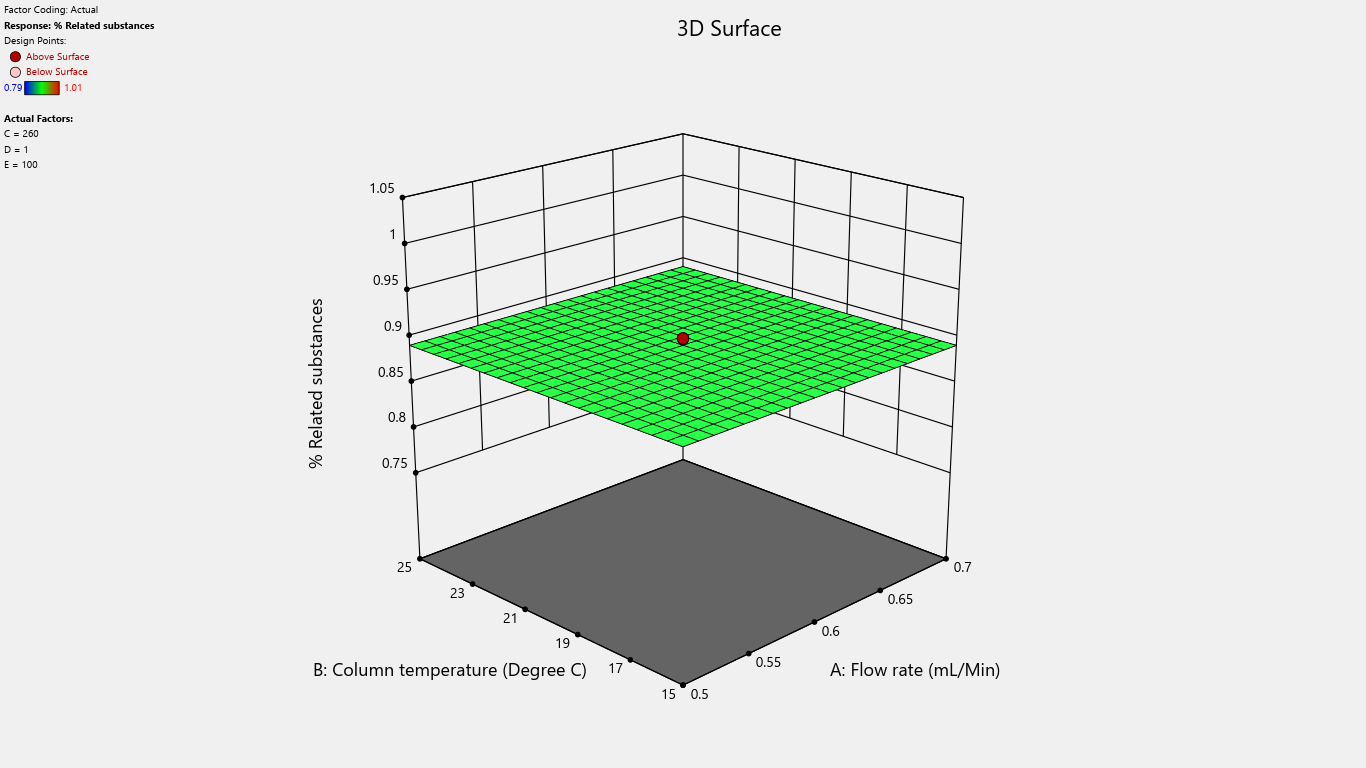
Fig. 19: 3D surface response plot for the effects on % related substances
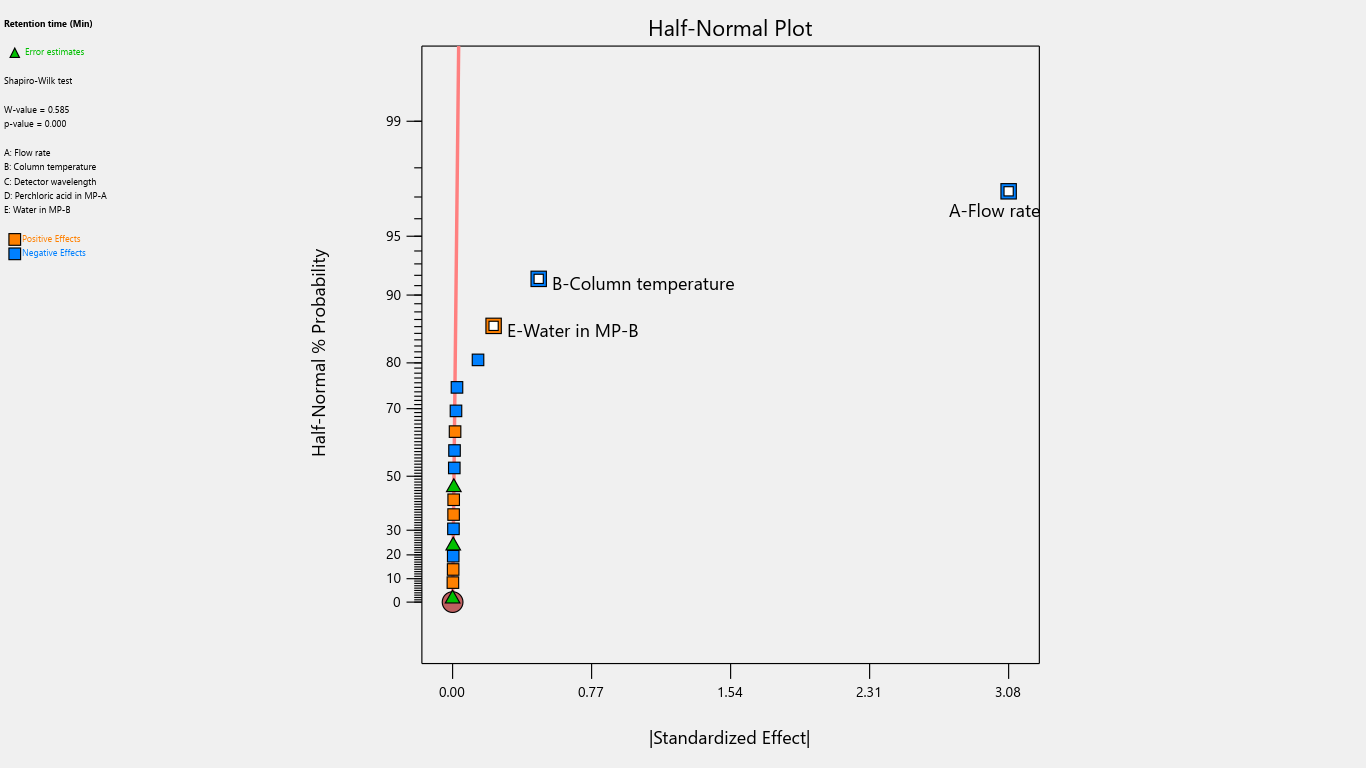
Fig. 20: Half-normal plot for the effects on retention time
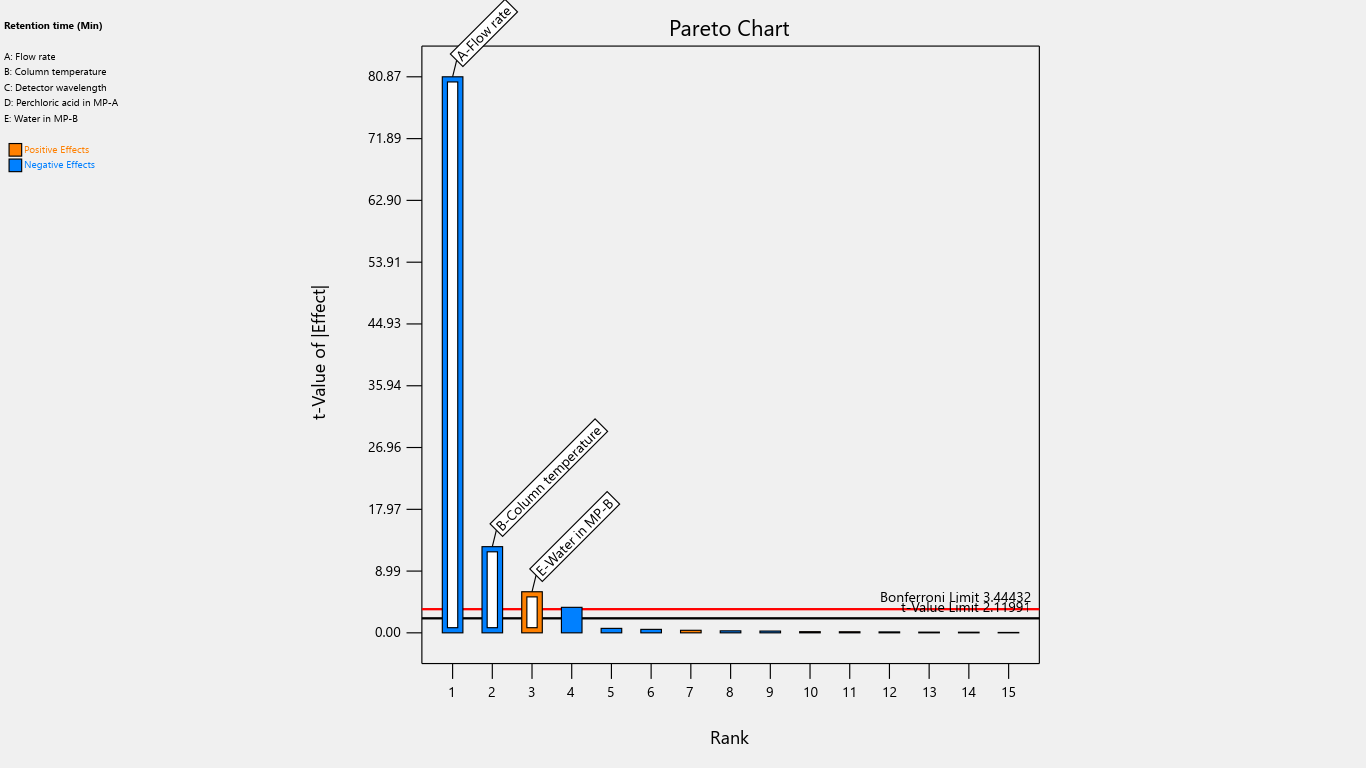
Fig. 21: Pareto chart for the effects on retention time
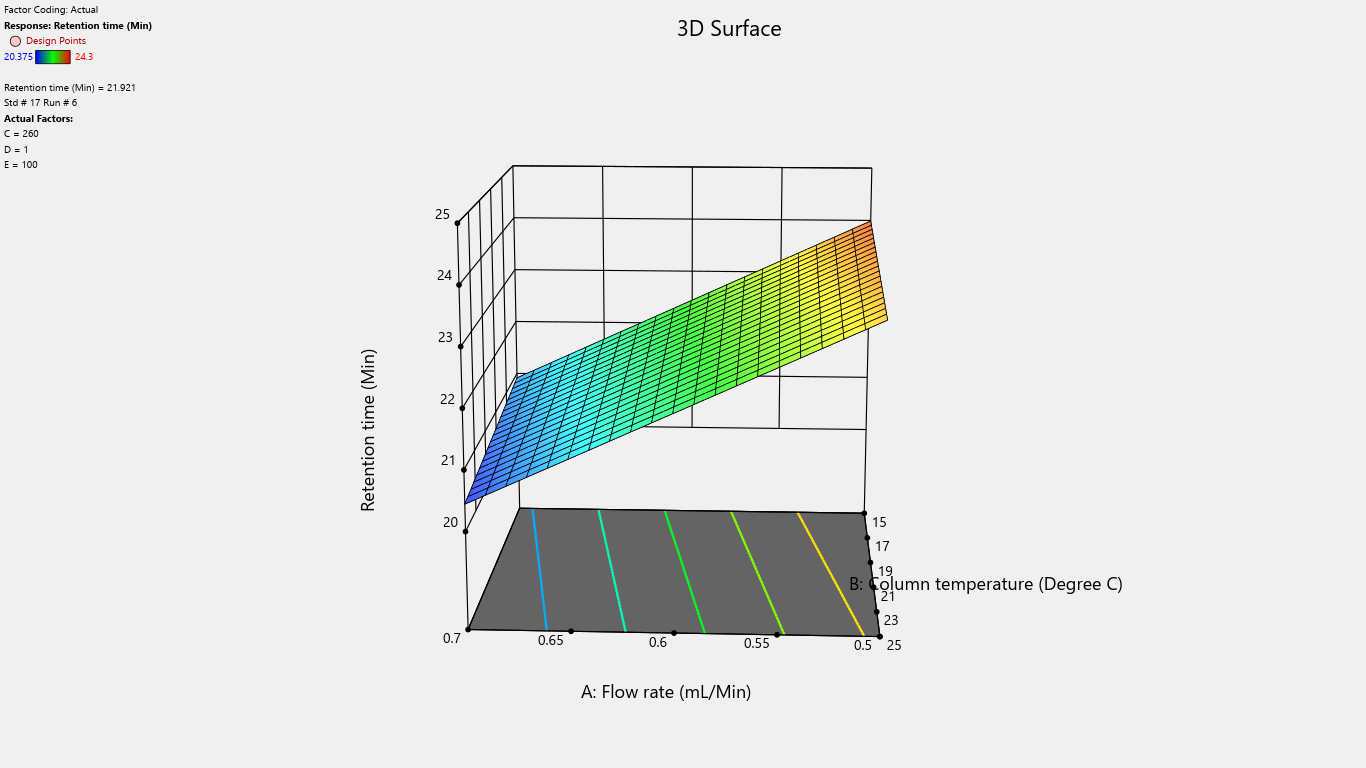
Fig. 22: 3D surface response plot for the effects on retention time
Risk assessment and control strategy
The AQbD process began with a comprehensive risk assessment [fig. 23], encompassing identification, evaluation, and analysis [27, 28]. This initial stage involved establishing Critical Analytical Attributes (CAAs) and Critical Method Parameters (CMPs) to inform design space studies and facilitate risk evaluation. To assess robustness and ruggedness, the method's performance was evaluated under diverse conditions, including varying laboratories, chemicals, analysts, instruments, reagents, and days. The results showed satisfactory outcomes with minimal risks. By integrating quality-by-design principles into method development, a more reliable and resilient method is ensured, thanks to proactive risk assessment and mitigation. This approach surpasses traditional methods, which may neglect potential vulnerabilities.
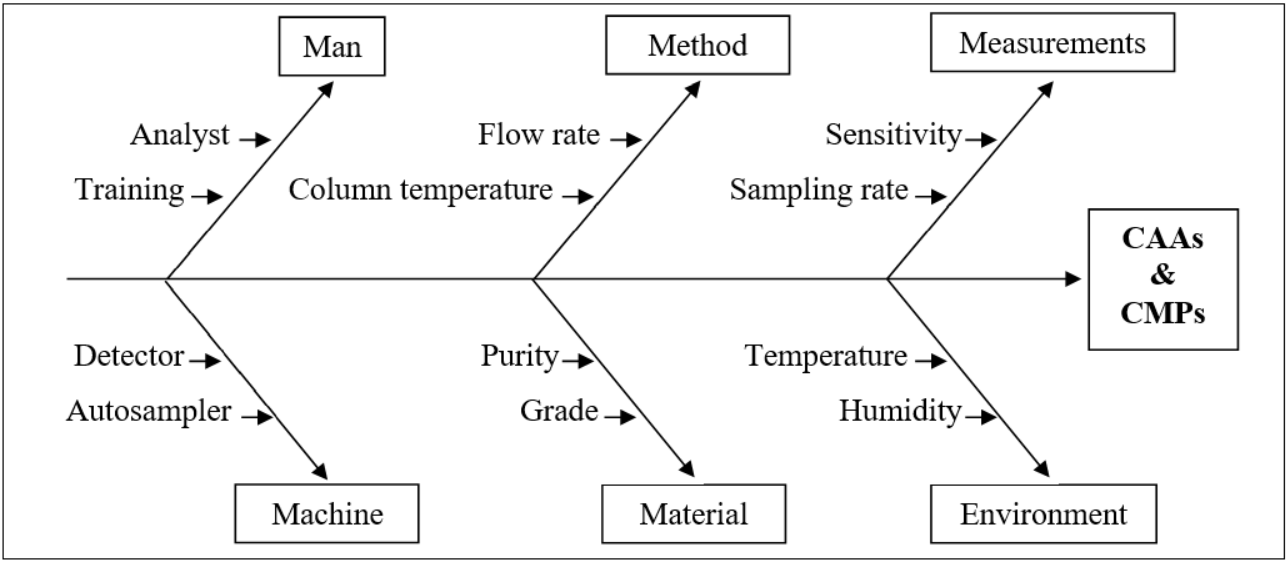
Fig. 23: Ishikawa fishbone diagram
To ensure the method's ongoing performance and result quality, a control strategy was implemented, aligned with the ATP. This proactive approach encompasses a deliberate set of controls for specific parameters, confirming that method execution and results consistently meet predefined standards.
Validation study of analytical method
Specificity
For the study of specificity, diluent was used as blank, weighed accurately about 40 mg of MPV standard and sample, and transferred into two separate 100 ml volumetric apparatus for the preparation of reference solution and sample solution. Added 90 ml of diluent in each flask and sonicated to dissolve completely. The flasks were made up to the mark with diluent and mixed thoroughly to achieve the 0.40 mg/ml concentration. Stress studies were conducted to demonstrate the stability indicating the nature of the analytical method.
Forced degradation study
A forced degradation study [29] was carried out by preparing and analyzing the blank (diluent) solution, standard solutions, and sample solutions as per the analytical method. Degradation agents were added separately to the sample. Degradation agents were Hydrochloric acid (Acid degradation), Sodium hydroxide (Base degradation), Hydrogen peroxide (Oxidative degradation), Heat, Humidity at about 75-80% RH and Photolytic degradation.
Weighed accurately about 40 mg of MPV sample and transferred in a 100 ml volumetric flask for the preparation of the untreated sample. Added 90 ml of diluent to the flask and sonicated to dissolve completely. Made up to the mark with diluent and mixed well to achieve the 0.40 mg/ml concentration.
Acid degradation
Weighed accurately about 40 mg of MPV sample and transferred to a 100 ml volumetric flask. About 5 ml of diluent was added to sonicate the sample for dissolution. Further, 1.0 ml of 2 N Hydrochloric acid was added. After addition, the acid degradation sample was placed at room temperature for 15 min. After 15 min, neutralize the solution with 1.0 ml of 2 N Sodium hydroxide. Made up to the mark with diluent and mixed well. The acid blank sample solution was prepared similarly.
Base degradation
Weighed accurately about 40 mg of MPV sample and transferred in a 100 ml volumetric flask. About 5 ml of diluent was added to sonicate the sample for dissolution. Then, 1.0 ml of 0.1 N Sodium hydroxide was added, and the solution was kept at room temperature for around 15 min. Afterwards, the neutralization of the solution was made with 1.0 ml of 0.1 N Hydrochloric acid and made the volume up to 100 ml with the help of diluent and mixed well. Similarly, the preparation of the base blank solution was followed.
Peroxide degradation
Weighed accurately about 40 mg of MPV sample and transferred in a 100 ml volumetric flask About 5 ml of diluent was added to sonicate the sample for dissolution. Further, 5.0 ml of 3% Hydrogen peroxide was added. The solution was kept at room temperature for 24 h at dark. After being kept for 24 h the solution was diluted to fill up to the mark and mixed well. Peroxide blank solution was prepared similarly.
Heat degradation
A sample weighing approximately 500 mg was subjected to 105 °C for 24 h. After exposure, weighed accurately about 40 mg of MPV sample and transferred into a 100 ml volumetric flask. Added about 90 ml diluent and sonicated until the sample was dissolved completely. The solution was diluted to fill up to the mark and mixed well.
Photolytic degradation
In a photostability chamber, 500 mg of the sample (exposed and control) were exposed to an overall illumination of not less than 1.2 million lux h and an integrated near ultraviolet energy of not less than 200-watt h/m2. After exposure, weighed accurately about 40 mg of the MPV sample and transferred into a 100 ml volumetric flask. Added about 90 ml diluent and sonicated until the sample was dissolved completely. The solution was diluted to fill up to the mark and mixed well. Both the photo exposure and photo control samples were prepared similarly.
Humidity degradation
The sample was exposed at about 75-80 % RH for 24 h and withdrawn after 24 h. After exposure, weighed accurately about 40 mg of the MPV sample and transferred into a 100 ml volumetric container. Added about 90 ml diluent and sonicated until the sample was dissolved completely. The solution was diluted to fill up to the mark and mixed well.
Identification of major degradant and illustration of degradation pathway
MPV-stressed samples were analyzed to identify degradants using the proposed method after an appropriate stress period. The m/z values of detected peaks were determined using the UFLC-MS technique. These observed m/z values helped to confirm the possible structures of the major degradants. After isolation, Bruker Ultra shield (400 MHz) spectrometer was utilized to record the 1H-NMR and 13C NMR spectra, with deuterated DMSO used as a solvent and Tetramethyl silane (TMS) used for the internal standard to ensure the structure. The measured data of FT-IR was collected from the Perkin Elmer Model Spectrum-100 instrument by using the KBr pellet method. The degradation pathway was elucidated based on the identified structures of the degradants.
Limit of detection
In the study of the limit of detection, blank (diluent) solution, standard solutions, and LOD solution (0.015% w. r. t. sample concentration) were prepared from the solution of 0.40 mg/ml i. e. standard solution, dilution was made by diluting 5.0 ml of standard solution to 100 ml and made upto the mark with the diluent to maintain the concentrations of 0.02 mg/ml. Similarly, 1.0 ml of the resultant solution was diluted to 100 ml and further diluted 3.0 ml of the above solution to 10 ml to achieve the concentration of 0.00006 mg/ml. After preparing the solutions, the solutions were injected into the system.
Limit of quantification
For the study of the limit of quantification, blank (diluent) solution, standard solutions, and LOQ solution (0.05% w. r. t. sample concentration) were prepared and analyzed as per the analytical method. The standard solution (0.40 mg/ml) was utilized for the preparation of LOQ solution by diluting 5.0 ml of the above solution to 100 ml and volume was made to the mark with diluent to obtain the concentration of 0.02 mg/ml. Similarly, the concentration of 0.0002 mg/ml was prepared by diluting the 1.0 ml of the above solution in a 100 ml volumetric flask with diluent.
Linearity
A stock solution was prepared by weighing accurately about 100 mg of MPV standard and transferred in a 100 ml volumetric flask and the volume was filled to the mark with diluent and mixed well to obtain the concentration of 1.0 mg/ml. Further 2, 3, 4, 5, and 6 ml were taken out from the stock solution to achieve the series of standard concentrations of 200 ppm (50 %), 300 ppm (75 %), 400 ppm (100 %), 500 ppm (125 %) and 600 ppm (150 %).
Method precision/Repeatability
For the study of this parameter blank (diluent) solution, standard solutions and repeatability sample solutions were prepared as per the analytical method. The sample solutions of 0.40 mg/ml of MPV were prepared in six replicates as described previously in the “preparation of sample solution” and injected into the chromatographic system, obtained data were calculated and reported.
Intermediate precision
Intermediate precision is expressed within laboratory precision carried out by different analysts with various instruments by using different columns of the same make but different serial numbers. Blank sample (diluent) solution, and reference standard solutions were prepared as per the analytical method. Six replicates of 0.40 mg/ml of MPV sample solutions were prepared as described in “preparation of sample solution”. After preparing the samples it was injected into the chromatographic system and the obtained values were calculated.
Accuracy (%Recovery)
A percentage recovery study was conducted to validate the current method. Sample solutions were prepared at three different levels i. e. at 50 %, 100 %, and 150 % level. For each recovery level, three sample solutions were prepared. For the 50 % recovery study, 20 mg of the MPV sample was taken into a 100 ml volumetric flask. Around 90 ml of diluent was poured, and the solution was sonicated to dissolve completely. Then the solution was diluted with a sufficient solvent to be filled with up to the mark to achieve a final concentration of 0.20 mg/ml. For the 100 % recovery study, approximately 40 mg of the MPV sample was accurately weighed and transferred into a 100 ml volumetric flask. About 90 ml of diluent was added, and the solution was sonicated until fully dissolved. The solution was diluted to the mark with diluent and mixed thoroughly to achieve a final concentration of 0.40 mg/ml. A 100 ml volumetric flask was filled with precisely weighed 60 mg of MPV sample to prepare the sample for a 150 % recovery trial. To reach the final concentration of 0.60 mg/ml, 90 ml of diluent was added, and sonicated to dissolve it entirely, and the capacity was filled up to the mark with diluent. Triplicates preparation of samples at each concentration were prepared and injected into the chromatographic system, obtained data were calculated and reported.
Stability of analytical solutions
For establishing the stability study of analytical solutions, standard solution, and sample solution were prepared at the concentrations of 0.40 mg/ml as described earlier and injected as per the analytical method. The prepared solutions were initially analyzed immediately after preparation. The solutions were allowed to stand at room temperature for 48 h. After the desired stability period, specifically after 24 and 48 h, the standard and sample solutions were further analyzed for their contents.
RESULTS
Design of experiments
This study employed the AQbD approach to develop a robust analytical method. Through rigorous examination and statistical analysis, including principal component analysis, we identified and evaluated critical method parameters. The key outcomes of this investigation are summarized in table 5.
Table 5: Summary of interactions (factors versus responses)
| Responses | Factors |
| A | |
| Tailing factor | √ |
| Theoretical plates | x |
| Resolution | √ |
| % RSD of injections | x |
| % Assay | x |
| % Related substances | x |
| Retention time | √ |
A: Flow rate, B: Column temperature, C: Detector wavelength, D: Perchloric acid in mobile phase-A, E: Purified water in mobile phase-B, √: Impact, x: No impact
Flow rate significantly impacted the tailing factor, resolution, and retention time. Column temperature substantially affected the tailing factor and retention time. Detector wavelength impacted the results of related substances. The proportion of perchloric acid in mobile phase A significantly impacted the peak tailing, theoretical plates, and resolution. % RSD of replicate injections was impacted by the collective interactions of column temperature along with the volume of perchloric acid and volume of purified water. The volume of perchloric acid and volume of purified water together impacted the tailing factor and % RSD of replicate injections. The rest other interactions were statistically insignificant.
The method was validated according to ICH Q2 (R2) guidelines, ensuring its reliability and acceptance. In the present method, the separation of MPV along with its degradants was achieved using the XBridge BEH Shield RP18 (250 mm x 4.6 mm, 3.5 µm) column by considering the detector wavelength of 260 nm. The flow rate was maintained at 0.6 ml/min, considering the column temperature of 20 °C. The run time was kept at 45 min. A gradient elution technique was adopted to achieve the chromatograms of MPV along with its degradants using the combined mobile phase (A: B) [0.1 % v/v Perchloric acid (70 %) in water (A), and purified water: acetonitrile (10:90 % v/v) (B)] in a programmed time interval. At 0.01 min, mobile phase A (100 %): mobile phase B (0 %), at 8 min, mobile phase A (100 %): mobile phase B (0 %), at 22 min, mobile phase A (60 %): mobile phase B (40 %), at 30 min mobile phase A (20 %): mobile phase B (80 %), at 35 min mobile phase A (15 %): mobile phase B (85 %), at 37 min mobile phase A (100 %): mobile phase B (0 %), at 45 min mobile phase A (100 %): mobile phase B (0 %) to saturate the column for next injection. The retention time of MPV was at 23.3 min. The chromatograms of the standard and sample are shown in fig. 24A and fig. 24B.
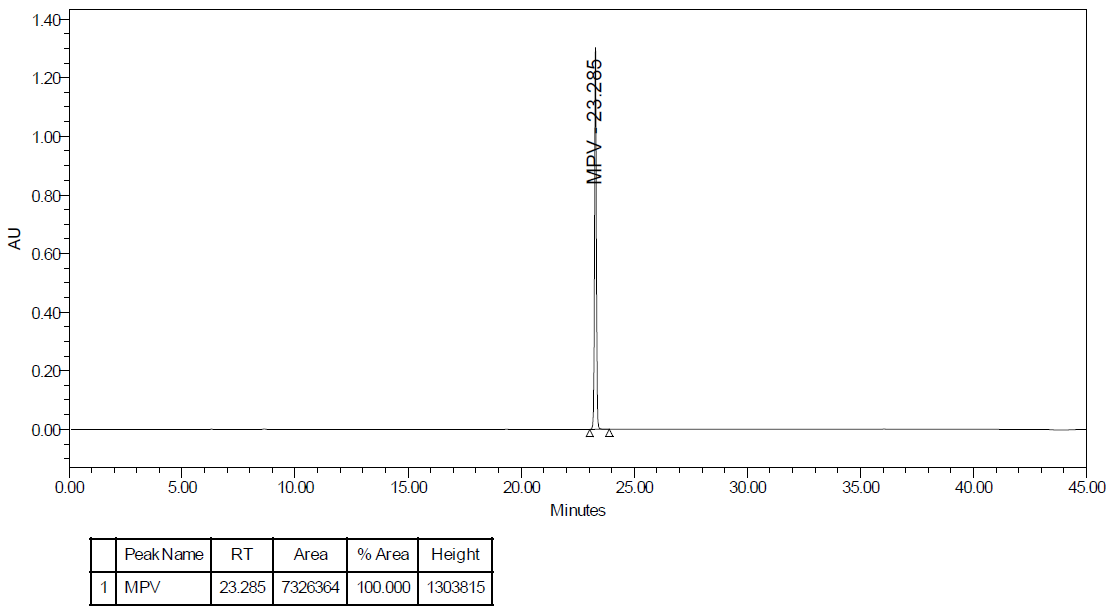
Fig. 24A: Standard chromatogram of molnupiravir
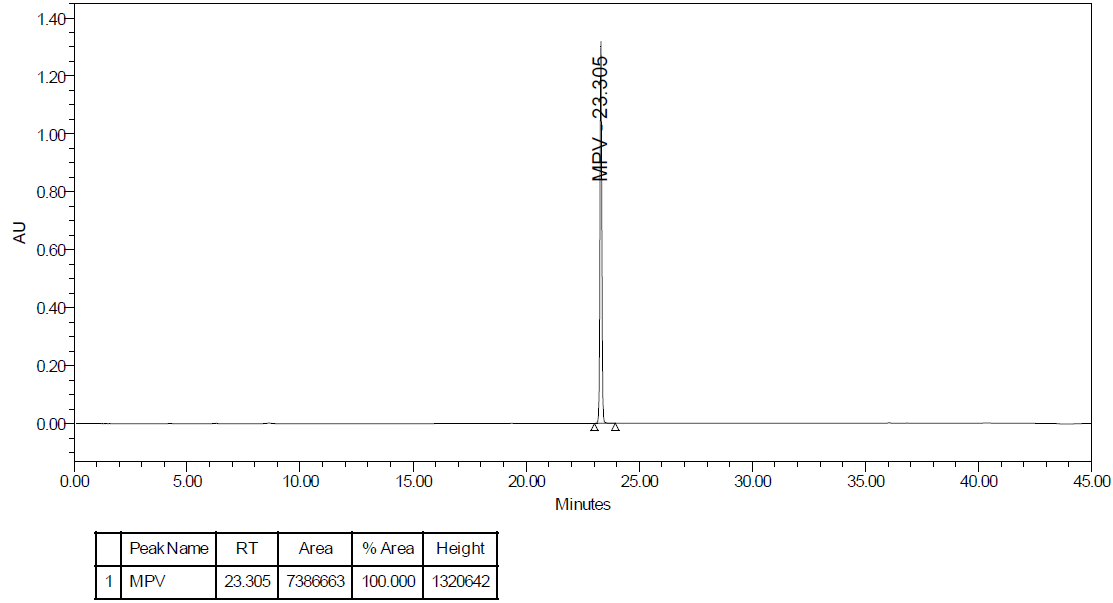
Fig. 24B: Standard chromatogram of molnupiravir
Table 6: Forced degradation study
| Degradation types and condition | % Degradation | % Assay | Purity angle | Purity threshold |
| Acid degradation (2 N HCl at room temp. for 15 min) | 19 | 80.5 | 0.282 | 0.488 |
| Base degradation (0.1 N NaOH at room temp. for 15 min) | 44 | 56.0 | 0.201 | 0.285 |
| Peroxide degradation (3 % H2O2 at room temp. for 24 h) | 3 | 97.0 | 0.406 | 1.053 |
| Heat degradation (105 °C for 24 h) | 0 | 99.4 | 0.457 | 1.026 |
| Photolytic degradation (1.2 million lux hour and near UV at 200-watt h/m2): | 0 | 99.2 | 0.438 | 0.950 |
| Humidity degradation (75-80 % RH for 24 h) | 0 | 99.3 | 0.466 | 1.000 |
Forced degradation studies
No interfering peaks were found at the MPV retention period in the specificity study. In the acid degradation study the percentage assay was found 80.5 %, with a degradation study of 19 %. In the study of base and peroxidation degradation, the percentage assay was 56.0 % and 97.0 %, respectively; the percentage degradation was 44 % and 3 %. In the study of heat, photolytic, and humidity degradation study, no degradation was found. The details of the results are given in table 6 and fig. 25A to fig. 25F.
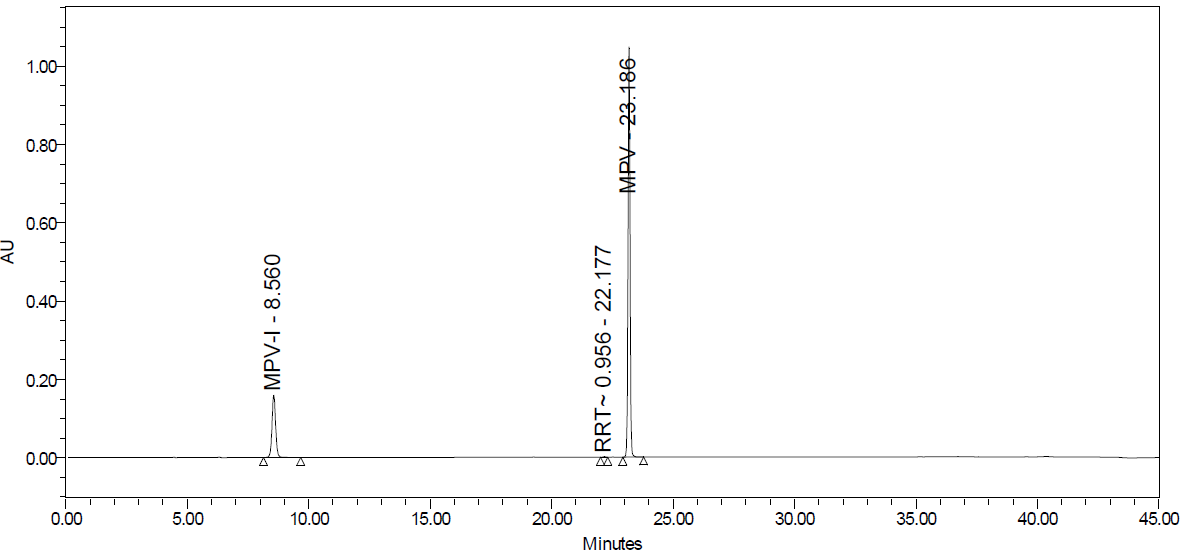
Fig. 25A: Acid degradation
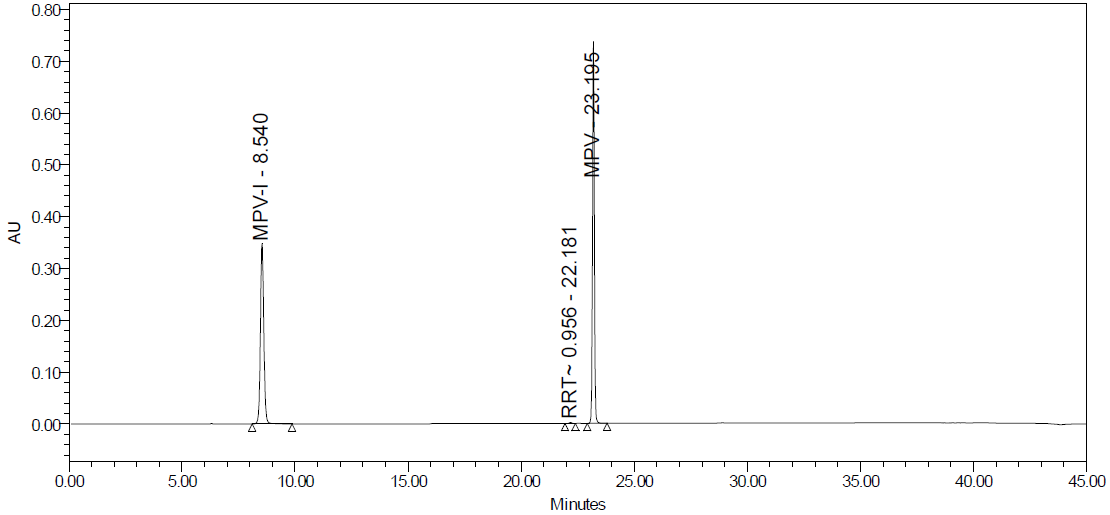
Fig. 25B: Base degradation
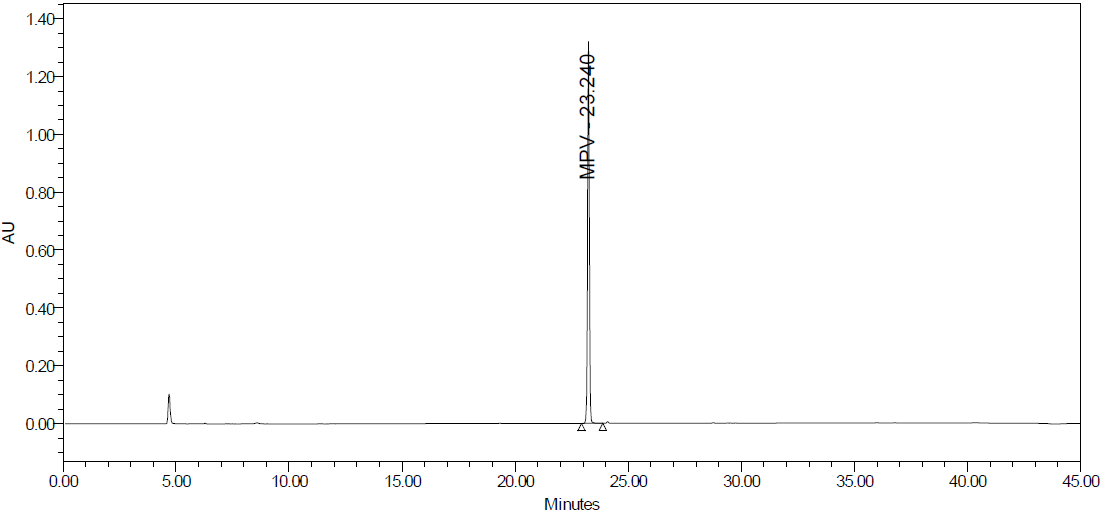
Fig. 25C: Peroxide degradation
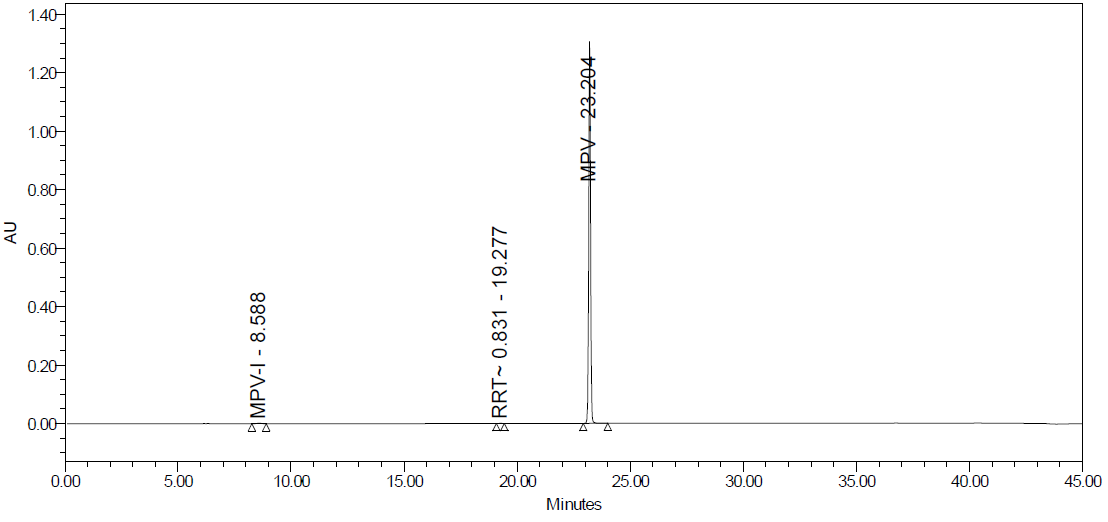
Fig. 25D: Heat degradation
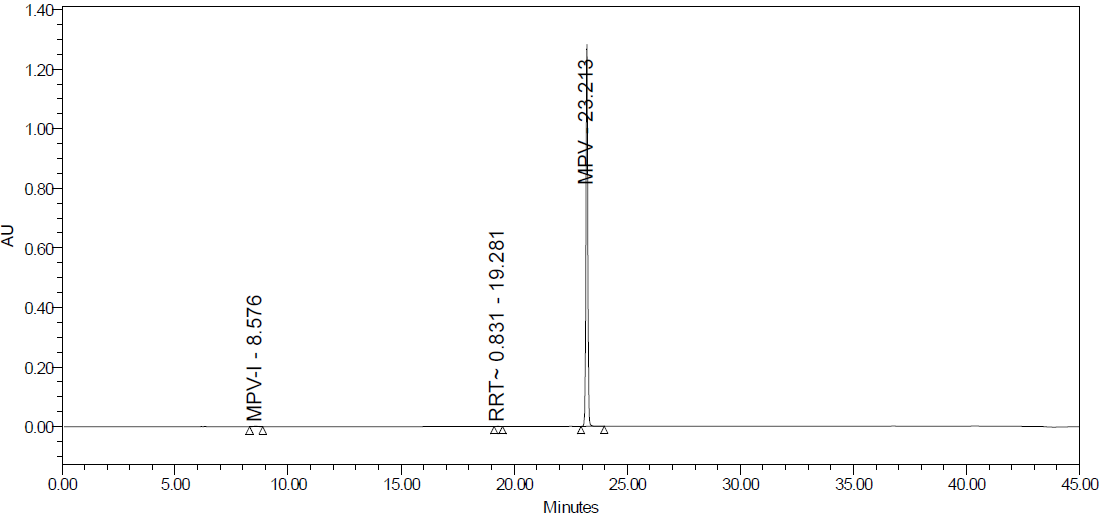
Fig. 25E: Photolytic degradation
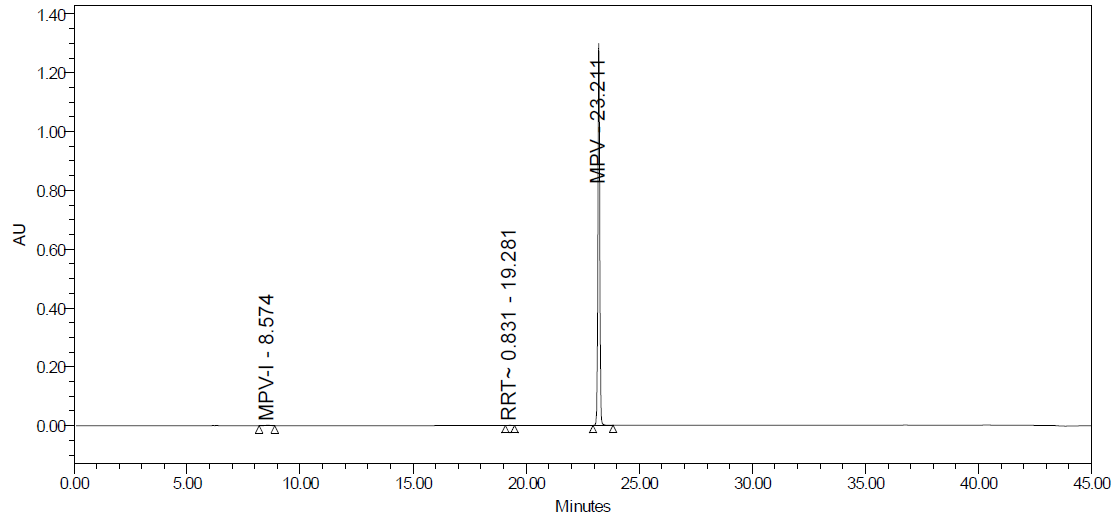
Fig. 25F: Humidity degradation
Degradation products are the impurities that arise from chemical changes during drug manufacturing, storage, and transportation. These changes can be triggered by various factors, including environmental conditions (light, temperature, pH, humidity), inherent characteristics of the active pharmaceutical substance, and interactions with excipients or packaging materials. The presence of these impurities can compromise product safety and quality. Degradation pathways play a vital role in drug development. They map out the various routes by which an analyte can degrade under different stress conditions. Furthermore, these pathways explain how a drug molecule breaks down into degradants, which can affect the drug's stability. Understanding these processes is crucial for ensuring the efficacy and safety of pharmaceutical products. The major degradant of MPV in the force degradation study was identified as 3,4-dihydroxy-5-(hydroxymethyl) tetrahydrofuran-2-yl)-4-(hydroxyamino) pyrimidine-2 (1H)-one, with the molecular weight of 259.22 g/mol and the molecular formula of C9H13N3O6 fig. 26, eluted at 8.6 min.
Fig. 26: Identified chemical structure of the major degradant obtained during degradation
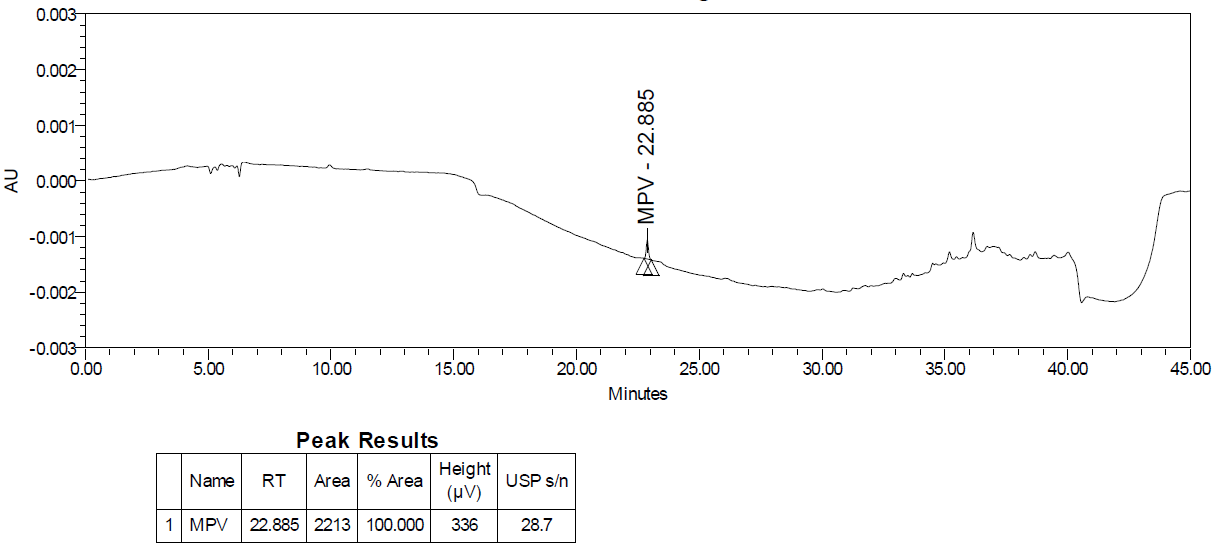
Fig. 27A: LOD chromatogram of molnupiravir
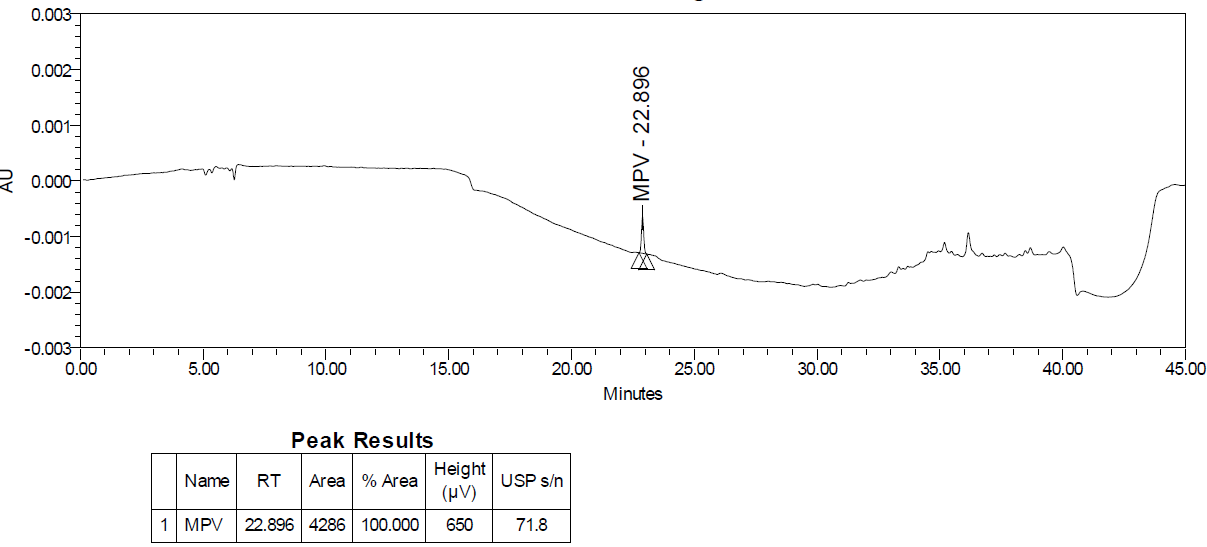
Fig. 27B: LOQ chromatogram of molnupiravir
The linearity study fig. 28 revealed a correlation coefficient (r) of 0.999, indicating excellent linearity, with a residual standard deviation of 16707.4.
Validation parameters
As per the ICH Q2(R2) guideline, a signal-to-noise ratio greater than three is generally considered acceptable for estimating the limit of detection and for the limit of quantitation, a ratio of at least ten is considered acceptable. The limit of detection fig. 27A was 0.02 % w. r. t. sample concentration with a signal-to-noise ratio of 29 and the limit of quantitation fig. 27B was found 0.05 % concerning sample concentration with the signal-to-noise ratio of 72 that complies with the requirements of regulatory guidelines.
As per the guideline, six determinations were tested at the quantitation level where % RSD of six injections was 2.2 %, confirming the preciseness of the analytical method at the LOQ level is in line with the analytical target profile.
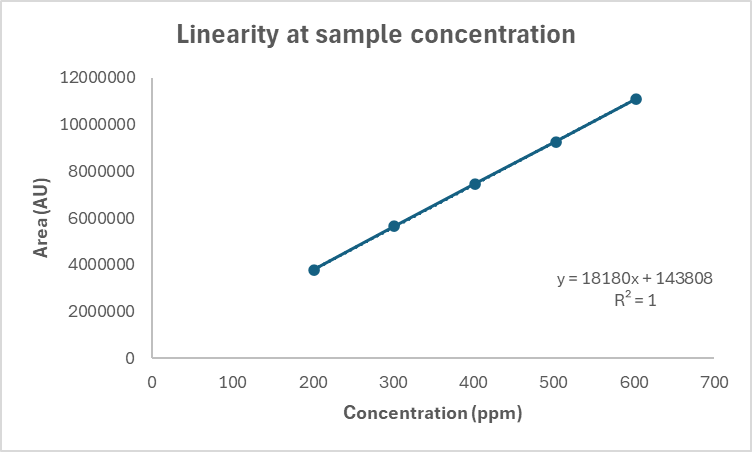
Fig. 28: Linearity study of molnupiravir,
% RSD of replicate results in repeatability and intermediate precision were found to be 0.2 and 0.9, respectively. Accuracy study results for assay at 50 %, 100 %, and 150 % was found between 99.2-101.4 % with the % RSD of 0.2, 0.1, and 0.2 at each level respectively. The range of the present analytical method was found to be 50 to 150 % of the nominal sample concentration. The analytical solutions were found to be stable for up to 48 h at room temperature in clear glassware. The details and outcomes of the validation parameters are cited in table 7.
Table 7: Details of the validation study results
| S. No. | Parameters | Results | ||||||||||||||||||||||||||||||||||||||||
| 1. | System suitability | Tailing factor: 0.9 Theoretical plates: 261112 % RSD: 0.2 |
||||||||||||||||||||||||||||||||||||||||
| 2. | Specificity | No interfering peak was observed at the retention time of MPV in the blank. The peak due to MPV was found well resolved from other peaks. The resolution between the major degradant and MPV peak was 76.1 The purity angle is less than the purity threshold for MPV in Empower 3 software. |
||||||||||||||||||||||||||||||||||||||||
|
Forced degradation |
Refer table 6. | ||||||||||||||||||||||||||||||||||||||||
3. |
Limit of detection |
0.02 % w. r. t. sample concentration, S/N Ratio: 29 | ||||||||||||||||||||||||||||||||||||||||
4. |
Limit of quantification |
0.05 % w. r. t. sample concentration, S/N Ratio: 72, RSD = 2.2 % (6 replicate injections) | ||||||||||||||||||||||||||||||||||||||||
| 5. | Linearity | Correlation coefficient (r) = 0.9999 Y-Intercept = 143808 Slope = 18180 Residual standard deviation = 16707.4 Residual sum of squares = 837409574.3 |
||||||||||||||||||||||||||||||||||||||||
| 6. | Method Precision [Assay (% w/w)] | |||||||||||||||||||||||||||||||||||||||||
| Individual value (%) | 99.7, 99.6, 99.5, 99.9, 99.6, 99.3 | |||||||||||||||||||||||||||||||||||||||||
| % Mean±SD* | 99.6±0.2 (n=6) | |||||||||||||||||||||||||||||||||||||||||
| % RSD | 0.2 | |||||||||||||||||||||||||||||||||||||||||
| 7. | Intermediate Precision [Assay (% w/w)] | |||||||||||||||||||||||||||||||||||||||||
| Individual value (%) | 99.5, 99.8, 99.6, 100.0, 100.6, 96.8 | |||||||||||||||||||||||||||||||||||||||||
| % Mean±SD* | 99.4±1.3 (n = 6), 99.5±0.9 (n = 12) | |||||||||||||||||||||||||||||||||||||||||
| % RSD | 1.3 (n = 6), 0.9 (n = 12) | |||||||||||||||||||||||||||||||||||||||||
| 8. | Accuracy |
|
||||||||||||||||||||||||||||||||||||||||
| 9. | Solution stability | The standard and sample solutions are stable for 48 h when stored at room temperature in clear glass wares. | ||||||||||||||||||||||||||||||||||||||||
*All the values are expressed in mean±SD.
DISCUSSION
Historically, the pharmaceutical industry relied on the traditional "Quality by Testing" (QbT) approach. This method focused primarily on end-product testing to ensure quality and performance, with a limited understanding of the product, process, and critical process parameters. In recent years, regulatory bodies have shifted their focus to ensuring the quality, safety, and efficacy of products. To achieve this, they are promoting the adoption of “Quality by Design” (QbD), a science-based approach that emphasizes product and process understanding and “Process Analytical Technology” (PAT), tools that enable real-time monitoring and control of processes. By implementing QbD and PAT, manufacturers can reduce process variation, develop effective process control strategies, and ultimately produce better products. It means the design of specifications of raw material, packing material, and finished goods and the formulation design, process design, process parameters design, analytical method design, etc., is to be considered or designed scientifically by using the relevant and effective scientific tools i. e. Design of Experiments (DoE), to ensure that quality is integrated throughout the entire product lifecycle. QbD has become a widely adopted paradigm in the pharmaceutical industry, supplanting traditional approaches. By integrating QbD principles, manufacturers can minimize product variability and mitigate associated risks. In the context of product development, AQbD is implemented through a systematic process involving identifying critical analytical attributes, comprehensive risk assessment, and defining the design space. A stability-indicating HPLC method was developed for the simultaneous quantification of assay and degradation products of molnupiravir. This method employed a Quality-by-Design (QbD) approach [31, 32], utilizing Design Expert software (v13) to optimize the chromatographic conditions. The influence of five critical factors was systematically evaluated, including flow rate, column oven temperature, detection wavelength, perchloric acid volume in mobile phase-A, and purified water in mobile phase-B. The interactions between the key factors and their impact on various response factors were investigated by conducting twenty experimental runs as suggested by the software. The following response factors were assessed, and these were tailing factor, theoretical plates, resolution, % RSD of replicate standard injections, % assay, % related substances, and retention time.
Results displayed that flow rate significantly affects retention time, tailing factor, and resolution between the main analyte and degradant peak. However, this impact is mitigated through the use of qualified and calibrated instruments, ensuring no effect on final results. Column temperature, perchloric acid change in mobile phase-A and purified water change in mobile phase-B posed negligible risks, as these impacts are controlled by using calibrated instruments, ensuring no impact on assay/related substances percentage and product quality as well. As the detector wavelength has a significant impact on the quantification of related substances therefore, a change in detector wavelength is not recommended and the day-to-day variations are controlled by using calibrated instruments. Hence the risk is mitigated. The impact of other interactions is also eliminated by controlling the instrument parameters using the qualified and calibrated instrument, glassware and trained operator.
The separation of the analyte with its degradation products was successfully demonstrated with a satisfactory percentage of the assay and related substances. The utilized gradient programmed of the mobile phases was found satisfactory to separate the analyte and successfully validated the parameters. In the specificity study, the peak due to MPV was found well resolved from other peaks. The purity angle is less than the purity threshold for MPV in Empower 3 software. In the force degradation study, the major degradant peak obtained from acidic, alkaline and peroxide conditions were found well separated from the MPV peak and the purity angle was found to be less than the purity threshold for MPV for all the conditions. MPV was found stable in humidity, photolytic, and heat-stressed conditions. The percentage of degradation was found high in base-catalyzed degradation. The major degradant of MPV in the force degradation study was identified as 3,4-dihydroxy-5-(hydroxymethyl) tetrahydrofuran-2-yl)-4-(hydroxyamino) pyrimidin-2(1H)-one, which makes this present method more advantageous in terms of impurity determination. The results of the limit of detection and the limit of quantification prove the sensitivity of the present method, and the method can be utilized for the simultaneous determination of assay and degradation products. The method was also found linear with enough range of sample solutions. The obtained percent recovery of the developed method in all three studied levels proved the accuracy of the present method. The obtained assay results and percentage relative standard deviation in the method precision and intermediate precision study satisfactorily defined the precision of the present method. The method developed was sufficient enough to analyze MPV with its degradants up to 48 h, because the stability of the analytical solution study reveals that the standard solution and sample solution of MPV is stable for at least 48 h at room temperature in clear glassware. The developed method was found robust when the changes in the method parameter conditions have been done deliberately. The system suitability results were found to meet the pre-established acceptance criteria throughout the experiments. This study was compared to previous research articles and demonstrated significant improvements. Unlike existing methods, which have the following limitations: Annadi et al., 2022 [33] and Gandu et al., 2023 [34] developed and validated HPLC methods but in both cases neither stability indicating nature nor design space was demonstrated. Although Camlik et al., 2022 [35], developed and validated the HPLC method however, the article does not illustrate the stability-indicating capabilities and the method is also not suitable for quantifying the related substances. There is an article reported by Masipogu et al., 2022 [36] that developed and validated a stability-indicating method however, the method is not suitable for related substances. There are a few more research articles reported by Bindu et al., 2022 [37], Deshpande et al., 2023 [38], and Kiran et al., 2020 [39] developed and validated a stability-indicating method that is suitable for related substances however, neither any major degradant was identified nor design space was demonstrated. Addressing these gaps, the present study offers a superior approach, thereby overcoming the limitations of existing methods.
CONCLUSION
Existing analytical methods require periodic reassessment to identify gaps and enhance performance. This involves leveraging AQbD principles to mitigate risks. To ensure method reliability, the robustness range must be scientifically verified, demonstrating a comprehensive understanding of the methodology. This rigorous approach prevents method failure during transfer and minimizes Out-of-Specification (OOS) and Out-of-Trend (OOT) results.
This study reports the development and validation of a high-performance liquid chromatography method for the concurrent analysis of MPV and its degradation products. The Separation of the analyte with its degradation products was satisfactory with an acceptable percentage of assays. The gradient program utilized for the mobile phases was found satisfactory for successfully separating the analyte and degradant. The obtained validation parameters were found acceptable empirical evidence, which proves the reliability and acceptability of validation in line with ICH guidelines. The results of statistical analysis unequivocally establish the method's specificity, reproducibility, accuracy, linearity and robustness. Accordingly, this validated methodology has been deemed suitable for incorporation into routine quality control and stability analysis protocols within the pharmaceutical industry, thereby ensuring the consistent delivery of products meeting stringent quality standards. There is also a futuristic sketch to extrapolate the validated analytical method to the marketed dosage forms for its practical applicability.
ACKNOWLEDGEMENT
We thank the research and development department TCG Lifesciences Pvt. Ltd., Kolkata, India for providing the standards and other materials. Also kindly thank the Department of Pharmaceutical Chemistry, School of Pharmacy, GITAM (Deemed to be University) for supporting the work.
FUNDING
This research received no specific grant from funding agencies in the public, commercial, or not-for-profit sectors.
AUTHORS CONTRIBUTIONS
SKD: Conceptualization, Development, Methodology, Software, Validation, Data Analysis, Visualization, Writing-original draft. SM: Supervise, project administration, writing review and editing, conceptualization, methodology.
CONFLICT OF INTERESTS
Declared none.
REFERENCES
Fischer WA, Eron JJ, Holman W, Cohen MS, Fang L, Szewczyk LJ. A phase 2a clinical trial of molnupiravir in patients with COVID-19 shows accelerated SARS-CoV-2 RNA clearance and elimination of infectious virus. Sci Transl Med. 2022 Jan 19;14(628):eabl7430. doi: 10.1126/scitranslmed.abl7430, PMID 34941423.
Zou R, Peng L, Shu D, Zhao L, Lan J, Tan G. Antiviral efficacy and safety of molnupiravir against omicron variant infection: a randomized controlled clinical trial. Front Pharmacol. 2022 Jun 15;13:939573. doi: 10.3389/fphar.2022.939573, PMID 35784723.
Zhou S, Hill CS, Sarkar S, Tse LV, Woodburn BM, Schinazi RF. Beta-d-N4-hydroxycytidine inhibits SARS-CoV-2 through lethal mutagenesis but is also mutagenic to mammalian cells. J Infect Dis. 2021 Aug 2;224(3):415-9. doi: 10.1093/infdis/jiab247, PMID 33961695.
Kabinger F, Stiller C, Schmitzova J, Dienemann C, Kokic G, Hillen HS. Mechanism of molnupiravir induced SARS-CoV-2 mutagenesis. Nat Struct Mol Biol. 2021 Sep;28(9):740-6. doi: 10.1038/s41594-021-00651-0, PMID 34381216.
Singh AK, Singh A, Singh R, Misra A. Molnupiravir in COVID-19: a systematic review of literature. Diabetes Metab Syndr. 2021 Oct 30;15(6):102329. doi: 10.1016/j.dsx.2021.102329, PMID 34742052.
Pharmaceutical development international conference on harmonisation of technical requirements for registration of pharmaceuticals for human use. Available from: https://database.ichq8(r2);2009.org/sites/default/files/q8%28r2%29%20guideline.pdf.
Quality risk management international council for harmonisation of technical requirements for pharmaceuticals for human use. Available from: https://database.ichQ9(R1);2009.org/sites/default/files/ICH_Q9%28R1%29_Guideline_Step4_2023_0126_0.pdf.
Pharmaceutical quality system international conference on harmonisation of technical requirements for registration of pharmaceuticals for human use. Available from: https://database.ich q10;2008.org/sites/default/files/q8%28r2%29%20guideline.pdf.
Tol T, Kadam N, Raotole N, Desai A, Samanta G. A simultaneous determination of related substances by high-performance liquid chromatography in a drug product using quality by design approach. J Chromatogr A. 2016 Feb 5;1432:26-38. doi: 10.1016/j.chroma.2015.12.080, PMID 26792450.
Celia C, DI Marzio LD, Locatelli M, Ramundo P, D Ambrosio F, Tartaglia A. Current trends in simultaneous determination of co-administered Drugs. Separations. 2020 May 28;7(2):29. doi: 10.3390/separations7020029.
Hasan MH, Gouda AA, Hassan AE, Elsayed SG, Mousa HS. Implementation of analytical quality by design concepts for the optimization of quantitative 1H nuclear magnetic resonance (1H-qNMR) method for quantitation of novel anti-covid drugs (molnupiravir and favipiravir) in their pharmaceutical dosage forms. Microchem J. 2024 Jan;196:109582. doi: 10.1016/j.microc.2023.109582.
Nuli MV, Bhikshapathi D, Garige AK, Chandupatla V, Sunkara SL, Grover P. Ultra high performance liquid chromatography method development for the quantification of molnupiravir and its process related impurities using box behnken experimental design. Separation Science Plus. 2024 Feb 1;7(4):e2300213. doi: 10.1002/sscp.202300213.
Bhangale C, Bhandare S, Vaditake K. Eco-friendly analytical quality by design-based liquid chromatographic method for estimation of molnupiravir in bulk and pharmaceutical formulation. J Pharm Negat Results. 2022;13(10):4424-35. doi: 10.47750/pnr.2022.13.S10.06.584.
Kalpana RM, Chaitanya SK, Sareesh K. Analytical method development and validation for the estimation of molnupiravir in bulk and pharmaceutical tablet dosage form by RP-HPLC. Int J Pharm Pharm Res. 2022 Nov 30;25(4):208-20.
Recber T, Timur SS, Erdogan Kablan S, Yalcın F, Karabulut TC, Neslihan Gursoy R. A stability indicating RP-HPLC method for determination of the COVID-19 drug molnupiravir applied using nanoformulations in permeability studies. J Pharm Biomed Anal. 2022 May 30;214:114693. doi: 10.1016/j.jpba.2022.114693, PMID 35276385.
Kumar GR, Babu BS, Rao RR, Vardhan VM, Abbaraju VD. Method development and validation of a specific stability indicating RP-HPLC method for molnupiravir API. J Pharm Res Int. 2021 Dec 27;33(60B):3026-35. doi: 10.9734/jpri/2021/v33i60B34973.
Analytical procedure development international council for harmonisation of technical requirements for pharmaceuticals for human use. Available from: https://database.ichQ14;2023.org/sites/default/files/ICH_Q14_Guideline_2023_1116_1.pdf.
Validation of analytical procedures International Council for harmonisation of technical requirements for pharmaceuticals for human use. Available from: https://database.ichQ2(R2);2023.org/sites/default/files/ICH_Q2%28R2%29_Guideline_2023_1130.pdf. [Last accessed on 1 Nov 2023].
Dhand. QBD approach to method development and validation of orciprenaline sulphate by HPLC. J Glob Trends Pharm Sci. 2020;11(4):8634-40.
Turpin J, Luku AY PH, Verseput R. A quality by design methodology for rapid LC method development part. Vol. 1. S-Matrix Corporation; 2012.
Myers R, Montgomery D, Anderson Cook C. Response surface methodology: process and product optimization using designed experiments. 4th ed. NJ: John Wiley & Sons; 2016.
Vankudre S, Shirkoli N, Shetti P. A robust ultra-performance liquid chromatography method for dacarbazine quantification in nanosponge formulation: a quality by design approach. Anal Chem Lett. 2024 Aug;14(4):513-27. doi: 10.1080/22297928.2024.2378813.
Patel KY, Dedania ZR, Dedania RR, Patel U. QBD approach to HPLC method development and validation of ceftriaxone sodium. Future J Pharm Sci. 2021 Jul 13;7(1):141. doi: 10.1186/s43094-021-00286-4.
Shamim A, Ansari MJ, Aodah A, Iqbal M, Aqil M, Mirza MA. QBD engineered development and validation of a RP-HPLC method for simultaneous estimation of rutin and ciprofloxacin HCL in bilosomal nanoformulation. ACS Omega. 2023 Jun 8;8(24):21618-27. doi: 10.1021/acsomega.3c00956, PMID 37360463.
Bhusnure. QBD approach for analytical method development of antipsychotic drug. Pharm Lett. 2015;7(12):62-70.
Kumari N, Singh B, Saini G, Chaudhary A, Verma K, Vyas M. Quality by design: a systematic approach for the analytical method validation. J Drug Delivery Ther. 2019;9(3-s):1006-12. doi: 10.22270/jddt.v9i3-s.3114.
Kelley B, Cromwell M, Jerkins J. Integration of QBD risk assessment tools and overall risk management. Biologicals. 2016 Sep;44(5):341-51. doi: 10.1016/j.biologicals.2016.06.001, PMID 27461127.
Dewi M, Pratama R, Arifka M, Chaerunisaa A. Quality by design: approach to analytical method validation. Sci Pharm. 2022 Jun 27;1(1):38-46. doi: 10.58920/sciphar01010033.
Mondal P, Rani S, Ramakrishna R. Novel stability indicating validated RP-HPLC method for simultaneous quantification of artemether and lumefantrine in bulk and tablet. Curr Pharm Anal. 2014;10(4):271-78. doi: 10.2174/1573412910666140701183927.
Mondal P, Mahender K, Padmaja B. A novel UPLC-PDA method for the simultaneous determination of lamivudine-zidovudine and nevirapine in bulk and tablet dosage form. Anal Chem Lett. 2018 Mar 15;8(1):131-8. doi: 10.1080/22297928.2017.1400921.
Gupta A, Kossambe RV, Moorkoth S. Box behnken design assisted eco-friendly RP-HPLC PDA method for the quantification of paclitaxel: application to evaluate the solubility of paclitaxel cyclodextrin complex. Int J App Pharm. 2024 Aug 24;16(6):305-15. doi: 10.22159/ijap.2024v16i6.51690.
Kauser R, Padavala SK, Palanivel V. Optimization of LC-MS/MS method for the simultaneous determination of metformin and rosiglitazone in human plasma with box behnken design. Int J App Pharm. 2024 Aug 15;16(6):98-105. doi: 10.22159/ijap.2024v16i6.51936.
Annadi AM, El Zahar NM, El Din A Abdel Sattar N, Mohamed EH, Mahmoud SA, Attia MS. Development and validation of molnupiravir assessment in bulk powder and pharmaceutical formulation by the RP-HPLC-UV method. RSC Adv. 2022 Nov 12;12(53):34512-9. doi: 10.1039/D2RA05066H, PMID 36545624.
Sravanthi G, Gandla K, Repudi L. New analytical method development and validation for estimation of molnupiravir in bulk and tablet dosage form by RP-HPLC method. Cell Mol Biomed Rep. 2023;3(3):130-6. doi: 10.55705/cmbr.2023.375093.1087.
Camlik G, Beyazaslan F, Kara E, Ulker D, Albayrak I, Degim I. A validated high-pressure liquid chromatography (HPLC) method for molnupiravir. MRAJ. 2022;10(9). doi: 10.18103/mra.v10i9.3127.
Masipogu A, Dodle J, Anisetti R. Stability indicating method development and method validation for the estimation of molnupiravir in bulk and pharmaceutical dosage preparations by RP-UPLC. Am J Pharmacol Sci. 2022 Nov 3;9(10):301-9.
Bindu M, Gandla K, Vemireddy S, Samuel S, Praharsha Y. A validated stability indicating RP-HPLC method for the determination of molnupiravir in pharmaceutical dosage form. World J Adv Respir Res. 2022 Jul 22;15(1):580-90.
Deshpande M, Shaikh F, Sable V, Patil K, Holam MR, Tare H. New stability indicating RP-HPLC method for estimation of the drug molnupiravir. Int J Pharm Qual Assur. 2023 Mar 25;14(1):149-58. doi: 10.25258/ijpqa.14.1.26.
Somshetwar K, Damle M. Stability indicating eco-friendly HPLC method for molnupiravir. IJSR. 2022 Mar;11(3):375-8. doi: 10.21275/SR22307172002.