
Int J App Pharm, Vol 17, Issue 3, 2025, 361-369Original Article
DEVELOPMENT AND VALIDATION OF A STABILITY-INDICATING RP-HPLC METHOD FOR QUANTITATIVE DETERMINATION OF NITROXYNIL AND ITS IMPURITIES AS PER ICH GUIDELINES
TATA SANTOSH, PRAFULLA KUMAR SAHU*
School of Pharmacy, Centurion University of Technology and Management, Odisha-767001, India
*Corresponding author: Prafulla Kumar Sahu; *Email: kunasahu1@gmail.com
Received: 21 Nov 2024, Revised and Accepted: 10 Feb 2025
ABSTRACT
Objective: An isocratic elution method for the determination of Nitroxynil (NTX), its related substances was developed and validated as per ICH guidelines.
Methods: The process impurity4-Hydroxy-3-nitrobenzonitrile (NTX impurity-1) and key starting material 4-cyanophenol (4-CP) along with NTX were separated using a 50: 50%v/v composition of acetonitrile and 1% Orthophosphoric acid solution as mobile phase at a flow rate of 1 ml/min under isocratic mode. Separation was achieved on a Kromasil Eternity XT C18,4.6×250 mm, 5µ within a 30 min run time. The detection was made using a photo diode array detector and quantification was carried out at 244 nm. Forced degradation study was also conducted to confirm the specificity of the method. The method was found to be robust and rugged and complied with ICH guidelines.
Results: The calibration curve ranged from 0.5 – 7.5 ppm for NTX and its impurities. The Limit of Detection (LOD) for NTX is 0.09 ppm and Limit Of Quantification (LOQ) was 0.28 ppm. The LOD for NTX impurity-1 and 4-CP were 0.02 and 0.04 ppm, respectively, while the corresponding LOQ values were 0.06 and 0.13 ppm. In samples spiked with NTX and its impurities, the mean recovery was approximately 102.5±2%.
Conclusion: The method confirms its stability indicating nature was successfully applied for quality evaluation of NTX in bulk API. The method was validated as per guidelines of the International Conference on Harmonization of Technical Requirements for Pharmaceuticals for Human Use (ICH).
Keywords: Nitroxynil, Nitroxynil impurity 1, 4-Cyanophenol, HPLC, Related substances, ICH
© 2025 The Authors. Published by Innovare Academic Sciences Pvt Ltd. This is an open access article under the CC BY license (https://creativecommons.org/licenses/by/4.0/)
DOI: https://dx.doi.org/10.22159/ijap.2025v17i3.53244 Journal homepage: https://innovareacademics.in/journals/index.php/ijap
INTRODUCTION
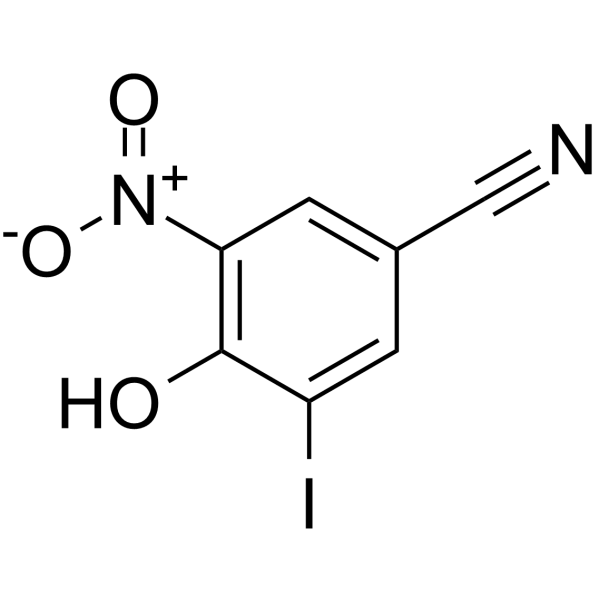
Nitroxynil (4-hydroxy-3-iodo-5-nitrobenzenonitrile, NTX) (fig. 1) is a widely used anthelmintic drug in veterinary medicine, primarily for the prevention and treatment of hepatic distomatosis. It is particularly effective in controlling fascioliasis, a parasitic infection caused by Fasciola hepatica in cattle and sheep, and exhibits strong antiparasitic properties [1, 2]. Compared to other fasciolicides, NTX is more effective against both immature and adult liver flukes [3, 4]. However, drug residues in food products are a growing concern, as they can cause allergic reactions in sensitive individuals or contribute to the development of antibiotic-resistant bacterial strains [5, 6]. The European Commission in its regulation No. 997/1999, has established the Maximum Residue Limits (MRLs) for NTX in bovine and ovine muscle, fat, liver, and kidney at 400, 200, 20, and 400 μg/kg, respectively [7].
Earlier literature for the determination of NTX involved techniques such as Liquid chromatography [8-10], gas chromatography [11-13], spectrofluorometry [14], immunobiosensors [15], immunochromatographic strips [16], polarography [17-21], and voltammetry [22, 23]. Square wave voltammetry (SWV) technique using Carbon Paste Electrodes (CPE) was also reported [24]. These methods are mostly non-specific and did not cover quantification of impurities. Till date, there is no published method for the simultaneous determination of NTX and its related substances. There is sufficient evidence of pharmaceutical drug substances and/or impurities percolating from animals to humans or other species, finally damaging the ecological health [26, 27]. As a control measure, the ICH Q3A has provided guidance on the reporting thresholds for impurities in new drug substances based on the maximum daily dose (MDD) [28]. For MDD<2 g/day, the threshold is 0.05% or 1 mg, whichever is lower. For MDD>2g/day, the threshold is 0.03% [29]. Hence, our study was aimed to cover the determination of NTX and its impurities in the final Active Pharmaceutical Ingredient (API).
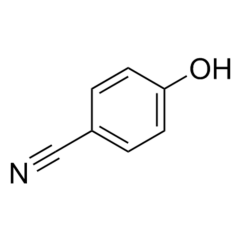
During synthesis, 4-Cyano phenol (4-CP) (fig. 1) was used as a key starting material whose residues are likely to be carried into the final product. Also, NTX impurity-1 (fig. 1) is also reported as a process impurity. The present study aimed for the development and validation of a Reverse Phase High-Performance Liquid Chromatography (RP-HPLC) method for the determination of 4-CP, NTX impurity-1 and NTX as per ICH guidelines [25].
 |
 |
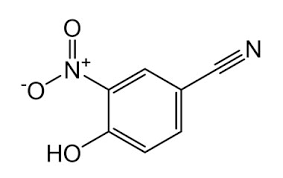 |
| Fig. 1a –NTX | Fig. 1b – 4-Cyano Phenol (4-CP) | Fig. 1c – Structure of NTX impurity-1 |
Fig. 1: NTX and its related substances
MATERIALS AND METHODS
Instrumentation
Separation of NTX and its impurities was done by the RP-HPLC method [31, 32]. A Shimadzu LC 2010 equipped with a column temperature oven, autoinjector and PDA detector was used for the study. Data acquisition was facilitated using a LC Solutions software. Kromasil Eternity XT C18,4.6×250 mm, 5µ or equivalent was used. The injection volume is set at 20µl*. pH meter (Lab India make), Analytical balance (Mettler Toledo; Sensitivity 0.01 mg), ultrasonicator (Sonics make) were used for the study. Class A glassware was used throughout the study.
Standards, chemicals and reagents
Reference standards of NTX (potency 100.28% w/w) and working standards of 4-CP (potency>99% w/w), NTX impurity-1 (potency 99.5% w/w) were gifted samples from M/s NGL Finechem Ltd, Mumbai. Milli-Q water was used for solution preparation. Solvents were of HPLC grade and purchased from Merck Ltd. Chemicals for preparation of buffers were of the highest grade and sourced from Merck Ltd.
Preparation of analytical solutions
Mobile phase
A 50:50 %v/v solution of acetonitrile and 1% v/v orthophosphoric acid in water was prepared, mixed thoroughly and then sonicated to remove any dissolved gases. The mixture was then filtered through 0.22µ membrane filter and used as the mobile phase for the separation. Dilutions were prepared using the mobile phase.
Preparation of standard solutions
Standard stock solutions of NTX and related substances were prepared separately using the mobile phase such that the final concentration is 100 parts per million (ppm). 5 ml (millilitre) of each of these stock solutions was transferred into a 100 ml volumetric flask and made up with mobile phase to obtain a 5 ppm mixture solution. This solution is treated as the system suitability solution or 100% reference standard solution.
Preparation of sample solutions
Approximately 50 mg of the test substance is weighed and dissolved in 50 ml of mobile phase. This sample solution is suitably diluted before analysis as such or spiked with impurities solutions for evaluating various validation parameters.
Chromatographic separation and quantitation
An isocratic flow rate of 1.4 ml/min was best suited for the separation. Peak responses were quantified at 244 nm for NTX and related substances using a photodiode array detector. Chromatographic separation of all the known and unknown impurities was achieved using a Kromasil Eternity XT C18,4.6×250 mm, 5µ column.
Method validation
System suitability testing (SST)
The reference standard solution (treated as 100% level) was used for the evaluation of SST. The results are treated acceptable if the percent Relative Standard Deviation (%RSD) of 6 replicate injections for peak area is within 2%, the mean theoretical plates is Not Less Than (NLT) 2000, tailing factor (Tf) Not More Than (NMT) 2.0 and resolution is NLT 2.0. A blank sample at the beginning of the injection sequence was analysed to check interference due to solutions. The sequence also contained a blank sample at the end to ascertain any carryover effect. Bracketing standards to assess system’s performance during the sequence were placed intermittently.
Specificity and forced degradation products
Specificity due to impurities and related substances
The specificity of an analytical method is defined as the absence of interference due to impurities, related substances and/or degradation products at the retention time of the peaks under study. This interference sometimes can also be in the form of peak response amplification or attenuation caused by co-analytes, impurities, degradation products or pH buffers in solution. Evaluation of specificity is the prerequisite for method validation. In this study, the effect of forced degradation was also included as a part of specificity.
Individual standard solutions of NTX and its impurities at 100% level and LOQ concentrations are analysed initially. The sample solution was also analysed separately to check the presence of known and unknown impurities.
Specificity due to forced degradation products
For forced degradation, the sample solution is regarded as the untreated sample and used for comparison. Similar quantities as taken for sample solution were separately weighted into volumetric flasks and initially treated with HCl (0.1M, 0.5M), NaOH (0.1M, 0.5M) and H2O2 (3%, 5%). The volumetric flasks are then placed in a water bath at 55 °C for 1 hour to allow degradation. After the exposure time, the volume is made up with mobile phase solution and analysed. To study the effect of thermal stress, sample is initially placed in a hot air oven at 105 C for 6 h. This sample is then made up to volume. For photolytic degradation, samples are exposed to an overall illumination of not less than 1.2 million lux hours with an illumination of 200-Watt hours/m2. The results are compared with those of the untreated sample exposed to diffused daylight and also with the sample solution placed in an amber-colored volumetric flask.
To study the combined effect of relative humidity (RH) and temperature, the sample is placed for 24 h in a 40 °C/75% RH stability chamber. This sample is compared with that of the untreated sample. The peak purity is also verified for each of the samples. The mass balance was also determined after the degradation.
For specificity, the results are considered acceptable if none of the impurities, related substances and/or degradation products interfere with the peak responses of NTX and the known impurities. Also, the response obtained in the untreated sample mixture should be comparable with that of the peak response obtained in individual analytes. The relative retention times in the LOQ and reference solutions shall be similar to that of the sample solution. The theoretical plates for the peaks of interest is not less than (NLT) 2000, tailing factor (Tf) NMT 2.0 and resolution is NLT 2.0.
Stability of solutions
Room temperature (25±2 °C) stability for 24 h and refrigerated stability (8±2 °C) for 1 w was conducted using reference standard solutions. The results are compared with freshly prepared solutions of similar concentration. A correction factor is applied to compensate for weight variations (if any).
Linearity and range
Calibration curve in the range of LOQ-150% level was plotted. The linear calibration standard solutions contained a mixture NTX and its impurities at 10%, 20%, 30%, 50%, 80%, 100%, 120% and 150% of the standard concentration. LOQ was determined as described in further section of this manuscript. Linearity is treated as acceptable if the regression coefficient (r2) is NLT 0.99 for each of the analytes. Also, the %RSD for triplicate measurements at each concentration is NMT 2.0% for NTX and NMT 5% for known impurities.
Precision
System precision was performed using a 100% solution. 6 replicate injections of the 100% reference solution were injected and the data is tabulated.
For method precision, 6 separate test substance solutions were prepared and analysed. To verify the repeatability in response for the known and unknown impurities, spiked studies were also conducted. 12 test substance solutions were prepared of which 6 preparations are spiked with impurities equivalent to that of the specification limit. The remaining 6 preparations were spiked with LOQ concentrations of the same impurities into the test substance solution. The data is treated as satisfying if the %RSD of the peak responses for known and unknown impurities is within 10% at all levels.
Intermediate precision was performed similarly as that of method precision on a different instrument, different column by a different qualified analyst.
Accuracy/recovery studies
Standard solutions containing NTX along with impurities were prepared at LOQ, 50%, 100% and 150% levels. The solutions were analysed. Equivalent quantities of individual impurities are spiked in Test substance such that the level of impurity matches with that of the reference solution. The % Recovery is calculated by taking the ratio of the area responses in the spiked samples to that obtained in the reference solution of the corresponding concentration. SST was performed before the activity. All measurements are conducted in triplicate. The % recovery of NTX along with its known and unknown impurities, was calculated. The data is treated as acceptable if the % recovery is within ±15% of their nominal value.
Detection and quantification limits
The LOD and LOQ are determined by preparing solutions of 10%, 20%, 30%, 50% and 80% to the specification limit. A linear graph is then plotted to find the slope and standard deviation of the replicate measurements. LOD = 3.3 σ/slope and LOQ = 10 σ/slope. (N=3). After obtaining theoretical LOD and LOQ values, solutions at concentrations lower than those obtained theoretically were prepared and tested for repeatability and accuracy (n=3).
Robustness
The effect of intentional variation on the overall chromatographic separation is studied. The effect of flow variation (1.4±0.2 ml/min), column temperature oven variation (30±5 °C) was studied.
RESULTS
Method development and method optimization
Before proceeding for the full validation, we initially evaluated the stability of the individual impurity solutions and NTX. Bench-top room temperature stability studies for the solutions of NTX and related substances demonstrated good stability during handling and storage.
In most of the conducted experiments, the peak parameters, such as tailing factor number of theoretical plates were unaltered. Hence, separation of 4-CP and NTX impurity-1 was most critical for the development. To achieve this separation, a gradient elution program was chosen. Higher carbon load columns, such as in Kromasil100 (carbon load 20%), led to merging of 4-CP and NTX impurity-1 peaks. Carbon load of 7% on a Waters Spherisorb column led to long retention times and unacceptable asymmetry factors for NTX and other impurities. Columns with carbon load of 14-15% were found suitable. Final confirmation was taken on a Kromasil Eternity XT C18 column having 14% carbon load.
The wavelength maximum (ƛmax) was determined using a double-beam UV spectrophotometer. The ƛmax was found to be 244 nm. Hence, this wavelength was taken throughout the study.
Method validation
System suitability
The results of the system suitability performed using the standard solution met the acceptance criteria for NTX and all its related substances and/or impurities. The results are given in table 1.
Table 1: Results of system suitability
| Solution | Rt | Tf | Resolution | NTP |
| 4-CP | 2.56±0.193 | 1.10±0.02 | - | 10265±213 |
| NTX Impurity 1 | 3.57±0.145 | 1.18±0.03 | 6.203±0.08 | 14738±346 |
| NTX | 6.54±0.08 | 1.21±.0.02 | 16.44±0.12 | 18687±486 |
Value mentioned are mean±standard deviation of n=6
Specificity and forced degradation studies
No interference was observed at the retention times of NTX and its impurities. The RRT of replicate injections was highly precise. In the current study, the observed degradation was verified for interference alone. No degradation products were formed beyond the reporting threshold limits of the ICH Q3 (R2) guideline [29]. The forced degradation studies confirmed that NTX is principally susceptible to alkaline stress. However, some degradation also occurred during acid treatment stress. The chromatograms for specificity and forced degradation are depicted in fig. 2a – 2f. The assay values after stress treatment were given in table 2.
Table 2: Stress degradation studies on NTX
| Treatment | % Assay | Peak purity index |
| As such | 100.24 | 1.0000 |
| *Acid stress (0.5N HCl @ 60 C, 1 H) | 95.67 | 1.0000 |
| *Base stress (0.5N NaOH @ 60 C, 1 H) | 55.94 | 1.0000 |
| H2O2 stress(3% H2O2 in dark condition) | 101.50 | 0.9999 |
| Thermal stress (105 C for 24 h) | 99.57 | 1.0000 |
| Humidity stress(40 C/75% RH for 7 d) | 99.73 | 1.0000 |
| Diffused Daylight (Ambient) | 98.74 | 1.0000 |
| Fe2+stress | 99.29 | 0.9999 |
*Sample solution analysed after neutralization of the treated sample, * values mentioned are mean of n=3
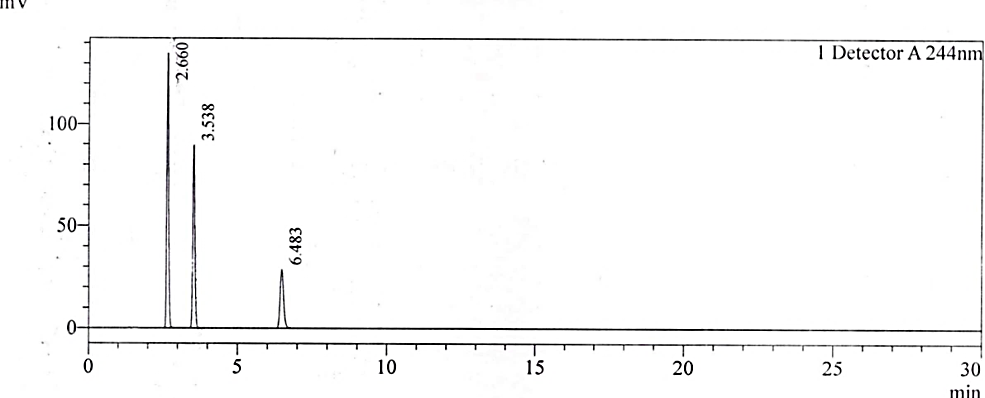
Fig. 2a: Chromatogram of the standard solution
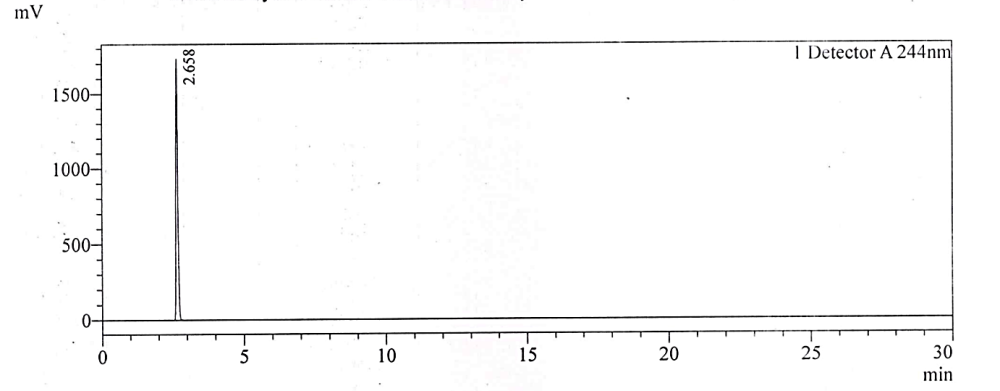
Fig. 2b: Chromatogram for 4-CP
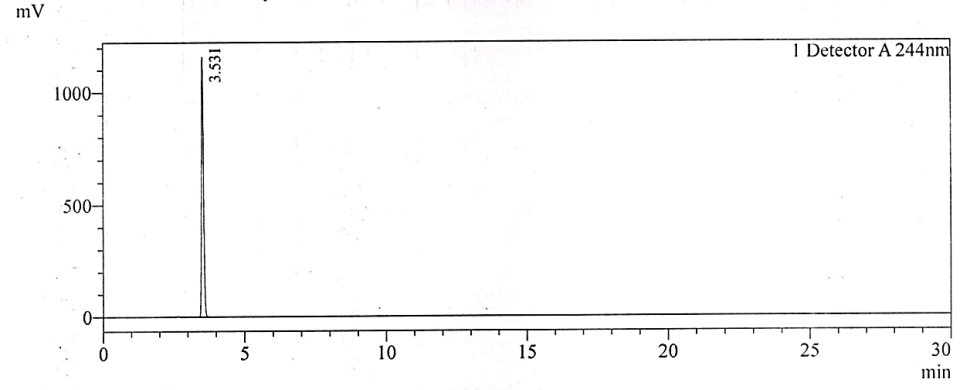
Fig. 2c: Chromatogram of NTX impurity-1
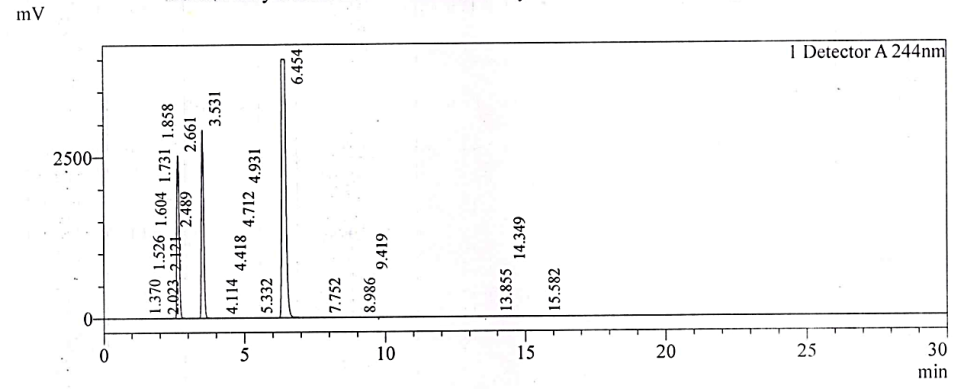
Fig. 2d: Chromatogram of test solution spiked with 4-CP and NTX impurity-1
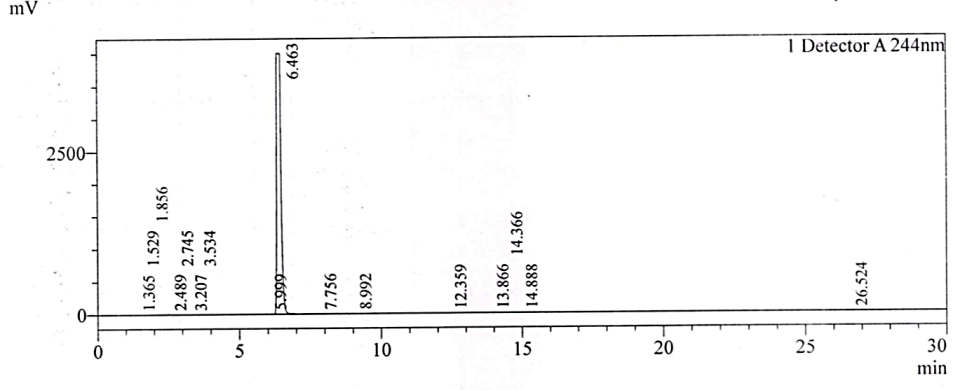
Fig. 2e: Chromatogram of the test substance
Stability of solutions
Results of bench top stability study and refrigerated study on reference standard solution were compared against freshly prepared standard solutions of the same concentration. The results indicate that NTX and its impurities are stable during the exposed duration and did not show any degradation in solution. The results are given in table 3.
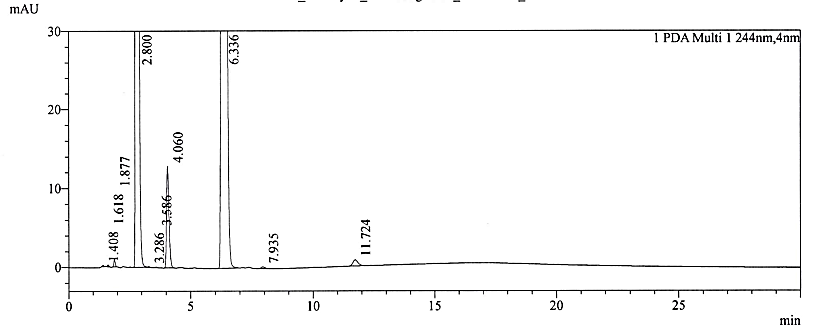
Fig. 2f: Chromatogram of base stress sample
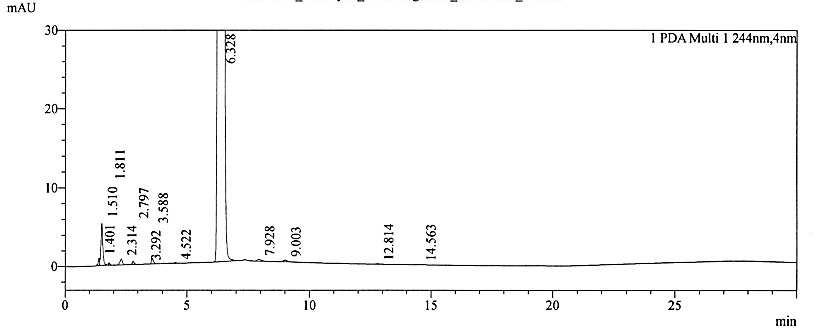
Fig. 2g: Chromatogram of acid-treated sample
Table 3: Stability of solutions at room temperature and refrigerated conditions
| Limit | 4-CP | NTX impurity 1 | Unknown impurity | Total impurity |
| NMT 0.5% | NMT 0.5% | NMT 0.20% | NMT 1.0% | |
| 5±3 C (after 24 h) | 0.01 % | N. D | 0.08 % | 0.15 % |
| 5±3 C (after 48 h) | 0.01% | N. D | 0.08 % | 0.15 % |
| 5±3 C (after 72 h) | 0.01 % | N. D | 0.08 % | 0.17 % |
| 25±3 C (after 24 h) | 0.01 % | N. D | 0.09 % | 0.21 % |
| 25±3 C (after 48 h) | 0.01% | N. D | 0.09 % | 0.16 % |
| 25±3 C (after 72 h) | 0.01 % | N. D | 0.09 % | 0.15 % |
*N.D. – Not Detected; *values mentioned are mean of n=3
Linearity and range
After ascertaining the stability of NTX and known impurities, and also confirming the absence of degradation due to photolytic stress, the calibration standards for linearity were prepared. The linearity experiment was performed in triplicate. The results are given in table 4. The calibration plots of concentration (ppm) versus peak area for each of the analytes is shown in fig. 3a-3c.
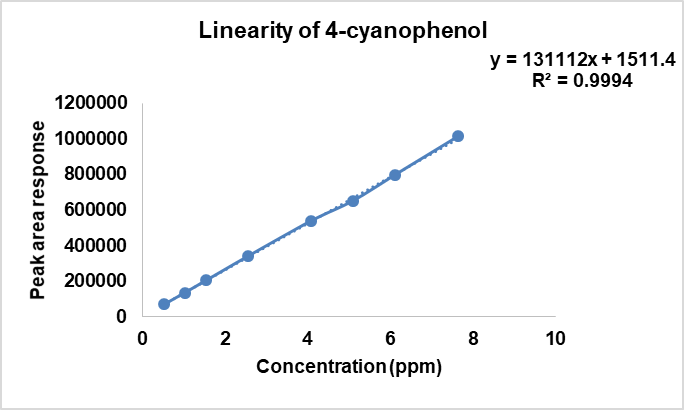
Fig. 3a: Linear calibration curve for 4-CP
Table 4: Results of linearity for NTX and its impurities
| Analyte | Range of the calibration curve (10%-150%) in ppm | Equation of the best-fit line | R2 |
| 4-CP | 0.5 – 7.5 | Y=131112X+15411.4 | 0.9994 |
| NTX impurity 1 | 0.5 – 7.5 | Y=91038x+925.52 | 0.9943 |
| NTX | 0.5 – 7.5 | Y=46978x+1502.2 | 0.9991 |
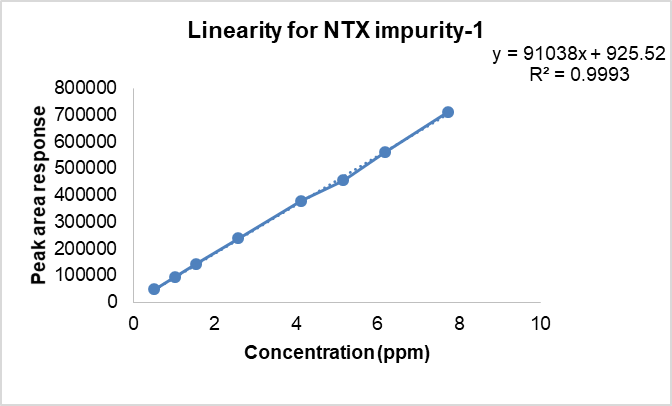
Fig. 3b: Linear calibration curve for NTX impurity-1
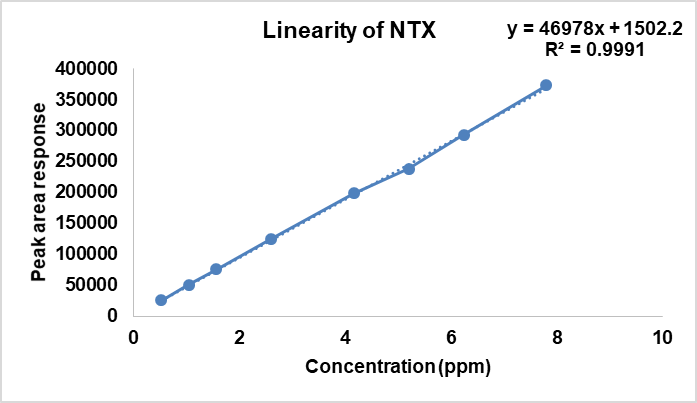
Fig. 3c: Linear calibration curve for NTX
Precision
The precision of the method determines the repeatability of a measurement and is usually expressed as the %RSD. Replicate measurements (n=6) of responses for all the analytes was taken, and the % RSD was calculated. The data is compared among the standard solution, solutions of the test substance, solutions spiked with 100% level of impurity standard into test substance and solutions spiked with LOQ levels of impurity standard into test substance solutions. Results of method precision were given below. Intermediate precision metal the acceptance criteria on a different equipment with a different analyst. The results are tabulated in table 5.
Table 5: Results of precision
| Precision | Standard | Test substance | 100% impurity spiked solution | LOQ level spiked solution |
| 4-CP | 0.01 | 0.01 | 0.07 | 0.08 |
| NTX Impurity 1 | 0.01 | N. D | 0.05 | 0.066 |
| NTX | 0.01 | 0.02 | 0.08 | 0.03 |
| SMUI | 0.00 | 0.07 | 0.04 | 0.06 |
| Total Impurities | 0.04 | 0.14 | 0.16 | 0.21 |
*N. D – not detected, SMUI-Single maximum unknown impurity; values are for n=6 observations
Accuracy/Recovery studies
Known amounts of the impurity standard solutions are spiked into test substances at LLOQ, 50%, 100% and 150% levels and analysed. Similarly, standard of equivalent concentrations were also analysed. The responses are compared. Recovery is the ability of the method to determine the composition of the analyte in presence of matrix components in solution. The results are tabulated in table 6.
Detection and quantification limits
The LOQ was determined by preparing serial dilutions at 10%, 20%, 30%, 50% and 80% of the specification limit. The slope and the overall standard deviation were calculated. Acceptable repeatability was found during replicate measurements. After obtaining the empirical values of LOD and LOQ we then prepared solutions individually and as a mixture in solution. The solutions are tested and the Signal-to-noise ratio (S/N) was calculated. The results are tabulated in table 7 and the representative chromatograms for NTX are depicted in fig. 4a-4b.
Table 6: Results of recovery at various levels
| 50% | 100% | 150% | Overall | |
| 4-CP | 105.7±0.49 | 101.26±0.87 | 100.54±0.43 | 102.5±2.42 |
| NTX Impurity 1 | 105.71±0.43 | 101.27±0.75 | 100.45±0.4 | 102.48±2.44 |
| NTX | 105.45±0.61 | 101.85±0.47 | 100.71±0.30 | 102.67±2.13 |
*value mentioned are mean±standard deviation of n=3
Table 7: Results of LOD and LOQ under the validated conditions
| Analyte | LOD (ppm) | LOQ (ppm) |
| 4-CP | 0.04 | 0.13 |
| NTX Impurity 1 | 0.021 | 0.065 |
| NTX | 0.092 | 0.282 |
*value mentioned are mean of n=3
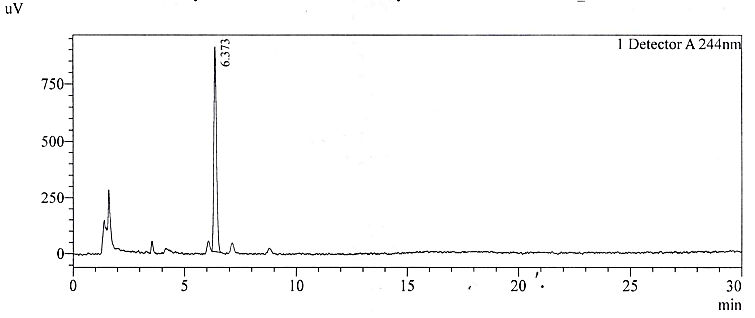
Fig. 4a: Chromatogram of NTX at LOD
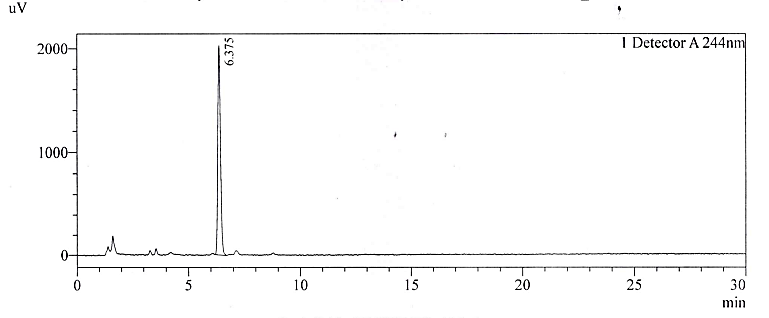
Fig. 4B: Chromatogram of NTX at LOQ
At concentrations below the obtained LOD and LOQ measurement, the % RSD of replicate measurements was out of limit. The detection and quantification limits finalized are acceptable for compliance of the product.
Robustness
The results of robustness obtained after intentional variations in the chromatographic parameters were compared with those obtained under standard conditions of the method validation. The data such as relative retention time, tailing factor, theoretical plates, resolution and peak purity were evaluated. All the results are within 5%. The method can be concluded as robust.
DISCUSSION
NTX is a versatile active pharmaceutical ingredient (API) widely used in veterinary applications. To achieve consistent quality, it is imperative to control the overall purity and the residual impurities. NTX residues in fish by Liquid Chromatography-Tandem Mass Spectrometry (LC-MS/MS) [8], in cow milk using coulometric detection [9], and in animal tissues by LC-MS/MS [10] was reported earlier. Methods using immunobiosensors for determination of NTX in tissues and bovine milk were also reported [15]. Till date, no attempts were made to evaluate the process impurities and degradation products in NTX. The objective of our study was to develop and validate a sensitive and robust method for the estimation of NTX, its impurities and related substances in bulk API.
Structural similarity between 4-CP and NTX-1 (4-hydroxy-3-nitrobenzonitrile) is evident due to the presence of common functional groups such as hydroxyl group and cyano groups. Accordingly, it is possible that both compounds can engage in hydrogen bonding during RP-HPLC separations. Similarly, owing to the presence of cyano group, dipole-dipole interactions will be prominent during the RP-HPLC separation. Owing to the presence of similar functional groups, we initially predicted early retention times for 4-CP and NTX-1.
In general, the efficiency of chromatographic separation depends on how distinctly each compound interacts with the stationary phase. When two compounds exhibit highly dissimilar interactions, their retention times differ significantly, leading to better separation. This principle arises from the fundamentals of chromatography, where separation is achieved through differences in the compounds' affinity for the stationary phase and the mobile phase.
Dissimilarities in the interactions are evident due to the presence of additional nitro group in NTX-1. The electron-withdrawing nitro group introduces greater polarity and additional interaction sites. Hence, we predicted that the nitro group to participate in strong dipole-dipole and hydrogen-bonding interactions with the stationary phase, increasing retention.
Therefore, it was predicted that the NTX-1 to elute later as compared to 4-CP. The nitro group makes NTX-1 more polar than 4-CP, potentially leading to stronger interactions with polar stationary phases. Also, the Nitro group reduces the electron density on the aromatic ring, potentially weakening π-π interactions with stationary phases designed to interact with aromatic systems. In contrast, 4-CP may exhibit slightly stronger π-π interactions. In summary, we anticipated early elution of 4-CP and NTX-1. Also, due to the strong interactions of NTX-1 relative to 4-CP, we predicted 4-CP to elute earlier compared to NTX-1.
Most permutations of the mobile phase and stationary phase resulted in overlapping peaks of 4-CP and NTX-1. Because separation is greatly dependent on the interactions of the analytes with the stationary phase, we tried using various RP-HPLC columns of different carbon loads. Columns with higher carbon load such as in Kromasil 100 led to the merging of the impurity peaks. High tailing was observed for compounds with low carbon loads. Optimal chromatographic separation was achieved with columns having 13-15% carbon loads. Hence, Kromasil Eternity XT C18 with 14% carbon load was chosen as best suited condition for the experiment. In line with our predictions, 4-CP eluted early and NTX-1 later.
Earlier reported stability indicating RP-HPLC methods [33] used a Plackett-Burman design for robustness testing. This method characterized the oxidative and hydrolytic degradation products using LC-MS. However, process impurities during synthesis are not covered in their work. Non-chromatographic estimations such as electrochemical methods etc for determination of NTX residues in food and milk products cited earlier are excluded from the scope of this discussion. The mobile phase composition was fine-tuned to balance the interaction between the analytes and the stationary phase, ensuring better separation. This involved selecting appropriate solvents and optimizing their ratios to enhance the retention and elution of compounds. The flow rate and column temperature were carefully adjusted to ensure consistent peak shapes and reproducibility across runs.
As a result, the optimized method demonstrated superior performance, characterized by high sensitivity, excellent resolution, and consistent reproducibility. The refined chromatographic conditions enabled the rapid and accurate analysis of target compounds, making the method suitable for routine use. Furthermore, the systematic approach to optimization highlights the importance of a structured methodology in achieving reliable and high-quality analytical outcomes.
Also, NTX is a veterinary API, the study was made simpler and more reproducible. General replicate analysis approach was followed to ascertain the precision and robustness instead of a statistical approach. Robustness was evaluated by causing deliberate variations in the method conditions. This enabled to study the impact on peak response, separation efficiency and overall chromatography parameters. Under routine conditions of variations, the method still reproduced without affecting the peak performance characteristics such as tailing factor, theoretical plates and relative resolution time.
A comparison of this method with previous reports in literature could not be drawn since impurities were not focussed at that time. In the current study, the sensitivity of the method was appropriate to quantify impurities to very low levels. The LOD and LOQ achieved under the specified method conditions is fairly below the reporting threshold limits required by ICH Q3 (R2). Hence, this method can be directly applied during routine batch release and stability assessments.
CONCLUSION
This study provides an optimized chromatographic method that ensures precise and efficient analyte separation. The approach underscores the critical role of method development in addressing analytical challenges and achieving robust results. This optimized method serves as a reliable tool for routine analyses and has the potential for broader applications following further validation. Absence of interference in the blank interference due to related substances and degradation products in this method confirms it to be stability-indicating. The calibration curve ranged from 0.5 – 7.5 ppm for NTX and its impurities. The LOD for NTX is 0.09 ppm and LOQ was 0.28 ppm. The LOD for NTX impurity-1 and 4-CP were 0.02 and 0.04 ppm, respectively, while the corresponding LOQ values were 0.06 and 0.13 ppm. In samples spiked with NTX and its impurities, the mean recovery was approximately 102.5±2%. The LOD and LOQ values are fairly below the reporting threshold values based on the maximum daily dose as per ICH Q3A. The validation was carried out as per ICH guidelines. The method demonstrated good robustness when deliberate changes to the optimized method are made. The precision is also within the acceptance criteria. This validated method was directly applied for the determination of NTX in bulk APIs.
ACKNOWLEDGEMENT
Not applicable
FUNDING
This review article did not receive any specific grant from public, commercial, or from not-for-profit funding institutions.
AUTHORS CONTRIBUTIONS
The need for the work was identified by Mr. Tata Santosh and further approved by Dr. Prafulla Kumar Sahu. Work execution, results tabulation and preparation of the manuscript were done by Mr. Tata Santosh. Review of the draft manuscript was done by Dr. Prafulla Kumar Sahu.
CONFLICT OF INTERESTS
Declared none
REFERENCES
Molina Hernandez V, Mulcahy G, Perez J, Martinez Moreno A, Donnelly S, O Neill SM. Fasciola hepatica vaccine: we may not be there yet but we’re on the right road. Vet Parasitol. 2015;208(1-2):101-11. doi: 10.1016/j.vetpar.2015.01.004, PMID 25657086.
Piedrafita D, Spithill TW, Smith RE, Raadsma HW. Improving animal and human health through understanding liver fluke immunology. Parasite Immunol. 2010 Aug;32(8):572-81. doi: 10.1111/j.1365-3024.2010.01223.x, PMID 20626812.
Coles GC, Stafford KA. Activity of oxyclozanide nitroxynil clorsulon and albendazole against adult triclabendazole resistant fasciola hepatica. Vet Rec. 2001 Jun 9;148(23):723-4. doi: 10.1136/vr.148.23.723, PMID 11430684.
Hanna RE, MC Mahon C, Ellison S, Edgar HW, Kajugu PE, Gordon A. Fasciola hepatica: a comparative survey of adult fluke resistance to triclabendazole nitroxynil and closantel on selected upland and lowland sheep farms in Northern Ireland using faecal egg counting coproantigen ELISA testing and fluke histology. Vet Parasitol. 2015 Jan 15;207(1-2):34-43. doi: 10.1016/j.vetpar.2014.11.016, PMID 25529143.
Okocha RC, Olatoye IO, Adedeji OB. Food safety impacts of antimicrobial use and their residues in aquaculture. Public Health Rev. 2018 Aug 8;39:21. doi: 10.1186/s40985-018-0099-2, PMID 30094087, PMCID PMC6081861.
Bamidele Falowo A, Festus Akimoladun O. Veterinary drug residues in meat and meat products: occurrence detection and implications. In: Oppong Bekoe S, Saravanan M, Kwame Adosraku R, K Ramkumar P, editors. Veterinary Medicine and Pharmaceuticals. Intech Open; 2020. doi: 10.5772/intechopen.83616.
Agency EM. Commission regulation (EU) No, 37/2010 of 22 Dec 2009 on pharmacologically active substances and their classification regarding maximum residue limits in foodstuffs of animal origin. Off J Eur Union. 2010;032:275-346.
Jung HN, Park DH, Yoo KH, Cho HJ, Shim JH, Shin HC. Simultaneous quantification of 12 veterinary drug residues in fishery products using liquid chromatography-tandem mass spectrometry. Food Chem. 2021 Jun 30;348:129105. doi: 10.1016/j.foodchem.2021.129105, PMID 33508596.
Takeba K, Matsumoto M, Nakazawa H. Determination of nitroxynil in cow milk by reversed-phase high-performance liquid chromatography with dual-electrode coulometric detection. J Chromatogr. 1992 Apr 3;596(1):67-71. doi: 10.1016/0021-9673(92)80203-7, PMID 1522179.
Blanchflower WJ, Kennedy DG. Determination of nitroxynil residues in tissues using high-performance liquid chromatography thermos pray mass spectrometry. Analyst. 1989;114(9):1013-5. doi: 10.1039/AN9891401013, PMID 2610364.
Bluthgen A, Heeschen W, Nijhuis H. Gas chromatographic determination of fasciolicide residues in milk. Milchwiss Milk Sci Int. 1982;37:206-11.
Takeshita Y, Kishi T, Seki M, Fujiyama K, Otsuka G, Ahiko K. Analysis of nitroxynil (fasciolicide) in milk and dairy products. Milchwissenschaft. 1980;35:133-5.
Heeschen W, Tolle A, Bluthgen A. Fasciolizide in milch. Arch Lebensm Hyg. 1972.
Ashraf S, Belal F, Salim MM. Spectrofluorometric determination of residual amounts of nitroxynil in food samples. Spectrochim Acta A Mol Biomol Spectrosc. 2022 Jun 5;274:120993. doi: 10.1016/j.saa.2022.120993, PMID 35245802.
Traynor IM, Thompson CS, Armstrong L, Whelan M, Danaher M, Kennedy DG. Determination of nitroxynil residues in tissues and bovine milk by immunobiosensor. Food Addit Contam Part A Chem Anal Control Expo Risk Assess. 2013;30(6):1115-22. doi: 10.1080/19440049.2013.781274, PMID 23566247.
NA G, HU X, Yang J, Sun Y, Kwee S, Tang L. A rapid colloidal gold-based immunochromatographic strip assay for monitoring nitroxynil in milk. J Sci Food Agric. 2020 Mar 30;100(5):1860-6. doi: 10.1002/jsfa.10074, PMID 31602650.
Ghoneim MM, El Ries M, Hassanein AM, Abd Elaziz AM. Voltammetric assay of the anthelmintic veterinary drug nitroxynil in bulk form and formulation at a mercury electrode. J Pharm Biomed Anal. 2006 Jun 16;41(4):1268-73. doi: 10.1016/j.jpba.2006.03.022, PMID 16687232.
Parnell MJ. Determination of nitroxynil residues in sheep and calves. Pestic Sci. 1970;1(4):138-43. doi: 10.1002/ps.2780010407.
Parnell MJ. Determination of nitroxynil in milk and dairy products. Pestic Sci. 1972;3(6):685-8. doi: 10.1002/ps.2780030605.
Parnell M, Martin JT, Holloway PJ, Jenkins DA, Skinner JM, Evans RA. The determination of nitroxynil in experimental animals and in meat by polarography. Royal Society of Chemistry. Available from: https://pubs.rsc.org/en/content/articlelanding/1969/sa/sa9690600143. [Last accessed on 18 Mar 2025].
Alvarez Lueje AF, Bastias M, Bollo S, Nunez Vergara LJ, Squella JA. Electrochemical behavior and a polarographic assay of nitroxynil. Journal of AOAC International. 1995;78(3):637-41. doi: 10.1093/jaoac/78.3.637.
Sipa K, Brycht M, Leniart A, Skrzypek S. The application of carbon nanomaterials as electrode surface modifiers for the voltammetric sensing of nitroxinil a comparative study. J Electroanal Chem. 2019;848:113294. doi: 10.1016/j.jelechem.2019.113294.
Sipa K, Brycht M, Skrzypek S. The effect of the supporting electrolyte on the voltammetric determination of the veterinary drug nitroxinil. J Electroanal Chem. 2018 Oct 15;827:21-6. doi: 10.1016/j.jelechem.2018.09.006.
Salim MM, Ashraf S, Hashem HM, Belal F. Voltammetric estimation of residual nitroxynil in food products using carbon paste electrode. Sci Rep. 2022 Aug 22;12(1):14289. doi: 10.1038/s41598-022-18305-6, PMID 35995815, PMCID PMC9395526.
International Conference on Harmonization (ICH). Technical requirements for the registration of pharmaceutical for human use validation of analytical procedures; text and methodology. Vol. Q2. Geneva; 2005. (p. R1). Available from: http://www.ich.org/lOB/media/MEDIA417.pdf.
Swan GE, Cuthbert R, Quevedo M, Green RE, Pain DJ, Bartels P. Toxicity of diclofenac to gyps vultures. Biol Lett. 2006;2(2):279-82. doi: 10.1098/rsbl.2005.0425, PMID 17148382.
Margalida A, Bogliani G, Bowden CG, Donazar JA, Genero F, Gilbert M. Science and regulation. One Health approach to use of Veterinary Pharmaceuticals. Science. 2014;346(6215):1296-8. doi: 10.1126/science.1260260, PMID 25477214.
Reddy CS, Rao BT. Development and validation of a stability indicating related substances of trandolapril by RP-HPLC and its degradation. Int J Appl Pharm. 2021;13(5):115-21. doi: 10.22159/ijap.2021v13i5.42113.
EMA. Impurities in new drug substance; International Conference on Harmonization (ICH) Available from: https://www.Q3A.(p.R2).europa.eu/en/ich-q3a-r2-impurities-new-drug-substances-scientific-guideline.
Murali Krishnam Raju P, Venkata Narayana B, Shyamala P, Kondra S, Dantuluri HR. A validated rp-hplc method for impurity profiling of sodium nitroprusside in injection dosage form. Int J App Pharm. 2021;13(1):160-9. doi: 10.22159/ijap.2021v13i1.39534.
Kharat C, Shirsat VA, Kodgule YM, Kodgule M. A validated RP-HPLC stability method for the estimation of chlorthalidone and its process-related impurities in an API and tablet formulation. Int J Anal Chem. 2020 Apr 10;2020:3593805. doi: 10.1155/2020/3593805, PMID 32328101, PMCID PMC7171635.
Thummala VR, Tharlapu SS, Rekulapalli VK, Ivaturi MR, Nittala SR. Development and validation of a stability indicating RP-HPLC method for the estimation of drotaverine impurities in API and pharmaceutical formulation. Sci Pharm. 2014;82(1):99-115. doi: 10.3797/scipharm.1309-06, PMID 24634845, PMCID PMC3951236.
Soliman M, Saad AS, Ismail NS, Zaazaa HE. A validated RP-HPLC method for determination of nitroxinil and investigation of its intrinsic stability. J Iran Chem Soc. 2021;18(2):351-61. doi: 10.1007/s13738-020-02030-w.