
Int J App Pharm, Vol 17, Issue 3, 2025, 312-321Original Article
METHOD DEVELOPMENT AND VALIDATION OF A HIGHLY SELECTIVE AND SPECIFIC POSITIVE POLARITY ESI-LC-MS/MS METHOD FOR SIMULTANEOUS DETERMINATION OF SEMAGLUTIDE AND CANAGLIFLOZIN IN HUMAN PLASMA
JAGAPATHI RAJU VATSAVAYI, NALANDA BABY REVU*
GITAM School of Pharmacy, GITAM (Deemed to be University), Visakhapatnam-530045, Andhra Pradesh (State), India
*Corresponding author: Nalanda Baby Revu; *Email: nrevu@gitam.edu
Received: 10 Dec 2024, Revised and Accepted: 07 Mar 2025
ABSTRACT
Objective: To develop a method capable of simultaneous estimation and quantification of semaglutide and canagliflozin being studied as a potential combination therapy for treating Diabetes.
Materials: An elaborate protein precipitation extraction technique used verapamil as internal standards for semaglutide and canagliflozin. The two compounds were separated on a Zorbax C18 (50 mm x 2.1 mm, 5 µ Particle size) column, with a positive polarity Electro Spray Ionization (ESI) on a Liquid chromatograph with Tandem Mass Spectrometry (LC-MS/MS) instrument. The estimation was through a Multiple Reaction Monitoring (MRM) method, and a gradient program utilizing Acetonitrile and 5 mmol Ammonium formate with 0.1% formic acid as mobile phases to achieve a separation in 2.5 min.
Results: The method established was performing linearly over a working range of 1.00 to 1000 ng/ml for both semaglutide (r2>0.98) and canagliflozin (r2>0.98) in human plasma. The specificity, selectivity, precision, accuracy, recovery, matrix effects and stability were within acceptable limits. The stability was established under various conditions as necessitated by the guideline on Bioanalytical method validation as mentioned in International Council for Harmonisation of Technical Requirements of Pharmaceuticals for Human Use (ICH) M10.
Conclusion: This highly selective and sensitive method where 1.00 ng/ml was employed for semaglutide and canagliflozin as the Lower Limit of Quantification (LLOQ) can be utilized for estimation in human plasma will facilitate the further application to pharmacokinetic, bioequivalence and population pharmacokinetics studies for combination of these two drugs in pharmaceutical dosage forms.
Keywords: Semaglutide, Canagliflozin, Electro spray ionization, Method validation, Mass spectrometer
© 2025 The Authors. Published by Innovare Academic Sciences Pvt Ltd. This is an open access article under the CC BY license (https://creativecommons.org/licenses/by/4.0/)
DOI: https://dx.doi.org/10.22159/ijap.2025v17i3.53379 Journal homepage: https://innovareacademics.in/journals/index.php/ijap
INTRODUCTION
Semaglutide is used in type-2 diabetes and belongs to the Incretin mimetics classification. It is receptor agonist for Glucagon-like peptide-1(GLP-1). It facilitates the release of insulin from the pancreas to counter high blood glucose levels [1]. It is also being employed for weight management due to its anorexic property in addition to reduction of body fat. Semaglutide cannot be administered in Diabetic Ketoacidosis or type 1 diabetes. The exploratory studies conducted by Goldenberg et al. [2] and Li Y. et al. [3] indicate that it enhances the growth of β cells in the Pancreas. The United States Food and Drug Administration (USFDA) and the European Medicines Agency (EMA) in 2017 and 2018 approved subcutaneous once-a-week for type 2 diabetes treatment [4-10]. Lee et al. have developed a related method for quantifying semaglutide in rat brain and plasma [11]. Kapitza et al. have studied the effect of semaglutide on combined oral contraceptive medications [12]. Canagliflozin is used in type 2 diabetes, a Sodium/glucose co-transporter 2 (SGLT2) inhibitor [13-16] that exerts a diuretic effect, resulting in blood pressure and body weight reduction. There are some reported Liquid chromatograph Tandem Mass Spectrometry (LC-MS/MS) methods for determining canagliflozin in plasma with other gliflozins [17], in combination with metformin [18] and estimation alone in rat plasma [19]. This combination of semaglutide and canagliflozin is important due to the synergistic effect in reducing blood glucose levels. Though there are reported methods for bioanalytical for semaglutide and canagliflozin individually, there hasn’t been any reported bioanalytical method reported so far for simultaneous estimation of both semaglutide and canagliflozin in human plasma employing LC-MS/MS.
This combined bioanalytical method was envisioned and validated in human plasma for the first time and can be directly employed in clinical studies for estimating semaglutide and canagliflozin. This method validation was carried out in accordance with the USFDA Guidance on Bioanalytical method validation of 2018 [20] and the International Council for Harmonisation (ICH) M10 guidelines applicable for the Bioanalytical method validation and study sample analysis [21].
MATERIALS AND METHODS
Reagents and chemicals
Methanol and Acetonitrile were procured from J. T. Baker (LC-MS grade). Ammonium formate (LC-MS grade) Sigma Aldrich was used. Type 1 Milli-Q Water was procured internally from the Millipore water system. Human Blood and Plasma lots were procured from Delta Laboratories. Anticoagulant Dipotassium Ethylene Diamine Tetraacetic acid (K2EDTA) was procured from Merck, semaglutide, canagliflozin, and verapamil Analytical Standards were obtained as gift samples.
Instrumentation
All the weighing was carried out using a Mettler Toledo microbalance MX5. The solutions were sonicated for 5 min in an ultrasonicator to perform degassing. Ultra performance Liquid chromatography (Shimadzu Nexera) coupled with a Sciex 4500 lC-MS/MS with Analyst Software 1.7 was employed for Chromatography and a Vortex mixer and Eppendorf centrifuge were used for extraction. This study employed a positive polarity Multiple Reaction Monitoring (MRM) for this estimation.
Preparation of stock and working solutions for analyte and internal standard
Stock solutions of semaglutide and canagliflozin (2 mg/ml) were prepared be weighing 20 mg in a 10 ml volumetric flask. These stocks were prepared individually in Methanol. The calibration standards and the quality control samples were prepared from distinctly separate stocks to rule out weighing differences which could wreck the accurate estimation. The Internal standard stock of verapamil was prepared by dissolving 5 mg in a 5 ml volumetric flask with Methanol to prepare a 1 mg/ml stock. The spiking solutions containing both analytes (20 to 20000 ng/ml, respectively) were prepared using a serial dilution process from an intermediate cocktail stock containing both analytes. A 50% methanol in water solution was employed for the dilution schematic. 250 µl** stock solution of internal standard was added to a 100 ml measuring flask and made up to volume with a 50% methanol in water solution to achieve a 2.5 µg/ml working solution.
Sample preparation
An elaborate Protein Precipitation (PPT) extraction method was used for sample preparation. To prepare calibration samples of semaglutide and canagliflozin in the plasma, 95 μl of the blank human plasma was mixed with 5 μl of the standard working solution, 15 μl of the IS working solution was added with a handy step and precipitated using 800 μl of Acetonitrile in a 2 ml microcentrifuge tube. After mixing on the vortex mixer for 15 min, the mixture was centrifuged at 4000 rpm for 12 min at 9 °C. After centrifugation, 500 μl of supernatant was aliquoted into a 1 ml autosampler shell vial. An Injection volume of 2 μl was optimized considering the response and to avoid peak tailing.
Chromatographic condition
In gradient mode, a reversed-phase chromatographic separation was achieved on a Zorbax C18 (50 mm x 2.1 mm, 5 µ Particle size) at 35 °C using mobile phase (A: 5 mmol Ammonium Formate with 0.1% formic acid and B: Acetonitrile). The autosampler temperature was maintained at 8 °C. The Liquid Chromatograph (LC) binary gradient program was employed with a run time of 2.5 min. The flow rate employed was 0.6 ml/min for the run. All the mobile phases were filtered using a 0.22 µM membrane filter to prevent fine particles from clogging the mobile phase lines. The gradient program was developed to ensure no matrix effects which could cause signal suppression.
Mass spectrometric conditions
An Atmospheric Pressure Ionization (API) 4500 with an Electro Spray Ionization (ESI) interface operated in MRM mode. The semaglutide and canagliflozin (as an ammoniated adduct) were detected and fragmented in positive mode. The instrument was optimized for semaglutide, canagliflozin, and internal standard verapamil during tuning at a concentration of 100 ng/ml prepared in Acetonitrile and water solution (50:50) and infused at a flow rate of 10 µl**/min through a Hamilton infusion pump. The MRM transitions chosen were m/z 1029.1→1302.6 for semaglutide, 462.2→190.7 for canagliflozin and 455.2→165.2 for verapamil used as Internal Standard. Verapamil was selected as the internal standard due to its seamless ionization in the positive mode and adequate compensation of signal fluctuation. The mass spectrometric conditions were augmented for quantification of semaglutide and canagliflozin using an: ESI probe with a source temperature of 550 °C; ion spray voltage of 4500; curtain gas, 20 psi, nebulizing gas (GS1) 50 psi, heater gas (GS2) 40 psi, Declustering Potential (90eV) and a Collision energy (30eV). Verapamil was analysed with a Declustering Potential (80eV), and Collision Energy (17eV). The entrance potential and cell exit potential were maintained at 10eV. Ultra-high pure inert nitrogen gas was the collision gas employed. The optimized parameters resulted in acceptable linearity in the identified range.
Data analysis
Data processing was carried out using Analyst software version 1.6.3. The calibration curves were constructed using the response factor (area ratio of analyte peak area and IS peak area) to the Analyte concentration using linear regression model y = mx+c where y denotes the observed area ratio, m is for slope and c is for intercept respectively, with weighting factor 1/x2. The acceptance criteria were established to be >0.98 for the coefficient of determination (r2) with a minimum of 6 non-zero calibration curve standards i.e., at least 75% of the standards should be acceptable (± 20% bias for a Lower Limit of Quantification (LLOQ) and±15% bias for other standards) for a calibration curve.
Bioanalytical method validation
Calibration and quality control samples
Calibration curves were made by spiking 5 µl** of spiking solution to 95 µl** of blank human plasma. The final concentrations in the plasma samples were 1.00, 3.01, 10.1, 101, 303, 490, 780, and 1000 for semaglutide and 1.00, 3.00, 10.6, 106, 303, 485, 775, and 1000 ng/ml for canagliflozin. The Quality control (QC) samples were set at concentrations of 1.02, 2.90, 450, 770, and 1.01, 2.85, 470, and 790 ng/ml (Lower Limit of quantification QC, Low QC, Mid QC, High QC) for semaglutide and canagliflozin respectively.
Preparation of plasma calibration standards and quality control samples:
The standards were prepared by spiking 5 µl** of the cocktail working solutions to 95 µl** of interference-free blank human plasma
Calibration curve
A cocktail calibration curve was prepared using 8 non-zero standards encircling the range (1.00 – 1000 ng/ml) for semaglutide and canagliflozin. The linearity assessment was conducted through a weighted (1/x2) least squares regression. The linearity assessment was across the tested Precision and accuracy batches. Linearity was assessed by plotting calibration curves (Area ratio of Analyte/IS versus concentration) in human plasma for each of the runs involving quantitation.
Table 1: Acceptance criteria for calibration standards
| Level | Accuracy |
| STD-01 (Lowest Standard) | 100±20% |
| All standards except STD-01 | 100±15% |
Precision and accuracy
To evaluate the Precision and Accuracy of this method, Quality Control samples at four concentrations were analyzed in six replicates for both analytes on three different days from extracted plasma. The acceptance criteria are as follows.
Table 2: Acceptance criteria for quality control samples
| Quality control level | Precision (% CV) | Accuracy |
| Lower limit of Quantification quality control (LLOQQC) | ≤20 | 100±20% |
| Low-Quality control (LQC), Mid Quality control (MQC), High-Quality control (HQC) | ≤ 15 | 100±15% |
Specificity and selectivity
The evaluation for specificity was carried out using six different plasma lots to investigate the interferences for analytes and internal standard at their retention time. The identified lots for this study were processed as per the established process albeit without analytes or internal standard. The acceptance criteria were set as at least five out of six blank lots must have<20% and<5% of interference to the LLOQ area response and Internal standard response at their respective retention times. Selectivity was established by employing the same six blank plasma lots. Each of these lots was spiked individually with semaglutide, canagliflozin, and verapamil to ensure there were no cross contributions across the tested analytes
Recovery
Recoveries were evaluated at three QC levels LQC, MQC and HQC (2.90, 450, and 770 ng/ml for semaglutide and 2.85, 470, and 790 ng/ml for canagliflozin) by comparing the peak area in spiked pooled human plasma samples with those of analyte spiked in neat solutions.
Matrix effect
The matrix effect as suggested by Matuszewski et al. [22] was overridden by the latest quantitative estimation approach (ICH M10) using 6 different interference-free lots and the accuracy of the 6 lots was calculated to determine robustness of the method. This ensured co-eluents if any were not having a suppressive or enhancement effect on the values obtained.
The evaluation of matrix effect was at the LQC and HQC levels. The selected blank lots along with the hemolyzed plasma lot spiked with LQC and HQC and the back-calculated concentrations were estimated to ensure there is no matrix effect in the chosen methodology. The acceptable criteria for the matrix factor should be a mean accuracy of 85% to 115%.
RESULTS AND DISCUSSION
Stability experiments
The stability of semaglutide and canagliflozin in human plasma was assessed by analyzing six replicates of QC samples at low and high levels in four different exposure conditions as follows; (1) The bench top stability where the spiked samples were kept at room temperature (ambient temperature for>12 h; (2) The autosampler stability at autosampler temperature i. e. 8 °C for 20 h, (3) The Freeze thaw stability using five freeze and thaw cycles (24 h for each cycle), and (4) Long term stability for 15 d in the deep freezer at-80 °C. Samples were considered stable if the obtained accuracy was within 85–115% of the nominal concentration.
Fig. 1: Structure of semaglutide
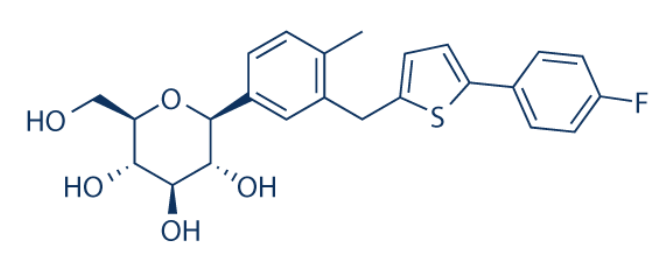
Fig. 2: Structure of canagliflozin
Method optimization
The aim was to develop a rugged and reproducible bioanalytical method appropriate for simultaneously estimating semaglutide and canagliflozin in a single bioanalytical run on the LC-MS/MS system. During the development of the extraction method a protein precipitation approach was found to be best suited to maximize the recovery of semaglutide and canagliflozin. The existing methods for semaglutide in human plasma and related pharmacokinetic studies employed an LLOQ of 3 ng/ml [16-24]. For the tuning of semaglutide (Molecular weight: 4114 daltons), the [M+1] positive charge was beyond the mass range for suitable detection in the selected instrument and hence a multiply charged prominent [M+4] precursor ion 1029.1 was selected during tuning in positive mode. The production of 1302.6 was the chosen fragment, resulting in the best chromatographic response. The main effort was to optimize canagliflozin ionization, forming a stable adduct with Ammonium ions. Therefore, Ammonium formate was employed in the mobile phase. Ammonium formate in the mobile phase assisted in a stable adduct formation, thereby ensuring an error-free quantitation. Canagliflozin was tuned in positive mode with a precursor ion of 462.2. The product of 190.7 along with the precursor of 462.2 yielded the best response. The MRM parameters for MS/MS determination were optimized to maximize for both the analytes. The currently available method can quantify plasma concentrations of semaglutide in human plasma from 3 to 250 ng/ml by Kapitza et al. The method validated in this article ensures a wider linear dynamic range from 1 to 1000 ng/ml, which is handy in Multiple ascending dose (MAD) studies. The currently available method for canagliflozin utilizes an Acetate adduct for the parent ion, which was 503.2 as reported by Van der Aart-van der Beek AB et al., having an LLOQ of 10 µg/l with a 200 µl** processing volume. The method developed by Darshan Bhatt [23] et al. employed a Lower quantification limit of 5 ng/ml for detection in rabbit plasma using a 250 µl** aliquot. However, we have employed a mobile phase to obtain a more stable ammonium adduct with the help of ammonium formate, which has a heightened sensitivity, helping us to achieve an LLOQ of 1 ng/ml. Moreover, the sample processing volume had been optimized to 100 µl**, ensuring lower sample volume consumption during analysis. This is particularly important as lower blood volume can be collected from the subjects during the clinical study.
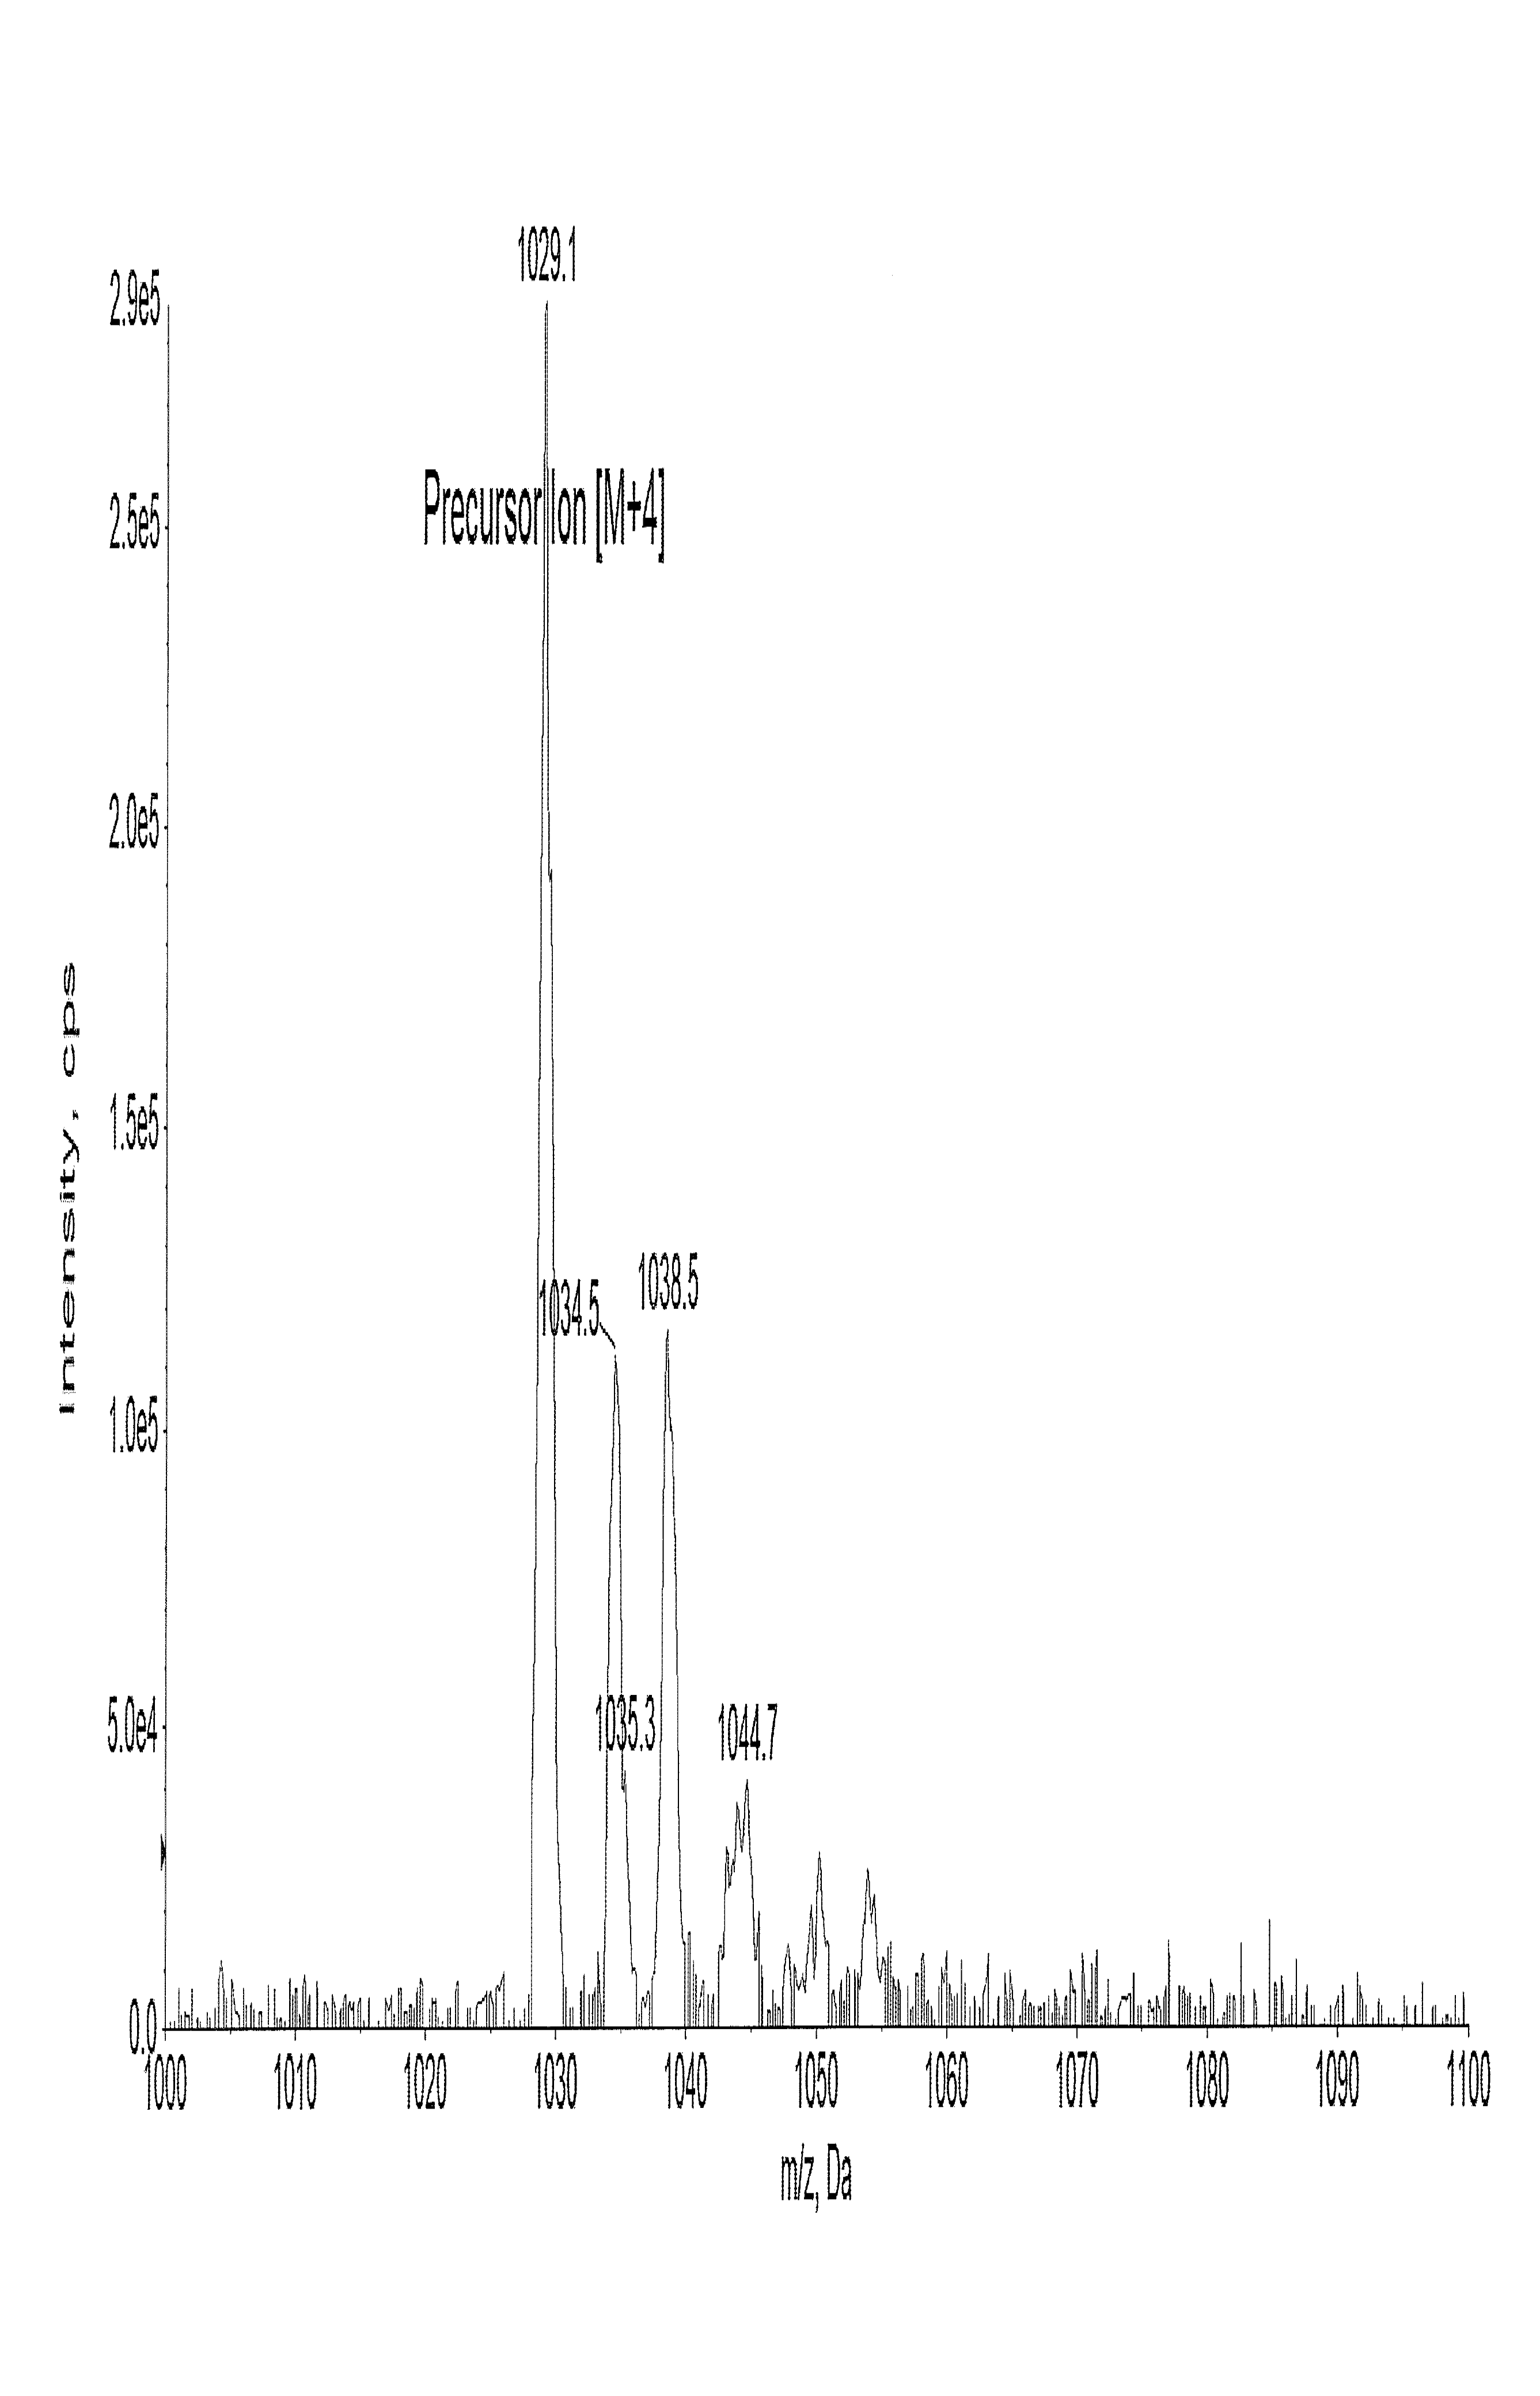
Fig. 3: Full scan mass spectrum of semaglutide
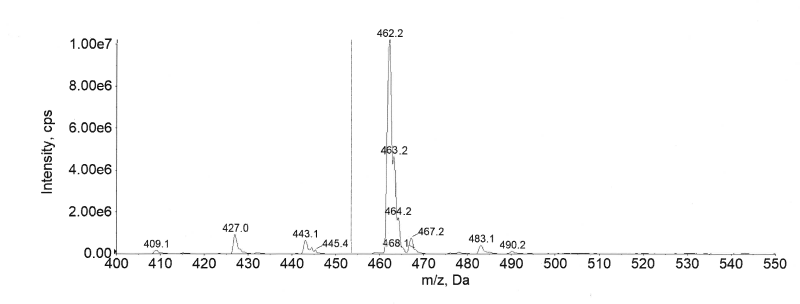
Fig. 4: Full scan mass spectrum of canagliflozin
Calibration curves
The calibration standards were set at standard concentrations of 1.00 to 1000 ng/ml for semaglutide and canagliflozin. The calibration curve (8 non-zero standards) for both analytes displayed a good linear fit with a weighting factor of 1/x2 across the selected range. The eight-point calibration curves were plotted for both analytes with linear fit weighting regression factor. The mean correlation coefficient for the selected analytes in human plasma was 0.998. The calibration curve results for both analytes in human plasma are summarized in table 3.
Table 3: Precision and accuracy data of calibration curve standards for semaglutide and canagliflozin in human plasma
| Matrix | Analyte | Nominal concentration (ng/ml) | Back calculated conc. (ng/ml) | n | CV (%) | Accuracy (%) |
| Human Plasma | semaglutide | 1.00 | 0.917 | 3 | 3.15 | 91.7 |
| 3.01 | 2.86 | 3 | 4.14 | 95.1 | ||
| 10.1 | 9.53 | 3 | 2.64 | 94.4 | ||
| 101 | 97.0 | 3 | 3.72 | 96.0 | ||
| 303 | 290 | 3 | 1.90 | 95.6 | ||
| 490 | 479 | 3 | 2.20 | 97.8 | ||
| 780 | 791 | 3 | 1.34 | 101.5 | ||
| 1000 | 1023 | 3 | 0.81 | 102.3 | ||
| canagliflozin | 1.00 | 0.95 | 3 | 6.68 | 94.8 | |
| 3.00 | 2.80 | 3 | 9.45 | 93.3 | ||
| 10.6 | 10.5 | 3 | 2.35 | 98.9 | ||
| 106 | 102 | 3 | 6.41 | 96.6 | ||
| 303 | 308 | 3 | 3.54 | 101.7 | ||
| 485 | 462 | 3 | 7.98 | 95.2 | ||
| 775 | 743 | 3 | 0.89 | 95.8 | ||
| 1000 | 974 | 3 | 2.44 | 97.4 |
n=3 replicates at each concentration, data presented in mean, % CV, and % Accuracy
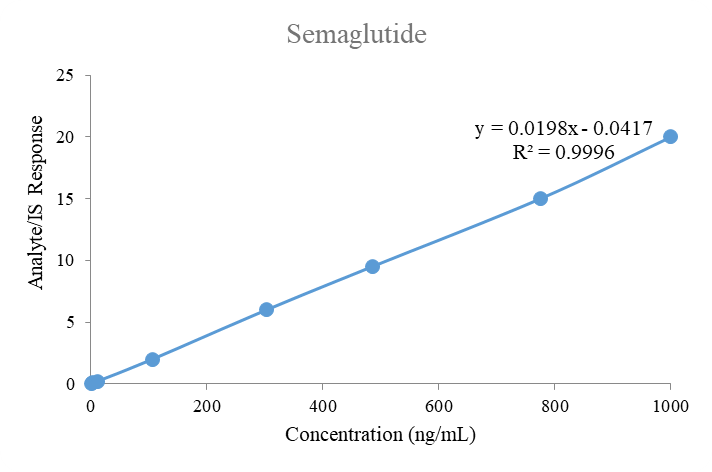
Fig. 5: Linearity plot of semaglutide
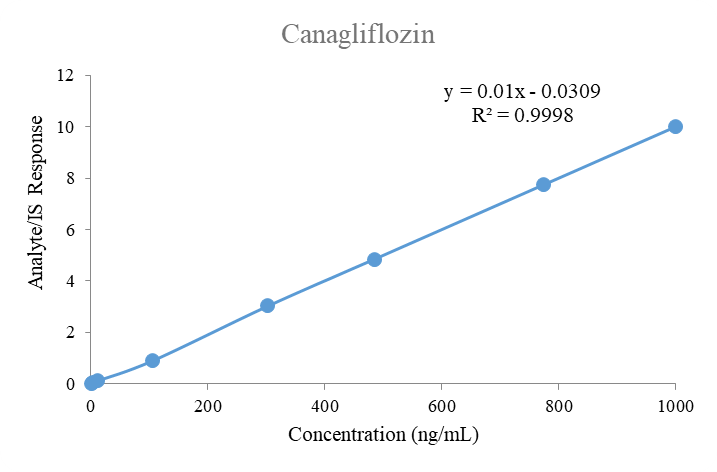
Fig. 6: Linearity plot of canagliflozin
Specificity and selectivity
Specificity and selectivity for this plasma method was studied in six different lots, along with a hyperlipidaemic and a hemolyzed lot to determine the extent of endogenous interferences. Each blank lot was processed in 2 replicates (1 devoid of any spiking and 1 spiked with the spiking solution of LLOQ and Internal Standard). The interference in the blank sample corresponding to each lot was compared against the average peak response at the LLOQ level and respective Internal standard. As shown in fig. 7 and 10, no interference was detected at the retention time of semaglutide and canagliflozin and their internal standard verapamil in the tested samples. As few clinical samples could be hemolyzed or hyperlipidaemic the absence of interference in these lots ensures accurate analyte estimation in those samples also.
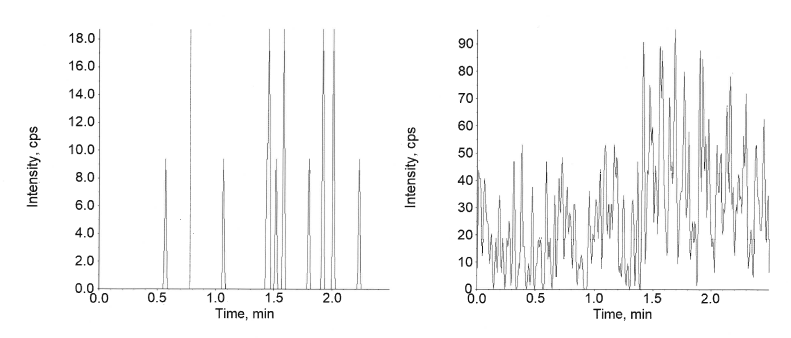
Fig. 7: Extracted blank of semaglutide
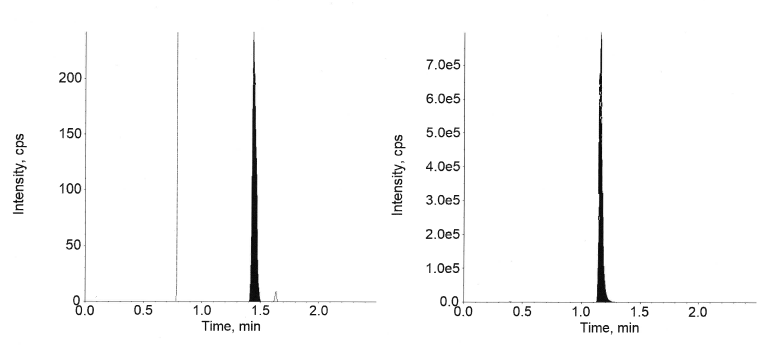
Fig. 8: Extracted LLOQ of semaglutide
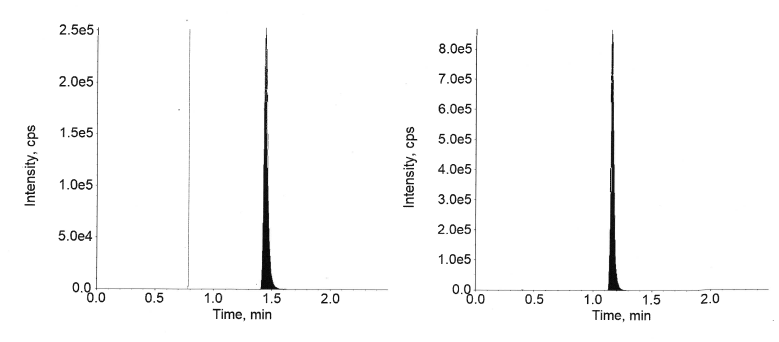
Fig. 9: Extracted ULOQ of semaglutide
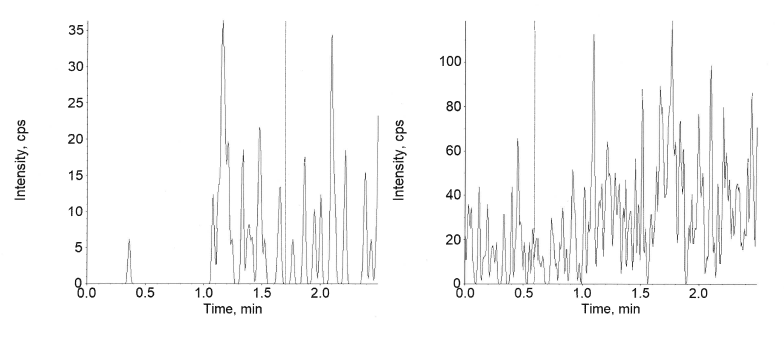
Fig. 10: Extracted blank of canagliflozin
Accuracy and precision
The inter-day and intra-day Accuracy and precision results for semaglutide in plasma are available in tables 4 and 5 and canagliflozin is presented in tables 6 and 7, respectively. The precision and accuracy were assessed at the four QC levels using six replicates at each level. Quality Control levels employed were (1.02, 2.90, 450, and 770 ng/ml) for semaglutide and (1.01, 2.85, 470, and 790 ng/ml) for canagliflozin.
For semaglutide at each QC level, the intra-day accuracy was between 91.4% and 101.6% and precision was between 2.12% and 13.61 %. In the case of inter-day, the accuracy was between 94.5 % and 103.4% and precision was between 3.44% and 9.75%.
For canagliflozin at each QC level, the intra-day accuracy was between 95.7% and 101.1% and precision was between 2.15% and 11.34%. In the case of inter-day, the accuracy was between 95.6 % and 102.7% and precision was between 2.31% and 12.05%.
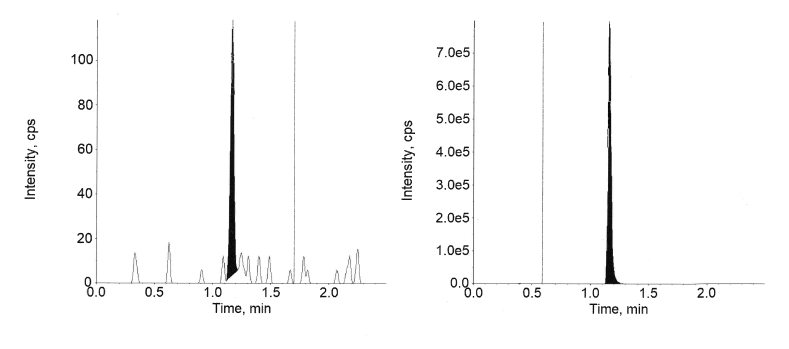
Fig. 11: Extracted LLOQ of canagliflozin
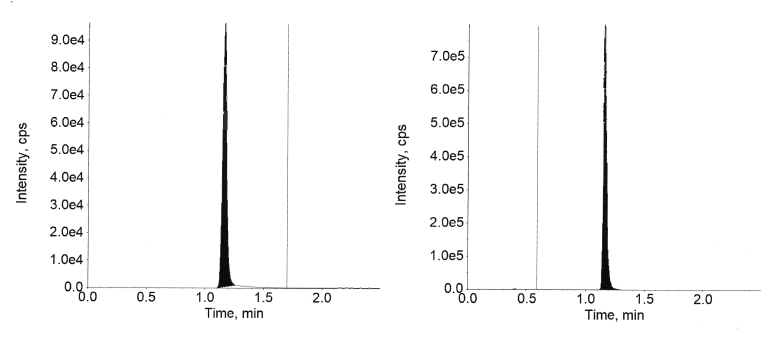
Fig. 12: Extracted ULOQ of canagliflozin
Table 4: Intra-day precision and accuracy for the estimation of semaglutide
| QC level | Nominal conc. (ng/ml) | Back calculated conc. (ng/ml) | Precision (%) | Accuracy (%) |
| LLOQC | 1.02 | 1.01±0.10 | 10.33 | 99.0 |
| LQC | 2.90 | 2.65±0.36 | 13.61 | 91.4 |
| MQC | 450 | 451±42.7 | 9.46 | 100.3 |
| HQC | 770 | 783±16.6 | 2.12 | 101.6 |
n=6 replicates in each concentration, Data presented in (mean±SD)
Table 5: Inter-day precision and accuracy for the estimation of semaglutide
| QC level | Nominal conc. (ng/ml) | Back calculated conc. (ng/ml) | Precision (%) | Accuracy (%) |
| LLOQC | 1.02 | 0.97±0.09 | 9.15 | 95.4 |
| LQC | 2.90 | 2.74±0.27 | 9.75 | 94.5 |
| MQC | 450 | 465±29.9 | 6.41 | 103.4 |
| HQC | 770 | 758±26.1 | 3.44 | 98.4 |
n=6 replicates in each concentration, Data presented in (mean±SD)
Table 6: Intra-day precision and accuracy for the estimation of canagliflozin
| QC Level | Nominal conc. (ng/ml) | Back calculated conc. (ng/ml) | Precision (%) | Accuracy (%) |
| LLOQC | 1.01 | 1.01±0.11 | 11.34 | 100.0 |
| LQC | 2.85 | 2.73±0.12 | 4.49 | 95.7 |
| MQC | 470 | 475±17.8 | 3.75 | 101.1 |
| HQC | 790 | 766±16.5 | 2.15 | 96.9 |
n=6 replicates in each concentration, Data presented in (mean±SD)
Table 7: Inter-day precision and accuracy for the estimation of canagliflozin
| QC level | Nominal conc. (ng/ml) | Back calculated conc. (ng/ml) | Precision (%) | Accuracy (%) |
| LLOQC | 1.01 | 1.04±0.12 | 12.05 | 102.7 |
| LQC | 2.85 | 2.72±0.13 | 4.88 | 95.6 |
| MQC | 470 | 477±19.2 | 4.03 | 101.5 |
| HQC | 790 | 756±17.4 | 2.31 | 95.7 |
n=6 replicates in each concentration, Data presented in (mean±SD)
Extraction recovery
As shown in table 8 and table 9, the extraction recovery for semaglutide was 79.5%, 78.2%, and 77.6% at LQC, MQC, and HQC, respectively. The % CV for semaglutide ranged from 5.88% to 13.57%. Similarly, the extraction recovery for canagliflozin in human plasma was 84.4%, 85.6%, and 82.1% at LQC, MQC, and HQC, respectively. The % CV for canagliflozin ranged from 6.20% to 11.30%. Though the recovery of semaglutide is slightly lower than that of canagliflozin, it is uniform across the tested levels and the results from the validation experiments indicate no impact on the generated data, even at lower levels.
Table 8: Extraction recovery of semaglutide in human plasma
| Level | Mean recovery (%) | %CV |
| LQC | 79.5 | 13.57 |
| MQC | 78.2 | 5.88 |
| HQC | 77.6 | 6.62 |
n=6 replicates in each concentration, Data presented in mean and %CV
Table 9: Extraction recovery of canagliflozin in human plasma
| Concentration (ng/ml) | Mean recovery (%) | %CV |
| LQC | 84.4 | 6.20 |
| MQC | 85.6 | 10.38 |
| HQC | 82.1 | 11.30 |
n=6 replicates in each concentration, data presented in mean and %CV
Matrix effect
The mean Accuracy from the six independent lots to measure the Matrix effect was 94.3% and 97.5%, with a CV of 5.64% and 1.97% at LQC and HQC, respectively, for semaglutide are captured in table 10. The mean accuracy from the six independent lots to measure the Matrix effect was 95.7% and 95.2%, with a CV of 4.49% and 2.15% at LQC and HQC, respectively, for canagliflozin, are captured in table 11. The results indicate that the matrix effect is mitigated to ensure no suppression or enhancement of signal, thereby ensuring accurate estimation.
Table 10: Matrix effect of semaglutide in human plasma
| Concentration (ng/ml) | Mean accuracy % to measure matrix effect | %CV |
| 2.90 | 94.3 | 5.64 |
| 770 | 97.5 | 1.97 |
n=6 replicates in each concentration, data presented in mean and %CV
Table 11: Matrix effect of canagliflozin in human plasma
| Concentration (ng/ml) | Mean accuracy % to measure matrix effect | %CV |
| 2.85 | 95.7 | 4.49 |
| 790 | 95.2 | 2.15 |
n=6 replicates in each concentration, data presented in mean and %CV
Table 12: Stability of semaglutide in human plasma
| Experimental condition | Sample conc. (ng/ml) | Measured conc. (ng/ml) | CV (%) | Stability (%) |
| Human plasma | ||||
| Benchtop stability for 12 h at room temperature 24 °C | 2.90 | 2.72±0.19 | 7.05 | 93.7 |
| 770 | 801±12.0 | 1.50 | 104.0 | |
| Autosampler stability for 20 h at 8 °C | 2.90 | 2.77±0.14 | 5.10 | 95.4 |
| 450 | 472±21.7 | 4.60 | 105.0 | |
| 770 | 772±33.1 | 4.29 | 100.3 | |
| Five freeze-thaw cycles with a 24 h freeze at-80 °C in between the thaws | 2.90 | 2.69±0.19 | 7.14 | 92.6 |
| 770 | 771±23.2 | 3.01 | 100.1 | |
| Long-term stability for 15 d at-80 °C | 2.90 | 2.65 ±0.15 | 5.50 | 91.4 |
| 770 | 767±29.4 | 3.83 | 99.5 |
Measured concentration provided in mean±SD, All stability measurements performed with n=6 replicates
Table 13: Stability of canagliflozin in human plasma
| Experimental condition | Sample conc. (ng/ml) | Measured conc. (ng/ml) | CV (%) | Stability (%) |
| Human plasma | ||||
| Bench top stability for 12 h at room temperature 24 °C | 2.85 | 2.77±0.10 | 3.67 | 97.1 |
| 790 | 752±16.1 | 2.15 | 95.2 | |
| Autosampler stability for 20 h at 8 °C | 2.85 | 2.68±0.17 | 6.49 | 94.0 |
| 470 | 477±22.9 | 4.81 | 101.4 | |
| 790 | 801±12.0 | 1.50 | 101.4 | |
| Five freeze-thaw cycles with a 24 h freeze at-80 °C in between the thaws | 2.85 | 2.73±0.12 | 4.49 | 95.7 |
| 790 | 752±18.6 | 2.48 | 95.1 | |
| Long-term stability for 15 d at-80 °C | 2.85 | 2.77±0.10 | 3.67 | 97.1 |
| 790 | 766±16.5 | 2.15 | 96.9 |
Measured concentration provided in mean±SD, all stability measurements performed with n=6 replicates
Stability
The stability of semaglutide and canagliflozin was evaluated in human plasma and the results are presented in tables 12 and 13, representing that any degradation, if evident is within the acceptable 15%, at ambient temperature, in the autosampler, after five freeze and thaw cycles and on long storage for 15 d at-80 °C in freezers. The stability results indicate that the applicability of the method within the set criteria as outlined by the ICH guidelines.
CONCLUSION
A robust method was developed in the current study, which was comprehensively validated to quantify two antidiabetic drugs, semaglutide and canagliflozin, simultaneously in human plasma using a cost-effective LC-MS/MS approach. This method will enable its application to pharmacokinetic studies and a blend of these drugs in pharmaceutical dosage forms and prospective new pharmaceutical formulations. This reproducible extraction technique and the optimized chromatography resulted in the ideal outcomes. The procedure captured is easy to adopt and was designed to ensure easy adaptability for future exploratory studies, early-phase clinical trials and therapeutic drug monitoring. This method could be used as a reference and could be used as a basis to other combinations of GLP-1 receptor agonists and SGLT2 inhibitors.
ACKNOWLEDGEMENT
The authors are thankful to the management of GITAM University, Visakhapatnam, Andhra Pradesh, India, for providing the necessary support to carry out the research work.
AUTHORS CONTRIBUTIONS
Jagapathi Raju Vatsavayi-Conceptualization, Experimentation, Writing–Original draft and Nalanda Baby Revu-Data Curation, Review, Editing.
CONFLICT OF INTERESTS
The authors declare that they have no known competing financial interests or personal relationships that could have appeared to influence the work reported in this paper.
REFERENCES
Marso SP, Bain SC, Consoli A, Eliaschewitz FG, Jodar E, Leiter LA. Semaglutide and cardiovascular outcomes in patients with type 2 diabetes. N Engl J Med. 2016;375(19):1834-44. doi: 10.1056/NEJMoa1607141, PMID 27633186.
Goldenberg RM, Steen O. Semaglutide: review and place in therapy for adults with type 2 diabetes. Can J Diabetes. 2019;43(2):136-45. doi: 10.1016/j.jcjd.2018.05.008, PMID 30195966.
Li Y, Hansotia T, Yusta B, Ris F, Halban PA, Drucker DJ. Glucagon-like peptide-1 receptor signaling modulates beta-cell apoptosis. J Biol Chem. 2003;278(1):471-8. doi: 10.1074/jbc.M209423200, PMID 12409292.
Meier JJ. Efficacy of semaglutide in a subcutaneous and an oral formulation. Front Endocrinol (Lausanne). 2021;12:645617. doi: 10.3389/fendo.2021.645617, PMID 34248838, PMCID PMC8269445.
Jensen L, Helleberg H, Roffel A, van Lier JJ, Bjørnsdottir I, Pedersen PJ. Absorption, metabolism and excretion of the GLP-1 analogue semaglutide in humans and nonclinical species. Eur J Pharm Sci. 2017;104:31-41. doi: 10.1016/j.ejps.2017.03.020, PMID 28323117.
Marbury TC, Flint A, Jacobsen JB, Derving Karsbøl J, Lasseter K. Pharmacokinetics and tolerability of a single dose of semaglutide, a human glucagon-like peptide-1 analog, in subjects with and without renal impairment. Clin Pharmacokinet. 2017;56(11):1381-90. doi: 10.1007/s40262-017-0528-2, PMID 28349386, PMCID PMC5648736.
Overgaard RV, Navarria A, Ingwersen SH, Baekdal TA, Kildemoes RJ. Clinical pharmacokinetics of oral semaglutide: analyses of data from Clinical Pharmacology trials. Clin Pharmacokinet. 2021;60(10):1335-48. doi: 10.1007/s40262-021-01025-x, PMID 33969456, PMCID PMC8505367.
Jensen L, Kupcova V, Arold G, Pettersson J, Hjerpsted JB. Pharmacokinetics and tolerability of semaglutide in people with hepatic impairment. Diabetes Obes Metab. 2018;20(4):998-1005. doi: 10.1111/dom.13186, PMID 29205786, PMCID PMC5873441.
Baekdal TA, Thomsen M, Kupcova V, Hansen CW, Anderson TW. Pharmacokinetics, safety, and tolerability of oral semaglutide in subjects with hepatic impairment. J Clin Pharmacol. 2018;58(10):1314-23. doi: 10.1002/jcph.1131, PMID 29693715, PMCID PMC6175428.
Kute SA, Chothave MS, Rote PB, Kapadnis AA, Kale VV. Exploring the unintended consequences of misuse of wegovy and ozempic in weight management: a comprehensive review. Int J Pharm Pharm Sci. 2024;16(6):10-3. doi: 10.22159/ijpps.2024v16i6.50611.
Lee TS, Park EJ, Choi M, Oh HS, An Y, Kim T. Novel LC-MS/MS analysis of the GLP-1 analog semaglutide with its application to pharmacokinetics and brain distribution studies in rats. J Chromatogr B Analyt Technol Biomed Life Sci. 2023 Apr 15;1221:123688. doi: 10.1016/j.jchromb.2023.123688, PMID 36989942.
Kapitza C, Nosek L, Jensen L, Hartvig H, Jensen CB, Flint A. Semaglutide, a once-weekly human GLP-1 analog, does not reduce the bioavailability of the combined oral contraceptive, ethinylestradiol/levonorgestrel. J Clin Pharmacol. 2015;55(5):497-504. doi: 10.1002/jcph.443, PMID 25475122, PMCID PMC4418331.
Gumieniczek A, Berecka A. Analytical tools for determination of new oral antidiabetic drugs, glitazones, gliptins, gliflozins, and glinides, in bulk materials, pharmaceuticals, and biological samples. Open Chem. 2016;14(1):215-42.
DeFronzo RA, Ferrannini E, Groop L, Henry RR, Herman WH, Holst JJ. Type 2 diabetes mellitus. Nat Rev Dis Primers. 2015;1:15019. doi: 10.1038/nrdp.2015.19, PMID 27189025.
Scheen AJ, Paquot N. Metformin revisited: a critical review of the benefit-risk balance in at-risk patients with type 2 diabetes. Diabetes Metab. 2013;39(3):179-90. doi: 10.1016/j.diabet.2013.02.006, PMID 23528671.
Sarkar S, Sadhu S, Roy R, Tarafdar S, Mukherjee N, Sil M. Contemporary drifts in diabetes management. Int J App Pharm. 2023;15(2):1-9. doi: 10.22159/ijap.2023v15i2.46792.
Van der Aart-van der Beek AB, Wessels AM, Heerspink HJ, Touw DJ. Simple, fast and robust LC-MS/MS method for the simultaneous quantification of canagliflozin, dapagliflozin and empagliflozin in human plasma and urine. J Chromatogr B Analyt Technol Biomed Life Sci. 2020 Sep 1;1152:122257. doi: 10.1016/j.jchromb.2020.122257, PMID 32663790.
Wattamwar T, Mungantiwar A, Gujar S, Pandita N. Development of LC-MS/MS method for simultaneous determination of canagliflozin and metformin in human plasma and its pharmacokinetic application in Indian population under fast and fed conditions. J Chromatogr B Analyt Technol Biomed Life Sci. 2020 Oct 1;1154:122281. doi: 10.1016/j.jchromb.2020.122281, PMID 32763846.
Kobuchi S, Yano K, Ito Y, Sakaeda T. A validated LC-MS/MS method for the determination of canagliflozin, a sodium-glucose co-transporter 2 (SGLT-2) inhibitor, in a lower volume of rat plasma: application to pharmacokinetic studies in rats. Biomed Chromatogr. 2016 Oct;30(10):1549-55. doi: 10.1002/bmc.3720, PMID 26989857.
US Food and Drug Administration. Bioanalytical method validation: guidance for industry. Silver Spring, MD; 2018.
ICH guideline M10 on Bioanalytical method validation and study sample analysis; 2023.
Matuszewski BK, Constanzer ML, Chavez Eng CM. Strategies for the assessment of matrix effect in quantitative bioanalytical methods based on HPLC-MS/MS. Anal Chem. 2003;75(13):3019-30. doi: 10.1021/ac020361s, PMID 12964746.
Bhatt D, Rajkamal BA. Validated LC-MS/MS method for pharmacokinetic study of canagliflozin in healthy rabbits. Int J Pharm Pharm Sci. 2018;10(2):80-6. doi: 10.22159/ijpps.2018v10i2.23245.