
Int J App Pharm, Vol 17, Issue 3, 2025, 228-236Original Article
HPLC METHOD DEVELOPMENT AND VALIDATION FOR METFORMIN AND PHENYL BUTYRIC ACID AND IN VITRO EVALUATION OF THEIR PEGYLATED LIPOSOMAL FORMULATION AGAINST COLORECTAL CANCER
HUSSEIN S. JANABI1,2, ZAINAB LAFI1,3*, SINA MATALQAH1,3
1Pharmacological and Diagnostic Research Center, Faculty of Pharmacy, Al-Ahliyya Amman University, Jordan. 2College of Pharmacy, Uruk University, Baghdad, Iraq. 3Department of Pharmaceutics and Pharmaceutical Technology, Al-Ahliyya Amman University, Amman, Jordan
*Corresponding author: Zainab Lafi; *Email: z.lafi@ammanu.edu.jo
Received: 17 Dec 2024, Revised and Accepted: 07 Apr 2025
ABSTRACT
Objective: This study aimed to develop a PEGylated liposomal formulation combining Metformin (MET) and Phenyl Butyric Acid (PBA) for colorectal cancer treatment. Current colorectal cancer therapies face limitations such as poor drug solubility, rapid clearance, and systemic toxicity. Combining MET and PBA in liposomes could potentially overcome these limitations by enhancing drug stability, prolonging circulation time, and improving targeted delivery.
Methods: A High-Performance Liquid Chromatography (HPLC) method was optimized and validated for the simultaneous quantification of MET and PBA, achieving calibration curve R² values above 0.99. Liposomal formulations were prepared, and encapsulation efficiencies were evaluated. Sustained drug release was studied over 72 h at 37 °C. Cytotoxicity assays were conducted using colorectal cancer cell lines HCT116 and HT29. Additionally, colony formation assays assessed the formulation's long-term effects on cell proliferation.
Results: The liposomal formulation showed encapsulation efficiencies of 48% for Lip-MET and 56.8% and 83.9% for Lip-MET-PBA. Sustained release profiles were observed, with 60% of MET and 55% of PBA released over 72 h. Cytotoxicity assays revealed that Lip-MET-PBA significantly reduced cell viability in HCT116 and HT29 cell lines, with IC50 values of 0.65 mmol and 0.82 mmol, respectively, compared to MET alone (1.1 mmol and 1.3 mmol). Colony formation assays demonstrated a concentration-dependent reduction in colony numbers, highlighting the enhanced anticancer efficacy of the combination. Statistical analysis showed significant differences (p<0.05) in cell viability and colony formation between the liposomal formulation and the free drugs.
Conclusion: This is the first PEGylated liposomal formulation combining MET and PBA, offering a promising strategy for colorectal cancer therapy. The formulation combines sustained release, improved cytotoxicity, and a significant impact on colony formation, warranting further in vivo investigations.
Keywords: HPLC validation, Liposomes, Combination, Nanoparticles, Colorectal cancer
© 2025 The Authors. Published by Innovare Academic Sciences Pvt Ltd. This is an open access article under the CC BY license (https://creativecommons.org/licenses/by/4.0/)
DOI: https://dx.doi.org/10.22159/ijap.2025v17i3.53441 Journal homepage: https://innovareacademics.in/journals/index.php/ijap
INTRODUCTION
Cancer is a disease marked by uncontrolled cell growth, leading to tumor formation that harms the body. These cancerous cells can also spread to other parts of the body, a process known as metastasis, causing damage to new organs. The most common types of cancer include lung, breast, colorectal, prostate, stomach, and non-melanoma skin cancers, but over 100 types have been identified. Colorectal cancer is the third most common cancer worldwide, affecting both men and women, with more than 50,000 deaths reported in the U. S. in 2021 alone [1]. The most important sign of colorectal cancer is rectal bleeding. Other symptoms may include blood in the stool, changes in bowel movements, anemia, fatigue, and constipation. The most specific diagnostic tool for colorectal cancer is colonoscopy, which allows for direct visualization of the colon and rectum. Additional diagnostic tools include MRI and CT scans, which can help assess the extent of the disease and identify any metastasis [2].
Liposomes are a well-known drug delivery system, defined as colloidal, spherical nanoparticles with a membrane that ranges from 50 to 200 nm in size. They consist of a bilayer of lipids that encapsulate therapeutic agents. Liposomes offer several advantages: they are biocompatible and biodegradable, and they protect encapsulated drugs from degradation. Lipid-soluble drugs are incorporated into the bilayer, while water-soluble drugs are contained within the vesicle’s core. This structure helps in delivering drugs effectively to targeted areas while minimizing side effects [3-6].
Recent advancements in PEGylated liposomes have shown significant promise in cancer therapy. PEGylation, the process of attaching Polyethylene Glycol (PEG) chains to liposomes enhances their stability and prolongs their circulation time in the bloodstream. This modification reduces the recognition and clearance by the immune system, allowing for more effective drug delivery to tumor sites. PEGylated liposomes have been successfully used to deliver various anticancer drugs, improving their therapeutic efficacy and reducing systemic toxicity [7-9].
Liposomes can exploit the increased intercellular space found in tumors compared to normal tissues. The larger gaps between cancer cells, which range from 100 to 700 nm depending on the cancer type, allow liposomes to penetrate and accumulate within the tumor more effectively. This enables the targeted delivery and release of the encapsulated drug directly at the tumor site, enhancing therapeutic efficacy while minimizing off-target effects [10].
Metformin (MET) is one of the most widely prescribed medications globally, primarily used to manage Type 2 Diabetes Mellitus (T2DM). It is known for its affordability, effectiveness, and safety. Since its introduction in the 1950s, metformin has become a cornerstone in diabetes treatment due to its ability to lower blood glucose levels and improve insulin sensitivity [11-20]. This study aims to develop a PEGylated liposomal formulation combining MET and PBA for colorectal cancer treatment. The objectives are to optimize and validate a High-Performance Liquid Chromatography (HPLC) method for the simultaneous quantification of MET and PBA. Evaluate the encapsulation efficiencies and sustained drug release profiles of the liposomal formulations. Finally, Assess the cytotoxicity and long-term effects on cell proliferation using colorectal cancer cell lines HCT116 and HT29.
MATERIALS AND METHODS
Metformin HCl (MET) was obtained from Dar al-Dawa pharmaceutical company Phenyl Butyric Acid (PBA) was obtained from ICT (Japan). 1,2-distearoyl-sn-glycero-3-phosphoethanolamine-N-[amino(polyethylene glycol)-2000] (ammonium salt) and 1,2-Dipalmitoyl-Sn-Glycero-3-Phosphocholine (DPPC) was obtained from Avanti Polar Lipids, Inc. (Alabaster, Alabama, USA) and Cholesterol (CHO) was obtained from Carbosynth (UK). Phosphate Buffer Saline (PBS) was from LONZA® (USA). HPLC grade methanol and ethanol were from Sigma-Aldrich (USA) and the carbon group-England, respectively. All chemicals and solvents were of high purity.
Development of method of analyst based on HPLC
Analyses were performed on HPLC system consisted of Shimadzu LC-2030 equipped with UV Detector (Shimadzu Corporation, Kyoto, Japan). Separation was carried out using Thermo Scientific™ Hypersil™ BDS C18 HPLC Column, 100Å, 5µm, 4.6 x 150 mm stationary phase utilizing mobile phase containing Methanol: water 70:30; v/v) (pH= 2.8).
Statistical acquisition, recording, and chromatographic integration were achieved using Lab Solutions version 5.92. The mobile phase was filtered through a nylon milli pore (0.2μm) membrane filter, degassed before use, and pumped at a flow rate of 1.0 ml/min, and the injection volume was 10 μl. The analytical column was kept at 40 °C. The chromatographic run time was set to 10 min. MET and PBA were detected at 210 nm [21].
Standard solution and limit of detection (LOD) and limit of quantification (LOQ)
Stock solutions of MET and PHA (1 mg/ml) were prepared by dissolving 1 mg/ml ethanol. Then, 8 serial dilutions were done. Finally, calibration curves were graphed composing of standard solutions with increasing concentrations that were used in the linearity assay. All solutions were filtered through a 0.45 μM cellulose membrane and injected into the HPLC system (n=3). Low limit of Detection (LOD) and low limit of Quantification (LOQ) were measured from the calibration plot based on the following equations (1, 2):


The statistical method used for comparing the LOD and LOQ involved calculating the standard deviation of the response (σ) and the slope of the calibration curve (S). To compare the calculated and measured values of LOD and LOQ, paired t-tests was used to assess any significant differences. This statistical approach ensures the reliability and accuracy of our method [22].
Precision and repeatability
The precision was evaluated by measuring samples with same concentrations for both drugs 0.13, 0.3 and 0.6 mg/ml (MET and PBA) at three different days (interday precision) and we expressed the precision as Relative Standard Deviation (RSD) (ICH Q8, 2009).
The repeatability was evaluated by measuring samples with same concentrations for both drugs 0.13, 0.3 and 0.6 mg/ml (MET and PBA) in a single day (intraday precision) and we expressed the precision as RSD as well.
Accuracy and recovery
Accuracy was done by triplet measuring of sample of known three different concentrations of PBA and MET and standard solutions (ICH Q8, 2009).
Robustness of the validated method
Robustness was done by measuring the samples on different parameters such as temperature, flow rate and wavelength. It was also done in triplicate for each parameter (ICH Q8, 2009).
Liposomes preparation
Liposomes were formed by ethanol injection method. As DPPC 8.5 mg, CHO, 2 mg, DSPE-PEG 0.8 mg and 1 mg of PBA were dissolved in 1 ml of ethanol, then 1 mg of metformin was dissolved in 3 ml of PBS and heated to 50 °C using hot plate. The ethanol was injected rapidly into the PBS by syringe with continuous stirring 500 rpm and left for 1 h to let the vesicle form [5]. During the ethanol injection method, temperature variations were managed by conducting the process on a hot plate set to 50 °C. This temperature was maintained consistently throughout the injection and stirring process to ensure uniform liposome formation. The temperature was monitored using a digital thermometer to prevent any deviations (fig. 1).
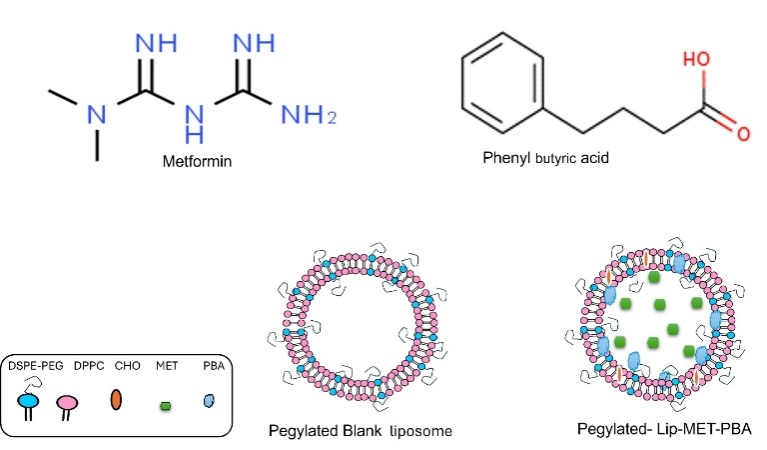
Fig. 1: Structure of metformin and phenyl butyric acid, images of pegylated blank liposomal and Lip-MET-PBA
Then, the formed suspension was passed through a polycarbonate membrane multiple times, if necessary, using a Mini-Extruder (Avanti Polar Lipids, Inc. USA) at 50 °C to obtain the proposed size (100 nm, Whatman®). This process was repeated 13 times to obtain liposomes with low polydispersity and the desired size. The newly formed liposomes were centrifuged to eliminate any free medications and stored at 4 °C [23]. The reproducibility of the extrusion process was tested by performing multiple extrusions of the same liposomal formulation and measuring the resulting particle size and Polydispersity Index (PDI). Each extrusion was repeated 13 times, and the consistency of the results was evaluated to confirm the reproducibility of the process.
Characterization of formed liposomes
Zetasizer® device was used to measure the characteristics of the new formed vesicles; these measurements include hydrodynamic diameter, PDI and charge (ζ-Potential) by Dynamic Light Scattering (DLS) Technique. The average Particle Size, Zeta Potential (charge) and PDI for liposomes were measured by DLS experiments using Zetasizer, Nano-ZS (Malvern Instruments Ltd., Malvern, UK). The liposomal samples were diluted with deionized water at a ratio of 20:980 μl (v/v) to achieve a suitable counting rate. Before the measurement, all samples were placed in the specimen holder of a Zetasizer and allowed to reach room temperature equilibrium for 60 sec.
Encapsulation efficiency (EE %) and loading efficiency (LO%)
The EE % and LO % of MET and PBA into liposomes was expressed as the percentage of drug encapsulated inside liposomes and calculated using the following equations (3, 4):


In vitro stability of loaded liposomes
The stability test for the liposomes was done at 4C⁰ for one month. Liposomes were collected (10-20 μl) every day, diluted with deionized water and entered Zetasizer®. The mean hydrodynamic diameter, Zeta Potential and PDI of the loaded liposomes were determined every day using a similar DLS method described before.
Release of the medications
Liposomes suspension of 1 ml PBS were added in a dialysis bag (molecular weight cut off [MWCO] 100 kDa, Thermo Fisher Scientific). The dialysis system that contains 1 ml of sample was inserted in a release volume of 15 ml PBS, pH 7.4, at 37 °C with continuous shaking. At scheduled intervals, 500 μl of the release medium was collected for the HPLC assay. To keep the release volume stable, the same amount of PBA was added after each withdrawal. The dialysis bag length was kept constants for all samples to keep the release surface area constant for all [23].
Lyophilization of liposomal formulations
After the liposomes were prepared, we kept them at-70 °C for 24 h, underwent freeze-drying for an additional 24 h, and moved for refrigerating for one week at 4 °C. Then we reconstituted the liposomes in deionized water and evaluated the stability by using the DLS and scanned them by full IR spectrum [23].
Fourier transform-infrared (FTIR) spectroscopy.
FTIR spectroscopy for the lyophilized liposome characterization was performed using Perkin-Elmer Spectrum Two with universal ATR FT-IR Spectrometer over a spectrum range 4000 to 650 cm-1 [24].
Cell viability assay (MTT assay)
To determine the IC50 of Free MET-PBA mix (MET-PB), MET (MET), Lip-MET and Lip-MET-PBA were added on cell lines, an MTT Assay was done by using 200 mmol concentration of each treatment. HCT116 and HT29 cell Lines were seeded at a density of approximately 9 × 10³ cells/well in a 96-well plate (Corning, USA). A variety of concentrations of treatment ranging from 0.001 to 400 μM were added to all cell lines. Then, the cells were incubated at 37 °C in a 5% CO2 incubator for 72 h. After incubation, the old media was removed, and 100 μl of new fresh media containing MTT Assay salt (Bioworld, USA) was added to each well. The plates were then incubated at 37 °C for an additional 3 h. After that, 50 μl of solubilization solution Dimethyl Sulfoxide (DMSO) was added to each well to assess cell viability. The absorbance of the solution was measured at 560 nm using a Glomax plate reader (Promega, USA). For the cytotoxicity assays, three biological replicates for each treatment condition were performed. This ensures the reliability and reproducibility of the results [23].
Colony formation assay
Both colorectal cell lines, HCT16 and HT29 were seeded into 6-well plates at 5000 cells in each well and kept in a 5% CO2 37 °C in a 2 ml media for 24 h. Following the first day of seeding, the media was removed, and cells were washed with PBS. Then all wells were treated of two dilutions (1 mmol) and (2 µM) of MET, PBA and MET-PBA-free drugs, and their liposomes. The media was replaced continuously as needed for two weeks, After two weeks, cells were fixed with formalin and crystal violet dye was added. Then cell colonies were observed and counted [25].
Statistical analysis
Dose-Response Analysis: Non-linear regression was used to fit the dose-response curves and determine the IC50 values for each treatment. The data were analyzed using GraphPad Prism software, which provides a robust platform for fitting non-linear models and calculating the corresponding parameters.
RESULTS
Characterization of formed liposomes
Our study showed that the prepared liposomes by ethanol injection method then performing the extrusion process helped achieving the desirable size of the liposomes, which was between 100-200 nm. It also contributed to having the desirable PDI as it ranging from 0.07 to 0.2. The zeta potential is in the optimum range as well. The measurements for the formulas were different depending on the loaded drugs. The stability was evaluated for a period of 30 days and the formulas gave excellent stability in terms of hydrodynamic diameter, PDI and charge (fig. 2A, 2B, 2C, D).
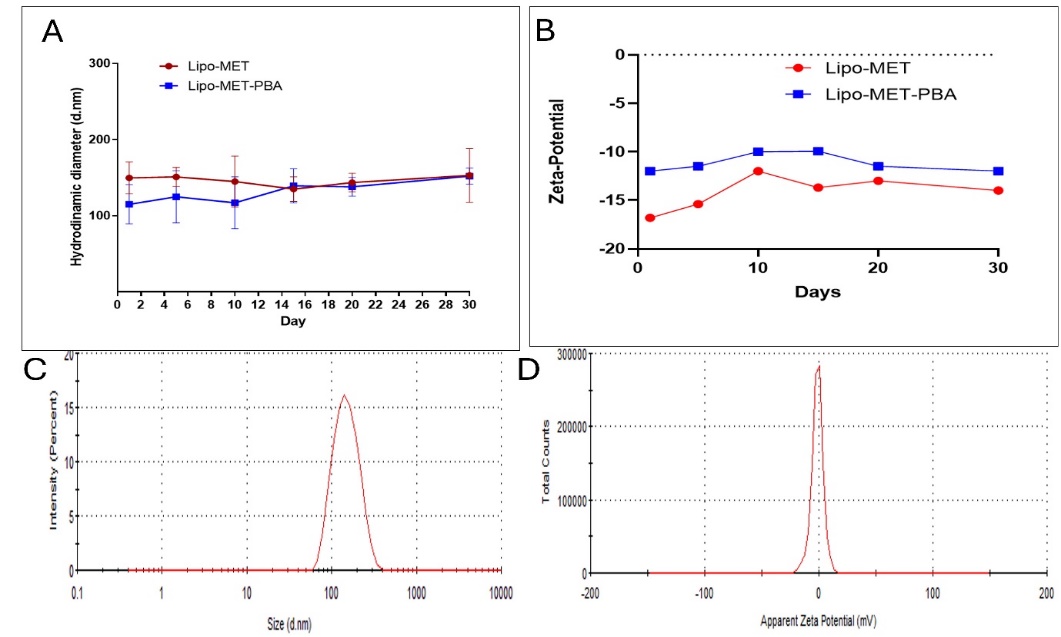
Fig. 2: Stability size distribution and zeta potential over one month of Lip-MET and Lip-MET-PBA (each experiment was done three times, mean±SD n=3)
Fourier transform-infrared (FTIR) spectroscopy
Lyophilized liposomes encapsulating with MET and PBA were analyzed utilizing FTIR spectroscopy (fig. 3). The liposomes spectrum showed abroad band between 3700 and 3100 cm-1 for O-H stretching of phosphate and cholesterol phenol groups. Additionally, notable bands were found at 2857 and 2927 cm-1 for CH3 and CH2, respectively, that corresponded to intermolecular interactions between phospholipids hydrocarbon chain via van der Waals interactions. Furthermore, lip-MET-PBA spectrum showed a 1169 cm-1 band corresponding to the ether linkage of polyethylene groups (PEG). A spectrum of a low-intensity stretching bands for C=O and C=C that may be attributed to the aromatic and carbonyl groups of the encapsulated PBA. Lip-MET-PBA spectrum may act as a good indication for liposomes stability before and after lyophilization. Spectrums of MET and PBA displayed N-H band and for O-H stretching in the 3700 and 3100 cm-1, respectively. Furthermore, stretching bands for C=O and C=C may be attributed to the aromatic and carbonyl group in PBA in its powder spectrum.
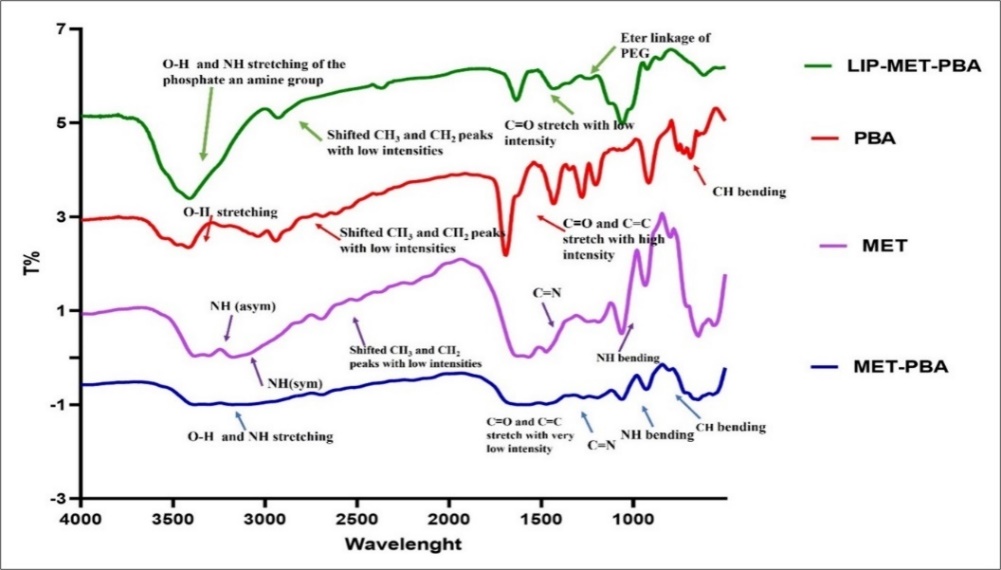
Fig. 3: IR spectroscopy for MET, PBA, MET-PBA and LIP-MET-PBA
In vitro drug release
HPLC analyses were done to find the calibration curve for MET, PBA and to validate our method. The EE% and LE% were also determined using this analysis. The results of the EE were 48.4% for Lip-MET and 56.8% and 83.9% for Lip-MET-PBA (fig. 4A). In vitro release showed Lip-MET-PBA had a slower release rate than the free mix, this is expected due to the encapsulation inside the bilayer system. It took 6 h for the release of 30% and 70% of PBA and MET from the liposomes, respectively. While 25% and 55% of PBA and MET were released from the free mix within the first hour (fig. 4B). Encapsulation within liposomes can lead to a controlled and sustained release of the drugs, reducing the initial burst effect and potentially lowering the immediate cytotoxic impact. Additionally, the liposomal delivery system may alter the intracellular uptake and distribution of the drugs, affecting their cytotoxicity.
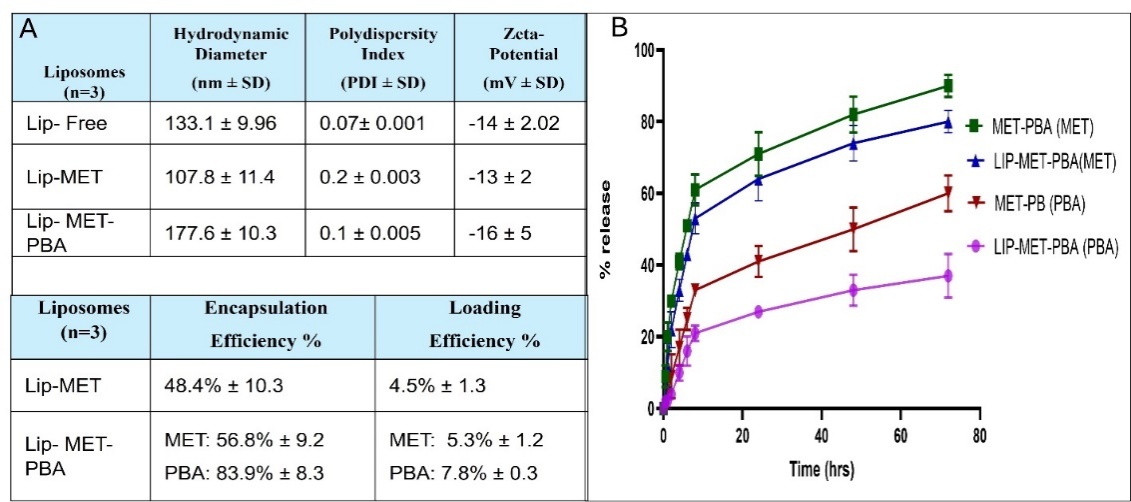
Fig. 4: (A) Summary table for the average hydrodynamic diameter, zeta potential, PDI, Encapsulation efficiency (EE%) and Loading Efficiency (LE%) (B) Release profile of both MET and PBA from Lip-MET-PBA and MET-PBA at 37 °C (each experiment was done three times, mean±SD n=3)
HPLC analysis and validation of developed method
Our method was validated according to the International Conference on Harmonization guidelines regarding the following parameters: linearity, precision, accuracy, and robustness. Fig. 5C illustrates chromatogram of MET and PBA in which simultaneous detection of the two drugs at the same HPLC conditions.
All the values we got were expressed as RSD. Precision and repeatability values were expressed as RSD and since it was below 2 this means our method was precise. Same goes for linearity, accuracy and recovery and robustness.
Linearity and limit of detection and limit of quantification
The Calibration Curves of MET, PBA and mixed MET-PBA were established using standard solution (1-0.0165 mg/ml) with an excellent determination coefficient more than 0.997 for both drugs (fig. 5A, 5B). The ICH showed that the lowest concentration for detection (LOD) that can be detected is important to be evaluated and quantitated. However, the lowest quantity of analysts in the sample that can be quantified is defined as the limit of quantification (LOQ). The concentrations that were calculated from linear regression statistics according to equations that represent LOD and LOQ were (0.016 mg/ml and 0.059 mg/ml for MET and were (0.03 mg/ml and 0.12 mg/ml) for PBA, respectively. The estimated values meet performance requirements for the method. The calculated LOD and LOQ were evaluated using multiple injections of the estimated values. The measured LOD and LOQ of both MET and PBA were found and were (0.0156 mg/ml and 0.08 mg/ml) and (0.017 mg/ml and 0.12), respectively. No significant difference was found when comparing the calculated and measured values (p ˂ 0.005) [26].
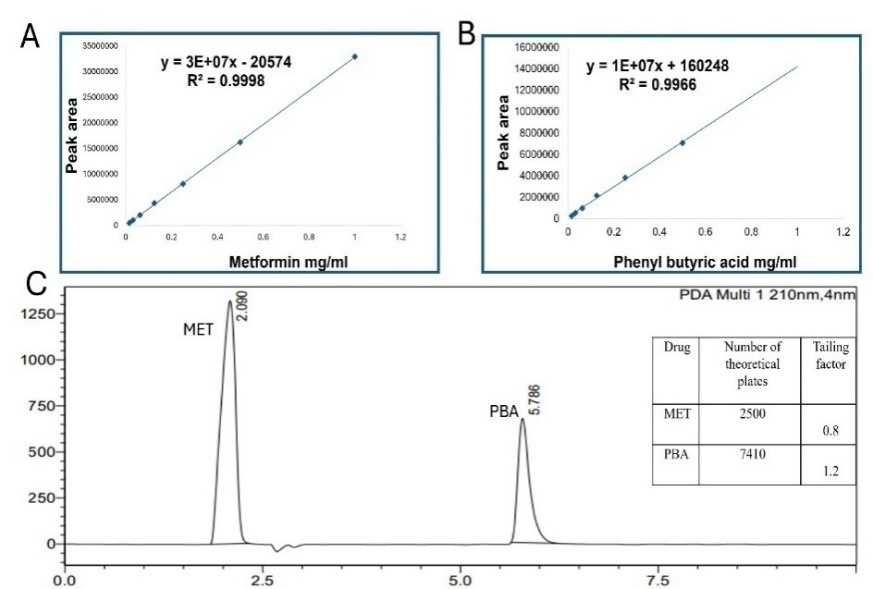
Fig. 5: HPLC Calibration of metformin (A) Phernyl butrric acid (B) HPLC chromtogram (C) (each experiment was done three times, mean±SD n=3)
Precision and repeatability
The inter-day was done by measuring each concentration 3 times on the same day, while the inter-day was done by measuring on 3 different days. It was found out the values of the RSD for MET were as follows 0.17 = 0.59%, 0.3 = 0.58% and 0.6 = 0.33%. While for the PBA it was as follows 0.17 = 0.83%, 0.3 = 0.58% and 0.6 = 0.86%.
Inter-day precision (repeatability) for MET was as follows 0.17 = 0.59%, 0.3 = 1.3% and 0.6 = 0.5% (table 1).
Table 1: Precision and repeatability
| Sample | Injected (mg/ml) | Intra-day measured (n=3, mean±SD mg/ml) | RSD% | Inter-day measured (n=3, mean±SD mg/ml) | RSD% |
| MET | 0.6 | 0.612±0.002 | 0.33% | 0.611±0.003 | 0.5% |
| 0.3 | 0.34±0.002 | 0.58% | 0.33±0.004 | 1.3% | |
| 0.17 | 0.171±0.001 | 0.59% | 0.170±0.001 | 0.59% | |
| PBA | 0.6 | 0.58±0.005 | 0.86% | 0.53±0.0041 | 0.77 |
| 0.3 | 0.34±0.002 | 0.58% | 0.33±0.0019 | 0.58% | |
| 0.17 | 0.193±0.0016 | 0.83% | 0.19±0.003 | 1.5% |
*(each experiment was done three times mean±SD)
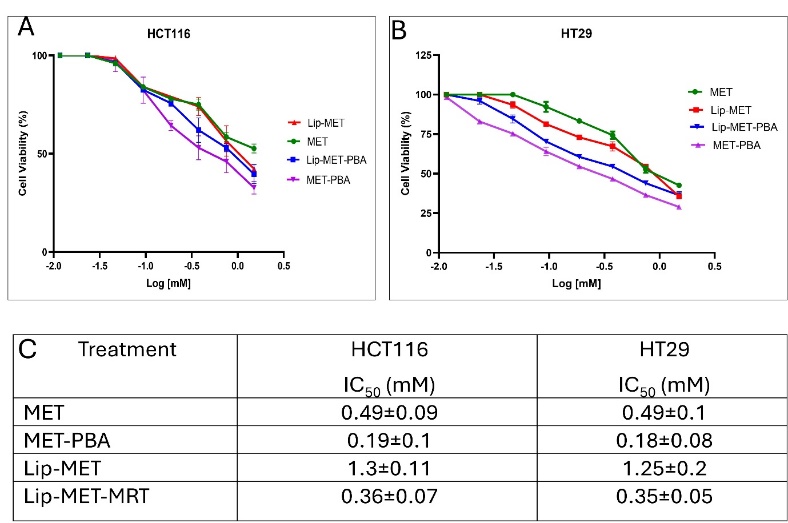
Fig. 6: The dose-response curve for HCT116 (A) HT29 (B) colorectal cancer cells treated with MET, MET-PBA, Lip-MET, and Lip-MET-PBA (0.4-1.5 mmol, n=3) (C) Summary table of IC50 for all formulations (each experiment was done three times, mean±SD, n=3)
Table 3: Robustness of developed method
Conditions (n=3) |
Injected (mg/ml) | Measured MET (mg/ml)* |
RSD% | Recovery % | Measured PBA (mg/ml)* |
Recovery % | RSD% |
| Oven temperature 35 °C | 0.6 | 0.62±0.003 | 0.5% | 103% | 0.60±0.004 | 100% | 0.66% |
| 0.3 | 0.34±0.004 | 1.1% | 113% | 0.34±0.001 | 113% | 0.29% | |
| 0.17 | 0.17±0.002 | 1.7% | 100% | 0.195±0.0003 | 115% | 0.15 | |
| Oven temperature 40 °C | 0.6 | 0.62±0.001 | 1.1% | 103% | 0.57±0.004 | 95% | 0.7 |
| 0.3 | 0.34±0.002 | 0.5% | 113% | 0.35±0.001 | 116% | 0.2% | |
| 0.17 | 0.17±0.0001 | 0.5% | 100% | 0.19±0.003 | 112% | 1.5% | |
| Oven temperature 45 °C | 0.6 | 0.61±0.002 | 0.3% | 102% | 0.57±0.002 | 113% | 0.4% |
| 0.3 | 0.34±0.003 | 0.9% | 113% | 0.34±0.001 | 113% | 0.3% | |
| 0.17 | 0.171±0.002 | 1.1% | 101% | 0.194±0.004 | 102% | 2% | |
| Flow rate 0.8 ml/min | 0.6 | 0.77±0.002 | 0.3% | 128% | 0.73±0.005 | 121% | 0.7% |
| 0.3 | 0.41±0.005 | 1.2% | 136% | 0.42±0.003 | 140% | 0.7% | |
| 0.17 | 0.21±0.004 | 1.9% | 124% | 0.24±0.004 | 141% | 1.6% | |
| Flow rate 1 ml/min | 0.6 | 0.62±0.006 | 0.9% | 103% | 0.57±0.005 | 95% | 0.9% |
| 0.3 | 0.34±0.002 | 0.5% | 113% | 0.35±0.003 | 116% | 0.8% | |
| 0.17 | 0.17±0.003 | 1.7% | 100% | 0.19±0.002 | 112% | 1% | |
| Flow rate 1.2 ml/min | 0.6 | 0.508±0.001 | 1.7% | 85% | 0.496±0.002 | 83% | 0.4% |
| 0.3 | 0.28±0.0006 | 0.2% | 93% | 0.285±0.003 | 95% | 1% | |
| 0.17 | 0.143±0.001 | 0.7% | 84% | 0.164±0.001 | 96% | 0.6% | |
| Wavelength 205 | 0.6 | 0.698±0.003 | 0.4% | 116% | 0.864±0.009 | 144% | 1% |
| 0.3 | 0.405±0.005 | 1.2% | 135% | 0.478±0.006 | 160% | 1.2% | |
| 0.17 | 0.202±0.0008 | 0.4% | 119% | 0.276±0.002 | 163% | 0.7% | |
| Wavelength 210 | 0.6 | 0.62±0.004 | 0.6% | 103% | 0.57±0.001 | 95% | 0.2% |
| 0.3 | 0.34±0.002 | 0.5% | 113% | 0.35±0.003 | 116% | 0.8% | |
| 0.17 | 0.17±0.003 | 1.7% | 100% | 0.19±0.001 | 112% | 0.53% | |
| Wavelength 215 | 0.6 | 0.662±0.001 | 0.2% | 110% | 0.495±0.002 | 83% | 0.4% |
| 0.3 | 0.364±0.005 | 1.3% | 121% | 0.289±0.001 | 97% | 0.35 | |
| 0.17 | 0.181±0.0009 | 0.5% | 107% | 0.158±0.0007 | 93% | 0.4% |
(*each experiment was done three times; mean±SD)
Accuracy and recovery
Since the value of the RSD is less than 2, this means the method was accurate. The recovery of 0.17, 0.3 and 0.6 MET was 100%, 110% and 102%, respectively. While for PBA it was 112%, 113% and 97%, respectively (table 2).
Robustness of the validated method
Robustness is used to see if this method can detect any small variations in different analytical conditions. In this method temperature was changed ±5 degrees Celsius, flow rate with 0.2 points and the wavelength with 5 points (table 3).
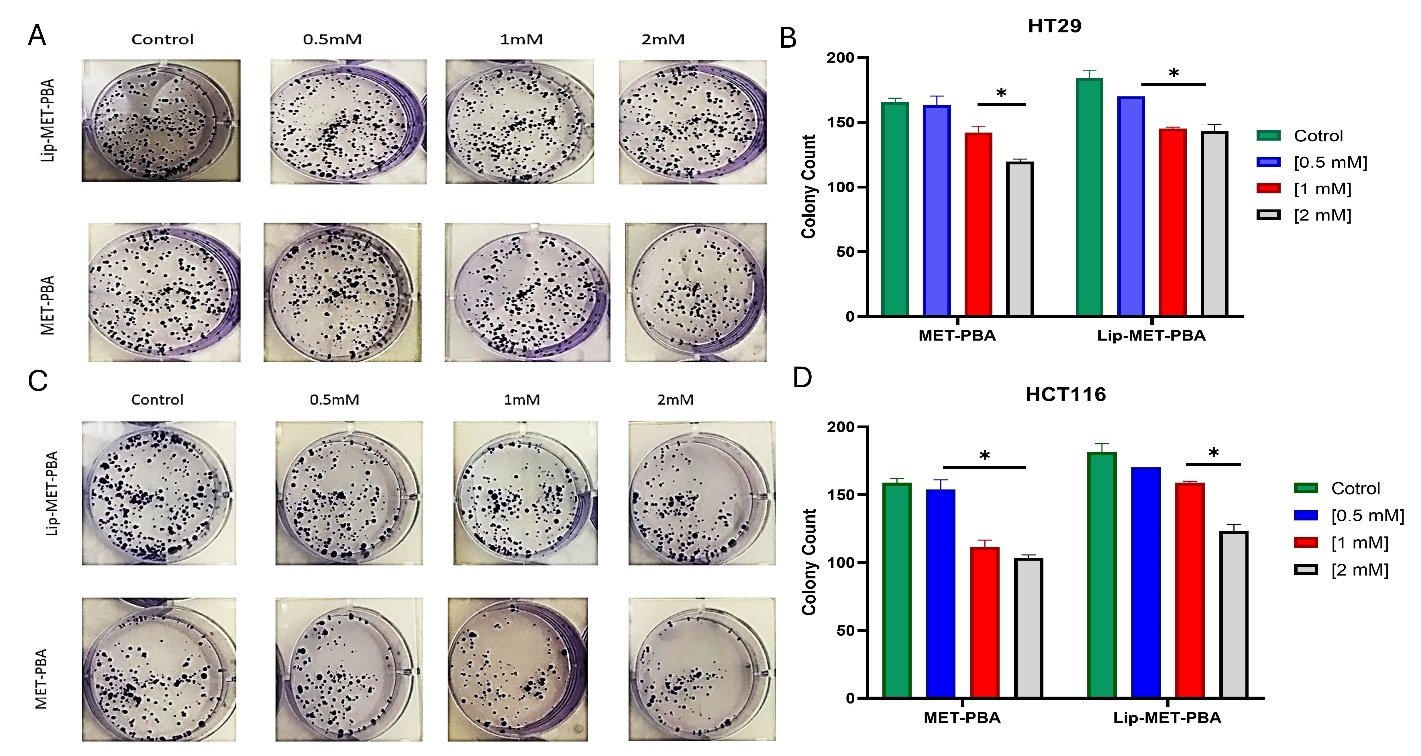
Fig. 7: Colony formation assay of MET-PBA combination and Lip-MET-PBA shows a concentration dependent decrease in the number of HT29 colonies (A) and (B) of HCT116 colonies (C) and (D). (*p-value<0.05) (Each experiment was done three times, mean±SD, n=3)
Table 2: Accuracy and recovery
| Injected mg/ml (n=3) | Measured 1 mg/ml | Measured 2 mg/ml | Measured 3 mg/ml | Mean±SD | Recovery | RSD% |
| MET | 0.6 | 0.610444 | 0.614884 | 0.610444 | 0.612±0.002 | 102% |
| 0.3 | 0.337378 | 0.336643 | 0.337378 | 0.33±0.004 | 110% | |
| 0.17 | 0.171116 | 0.170779 | 0.171116 | 0.17±0.001 | 100% | |
| PBA | 0.6 | 0.573314 | 0.588376 | 0.580494 | 0.58±0.005 | 97% |
| 0.3 | 0.345292 | 0.33735 | 0.338135 | 0.34±0.002 | 113% | |
| 0.17 | 0.192186 | 0.193117 | 0.194834 | 0.19±0.003 | 112% |
*each experiment was done three times
In vitro cell viability assay (MTT)
Cell viability assay (MTT) was done to measure the effect of the drugs and formulas on cancer cells. It is obvious how the MET-PBA had a greater effect on the cells compared to MET alone, this highly indicates a synergistic effect between these medications (fig. 6A, 6B, 6C). Interestingly the effect of the liposomal medications was lower than the free medications, yet still Lip-MET-PBA has a better effect than Lip-MET.
Colony formation assay
The colony assay is in line with the MTT assay as it shows free MET-PBA mixture has a better effect than Lip-MET-PBA. In both cell lines it is noticed that by increasing concentration, the inhibitory effect increases. In HCT116 the free double IC50 (2Mm) has lowered the colony count by nearly 40% (fig. 7C, 7D). In HT29 the MET-PBA double IC50 (2Mm) concentration has lowered the colony count by nearly 30% (fig. 7A, 7B).
DISCUSSION
The characterization of PEGylated liposomes using a zeta sizer provides essential information about the physicochemical properties of the liposomal formulations. The extrusion process was crucial in achieving the desired liposomal characteristics by effectively reducing size variation, as indicated by the PDI, while maintaining an optimal hydrodynamic diameter. This optimization is vital for cancer treatment as it ensures consistent and uniform distribution of liposomes, enhancing their ability to deliver therapeutic agents to tumor sites. Additionally, maintaining liposome size below 200 nm leverages their ability to penetrate tumors through the intercellular spaces, facilitating targeted drug delivery and improving the overall effectiveness of cancer therapy.
The choice of lipid composition greatly influences the properties and behavior of liposomes. In this study, incorporating anionic lipid (CHO) alongside PEG resulted in liposomes with a negative zeta potential ranging from-14 to-16 mV. In contrast, Shukla et al. (2019) used a cationic lipid, DOTAP, in their metformin liposomal formulation, leading to a positive zeta potential due to DOTAP's positively charged nature. This difference in zeta potential reflects the impact of lipid choice on the surface charge and stability of liposomes [27].
Encapsulation and loading efficiency were assessed using HPLC analysis, revealing EE% of 48.4% and LE% of 4.5% for metformin-loaded liposomes. In mixed-loaded liposomes, the encapsulation efficiency improved, reaching 56.8% for metformin and 83.9% for PBA. These results are comparable to those reported by Vozgirdaite et al. (2024), where metformin-loaded liposomes demonstrated a good entrapment efficiency (~65%). Additionally, the loading efficiency for PBA in the mixed-loaded liposomes was notably higher at 7.8%, compared to metformin’s 5.3%. These findings suggest that both drugs were efficiently incorporated into the liposomes, with PBA showing a higher loading efficiency, which may enhance its delivery to the target site [28].
Both formulations of liposomes demonstrated good storage stability, maintaining their integrity when stored at 4 °C for one month. Minimal changes were observed in their size. PDI and charge during this period, with no significant impact on their therapeutic properties. These findings indicate that the liposomal formulations can be reliably stored without compromising their efficacy, ensuring their suitability for long-term storage and potential clinical applications [27].
The data showed an initial rapid release within the first half hour. After 1 hour, the release levels from the mixed liposome Lip-MET-PBA reached approximately 25% for PBA and 55% for MET. The increased release of MET can be attributed to its hydrophilic nature and low molecular weight, which likely facilitate its easier release from the liposomal matrix compared to PBA. [23, 29]. Additionally, the lower glass transition temperature (Tm) of DPPC (~39–41 °C), which is close to the physiological temperature of 37 °C, may lead to liposomal disruption. This disruption can enhance drug release from the liposomes, as the temperature closely matches the body’s temperature, promoting increased permeability and release of the encapsulated drugs [30].
The release of PBA and metformin from the mixed liposome (Lip-MET-PBA) was slower compared to their release from the free MET-PBA mixture (fig. 14). This slower release is expected due to the encapsulation of the drugs within the liposomes, which acts as a barrier and limits the diffusion of the drug molecules into the surrounding medium. Additionally, interactions between the drugs and the liposomal components can affect release kinetics, with some drugs binding more strongly to the liposome and resulting in slower release rates. After 6 h, the Lip-MET-PBA formulation showed a release of 30% for PBA and 70% for MET [5, 31]. Encapsulation within liposomes can lead to a controlled and sustained release of the drugs, reducing the initial burst effect and potentially lowering the immediate cytotoxic impact. Additionally, the liposomal delivery system may alter the intracellular uptake and distribution of the drugs, affecting their cytotoxicity.
In line with our study, Divakar et al. formulated metformin liposomes and observed a similar release pattern in their in vitro drug release studies. They reported a rapid initial release within the first 0.5 h, followed by a slower and more sustained release over a 12-hour period. At 6 h, their study showed a release of 75.7% for the formulation. (DPPC: CHO, 8:2) [32].
The study conducted a cell viability assay (MTT) to evaluate the effects of various drug formulations on HT29 and HCT116 colorectal cancer cell lines. The cells were treated with different concentrations of MET, a combination of MET and PBA, and their corresponding liposomal formulations. Lip-MET-PBA showed more pronounced inhibition compared to Lip-MET in both cell lines, likely due to the synergistic effect of MET and PBA combined. This result aligns with the study's primary goal of assessing the impact of combining MET with PBA. Interestingly, the IC50 values for each liposome were higher than those for their free drug counterparts, indicating that encapsulating the drugs within liposomes reduced their cytotoxic effects. This finding contrasts with Shukla et al., who reported approximately a two-fold reduction in IC50 values with Lip-MET treatment, showing IC50 values of 2.5±1.0 mmol (p<0.05) compared to 5.1±0.5 mmol for free METThe decrease in IC50 values for Lip-MET in their study may be attributed to the hypothesis that enhanced intracellular localization in cells leads to increased cytotoxic potential. The study found that liposomal encapsulation of MET led to enhanced inhibition of cancer cell migration compared to free MET, which could help in preventing tumor metastasis. Specifically, migration was significantly inhibited in the treatment groups, with free MET showing 63.1±3.0% wound closure and Lip-MET demonstrating a further reduced wound closure of 41.7±4.9% [27]. The observed enhanced effects of MET and PBA combination can be explained by their complementary mechanisms of action. Metformin activates the AMP-Activated Protein Kinase (AMPK) pathway, which inhibits tumor growth and induces apoptosis [12, 33]. On the other hand, PBA acts as a Histone Deacetylase (HDAC) inhibitor, promoting chemosensitivity and inducing cellular differentiation in cancer cells. The combination of these two agents in a PEGylated liposomal formulation enhances their individual effects, leading to improved cytotoxicity and reduced colony formation in colorectal cancer cells [34].
The clonogenic assay is an in vitro technique used to evaluate a single cell's ability to proliferate indefinitely and form colonies of at least 50 cells, known as clonal expansion. This assay is valuable for assessing the impact of different chemotherapeutic agents on cell survival and proliferation. It determines the fraction of cells that maintain reproductive integrity after treatment, which could potentially evolve into tumors [35]. In both cell lines, the colony count was higher in the Lip-MET-PBA group compared to the MET-PBA group across various concentrations. This observation aligns with the MTT results, which suggested that the liposomal delivery system might reduce the toxicity or efficacy of the free drugs, thereby increasing the cancer cells' ability to form colonies. This finding contrasts with the results reported by Shukla et al. (2019), who found that encapsulating metformin in liposomes led to a significant reduction in colony numbers. This reduction may inhibit the stemness of cancer cells and potentially impede metastasis [27, 36]. Several considerations should be addressed in future work. Firstly, the absence of in vivo validation means that the therapeutic efficacy and safety of the PEGylated liposomal formulation need to be confirmed in animal models. Secondly, there may be variability in drug encapsulation efficiency, which could affect the reproducibility and consistency of the formulation. Future studies should address these limitations by conducting in vivo experiments and optimizing the encapsulation process to minimize variability.
CONCLUSION
To further validate the therapeutic potential of the PEGylated liposomal formulation, we suggest conducting in vivo studies to assess its efficacy and safety in animal models. Additionally, exploring the combination of MET and PBA with other anticancer agents could provide insights into potential synergistic effects and broaden the scope of this formulation in cancer therapy. While the primary focus of this study is on colorectal cancer therapy, the combination of MET and PBA in a PEGylated liposomal formulation holds promise for other applications. MET improves metabolic function and reduces inflammation through AMPK activation, while PBA alleviates endoplasmic reticulum stress and inflammation. Together, they could be effective in treating conditions such as metabolic disorders, neurodegenerative diseases, fibrotic diseases, cardiovascular conditions, and chronic inflammatory or autoimmune disorders. Future work should explore these potential non-cancer applications in dedicated studies.
FUNDING
Nil
AUTHORS CONTRIBUTIONS
Hussein S. Janabi: Synthesizing and characterizing of the formulations (e.g., Lip), Performing preliminary optimization of the synthesis process, contributing to data collection and analysis and writing draft, Zainab Lafi (Corresponding Author): Conceptualizing and designing the experiment. Supervising the overall progress of the project and coordinating among team members and revising the manuscript for publication, Sina Matalqah: Supervising the overall progress of the project and coordinating among team members and revising the manuscript for publication.
CONFLICT OF INTERESTS
Declared none
REFERENCES
El Zarif T, Yibirin M, DE Oliveira Gomes D, Machaalani M, Nawfal R, Bittar G. Overcoming therapy resistance in colon cancer by drug repurposing. Cancers (Basel). 2022;14(9):2105. doi: 10.3390/cancers14092105, PMID 35565237.
Cappell MS. Pathophysiology clinical presentation and management of colon cancer. Gastroenterol Clin North Am. 2008;37(1):1-24. doi: 10.1016/j.gtc.2007.12.002, PMID 18313537.
Kraft JC, Freeling JP, Wang Z, HO RJ. Emerging research and clinical development trends of liposome and lipid nanoparticle drug delivery systems. J Pharm Sci. 2014;103(1):29-52. doi: 10.1002/jps.23773, PMID 24338748.
Lafi Z, Bustanji Y. Formulation and functionalization of aptamer guided pH-sensitive liposomes for targeted drug delivery of echinomycin cyclodextrin complex into cancer cells: [dissertion] faculty of pharmacy. University of Jordan; 2020.
Munef A, Lafi Z, Shalan N. Investigating anti-cancer activity of dual loaded liposomes with thymoquinone and vitamin C. Ther Deliv. 2024;15(4):267-78. doi: 10.4155/tde-2023-0140, PMID 38449422.
Matalqah S, Lafi Z, Asha SY. Hyaluronic acid in nanopharmaceuticals: an overview. Curr Issues Mol Biol. 2024;46(9):10444-61. doi: 10.3390/cimb46090621, PMID 39329973.
Niu G, Cogburn B, Hughes J. Preparation and characterization of doxorubicin liposomes. Methods Mol Biol. 2010;624:211-9. doi: 10.1007/978-1-60761-609-2_14, PMID 20217598.
Makwana V, Karanjia J, Haselhorst T, Anoopkumar Dukie S, Rudrawar S. Liposomal doxorubicin as targeted delivery platform: current trends in surface functionalization. Int J Pharm. 2021;593:120117. doi: 10.1016/j.ijpharm.2020.120117, PMID 33259901.
Lafi Z, Alshaer W, Gharaibeh L, Alqudah DA, AlQuaissi B, Bashaireh B. Synergistic combination of doxorubicin with hydralazine and disulfiram against MCF-7 breast cancer cell line. Plos One. 2023;18(9):e0291981. doi: 10.1371/journal.pone.0291981, PMID 37768997.
Shade CW. Liposomes as advanced delivery systems for nutraceuticals. Integr Med (Encinitas). 2016;15(1):33-6. PMID 27053934.
Morales DR, Morris AD. Metformin in cancer treatment and prevention. Annu Rev Med. 2015;66:17-29. doi: 10.1146/annurev-med-062613-093128, PMID 25386929.
Saraei P, Asadi I, Kakar MA, Moradi Kor N. The beneficial effects of metformin on cancer prevention and therapy: a comprehensive review of recent advances. Cancer Manag Res. 2019;11:3295-313. doi: 10.2147/CMAR.S200059, PMID 31114366, PMCID PMC6497052.
Marmol JM, Carlsson M, Raun SH, Grand MK, Sorensen J, Lang Lehrskov L. Insulin resistance in patients with cancer: a systematic review and meta-analysis. Acta Oncol. 2023 Apr;62(4):364-71. doi: 10.1080/0284186X.2023.2197124, PMID 37042166.
Mohamed Tawfik S. Repurposing metformin and antifolates for the treatment of hepatocellular carcinoma. [Dessertion] American University in Cairo; 2022.
Jang SK, Hong SE, Lee DH, Kim JY, Kim JY, YE SK. Correction to: inhibition of mTORC1 through ATF4-induced REDD1 and sestrin2 expression by metformin. BMC Cancer. 2021;21(1):881. doi: 10.1186/s12885-021-08584-z, PMID 34340683.
ZI F, ZI H, LI Y, HE J, Shi Q, Cai Z. Metformin and cancer: an existing drug for cancer prevention and therapy. Oncol Lett. 2018 Jan;15(1):683-90. doi: 10.3892/ol.2017.7412, PMID 29422962, PMCID PMC5772929.
Morale MG, Tamura RE, Rubio IG. Metformin and cancer hallmarks: molecular mechanisms in thyroid prostate and head and neck cancer models. Biomolecules. 2022;12(3):357. doi: 10.3390/biom12030357, PMID 35327549.
Zhang W, Zhang SL, HU X, Tam KY. Phenylbutyrate inhibits pyruvate dehydrogenase kinase 1 and contributes to its anti-cancer effect. Eur J Pharm Sci. 2017 Dec 15;110:93-100. doi: 10.1016/j.ejps.2017.04.018, PMID 28450154.
Rivera CN, Smith CE, Draper LV, Watne RM, Wommack AJ, Vaughan RA. Physiological 4-phenylbutyrate promotes mitochondrial biogenesis and metabolism in C2C12 myotubes. Biochimie. 2024 Apr;219:155-64. doi: 10.1016/j.biochi.2023.11.009, PMID 38008282.
DE Pablo S, Rodriguez Comas J, Diaz Catalan D, Alcarraz Vizan G, Castano C, Moreno Vedia J. 4-phenylbutyrate (PBA) treatment reduces hyperglycemia and islet amyloid in a mouse model of type 2 diabetes and obesity. Sci Rep. 2021;11(1):11878. doi: 10.1038/s41598-021-91311-2, PMID 34088954.
Allateef A, Shalan N, Lafi Z. Anticancer activity of liposomal formulation co-encapsulated with coumarin and phenyl butyric acid. J Appl Pharm Sci. 2024;14(11):208-15. doi: 10.7324/JAPS.2024.181335.
Fahdawi A, Shalan N, Lafi Z, Markab O. Analytical approaches for assessing curcumin and nicotinamide Co-encapsulated in liposomal formulation: UV spectrophotometry and HPLC validation. Jordan J Pharm Sci. 2024;17(3):468-80. doi: 10.35516/jjps.v17i3.2359.
Alshaer W, Zraikat M, Amer A, Nsairat H, Lafi Z, Alqudah DA. Encapsulation of echinomycin in cyclodextrin inclusion complexes into liposomes: in vitro anti-proliferative and anti-invasive activity in glioblastoma. RSC Adv. 2019;9(53):30976-88. doi: 10.1039/C9RA05636J, PMID 35529392.
Alrubaye MA, Lafi Z, Abu Hajleh MN, Abuamara TM, Mehdawi A. Co-encapsulation of coumarin and Q10 into solid lipid nanoparticles for wound healing. J Drug Deliv Sci Technol. 2025 Mar;105:106645. doi: 10.1016/j.jddst.2025.106645.
Abu Saleem E, Lafi Z, Shalan N, Alshaer W, Hamadneh I. Formation and evaluation of doxorubicin and cromoglycate metal-organic framework for anti-cancer activity. Nanomedicine (Lond). 2025 Mar;20(5):467-79. doi: 10.1080/17435889.2025.2459059, PMID 39888613, PMCID PMC11875491.
Nsairat H, Alshaer W, Lafi Z, Ahmad S, Al Sanabrah A, El Tanani M. Development and validation of reversed-phase HPLC method for simultaneous quantification of fulvestrant and disulfiram in liposomes. Bioanalysis. 2023 Dec;15(23):1393-405. doi: 10.4155/bio-2023-0137, PMID 37847056.
Shukla SK, Kulkarni NS, Chan A, Parvathaneni V, Farrales P, Muth A. Metformin encapsulated liposome delivery system: an effective treatment approach against breast cancer. Pharmaceutics. 2019 Oct 28;11(11):559. doi: 10.3390/pharmaceutics11110559, PMID 31661947, PMCID PMC6920889.
Vozgirdaite D, Herve Aubert K, Uzbekov R, Chourpa I, Allard Vannier E. Design optimization characterization and in vitro evaluation of metformin loaded liposomes for triple-negative breast cancer treatment. J Liposome Res. 2024 Dec;34(4):547-61. doi: 10.1080/08982104.2024.2321528, PMID 38459750.
Nounou MM, El Khordagui LK, Khalafallah NA, Khalil SA. In vitro release of hydrophilic and hydrophobic drugs from liposomal dispersions and gels. Acta Pharm. 2006 Sep;56(3):311-24. PMID 19831280.
Biltonen RL, Lichtenberg D. The use of differential scanning calorimetry as a tool to characterize liposome preparations. Chem Phys Lipids. 1993;64(1-3):129-42. doi: 10.1016/0009-3084(93)90062-8.
Divakar P, Kumar D, Praveen C, Sowmya C, Reddy CS. Formulation and in vitro evaluation of liposomes containing metformin hydrochloride. Int J Res Pharm Biomed Sci. 2013;4(2):479-85.
Chen YH, Yang SF, Yang CK, Tsai HD, Chen TH, Chou MC. Metformin induces apoptosis and inhibits migration by activating the AMPK/p53 axis and suppressing PI3K/AKT signaling in human cervical cancer cells. Mol Med Rep. 2021 Jan;23(1):88. doi: 10.3892/mmr.2020.11725, PMID 33236135, PMCID PMC7716426.
Chen D, Liu X, LU X, Tian J. Nanoparticle drug delivery systems for synergistic delivery of tumor therapy. Front Pharmacol. 2023 Feb 16;14:1111991. doi: 10.3389/fphar.2023.1111991, PMID 36874010, PMCID PMC9978018.
Rajendran V, Jain MV. In vitro tumorigenic assay: colony-forming assay for cancer stem cells. Methods Mol Biol. 2018;1692:89-95. doi: 10.1007/978-1-4939-7401-6_8, PMID 28986889.
Al Kabariti AY, Arafat BT, Oriquat GA, Mozna P, Jaidy H, Rehmani A. In vitro and in vivo evaluation of dark chocolate as an age-appropriate oral matrix. Eur J Pharm Sci. 2024 Jan 1;192:106646. doi: 10.1016/j.ejps.2023.106646, PMID 37989467.
Al Daghistani HI, Zein S, Abbas MA. Microbial communities in the dead sea and their potential biotechnological applications. Commun Integr Biol. 2024 Jun 23;17(1):2369782. doi: 10.1080/19420889.2024.2369782, PMID 38919836, PMCID PMC11197920.