
Int J App Pharm, Vol 17, Issue 2, 2025, 281-292Original Article
DEVELOPMENT AND VALIDATION OF DEFERASIROX-RELATED SUBSTANCE METHOD IN SOLID DOSAGE FORMS USING HPLC
RUJUTA TRIVEDI1*, BHANUBHAI SUHAGIA2
1Department of Pharmacy, Dharmsinh Desai University, Nadiad-387001, Gujarat, India. 2Faculty of Pharmacy, Dharmsinh Desai University, Nadiad-387001, Gujarat, India
*Corresponding author: Rujuta Trivedi; *Email: rujuta.trivedi@yahoo.co.in
Received: 19 Dec 2024, Revised and Accepted: 07 Feb 2025
ABSTRACT
Objective: A simple, sensitive, and reproducible Reverse-Phase High-Performance Liquid Chromatography (RP-HPLC) method was developed to quantitatively determine related substances in bulk and pharmaceutical dosage forms of Deferasirox (DFS). The method's performance was validated according to the present International Council on Harmonisation of Technical Requirements for Registration of Pharmaceuticals for Human Use (ICH) guidelines for specificity, limit of detection (LOD), limit of quantification (LOQ), linearity, accuracy, precision, and Robustness. The developed method can be used for routine analysis of the determination of DFS in the presence of degradation products and impurities.
Methods: Chromatographic separation was achieved on Shimadzu shim pack GIS (150*4.6) mm5µm using isocratic elution mode, which included 0.1 % Formic acid in Water: Acetonitrile in gradient mode as mobile phase at a flow rate of 1.0 ml/min. And column temperature of 40 °C. Detection was performed at a wavelength of 254 nm coupled with an Ultra Violet (UV) detector. The Injection volume was 10 µl. The drug was exposed to various stress conditions in degradation studies, such as acidic, basic, oxidative, hydrolytic, photolytic, and thermal degradation.
Results: The retention time of DFS was 8.1 min. The resolution of DFS and four impurities was greater than 2.0 for all pairs of components. The high correlation coefficient (r2>0.9990) values indicated clear correlations between the investigated compound concentrations and their peak areas within the test ranges. The Repeatability and intermediate precision expressed by the Relative Standard Deviation (RSD) were less than 10%. The accuracy evaluated by performing recovery studies via a spike method was 50-150%. Stress Degradation studies were carried out; however, no significant degradation was observed in any of the stress degradation conditions, implying a chemically stable drug formulation and the method used to measure stability is robust to minor variations; hence, the product is likely to maintain its quality and efficacy throughout its shelf life.
Conclusion: Hence, a suitable, reliable, accurate, precise, and economical HPLC method was developed, which is ideal for analyzing DFS in both bulk and commercial formulations.
Keywords: Deferasirox, Related substances, Impurity, Validation, Forced degradation, High-performance liquid chromatography
© 2025 The Authors. Published by Innovare Academic Sciences Pvt Ltd. This is an open access article under the CC BY license (https://creativecommons.org/licenses/by/4.0/)
DOI: https://dx.doi.org/10.22159/ijap.2025v17i2.53465 Journal homepage: https://innovareacademics.in/journals/index.php/ijap
INTRODUCTION
Iron is essential in all living organisms and involves many physiological processes, such as oxygen transport and energy transduction. It is estimated that more than a quarter of the human population is affected at some stage of their life by abnormalities of iron metabolism, particularly iron deficiency anemia. Similarly, millions of people suffer from iron overload, including hereditary hemochromatosis and Thalassemia Intermedia (TI), which are caused by increased iron absorption. Excess iron is toxic in these and other iron-loading conditions, causing increased morbidity and mortality due to tissue damage. DFS is an oral iron chelator. Its primary use is to reduce chronic iron overload in patients receiving long-term blood transfusions for conditions such as beta-thalassemia and other chronic anemia [1-6].
Iron chelators, such as deferoxamine or deferasirox, are commonly used to treat iron overload disorders. If the iron chelator or its impurities degrade, the degradation products may become toxic or cause harmful side effects. For example, impurities might lead to adverse patient reactions, such as liver damage, kidney issues, gastrointestinal discomfort, and increased toxicological burden due to unintended or harmful by-products from degradation or contamination. A reliable method can be developed and validated to identify and quantify these impurities; manufacturers can ensure that their product is safe for patient use.
Regulatory agencies such as the FDA, EMA, and ICH have stringent guidelines for the development, validation, and testing of drugs, particularly in the case of impurities. The ICH Q3A and Q3B guidelines (on impurities in new drug substances and products) provide detailed standards for identifying, quantifying, and controlling impurities. Proper method development and validation of the analytical technique (such as HPLC, GC, or UV spectrophotometry) help ensure compliance with regulatory standards. This is essential for obtaining approval for the drug and maintaining it in the market [9]. By creating specific impurities, researchers can validate analytical methods for their ability to detect, quantify, and separate these impurities from the API. This ensures that the method is robust and reliable. For regulatory approval, methods must be validated to demonstrate their accuracy, precision, specificity, sensitivity, and Robustness [10]. Various factors such as experimental design and analysis conditions such as matrix type, column type, mobile phase, elution modes, detection wavelengths, and therapeutic category influence the separation and identification of the impurities and degradation products [11]. Hence, an attempt was made to develop an RP-HPLC method that is simple, rapid, accurate, precise, specific, economical, sensitive, and stable, indicating the estimation of DFS and related substances in bulk and pharmaceutical tablet formulation.
Deferasirox is a white to slightly yellow powder. It is the first oral medication approved in the USA for this purpose. It was approved by the United States Food and Drug Administration (FDA) in November 2005 [7]. It is approved in the European Union by the European Medicines Agency (EMA) for children 6 years and older for chronic iron overload from repeated blood transfusions. Its low molecular weight and high lipophilicity allow the drug to be taken orally, unlike deferoxamine, which must be administered by intravenous infusion. Along with deferiprone, DFS seems capable of removing iron from cells (cardiac myocytes and hepatocytes) and iron from the blood. Chemically it is 4-[3,5-bis(2-hydroxyphenyl),4-[3,5-bis(2-hydroxyphenyl)-1,2,4-triazol-1-yl] benzoic acid 4-[3,5-bis(2-hydroxyphenyl)-1,2,4-triazol-1-yl] benzoic acid [8]. The structure of DFS is shown in fig. 1.

Fig. 1: Structure of deferasirox
MATERIALS AND METHODS
Instruments
HPLC, LC2050C, Shimadzu, Japan, was used in the study. Optimization was performed using Shimadzu shim pack GIS (150*4.6) mm5µm column and diode array detector SPD-M 20 A, Shimadzu, Japan. Development and validation of the RP-HPLC method was accomplished using LC solution software version 1.25. The calculations were done using Microsoft Excel 2010 software (Microsoft Corporation, USA).
Hardware and software calibration and specific checks for the column and detector were carried out to ensure that the HPLC system functions optimally and produces accurate and reproducible results. System Suitability Test (SST) was performed using the standard test mixture for plate count, resolution, tailing factor, and Retention time. The values were well within limits. SPD-M 20A DAD was calibrated for wavelength accuracy using toluene as standard. All the solvents are degassed and filtered before use.
Maintenance of the Shimadzu LC-2050C System for reproducibility is carried out routinely. The pump seals, check valves, and tubing connections were intact, and no signs of wear or leaks were observed. The system provided a stable flow rate. The flow cell was cleaned periodically. All the solvents used in the mobile phase are filtered through a 0.45 µm filter.
Appropriate data collection rates were set, and optimization of integration parameters for peak detection and quantification was ensured during software calibration.
Chemicals
The reference standard of DFS was obtained as a gift sample. DFS is available as a solid oral dosage form (tablet) under the trade name Desirox-500 (Cipla) with a label claim of 500 mg procured from a local pharmacy. Formic acid 98 (HPLC Grade), Water HPLC Grade, Acetonitrile (HPLC Gradient Grade), and methanol (HPLC Gradient Grade) were procured from Merck Chemicals Limited.
Preparation of standard stock solution
An accurately weighed quantity of DFS (10 mg) was dissolved in 10 ml methanol to get 1000 (µg/ml). For further dilution, 1 ml of this solution was diluted up to 10 ml with methanol to prepare 100µg/ml solution.
Preparation of sample stock solution
Twenty tablets were weighed, and the average weight of the tablet. The Tablets were finely powdered, and tablet powder equivalent to 100 mg DFS was weighed accurately and transferred to a 100 ml volumetric flask. About 10 ml diluent was added, sonicated, degassed, and made up to the mark with diluent, filtered through a 0.45 µm Millipore membrane filter. Sample stock solution was prepared by diluting a suitable sample volume to 10 ml using diluent to prepare 100 µg/ml.
Preparation of standard and sample working solution
About 10 µg/ml of standard and sample working solutions were prepared from stock solution using diluent and were injected into the chromatographic system, and chromatograms were recorded.
Stress degradation studies
Selection of appropriate stress conditions is essential to simulate real-world stress scenarios and understand how deferasirox might break down under extreme environmental factors. Based on the chemical structure of deferasirox, it was likely to undergo oxidation, hydrolysis, and thermal degradation. These reactions may have altered the chelating ability of deferasirox or led to the formation of toxic degradation products. Deferasirox is usually formulated in tablet form, and the pH of the environment can influence its solubility and stability. Also, specifications for forced degradation studies and identification of degradation products are specified in ICH Q1A(R2) for stability testing and ICH Q3B for impurities [13, 14]. The initial degradation conditions were as per ICH guidelines. The drug was further exposed to harsher conditions to ensure the range of possible degradation products that may form during such conditions.
The stress studies were carried out by preparing a DFS solution of 2 mg/ml in respective stressors and was used for stress studies under optimized conditions. A minimum of four samples were generated for every stressed condition, viz., the Initial (zero time) sample containing the drug with the stressor and the drug solution subjected to stress treatment, the blank solutions stored under normal conditions, and the blanks subjected to identical conditions. The stress degradation conditions are shown in table 1.
Table 1: Stress degradation conditions
| Stress degradation conditions | Stressors |
| Acid Hydrolysis | 0.1 N, 1 N HCl, and 5 N HCl reflux at 100 °C for 24 h |
| Alkaline Hydrolysis | 0.1 N, 1 N NaOH, and 5 NaOH reflux at 100 °C for 24 h |
| Neutral Hydrolysis | Water, reflux at 100 °C for 24 h |
| Oxidative Degradation | 3%, 6% and 30% H2O2 reflux at 60 °C for 24 h |
| Thermal Degradation | Drug powder kept in hot air oven at 120 °C for 48 h |
| Photolytic Degradation | Aqueous solutions were exposed to direct sunlight for 8 h in two days. |
| Drug powder was exposed to direct sunlight for 8 h in a total of two days. |
Chromatographic conditions
The separation was achieved on Shimadzu shim pack GIS (150*4.6) mm5µm using gradient mode, which included 0.1 % Formic acid in Water: Acetonitrile in gradient mode as mobile phase at a flow rate of 1.0 ml/min., detection wavelength of 254 nm, and column temperature of 40 °C. The injection volume was 10 µl. Acetonitrile was used as a diluent.
Potential related substance
Based on the chemical structures and literature reviewed [11], it was concluded that the presence of related substances shown in fig. 2 could be present in the final drug and formulation based on the route of synthesis, process, and use of an alcoholic solvent.
Synthesis of deferasirox methyl ester
In the round-bottom flask, 100 mg of DFS was accurately weighed and dissolved in 100 ml of methanol. Three drops of concentrated sulphuric acid were added to this solution. The solution was refluxed for 1 h and monitored by Thin-Layer Chromatography. Once the ester was formed, the reaction mixture was distilled. Water was added to the concentrated reaction mixture and extracted with ethyl acetate. Ethyl acetate was distilled to get the amorphous solid, characterized by mass analysis and 1H NMR analysis. Deferasirox methyl ester was analysed using an Ailment MASS spectrometer, using ESI as an ionization technique, and 0.001% formic acid in Water: CAN (50:50). The molecular weight of the impurity was detected at 388 as an M+1 peak in the positive mode spectrum and at 386 as an M-1 peak in the negative mode spectrum, as shown in fig. 3 and 4.
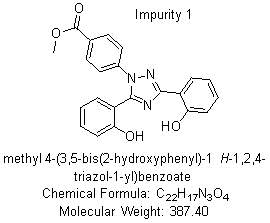
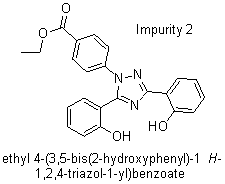
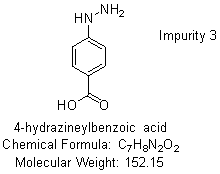

Fig. 2: Structures of related substances of deferasirox

Fig. 3: Mass spectra for deferasirox methyl ester
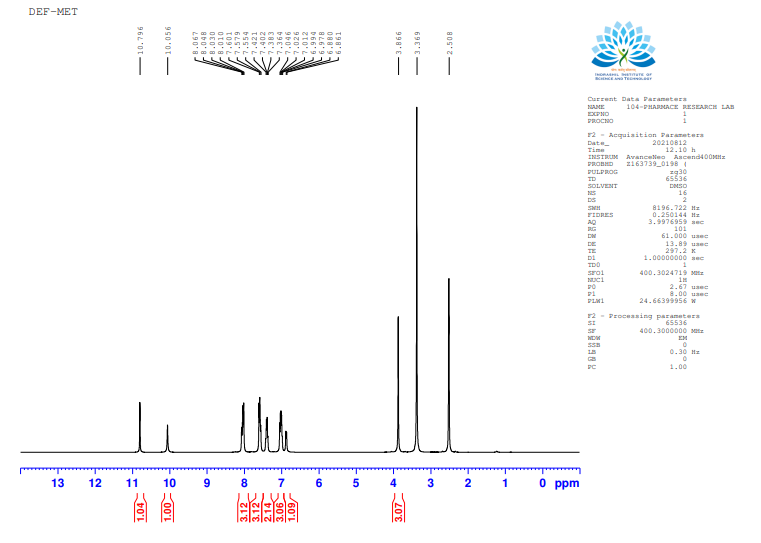
Fig. 4: NMR spectra for deferasirox methyl ester
Synthesis of deferasirox ethyl ester
In the round-bottom flask accurately weighed, 100 mg of DFS was dissolved in 100 ml of Ethanol. Three drops of concentrated sulphuric acid were added to this solution. The solution was refluxed for 1 h and monitored by Thin-Layer Chromatography. Once the ester was formed, the reaction mixture was distilled. Water was added to the concentrated reaction mixture and extracted with ethyl acetate. Ethyl acetate was distilled to get the amorphous solid, characterized by mass analysis and 1H NMR analysis.
Analysis was performed using the same method as the methyl ester. The molecular weight of the impurity was detected at 402 as the M+1 peak as the positive mode spectrum and at 400, the M-1 peak as the negative mode spectrum, as shown in fig. 5.

Fig. 5: Mass spectra for deferasirox ethyl ester
The other two process-related impurities were procured.
Method validation
The developed method was validated by ICH guidelines (ICH Q2R1) for accuracy, precision, specificity, linearity, limit of detection (LOD), limit of quantification (LOQ), and Robustness [13-15].
Accuracy
The accuracy of the developed method was established by the standard addition method. The results were expressed in terms of percentage recovery. They were computed at three different levels: 50%, 100%, and 150% of the target sample concentration. The standard solution was spiked with a predetermined sample concentration to prepare three concentration levels. Three injections of each level were injected, and individual percentage recovery and mean percentage recovery values were calculated.
Precision
The precision of the developed method was established by performing intraday and interday precision.
Intra-day precision or Repeatability was demonstrated by injecting 20μg/ml concentration of sample solution at six different times on the same day.
Inter-day precision was demonstrated by injecting 20μg/ml concentration of sample solution on six different days. The results of precision were expressed in terms of Percentage Relative Standard Deviation (%RSD).
Linearity
The developed method's linearity was entrenched at a concentration range of 10-50μg/ml. A series of solutions with concentrations ranging from 10 to 50μg/ml were prepared from the standard stock solution. Three injections of each level were injected into the chromatographic system using a 10μl fixed loop system, and chromatograms were recorded. The peak area versus concentration calibration curve was plotted, and the correlation coefficient was calculated.
Specificity
The specificity of the developed method was established by comparing the blank, standard, and sample chromatograms.
Limit of detection (LOD) and limit of quantification (LOQ)
LOD was calculated using the following formulae based on the response's standard deviation and the slope of the calibration curve.
LOD = 
LOQ was calculated using the following formulae based on the response's standard deviation and the slope of the calibration curve.
LOQ =
Where σ is the standard deviation of the Y-intercept of regression lines, and S is the slope of the calibration curve.
Robustness
Robustness was demonstrated by making small intended changes in the optimized chromatographic conditions. Flow rate (±0.1 ml/min) and temperature (±2 °C) were changed. Six replicate injections of each condition were injected, and a shift in Retention time and peak area was calculated.
Stability of the solution
The stability of both the standard and sample solutions was checked up to 48 h at room temperature.
Assay
Twenty tablets of Desirox-500 were crushed into a fine powder. The average weight of tablets was measured and transferred to a 100 ml volumetric flask with the addition of about 80 ml of methanol. The mixture was sonicated for 20 min with shaking, and volume was made up to the mark with methanol. The above solutions were centrifuged in centrifuge tubes at 2500 RPM in the research centrifuge for 15 min and were filtered through a 0.45 µm syringe filter. The first 10 ml of the filtrate was rejected, and the subsequent filtrate was diluted with diluent to obtain the 10 µg/ml solution used for Assay.
System suitability
The system suitability properties were examined to validate the approach, column performance, and system. The system was injected with a standard solution of DFS six times, and system suitability traits were evaluated.
RESULTS AND DISCUSSION
Forced degradation studies
Conducting forced degradation studies before full method development is generally advisable in the context of method development for pharmaceutical drugs. Forced degradation studies help identify how the drug substance behaves under stress conditions (e. g., heat, light, humidity, oxidation). These studies are crucial for understanding potential degradation products and possible degradation pathways that lead to identifying impurities, which need to be characterized and quantified using the analytical method. The insights gained from forced degradation studies inform the development of the analytical process. Knowing what impurities to expect helps tailor the technique to separate and identify these substances adequately.
The drug was exposed to various stress conditions in degradation studies, such as acidic, basic, oxidative, hydrolytic, photolytic, and thermal degradation. But no significant degradation was observed in any of the conditions. This could be due to its chemical stability, structural Robustness, and resistance to common degradation mechanisms. Deferasirox has a rigid and stable molecular structure with a central iron-binding core that may resist forced degradation conditions. The structure of DFS involves the coordination of iron, and this chelation may reduce its exposure to reactive oxygen species, limiting the likelihood of oxidative degradation. The iron in deferasirox could act as a stabilizing centre that prevents oxidation of the drug molecule itself. DFS does not contain functional groups that are easily oxidized, such as catechols or hydrazines, which are common targets for oxidation. Also, the compound may react poorly with environmental factors (e. g., oxygen, light, moisture), reducing the likelihood of undergoing common degradation pathways like oxidation, hydrolysis, or photodegradation. The core structure of deferasirox does not contain readily hydrolyzable ester or amide bonds and has limited solubility in water, which may make it less susceptible to hydrolytic degradation in aqueous conditions.
The degradation product could not be identified as no significant degradation could be observed during stress studies.
Method development
Optimization of the RP-HPLC method
The RP-HPLC method was developed to estimate DFS in bulk and tablet formulations. To obtain a simple and efficacious method, the method was modified by varying columns, mobile phase, and flow rate and using columns of various lengths. For stationary phase optimization, many types of columns were thoroughly examined, including Inertsil ODS 3V (150 x 4.5) mm with 5 µm particles, Hypersil-BDS 3V (150 x 4.5) C-18, 4.6-mm, and Shimadzu shim pack GIS (150 x 4.5) mm with 5 µm particles. The detection wavelength was selected by scanning the standard concentration in the wavelength range of 200–400 nm, and λmax was found to be 254 nm.
Different individuals and combinations of solvents, such as water, acetonitrile, methanol, and buffer solutions, were investigated for analyte separation. To determine the compound's peak shape and symmetry, a series of method development tests were carried out by changing chromatography conditions, including method flow rate (1.0-2.0 ml min-1) and the column's temperature. As a result, the Shimadzu shim pack GIS (150 x 4.5) mm with 5 µm particles column became the column of choice for this mixture since it gave the most optimal unambiguous separation of DFS in a relatively short run time. The target compound's peak shape was poor in other columns. The Optimized conditions are shown in table 2.
Table 2: Optimized chromatographic conditions
| Parameters | Specification | |||||||||
| Stationary phase | Shimadzu shim pack GIS (150 x 4.5) mm with 5 µm particles | |||||||||
| Flow rate | 1.0 ml/min | |||||||||
| Wavelength | 254 nm | |||||||||
| Injection volume | 10 µl | |||||||||
| Mobile Phase |
|
|||||||||
| Diluent | Mobile Phase B | |||||||||
| Retention time | 8.18 |
System suitability parameters
The suitability of the system was demonstrated by assessing various parameters. It was established by injecting six replicate injections of the standard solution with potential related substances solution. Theoretical plates were found to be 9663, and the %RSD of peak area was 0.99 (table 3). All the system suitability parameters were well within the limits, indicating that the system was suitable for performing the analysis.

Fig. 6: Chromatogram for system suitability
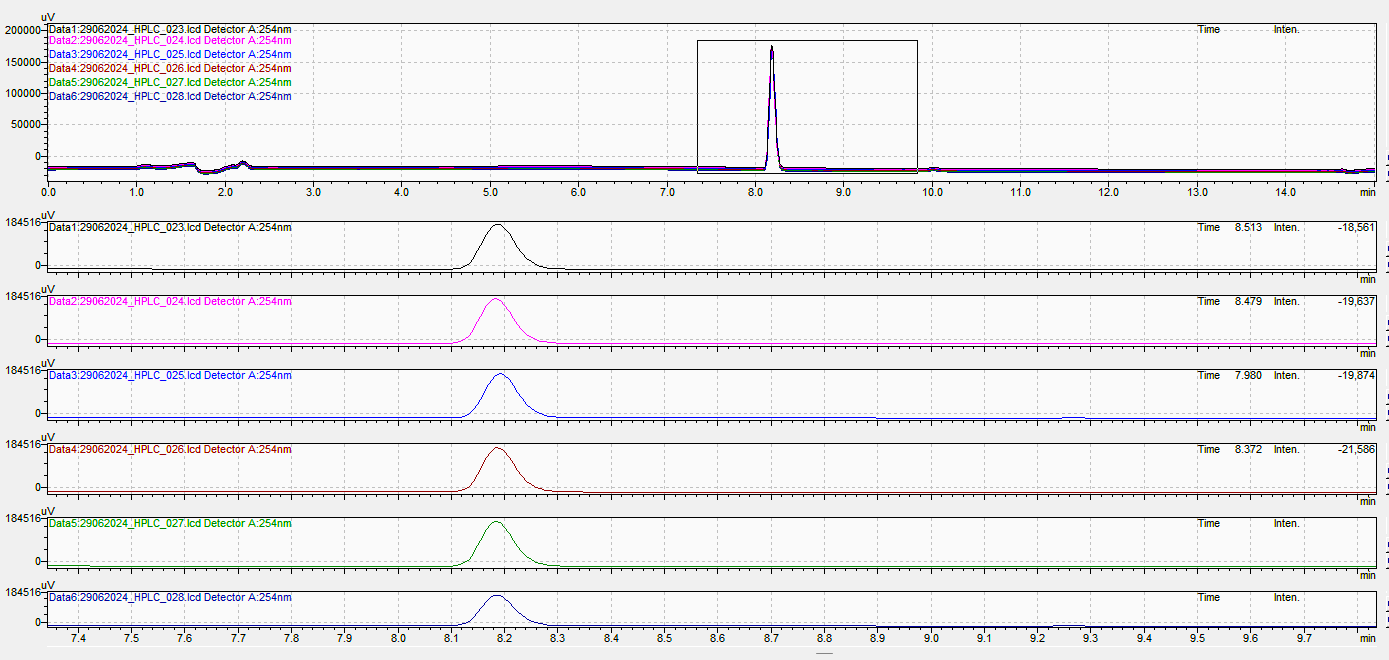
Fig. 7: Replicates for system suitability
Table 3: System suitability parameters (mean of six replicates)
| Parameters | Observation | %RSD |
| RT (min) | 8.18 | 0.37 |
| Peak area | 881630 | 0.99 |
| Theoretical plates | 9663 | 0.56 |
| Asymmetry | 1.30 | 0.53 |
Specificity
The Chromatogram and blank diluent and blank diluent with Hydrogen peroxide suggest that no interference was observed due to excipients and impurities. Hence, the developed chromatographic method was found to be highly specific. The chromatograms of the standard and sample reflect that the sample peak was obtained at the same retention time as the standard peak, thereby confirming that the drug present in the tablet formulation was deferasirox. Chromatograms are shown in fig. 4, 5 and 6.
Table 4: Specificity results for peak purity
| Sample | RT |
| Deferasirox | 8.18 |
| Deferasirox 4-Hydrazino Benzoic Acid | 1.26 |
| Deferasirox Ethyl Salicylate | 3.84 |
| Deferasirox Methyl Ester | 9.20 |
| Deferasirox Ethyl Ester | 9.71 |

Fig. 8: Chromatogram of blank diluent

Fig. 9: Chromatogram of blank diluent with H2O2

Fig. 10: Chromatogram of sample
Method validation
Accuracy
Three levels of accuracy samples were created using the usual addition method. Three doses were given at each level, and the mean % recovery was calculated. Recovery was observed to be between 100.64% and 100.22%. With a maximum % RSD of 2.0%, the allowable accuracy was within the range. The results are provided in table 5.
Precision
Table 6 shows results for intraday precision and interday precision. The % RSD values are 0.68 and 0.79, respectively. Hence, the method was observed to be precise.
Table 5: Recovery studies
| Level of addition | % mean recovery | Amount found (µg/ml), mean±SD* | %RSD |
| 50 | 100.64 | 15.09±0.02 | 0.17 |
| 100 | 100.31 | 20.06±0.08 | 0.42 |
| 150 | 100.22 | 25.05±0.10 | 0.41 |
*Data are expressed as mean±SD [n=3]
Table 6: Precision data [n=6]
| S. No. | Interday precision | Intraday precision |
| 1 | 879801 | 869340 |
| 2 | 869204 | 871163 |
| 3 | 862490 | 860497 |
| 4 | 862849 | 876941 |
| 5 | 868382 | 867342 |
| 6 | 861414 | 862499 |
| Mean | 867356.7 | 867963.7 |
| SD | 6908.60 | 5978.67 |
| %RSD | 0.79 | 0.68 |
Data are expressed as mean±SD, n=6, %RSD values lower than 2% indicates acceptable precision of the method.
Table 7: Linearity [n=3]
| S. No. | Concentration (µg/ml) | Area 1 | Area 2 | Area 3 | Mean±SD |
| 1 | 5 | 215282 | 215242 | 215343 | 215255±23.4 |
| 2 | 10 | 448583 | 448751 | 448894 | 448743±155 |
| 3 | 20 | 881630 | 881669 | 881871 | 881723±129 |
| 4 | 30 | 1314960 | 1314700 | 1314394 | 1314648±283 |
| 5 | 40 | 1731899 | 1731839 | 1731049 | 1731596±474 |
| 6 | 50 | 2166482 | 2166513 | 2166894 | 2166630±229 |
| Equation: 43205x+11019 | |||||
| R²: 0.9999 |
Data are expressed as mean±SD, n=3
Linearity and calibration curve
A calibration curve of peak area versus concentration for deferasirox was constructed (fig. 11). The linear regression equation obtained was Y=43205x+11019, and a correlation coefficient of 0.9999, indicating an excellent linear relationship between the concentration and peak area. The method was linear in the concentration range of 10-50μg/ml. The Chromatogram for the same is provided in fig. 12.
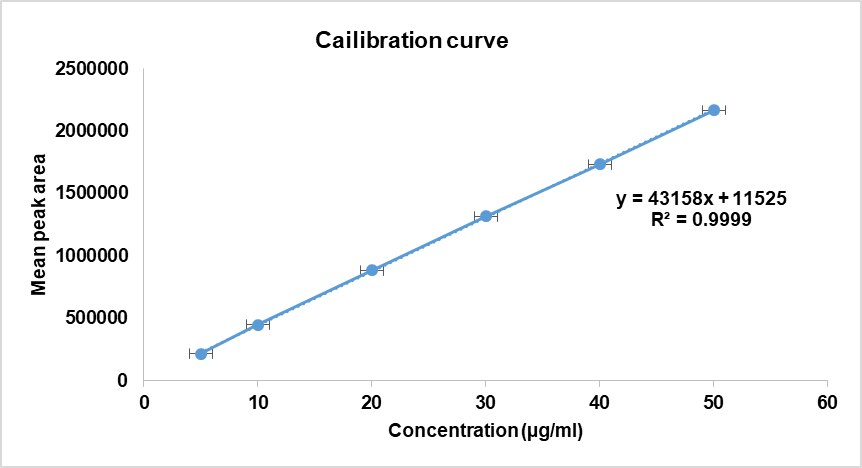
Fig. 11: Calibration curve for deferairox, fig. 11 shows the calibration curve of DFS, and the regression equation was found to bey = 43158x+11525 with a correlation coefficient (r2) of 0.9999

Fig. 12: Chromatogram for linearity
Table 8: Data for Robustness study
| S. No. | Condition | Condition | Area | Mean±SD* | %RSD |
| 1 | Variation in flow rate (ml/min) | 0.9 | 879451 | 884781±4488.71 | 0.50 |
| 1.0 | 884460 | ||||
| 1.1 | 890432 | ||||
| 2 | Change in temperature (°C) | 38 °C | 885719 | 893266±5684.24 | 0.63 |
| 40 °C | 894642 | ||||
| 42 °C | 899437 |
*Data are expressed as mean±SD, n=3
LOD and LOQ
The method's LOD and LOQ values were 0.03 and 0.09, respectively. These values indicate that the method was susceptible.
Robustness
The Robustness was examined using various deliberate alterations in chromatographic settings, such as variations in flow rate and temperature. According to the robustness investigation, the %RSD for DFS is less than 2%. Hence, it is robust and complies with ICH Guidelines. Table 8 displays the results.
Solution stability
There was no significant difference in the percentage assay of diluted standard preparation from the initial. Also, little deviation in the percentage of total impurities found in samples indicates that standard and sample solutions are stable at ambient temperature for 24 h.
Assay
An Assay Test was done using the formulation. The typical percent assay for DFS is between 99.96 % and 100.40 %. The data are provided in table 10, and the Chromatogram is shown in fig. 13.
Table 9: Solution stability
| Interval | % Assay of STD |
| Initial | 100 |
| 12 h | 99.86 |
| 24 h | 99.80 |
| 48 h | 99.10 |
Results are from duplicate injections of the same solution.
Table 10: Assay
| Formulation | Label claim | Amount of drug recovered* (mg) | % Assay |
| Desirox Tablet Cipla Ltd. | 500 mg | 494.81±0.8 | 99.2±0.47 |
*Data are expressed as mean±SD, n=3

Fig. 13: Chromatogram for assay, a summary of validation parameters is shown in table 11
Table 11: Summary of validation parameters
| Parameters | Values |
| Calibration range (μg/ml) | 10-50 |
| Optimized wavelength | 245 nm |
| Retention time | 8.1 min |
| Regression equation (Y) | Y=43158 x+11525 |
| Correlation coefficient (r2) | 0.999934 |
| Precision (%RSD) | Intraday – 0.79 |
| Interday – 0.68 | |
| % Assay | 100.39 % |
| LOD (μg/ml) | 0.03 |
| LOQ (μg/ml) | 0.09 |
The literature survey reveals that reports are available for development and validation for DFS using UV spectroscopy and the RP-HPLC method [16-21]. UV-spectroscopic methods were simpler and faster but may lack the Robustness of HPLC. Ettaboina SK developed the HPLC method for the estimation of DFS in bulk and in tablet dosage forms with linearity ranging from 10.8 to 162µg/ml [22]. The reports for the degradation behavior of these drugs vary widely. For example, Kothawade et al. observed significant degradation in Base and peroxide degradation conditions [23]. Prakash et al. observed that the drug undergoes degradation under thermal, acidic, essential, and peroxide conditions [24]. Bhatt et al. reported that Deferasirox was marginally degraded in acidic and oxidative conditions, slightly degraded in alkaline conditions, and was found to be stable in all other conditions [25]. Sisodia et al. reported significant degradation in acidic degradation conditions, whereas drug substance was stable when exposed to neutral, basic, oxidative, and thermal degradation [27]. In the present study, no degradation was observed under stress degradation studies.
The apparent inconsistencies in degradation can be attributed to various variables. The type and intensity of the stress applied can significantly influence whether degradation products are formed. Even slight differences in experimental protocols can affect the outcomes of forced degradation studies. The sensitivity and resolution of the analytical techniques can determine whether degradation is detected and quantified. If degradation studies are conducted using pure deferasirox (API) versus a tablet formulation, the results might differ significantly because the excipients in the tablet can alter the degradation profile by either stabilizing the drug or facilitating degradation through solubility changes, pH shifts, or interaction with excipients. For example, in tablets, binders might act as protective agents against oxidation, while in a pure solution, the degradation may occur more quickly due to the lack of stabilization. Under very harsh forced degradation conditions (e. g., high concentrations of oxidative agents or very high temperatures), deferasirox will likely show some degree of degradation, but under moderate stress, it may not show significant breakdown. The severity of the stress applied is key to determining whether the drug will degrade. So, in this study, harsh stress conditions were used to rule out this possibility.
Based on the present study,DFS can be considered relatively stable, but during the formulation process, there may be possibilities of the presence of process impurities, which may be encountered as relative substances. According to ICH guidelines on impurities in new drug products, identification of impurities below 0.1% level is not considered necessary unless potential impurities are expected to be unusually potent or toxic. According to ICH, the maximum daily dose qualification threshold to be considered is<2g/day 0.1 % or 1 mg per day intake (whichever is lower)>2g/day 0.05%. Also, very few efforts have been made to characterize the impurities. Using synthesized impurities as reference standards is crucial for this process, allowing for a comprehensive assessment of method performance. Saravanan et al. have developed and validated a method for determining the potential impurities of Salicylic acid and Salicylamide [28]. Hence, a method was developed that can be used for the analysis of DFS in the presence of process Impurities.
CONCLUSION
The present method was observed to be simple, specific, linear, precise, reliable, robust, economical, and validated according to the regulations of ICH Q2B. From the stability studies of the present analytical method, the degradation behaviour of DFS was known, and it has been demonstrated that this method can successfully distinguish the related impurity peak from the analytical peak. Symmetrical peaks were observed within less analysis time, and the %RSD values for all parameters were within the limits of the developed method. This shows that the results and Assay achieved by this approach are in good accordance. Hence, the present analytical method can be used to estimate DFS in bulk and pharmaceutical formulations and for regular analysis for quality control purposes. By using this method for ensuring accurate detection and quantification of impurities, pharmaceutical companies can minimize risks to patients, optimize drug formulations, and ensure that their product maintains the highest quality standards. However, The combination of HPLC with mass spectrometry (MS) (especially tandem MS (MS/MS)) can provide greater sensitivity, structural elucidation, and quantification of trace-level impurities and degradation products. LC-MS/MS offers the advantage of detecting unknown degradation products through accurate mass analysis and fragmentation patterns. Hence, there is a scope for incorporating LC-MS/MS for degradation product profiling and to ensure complete identification and quantification of impurities at trace levels.
ACKNOWLEDGEMENT
The authors express their sincere gratitude to Pharmace Research Laboratories Pvt. Ltd. for providing analytical support and are also grateful to the authorities of the Faculty of Pharmacy, Dharmsinh Desai University.
AUTHORS CONTRIBUTIONS
Rujuta T completed the research work plan and manuscript writing. Bhanubhai S reviewed the review of work plan and manuscript corrections.
CONFLICTS OF INTERESTS
The authors declare that there are no conflicts of interest regarding the publication of this article.
REFERENCESReferences
Pantopoulos K, Porwal SK, Tartakoff A, Devireddy L. Mechanisms of mammalian iron homeostasis. Biochemistry. 2012;51(29):5705-24. doi: 10.1021/bi300752r, PMID 22703180.
Halliwell B, Gutteridge JM. Free radicals and antioxidant protection: mechanisms and significance in toxicology and disease. Hum Toxicol. 1988;7(1):7-13. doi: 10.1177/096032718800700102, PMID 3278973.
Singer ST. Variable clinical phenotypes of α-thalassemia syndromes. Scientific World Journal. 2009;9:615-25. doi: 10.1100/tsw.2009.69, PMID 19618088.
Galanello R, Cao A. Relationship between genotype and phenotype. Thalassemia intermedia. Ann N Y Acad Sci. 1998;850:325-33. doi: 10.1111/j.1749-6632.1998.tb10489.x, PMID 9668554.
Borgna Pignatti C. Modern treatment of thalassaemia intermedia. Br J Haematol. 2007;138(3):291-304. doi: 10.1111/j.1365-2141.2007.06654.x, PMID 17565568.
Pippard MJ, Callender ST, Warner GT, Weatherall DJ. Iron absorption and loading in β-thalassemia intermedia. Lancet. 1979;2(8147):819-21. doi: 10.1016/s0140-6736(79)92175-5, PMID 90918.
FDA approves first oral drug for chronic iron overload. US Food and Drug Administration; 2015.
Deferasirox. PubChem compound summary; 2023. Available from: https://pubchem.ncbi.nlm.nih.gov/compound/deferasirox. [Last accessed on 25 Feb 2025]
Olsen BA, Sreedhara A, Baertschi SW. Impurity investigations by phases of drug and product development. Trac Trends Anal Chem. 2018;101:17-23. doi: 10.1016/j.trac.2017.10.025.
Singh D, Isharani R. A detailed review on analytical methods to manage the impurities in drug substances. OALIB. 2023;10(8):1-18. doi: 10.4236/oalib.1110223.
Jahani M, Fazly Bazzaz BS, Akaberi M, Rajabi O, Hadizadeh F. Recent progresses in analytical perspectives of degradation studies and impurity profiling in pharmaceutical developments: an updated review. Crit Rev Anal Chem. 2023;53(5):1094-115. doi: 10.1080/10408347.2021.2008226, PMID 35108132.
Vekariya N, Gupta P, Islam A. Synthesis and characterization of related substances of deferasirox, an iron (Fe3+) chelating agent. Int J Rapid Commun Synth Org Chem. 2012;42(21):3200-10.
ICH. Q2A validation of analytical procedures: consensus guidelines. ICH harmonized tripartite guidelines; 1994.
Conference for harmonization, Impurities in New Drug products Q3B. ICH harmonized tripartite guidelines. Vol. R2; 2006.
International Conference for Harmonization. Validation of Analytical Procedures: text and methodology. Vol. Q2. Geneva; 2005. p. R1.
Somisetty V, Dhachinamoorthi D, Rahaman S. Development and validation of newer analytical methods for the estimation of deferasirox in bulk and in tablet dosage form by UV spectroscopy and RP–HPLC. Int J Chem Tech Res. 2013;5:1861-8.
Tiwari PK, Sathe P, Devadiga N. Low level determination of genotoxic impurity in deferasirox formulation. J Anal Sci Methods Instrum. 2013;3(4):179-83. doi: 10.4236/jasmi.2013.34023.
Vattikuti R, Phani R, Seetharaman R. RP-HPLC method development for analysis of deferasirox in the formulation. IJPI’s J Anal Chem. 2011;4:30-5.
Khan M, Sinha S, Todkar M, Parashar V, Reddy K, Kulkarni U. Validated HPLC-UV method for simultaneous estimation of deferasirox and its impurities. Int J Pharm Biomed Res. 2011;2:128-34.
Chakravarthy V, Sankar D. LC determination of deferasirox in pharmaceutical formulation. J Glob Trends Pharm Sci. 2010;1:42-52.
Padmaja N, Ramathilagam N. Method development and validation of RP-HPLC method for the determination of deferasirox in tablets. Int J Pharm Bio Sci. 2012;2:338–3439.
Ettaboina SK, Nakkala K, Chathalingath N. Development and validation of rapid RP-HPLC method for determination of deferasirox in bulk and tablet dosage forms. Asian J Pharm Anal. 2022 May;12(02).
Kothawade J, Agrawal K, Lad V. Stability indicating RP-HPLC assay method development and validation for determination of deferasirox in tablet dosage form. Int J Pharm Res Allied Sci. 2012;1:40-5.
Prakash S, Chaitanya S, Neetha K. Stability indicating RP-HPLC method for the determination of deferasirox in bulk drug and pharmaceutical dosage forms. Unique Res J Chem. 2013;1(1):35-40.
Bhatt N, Dhrubjyoti S. Comparative stability-indicating assay method of deferasirox by RP-HPLC and HPTLC. World J Pharm Res. 2016;5(9):1252-79.
Anandakumar K, Chinthala R, Subhash V, Jayamariappan M. Development and validation of newer analytical methods for the estimation of deferasirox in bulk and tablet dosage form by UV spectroscopy and RP-HPLC. J Pharm Res. 2011;4(9):2998-3000.
Shishodia T, Grover P, Nagarajan K, Bhardwaj M, Chopra B. Development and validation of robust, highly sensitive and stability-indicating RP-HPLC method for estimation of deferasirox and its degradation products. J Chromatogr Sci. 2024;62(8):709-18. doi: 10.1093/chromsci/bmad032, PMID 37070383.
Saravanan S, Swetha R. Method development and validation for determination of impurities in deferasirox by RP-HPLC technique. J Drug Deliv Ther. 2012;2(3):148-52. doi: 10.22270/jddt.v2i3.128.