
Int J App Pharm, Vol 17, Issue 3, 2025, 170-179Original Article
PERMEABILITY ENHANCEMENT OF A BCS CLASS III DRUG THROUGH LIPID-BASED NANOPARTICLES: A QUALITY BY DESIGN APPROACH
MUGGU SANKARA BHAVANI1*, SARAVANAN RAVINDRAN2
1Department of Pharmaceutics, Bharath Institute of Higher Education and Research, Chennai-600073, India. 2Department of Pharmaceutics, Faculty of Pharmacy, Bharath Institute of Higher Education and Research, Chennai-600073, India
*Corresponding author: Muggu Sankara Bhavani; *Email: bhavanimuggu99@gmail.com
Received: 10 Dec 2024, Revised and Accepted: 14 Feb 2025
ABSTRACT
Objective: Metformin belongs to class III of biopharmaceutical classification. Low bioavailability of 50 – 60% due to its poor permeability and high dose of 500-1000 mg are challenging to the dosage form development of Metformin. Hence, this work was planned to augment the permeability of Metformin so as to improve its oral bioavailability.
Methods: Metformin-loaded nanoparticles with lipids, surfactants and bile salts were prepared through double emulsion solvent evaporation technique. Quality by design approach was employed to optimize and develop the nanoparticles. The central composite design was adopted to design the experiment to prepare nanoparticles from several combinations at different concentrations of the lipids and surfactants. These nanoparticles were characterized for yield, entrapment efficiency, solubility and permeability. Impacts of the factors on the solubility change and permeability change were studied by design of experiments analysis.
Results: The nanoparticles from the optimized formulation were found to have a size of 262.1 nm with a polydispersity index of 0.352 after design of experiments analysis with statistical significance measured at p<0.05. Importantly, these optimized nanoparticles exhibited permeability of 2.137x10⁻⁵ cm/sec, which was 5-times higher when compared to pure Metformin.
Conclusion: These results concluded that the oral bioavailability would be improved through improved permeability from the lipid-based nanoparticles of Metformin.
Keywords: Metformin, Bioavailability, Permeability, Lipid-based nanoparticles, Quality by design
© 2025 The Authors. Published by Innovare Academic Sciences Pvt Ltd. This is an open access article under the CC BY license (https://creativecommons.org/licenses/by/4.0/)
DOI: https://dx.doi.org/10.22159/ijap.2025v17i3.53483 Journal homepage: https://innovareacademics.in/journals/index.php/ijap
INTRODUCTION
Drugs with high solubility and low permeability are categorized as class III of biopharmaceutical classification system. Oral antidiabetic drugs (OADs) are the major treatment option for this type 2 diabetes [1]. Metformin (MTF) is one of the most commonly used OAD that belongs to Biopharmaceutic Classification System (BCS) Class III [2, 3] and was taken as the model drug in this work. It is very soluble in water and has rapid dissolution. Its oral bioavailability is around 50 – 60% which is due to its poor permeability. This less bioavailability is one of the reasons for the high dose, 500 – 1000 mg of MTFwhich pose challenges to formulation development and to swallow bulky tablets by patients [4]. These characteristics forced to aim enhancement of oral bioavailability or MTF through enhancing its permeability. Few researchers worked and reported techniques to enhance oral bioavailability of MTF. Some of the relevant works are by Kotha AA et al. [5] developed mucoadhesive microparticle and nanoparticles, Ossai EC et al. [6] prepared liposomes, and Kenechukwu FC et al. [7] worked on development of MTF-loaded PEGylated nanoparticles. These review findings inferred that a much better technique is required to enhance the permeability to a greater extent with high drug loading and good stability.
Lipid-based nanoparticles is one such technology which can augment oral bioavailability through several ways. These systems can enhance dissolution owing to their nano-size enhance permeation through passive diffusion and lymphatic absorption [8-10]. Adding bile salts into these systems can further improve the permeation and absorption of challenging drugs. Bile salts are endogenous substances with amphiphilic nature having great role in digestion and absorption of lipids from food. Also, due to their surfactant nature, they help in enhancing solubility of lipophilic materials also [11]. Pavlovic Net al. [12] reviewed the potential of bile salts and analogues in augmenting peroral bioavailability. Particularly in case of poorly permeable drugs, the bile salts can enhance permeability through ion-pairing of the ionizable drugs; enhance partitioning through the membrane, membranolytic activity, inhibition of p-glycoprotein and also through lymphatic pathway by combining with chylomicrons. Asad M et al. [13] worked on enhancement of oral bioavailability of tobramycin (belong to class III of BCS) by developing self-emulsifying systems using bile salts. From the obtained experimental results, the authors reported that the lipophilicity of tobramycin was greatly enhanced because of the incorporation of bile salts in the formulation. Besides, bile acids also have significant clinical benefits in reducing cholesterol, enhancing absorption of fat-soluble vitamins [14].
Form the extensive literature review, solid nanoparticles using lipids and bile acids that were stable and can load higher amounts of drug were aimed to prepare to enhance the permeability yet maintaining the required solubility of class III drugs of BCS by taking MTF as a model drug. Only lipids may adversely affect the solubility and thus bile acids as surfactants can control the drop in solubility while enhancing permeability. With this hypothesis, MTF Loaded Solid Lipid Nanoparticles (MSLNs) with bile acids were planned to prepare in this work. A statistical Quality by Design (QbD) approach was employed for experimental design [15, 16].
MATERIALS AND METHODS
Materials
MTF was gifted by Hetero Drugs Pvt. Ltd. TS, GMS, UDC and PLX were procured from Merck Ltd.
Compatibility studies of MTF and excipients
Infrared spectroscopy
Fourier Transform Infrared Spectroscopy (FTIR) was performed to find out the compatibility of the MTF with the excipients used in the development of MSLNs. Physical mixtures of MTF with all excipients was prepared. The samples were made into pellets by mixing with KBr followed by compression using a hydraulic press. IR spectra were recorded by taking the average of 16 scans over a 400 to 4000 cm-1 wave number range. The spectrum of pure MTF was analyzed and compared with that of the physical mixtures to assess compatibility [17].
Differential scanning calorimetry (DSC)
Thermal investigation using DSC was accomplished to find out any incompatibility of MTF with the selected excipients. Sample preparation and recording spectra were carried out as reported by Hippalgaonkar et al. [18]. The spectrum of pure MTF was analyzed and compared with that of the physical mixtures to assess compatibility.
Development of MSLNs
QbD aspects of MSLNs
The quality target for the development of MSLNs was to improve permeability and hence bioavailability of MTF. In order that lipids, bile salts, and surfactants were used in the development of the MSLNs. Four formulation variables from these excipients were chosen as the independent factors, viz. A: Lipid concentration (10%, 20%, and 30% w/w of MTF), B: Surfactant concentration (2%, 5%, and 8% w/w of MTF), C: Type of lipid {Tristearin (TS), Glyceryl monostearate (GMS)}, D: Type of surfactant {Ursodeoxycholic acid (UDC), Poloxamer 188}. These levels of the factors were selected after preliminary trials with a trial-and-error approach with an objective of a getting good yield of product. Decrease in solubility (∆S) and increase in permeability (∆P) were taken as the critical quality attributes or responses to indicate the desired quality of the MSLNs. A central composite design (CCD) was used as the experimental design to yield experimental runs at different blends of the levels of each factor. The CCD was chosen ahead of other optimization designs like the Box-Behnken design and full factorial design. Because CCD is a more economical design for the chosen number and type of factors, as it necessitates a lesser number of experimental runs in providing the same statistical inferences. The experimental runs as different formulation combinations of MSLNs as peer the CCD are displayed in table 1.
Preparation of MSLNs
Double emulsification followed by solvent evaporation out was carried to develop the MSLNs [19, 20]. The inner aqueous phase (W1) was prepared by dissolving 1 g of MTF in 4 ml of water. Required quantities of lipid and surfactant, as mentioned in table 1, were solubilized in 8 ml of an organic solvent mixture that comprised 6 ml chloroform and 2 ml ethanol to obtain the organic phase (O). A vertex mixer was used to prepare both these phases. Then, the W1 phase was gradually transferred into the organic phase aided by mixing. After complete addition, the mixture is subjected to sonication at 500W for 10 min. with 10s-2s start-stop cycles to the get primary W1/O emulsion. Later, this primary W/O emulsion was emulsified in the outer aqueous phase (W2) containing 20 ml of water with 0.1% Tween 80 as the stabilizer under mechanical stirring at 5000 rpm to produce the W1/O/W2 emulsion. The mixing continued until the chloroform and ethanol completely evaporated, leaving MSLNs suspended in water. These MSLNs were immediately separated by centrifugation, followed by drying of the pellet to obtain powdered MSLNs.
Table 1: The formulation combinations of the MSLNs with the selected factors as peer the CCD
| Formulation | Levels of factors | Quantities of materials (mg) | |||||
| A | B | C | D | Drug | Lipid | Surfactant | |
| MSLN1 | 20 | 0.76 | TS | UDC | 1000 | 200 | 7.6 |
| MSLN2 | 10 | 2 | TS | UDC | 1000 | 100 | 20 |
| MSLN3 | 30 | 2 | TS | UDC | 1000 | 300 | 20 |
| MSLN4 | 5.86 | 5 | TS | UDC | 1000 | 58.6 | 50 |
| MSLN5 | 20 | 5 | TS | UDC | 1000 | 200 | 50 |
| MSLN6 | 34.14 | 5 | TS | UDC | 1000 | 341.4 | 50 |
| MSLN7 | 10 | 8 | TS | UDC | 1000 | 100 | 80 |
| MSLN8 | 30 | 8 | TS | UDC | 1000 | 300 | 80 |
| MSLN9 | 20 | 9.24 | TS | UDC | 1000 | 200 | 92.4 |
| MSLN10 | 20 | 0.76 | GMS | UDC | 1000 | 200 | 7.6 |
| MSLN11 | 10 | 2 | GMS | UDC | 1000 | 100 | 20 |
| MSLN12 | 30 | 2 | GMS | UDC | 1000 | 300 | 20 |
| MSLN13 | 5.86 | 5 | GMS | UDC | 1000 | 58.6 | 50 |
| MSLN14 | 20 | 5 | GMS | UDC | 1000 | 200 | 50 |
| MSLN15 | 34.14 | 5 | GMS | UDC | 1000 | 341.4 | 50 |
| MSLN16 | 10 | 8 | GMS | UDC | 1000 | 100 | 80 |
| MSLN17 | 30 | 8 | GMS | UDC | 1000 | 300 | 80 |
| MSLN18 | 20 | 9.24 | GMS | UDC | 1000 | 200 | 92.4 |
| MSLN19 | 20 | 0.76 | TS | PLX188 | 1000 | 200 | 7.6 |
| MSLN20 | 10 | 2 | TS | PLX188 | 1000 | 100 | 20 |
| MSLN21 | 30 | 2 | TS | PLX188 | 1000 | 300 | 20 |
| MSLN22 | 5.86 | 5 | TS | PLX188 | 1000 | 58.6 | 50 |
| MSLN23 | 20 | 5 | TS | PLX188 | 1000 | 200 | 50 |
| MSLN24 | 34.14 | 5 | TS | PLX188 | 1000 | 341.4 | 50 |
| MSLN25 | 10 | 8 | TS | PLX188 | 1000 | 100 | 80 |
| MSLN26 | 30 | 8 | TS | PLX188 | 1000 | 300 | 80 |
| MSLN27 | 20 | 9.24 | TS | PLX188 | 1000 | 200 | 92.4 |
| MSLN28 | 20 | 0.76 | GMS | PLX188 | 1000 | 200 | 7.6 |
| MSLN29 | 10 | 2 | GMS | PLX188 | 1000 | 100 | 20 |
| MSLN30 | 30 | 2 | GMS | PLX188 | 1000 | 300 | 20 |
| MSLN31 | 5.86 | 5 | GMS | PLX188 | 1000 | 58.6 | 50 |
| MSLN32 | 20 | 5 | GMS | PLX188 | 1000 | 200 | 50 |
| MSLN33 | 34.14 | 5 | GMS | PLX188 | 1000 | 341.4 | 50 |
| MSLN34 | 10 | 8 | GMS | PLX188 | 1000 | 100 | 80 |
| MSLN35 | 30 | 8 | GMS | PLX188 | 1000 | 300 | 80 |
| MSLN36 | 20 | 9.24 | GMS | PLX188 | 1000 | 200 | 92.4 |
Characterization of MSLNs
Yield
The yield was calculated by using the below formula

Entrapment efficiency (EE)
The MSLNs, post-preparation, were subjected to centrifugation for 30 min at 8,000 rpm. The solid pellet and supernatant were isolated. To clear the free MTF, the pellet was carefully washed with water while utilising a filtration medium. After mixing the washings with the supernatant, spectrophotometric analysis was performed to measure the unentrapped quantity of MTF [21, 22]. The below equations were employed to ascertain drug entrapment efficiency.

Solubility
The solubility determination was performed using the shake flask method [23] for pure MTF and the prepared MSLNs. MTF was introduced into 2 ml of water in a stoppered test tube and agitated for a duration of 48 h. An excess amount of the drug was added until saturation was reached. The saturation was validated through the observation of undissolved material. Following the designated time period, the slurry underwent filtration, and the resulting filtrate was collected for subsequent analysis. Spectrophotometric analysis was conducted on the sample to ascertain its solubility at its maximum wavelength of 232 nm. The same procedure was followed for all the formulations of MSLNs. The obtained solubility values of the MSLNs were subtracted from that of pure MTF to determine the decrease in solubility (∆S).
Permeability
The test was conducted using an ex vivo or in vitro method [24, 25]. The duodenal segment of the small intestine from sheep was obtained from the abattoir and bathed with Ringer’s solution and preserved in formalin solution. The duodenum's internal diameter was measured at 1.6 cm. A quantity of MSLNs equivalent to 40 mg of MTF was taken, dissolved in 10 ml of water, and filtered to get a 4 mg/ml solution of MTF in water. A 5 cm segment of the duodenum was excised, with one end tied off. Subsequently, 5 ml of the prepared MTF solution was introduced into the segment, and the opposite end was also tied. A length of 3 cm was maintained between the knots to facilitate drug permeation. The duodenal setup was submerged in 100 ml of pH 7.4 phosphate buffer in a beaker, utilising a burette stand for support. The beaker was placed on a magnetic stirrer operating at 100 rpm. A 5 ml sample was extracted every 5 min and replaced with fresh buffer. The samples underwent quantification using spectrophotometry at a maximum wavelength of 232 nm of MTF. The sample collection and quantification continued until the permeation did not exceed 10% of the total MTF collected. Data obtained at this level must be regarded to ensure sink conditions when calculating drug permeability ex vivo. The apparent permeability (Papp) of MTF was quantified by the below formula [26]:

Where Papp is permeability in cm/sec; ∆Q/∆t is the rate of permeability in mg/min. (it was taken till 10% of MTF permeated); A is the duodenal membrane surface area in cm2; C0 is the MTF concentration taken. The permeability value of pure MTF was subtracted from those of the MSLNs to obtain the increase in permeability (∆P).
Design validation and optimization
The experiment was designed using the QbD software, which facilitated the statistical analysis of the responses ∆S and ∆P, as well as the design validation and optimisation. Sequential Model Sum of Squares (SMSS) investigation was conducted to identify the optimal regression model for each response variable considering all four factors. Subsequently, ANOVA was conducted for the selected regression model to assess the model's significance and the factors' effects significance on the responses [27]. Additionally, predicted versus actual plots were generated to further validate the appropriateness of the regression model prior to optimisation. Optimisation of the factors was conducted using the desirability functions approach [28], with the constraints set to 'minimise the ∆S' and 'maximise the ∆P’.
Surface morphology
The surface morphology and shape of the optimized MSLNs were analysed using Transmission Electron Microscopy (TEM). A small drop of the MSLNs dispersion, following appropriate dilution, was directly applied to the carbon-coated copper grid and permitted to dry. The specimen was subsequently visualised under a microscope, and micrograph images were collected.
Particle size
The optimised MSLNs underwent particle size analysis utilising the NanoPlus instrument (from Particulate Systems), which operates based on the dynamic light scattering technique. The MSLNs were appropriately diluted with distilled water before estimation at a constant 25 °C temperature and 90°scattering angle. Each sample was measured three times, and the average values were reported.
In vitro dissolution test
The dissolution of the optimised MSLNs was performed as per the procedures outlined in the USP. As the dissolving media, 1000 millilitres of phosphate buffer with a pH of 6.8 were added to the vessel. The temperature of the medium was kept at 37.0±0.5 °C. The paddle device was submerged in the medium and rotated at 50 rpm [29]. A predetermined quantity of the MSLNs equivalent to 1000 mg MTF was transferred into the vessel. Samples were withdrawn at 3-minute intervals and quantified spectrophotometrically following appropriate dilution.
Statistical methods
All the results were expressed as mean±standard deviation (SD) for a sample size of n = 3. ANOVA was employed to investigate the significant influences of the factors on the responses at p<0.05.
RESULTS AND DISCUSSION
Compatibility studies
FTIR specta as illustrated in fig. 1 exhibited peaks at wavlengths corresponding to the structure and functional groups. The observed peaks corresponsing to the chemical structure of MTF in pure drug spectrum are at 3386.6 cm-1and at 3293.1 cm-1 owing to N-H asymmetrical and symmetrical stretching of aliphatic primary amines, respectively, at 1622.8 cm-1owing to N-H bending of aliphatic primary amines, at 1447.1 cm-1owing to aliphatic C-H asymmetrical bending, and at 1166.7 cm-1and 1060.4 cm-1owing to C-N stretching of aliphatic amines [30]. The peaks at similar positions were also obserevd in the spectra of physical mixtrues of the MTF with excipients. These observations signified that MTF was compatible with the selected additives.
Further, the compatibility was also confirmed by performing DSC studies. The DSC spectra obtained for pure MTF and its physical mixtures with various lipids and surfactants used are illustrated in fig. 2. The spectrum of the pure MTF exhibited a sharp endotherm at 231.9 °C. The endotherm at this temperature might be due to theMTF melting point. Besides, the shape of the endotherm demonstrated that the MTF taken was in crystalline form. Spectra of the physical mixtures exhibited a first endotherm individually at temperatures 54.4 °C, 59.9 °C, 204.5 °C, and 52.0 °C, which were corresponding to the melting points of the lipids and surfactants employed, viz. TS, GMS, UDC, and PLX, respectively. This observation demonstrated that these additives were in acrystalline state. The spectra of these physical mixtures also exhibited another sharp endotherm at a similar temperature as that of the pure MTF, which is conforming to the MTF melting point. As there was no significant change in the shape and position of the MTF-corresponding endotherm, this observation signified that the MTF was compatible with the lipids and surfactants employed in this study [31].
Characterization Studies on MSLNs
All the formulations of MSLNs were characterized for yield, entrapment efficiency (EE), solubility, and permeability. For pure MTF, the solubility was determined to be 386.5 mg/ml, and the permeability was found to be 41.4 nm/sec. From the solubilities of the MSLNs, the decrease in solubility (∆S) was calculated by subtracting them from the solubility of pure MTF. Similarly, the increase in permeability (∆P) values for the MSLNs were calculated by subtracting the permeability of pure MTF from those of the MSLN values. The findings are presented in table 2. The ∆S and ∆P values were subjected to design of experiments (DoE) analysis.
The yield values were found to be in the range of 62.7–87.3% among all the formulations. This high degree of variability was attributed to the changes in the concentrations of the lipids and the nature of the lipids. These results clearly showed that increasing the lipid concentration increased the yield. Besides, the formulations prepared with TS produced more yield than the corresponding formulation prepared with GMS.
The EE was obtained in the range of 53.4–92.2% among all the formulations of the MSLNs. These results showed that the concentrations of lipids and surfactants affected the EE. Among the two lipids, TS showed higher drug entrapment than GMS. Among the two surfactants, UDC showed higher drug entrapment than PLX-188. These differences could be attributed to the higher lipophilicity of TS than GMS and of UDC than PLX which could control leakage of the drug into the outer eternal phase and thus maintain more drug inside the MSLNs. These findings were matched and justified with the results published by Joshi AS et al. [32].
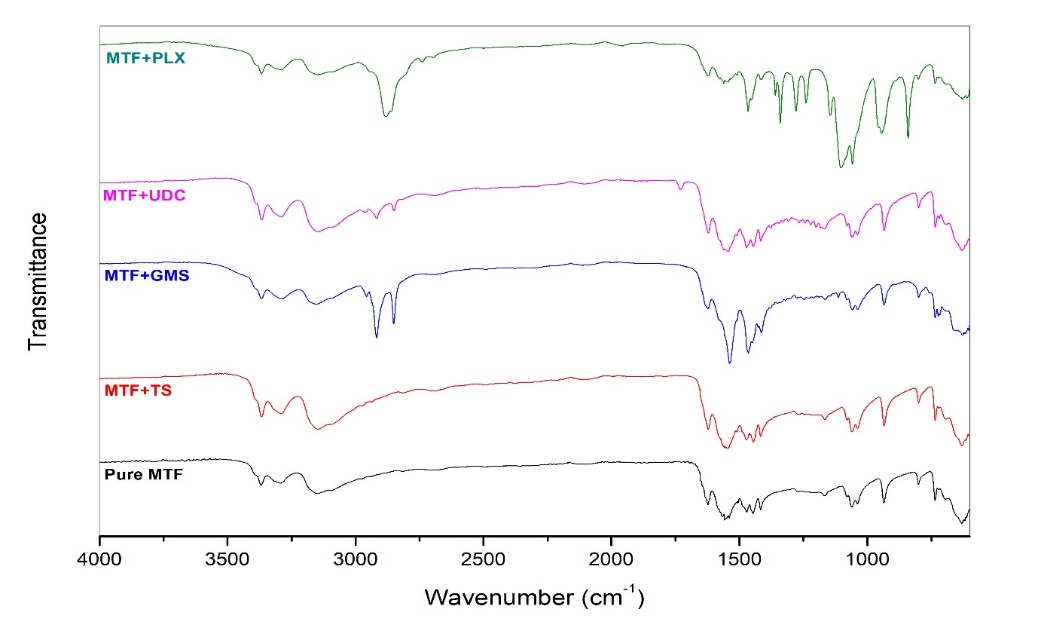
Fig. 1: IR spectra of MTF and its mixtures with lipids and surfactants
Table 2: Observed experimental findings from MSLNs characterization
| Code | Yield (%) | EE (%) | Solubility (mg/ml) | Permeability (nm/sec) | ∆S (mg/ml) | ∆P (nm/sec) |
| MSLN1 | 78.2±3.5 | 81.6±2.3 | 76.4±1.8 | 146.4±5.2 | 310.1±1.8 | 105±5.2 |
| MSLN2 | 73.6±1.8 | 75.9±4.8 | 126.8±5.3 | 95.7±3.6 | 259.7±5.3 | 54.3±3.6 |
| MSLN3 | 84.5±2.3 | 88.5±5.6 | 70.4±3.4 | 223.9±12.3 | 316.1±3.4 | 182.5±12.3 |
| MSLN4 | 68.1±2.6 | 64.3±3.9 | 192.5±6.9 | 112.7±4.7 | 194.0±6.9 | 71.3±4.7 |
| MSLN5 | 76.4±1.9 | 83.7±3.4 | 138.7±8.1 | 203.8±9.5 | 247.8±8.1 | 162.4±9.5 |
| MSLN6 | 87.3±5.2 | 92.2±4.3 | 67.1±2.2 | 274.1±13.4 | 319.4±2.2 | 232.7±13.4 |
| MSLN7 | 78.2±4.3 | 80.9±5.6 | 184.6±7.4 | 186.5±7.9 | 201.9±7.4 | 145.1±7.9 |
| MSLN8 | 82.9±2.6 | 91.3±5.3 | 141.8±3.6 | 296.4±15.2 | 244.7±3.6 | 255.0±12.2 |
| MSLN9 | 78.7±2.9 | 86.5±2.9 | 166.5±9.2 | 238.7±11.8 | 220.0±9.2 | 197.3±11.8 |
| MSLN10 | 74.9±1.8 | 76.2±3.8 | 124.9±6.3 | 124.4±6.9 | 261.6±6.3 | 83±6.9 |
| MSLN11 | 70.3±1.2 | 72.3±5.1 | 182.3±5.8 | 82.6±3.5 | 204.2±5.8 | 41.2±3.5 |
| MSLN12 | 81.3±3.5 | 79.9±6.2 | 130.2±3.7 | 215.8±10.7 | 256.3±3.7 | 174.4±10.7 |
| MSLN13 | 65.1±2.7 | 59.4±4.9 | 246.7±6.4 | 103.8±5.3 | 139.8±6.4 | 62.4±5.3 |
| MSLN14 | 72.4±1.4 | 76.1±3.7 | 169.4±5.2 | 175.9±8.6 | 217.1±5.2 | 134.5±8.6 |
| MSLN15 | 86.9±2.6 | 80.7±1.9 | 100.3±3.8 | 253.2±13.5 | 286.2±3.8 | 211.8±13.5 |
| MSLN16 | 76.2±3.1 | 72.4±2.5 | 235.9±9.1 | 149.7±7.4 | 150.6±9.1 | 108.3±7.4 |
| MSLN17 | 80.7±2.8 | 83.6±3.8 | 172.3±3.7 | 248.5±14.6 | 214.2±3.7 | 207.1±14.6 |
| MSLN18 | 76.7±2.3 | 79.3±2.1 | 206.4±5.6 | 213.4±10.1 | 180.1±5.6 | 172.0±10.1 |
| MSLN19 | 73.1±4.3 | 75.3±4.5 | 112.3±4.2 | 134.8±5.7 | 274.2±4.2 | 93.4±5.7 |
| MSLN20 | 69.4±1.6 | 68.9±1.8 | 154.9±3.3 | 76.3±4.2 | 231.6±3.3 | 34.9±4.2 |
| MSLN21 | 79.2±1.7 | 81.4±5.3 | 100.6±4.7 | 203.6±11.8 | 285.9±4.7 | 162.2±11.8 |
| MSLN22 | 62.7±3.3 | 57.1±3.7 | 229.6±8.5 | 81.4±3.9 | 156.9±8.5 | 40.0±3.9 |
| MSLN23 | 70.4±2.9 | 72.4±2.9 | 186.7±6.3 | 179.1±10.3 | 199.8±6.3 | 137.7±10.3 |
| MSLN24 | 80.5±4.6 | 82.6±4.1 | 87.4±3.7 | 243.8±14.6 | 299.1±3.7 | 202.4±14.6 |
| MSLN25 | 71.3±2.5 | 66.5±2.7 | 224.3±7.6 | 151.7±8.4 | 162.2±7.6 | 110.3±8.4 |
| MSLN26 | 75.6±1.3 | 77.4±3.6 | 162.4±5.4 | 263.2±12.5 | 224.1±5.4 | 221.8±12.5 |
| MSLN27 | 73.2±2.7 | 69.8±4.2 | 213.3±9.2 | 229.5±10.6 | 173.2±9.2 | 188.1±10.6 |
| MSLN28 | 65.5±1.1 | 71.8±3.4 | 182.7±5.5 | 106.3±7.2 | 203.8±5.5 | 64.9±7.2 |
| MSLN29 | 66.3±2.4 | 63.4±5.1 | 251.5±10.6 | 70.9±3.8 | 135.0±10.6 | 29.5±3.8 |
| MSLN30 | 73.9±3.5 | 74.7±2.9 | 206.2±8.7 | 193.4±11.4 | 180.3±8.7 | 152.0±11.4 |
| MSLN31 | 63.2±3.1 | 53.4±3.7 | 280.9±11.4 | 90.1±3.9 | 105.6±11.4 | 48.7±3.9 |
| MSLN32 | 65.8±2.4 | 69.1±1.8 | 223.4±9.5 | 163.3±8.5 | 163.1±9.5 | 121.9±8.5 |
| MSLN33 | 80.3±2.9 | 76.2±4.3 | 152.7±6.8 | 233.9±12.7 | 233.8±6.8 | 192.5±12.7 |
| MSLN34 | 71.2±1.6 | 59.6±2.6 | 274.7±12.4 | 156.4±10.2 | 111.8±12.4 | 115.0±10.2 |
| MSLN35 | 75.9±2.2 | 68.3±3.3 | 216.5±8.3 | 241.8±13.6 | 170.0±8.3 | 200.4±13.6 |
| MSLN36 | 70.4±2.7 | 63.7±1.7 | 251.2±6.1 | 196.2±8.5 | 135.3±6.1 | 154.8±8.5 |
Results are presented as mean±SD for n = 3
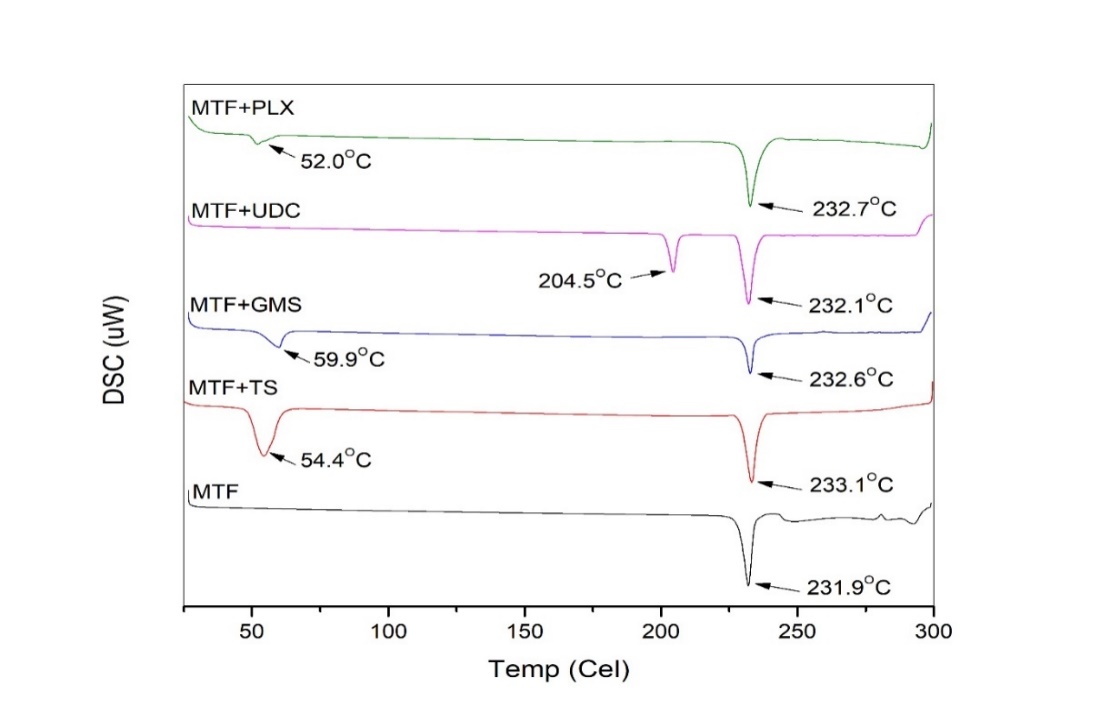
Fig. 2: DSC spectra of MTF in pure form and in combinations with lipids and surfactants employed in this study
Table 3: Results of ANOVA test for the responses
| Source | Sum of squares | Degrees of freedom | mean square | F-value | p-valuea |
| For ∆S (for linear model) | |||||
| Model | 1.12x10⁵ | 4 | 27980.45 | 100.12 | <0.0001 |
| A | 45104.05 | 1 | 45104.05 | 161.39 | <0.0001 |
| B | 23761.36 | 1 | 23761.36 | 85.02 | <0.0001 |
| C | 26238.60 | 1 | 26238.60 | 93.88 | <0.0001 |
| D | 16817.77 | 1 | 16817.77 | 60.18 | <0.0001 |
| Residual | 8663.79 | 31 | 279.48 | ||
| Cor Total | 1.21x10⁵ | 35 | |||
| For ∆P (for 2-factorial interaction model) | |||||
| Model | 1.42x10⁵ | 10 | 1.42x10⁴ | 236.22 | <0.0001 |
| A | 1.00x10⁵ | 1 | 1.00x10⁵ | 1667.25 | <0.0001 |
| B | 34417.75 | 1 | 34417.75 | 573.50 | <0.0001 |
| C | 2880.11 | 1 | 2880.11 | 47.99 | <0.0001 |
| D | 3021.33 | 1 | 3021.33 | 50.34 | <0.0001 |
| AB | 696.96 | 1 | 696.96 | 11.61 | 0.0022 |
| AC | 201.38 | 1 | 201.38 | 3.36 | 0.0789 |
| AD | 27.95 | 1 | 27.95 | 0.4657 | 0.5013 |
| BC | 180.76 | 1 | 180.76 | 3.01 | 0.0950 |
| BD | 3.42 | 1 | 3.42 | 0.0570 | 0.8132 |
| CD | 276.67 | 1 | 276.67 | 4.61 | 0.0417 |
| Residual | 1500.34 | 25 | 60.01 | ||
| Cor Total | 1.43x10⁵ | 35 | |||
| Note: a the model terms with p-value<0.05 are significant |
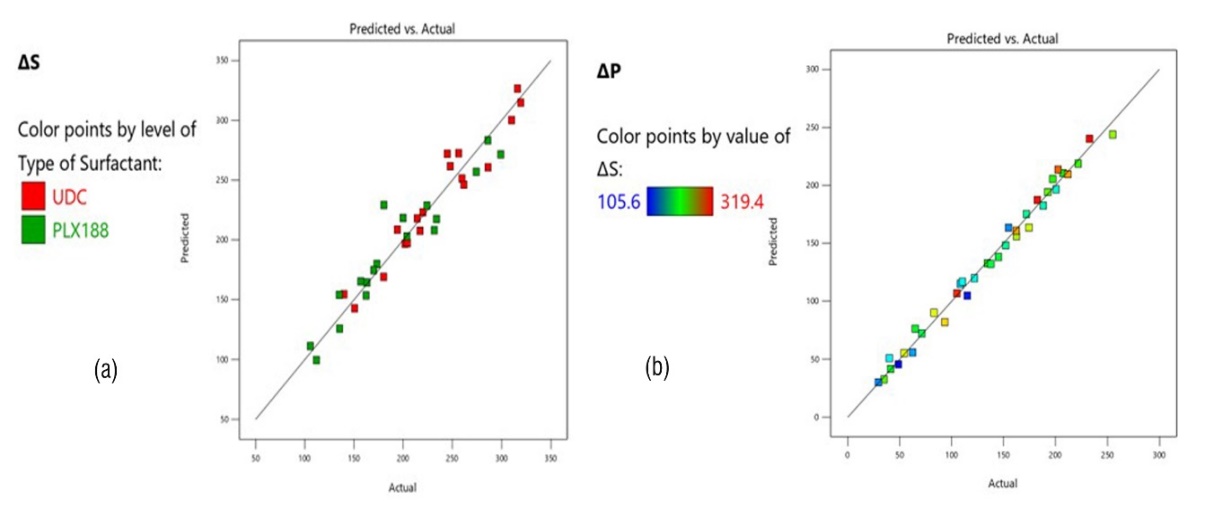
Fig. 3: Predicted Vs. actual plots of the responses (a) ∆S, (b) ∆P
Experimental design validation
The SMSS analysis was carried out, and the results demonstrated that the responses ∆S and ∆P were best fit with the factors by the linear regression model and 2-factorial interaction model (2-FI), respectively. These suggested models for each response were validated using an ANOVA test for their significance [33]. The ANOVA test results are presented in table 3. These findings demonstrated that both the models for the respective responses were found to be significant at p<0.05. The predicted vs. actual plots illustrated that all the data points were evenly spread across the 45 line as shown in fig. 3. Besides, the influences of all the factors on the ∆S and ∆P were observed to be significant at p<0.05. These validation parameters signified that the linear model for the ∆S and the 2-FI model for the ∆P can be preceded for optimization.
DoE analysis of the responses
Impact sof the factors on ∆S
The solubility of pure MTF was determined as 386.5 mg/ml, and those of the MSLNs are presented in table 2. The differences in the solubility of the MSLNs from that of the pure MTF are presented as ∆S. Influences of the factors A and B on the ∆S are illustrated in fig. 4(a). Upon increasing the level of the factor A, the solubility of MTF was found to be decreased, and the ∆S was increased. This might be because of the improved lipophilicity at higher concentrations of the lipids, which might decrease the solubility of MTF [34]. In the MSLNs, MTF was coated by the lipids owing to the mode of incorporation of the drug and lipids in obtaining the W/O/W emulsion. Hence, higher concentrations of the lipids might form thicker coats over the MTF, and thus, a greater decrease in solubility was observed. These findings were matched and justified with the results published by Mirchandani et al. [35], who reported that enhanced interaction of water-soluble drugs with high amounts of lipids could increase their partitioning into the lipid phase owing to the increased lipophilicity. As the factor B level is enhanced, the ∆S was found to be decreased, which a meant smaller drop in the solubility of MTF. This means the decrease in solubility of MTF due to the lipids is controlled by the surfactants and hence smaller ∆S values are observed. For example, three of the formulations, MSLN1, MSLN2, and MSLN3, contain the same amount of 200 mg TS for 1 g of MTF, but the surfactant UDC was present at 7.6, 50.0, and92.4 mg, respectively. In the case of the MSLN1, the solubility was dropped to 76.4 mg/ml from 386.5 mg/ml of pure MTF with a ∆S of 310.1 mg/ml. whereas ∆S of MSLN5 and MSLN9 were found to be 247.8 mg/ml and 238.7 mg/ml, respectively. An increase in the concentration of these surfactants resulted in higher solubilities and smaller ∆S values at the same concentration of lipid in the SLNs. This could be attributed to the relatively hydrophilic nature of the surfactants employed, as the UDC [36] and PLX-188 [37] have HLB values of more than 10 [38]. The surfactants were incorporated in the MSLNs along with the lipids, and hence these were also a part of the lipid coat over the drug. Hence, at higher concentrations of the surfactants, the lipid coat might be relatively more hydrophilic. So, the MSLNs with higher surfactant concentration can have relatively more solubility, and hence the drop in their solubility was lesser. Though the objective of the work is to enhance lipophilicity, thereby increasing the permeability of MTF, the solubility should not be greatly diminished. Therefore, surfactants like UDC and PLX were incorporated to control the negative effect of the lipids on the solubility of MTF.
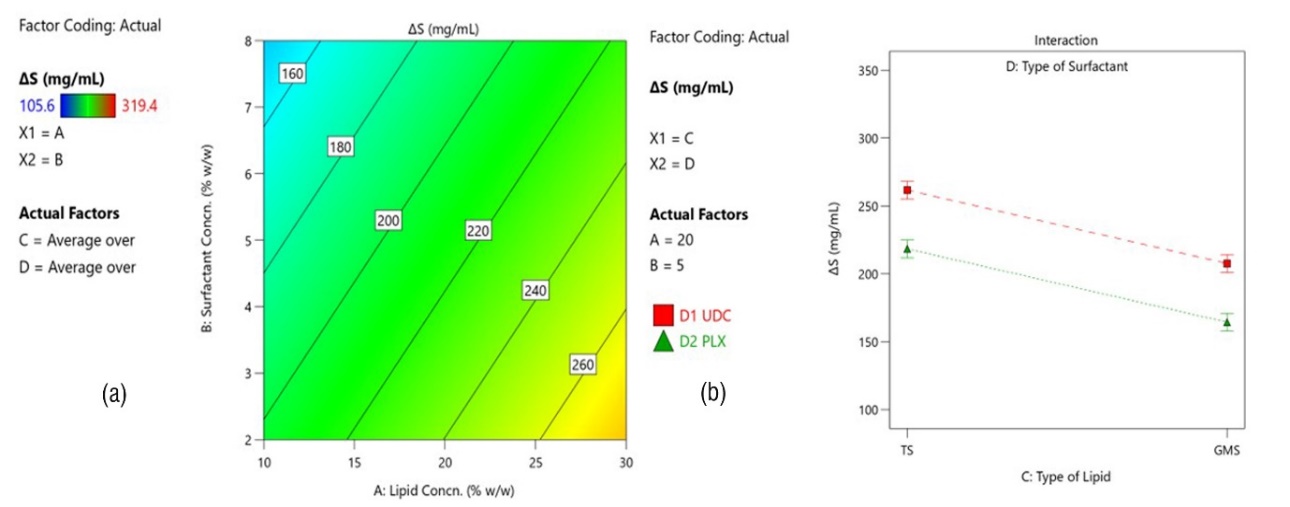
Fig. 4: Depiction of influences of the factors on ∆S (a) Influences of the factors A and B by contour plot, (b) Influences of the factors C and D by interaction plot
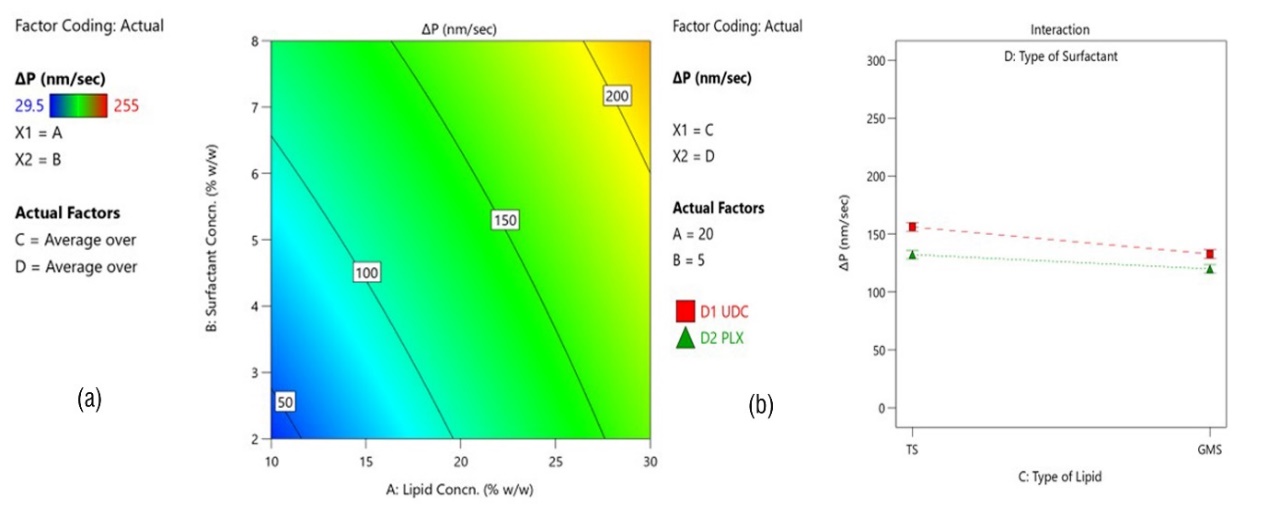
Fig. 5: Depiction of influences of the factors on ∆P (a) Influences of the factors A and B by contour plot, (b) Influences of the factors C and D by interaction plot
The influences of the categoric factors C and D are illustrated in fig. 4(b). Among the two types of lipids (Factor C), the ∆S was found to be more in the case of TS than that in the case of GMS. TS reduced the solubility of MTF more significantly than GMS did. TS is more lipophilic owing to its three non-polar chains than the GMS with one non-polar chain. Besides, the polar glyceryl groups in the GMS can decrease the non-polarity of the lipid. Hence, the higher lipophilicity of TS caused a greater drop in the solubility of MTF [39]. Among the two types of surfactants (Factor D), the ∆S was found to be more in the case of UDC than that in the case of PLX. Even though both surfactants are hydrophilic, PLX is more hydrophilic with an HLB of 29, than the UDC with an HLB of 18 [37, 40]. Because PLX is more hydrophilic, the MSLNs were able to dissolve in it more easily than when they were mixed with UDC. Hence, the ∆S was smaller in the case of PLX.
Impacts of the factors on ∆P
The permeability of pure MTF was found to be 41.4 nm/sec, and those of the MSLNs are presented in table 2. The differences in the permeability of the MSLNs from that of the pure MTF are presented as increases in permeability, ∆P. Influences of the factors A and B on the ∆P are illustrated in fig. 5(a). Upon increasing the level of the Factor A, the permeability of MTF was found to be increased and the ∆P was increased. This might be because of the increased lipophilicity at higher concentrations of the lipid, which resulted in increased permeability of MTF [41]. As the biological membranes are lipophilic, higher lipophilicity of drugs is required for higher permeability. TS and GMS can enhance the lipophilicity of MTF, as these are present as a layer over the MTF in the MSLNs. These findings were matched and justified with the results published by Bhalekar et al., who obtained an enhanced permeability of darunavir from 2.1x10⁻⁶ cm/s to 24x10-6 cm/s upon development of SLNs [42]. As the Factor B level was enhanced, it also resulted in an increase in the ∆P. This means the permeability of MTF was also increased by the surfactants. This might be because of the lower interfacial tension at higher surfactant concentrations. After dissolving in the aqueous gastrointestinal (GI) fluids, the drug shall partition into alipophilic membrane for permeation. So, at the interface between the GI fluids and the membrane, the interfacial tension plays a defining role in allowing the drug molecules to permeate. Surfactants can reduce this interfacial tension and enhance permeation through the biological membrane. Thus, at higher concentrations of the surfactants, the drop in interfacial tension would be more, which resulted in increased permeability of MTF. These findings were matched and justified with the results published by Aguilera-Garrido A et al. [43].
The impacts of the categoric factors C and D are illustrated in fig. 5(b). Among the two types of lipids (Factor C), the ∆P was found to be more in the case of TS than that in thecase of GMS. TS is more lipophilic owing to its three non-polar chains than the GMS with one non-polar chain. The higher lipophilicity of TS might cause a greater increase in the permeability of MTF [44]. Due to the presence of hydrophilic glyceryl units also, the lipophilicity imparted to MTF by the GMS would be lower than that by the TS, and hence the ∆P was found to be lower in MSLNs prepared with GMS. Among the two surfactants, the ∆P was found to be more in the case of UDC than that in the case of PLX. Among the two surfactants, UDC is less hydrophilic. UDC is one of the bile acids, and it can cause active transport of the associated drug through bile acid transport system. Bile acids can also cause apartial breakdown of the membrane and inhibit p-glycoprotein. These activities of bile acids together can improve the permeability of the drugs associated with them. In addition to the surfactant nature, the bile acid nature of UDC might contribute to the permeability, and thus the membrane permeability of MTF was found to be more from the MSLNs made with UDC [37, 40].
Optimization of the MSLNs
Statistical optimization of the MSLNs formulation was carried out by the desirability function approach. The desirability criteria were taken in accordance with the main objective of the work, i. e., enhancing the permeability of MTF without a greater decrease in solubility. So, the criteria for the responses were considered as minimizing the ∆S with an upper limit of 194 mg/ml (half of the solubility of pure MTF) and maximizing the ∆P with a lower limit of 150 nm/sec (at least twice the permeability of pure MTF) such that MTF from the MSLNs could be satisfying the BCS class I criteria. No specific criteria were taken for the factors A, B, and C. But, for the level of the factor D, UDC was preferred ahead of PLX considering the multiple roles of the bile acids in enhancing permeability. The result of optimization performed at these criteria is illustrated as an overlay plot in fig. 6. The region in the yellow shade in the overlay plot designates design space. More design space area was observed with GMS when compared with that of TS as the type of factor C. Other combinations with TS and UDC, TS and Poloxamer 188, and GMS and Poloxamer 188 were also checked, but they resulted with lesser desirability. Hence, the overplot with GMS and UDC was generated, having maximum design space. Hence, the overlay plot, taking GMS and UDC as the levels of the factors C and D, is illustrated. MSLNs with ∆S less than 194 mg/ml and ∆P more than 150 nm/sec could be made from any mix of the factors in this area at certain levels. One such combination of the factors as identified by the software as the most desirable combination was chosen at 21.76% w/w of GMS and 7.73% w/w of UDC. The forecast results of the ∆S and ∆P by the software were found to be 189.5 mg/ml and 168.6 nm/sec, respectively.
A new formulation of MSLNs at this specified combination of 21.76% w/w of GMS as the lipid and 7.73% w/w of UDC as the surfactant was prepared and characterized for solubility and permeability. The solubility and permeability of MTF from these MSLNs were obtained as 200.8 mg/ml and 213.7 nm/sec, respectively. Hence, the ∆S and ∆P values of this formulation were 185.7 mg/ml and 172.3 nm/sec. These obtained results were found to be matching the desirability criteria and also correlated with the predicted values within 95% confidence intervals. The literature showed that many researchers reported that a drug is considered to be highly permeable if it has a permeability more than 1.0x10⁻⁵ cm/sec as reported by Samineni R et al. [45]. As the permeability of MTF from this formulation of MSLNs was obtained as 213.7 nm/sec i. e., 2.137x10⁻⁵ cm/sec, the MTF from this formulation can be considered as highly permeable. Hence, this formulation of the MSLNs was considered as the optimized formulation with high permeability and yet having the desired solubility to be considered as high soluble as per BCS.
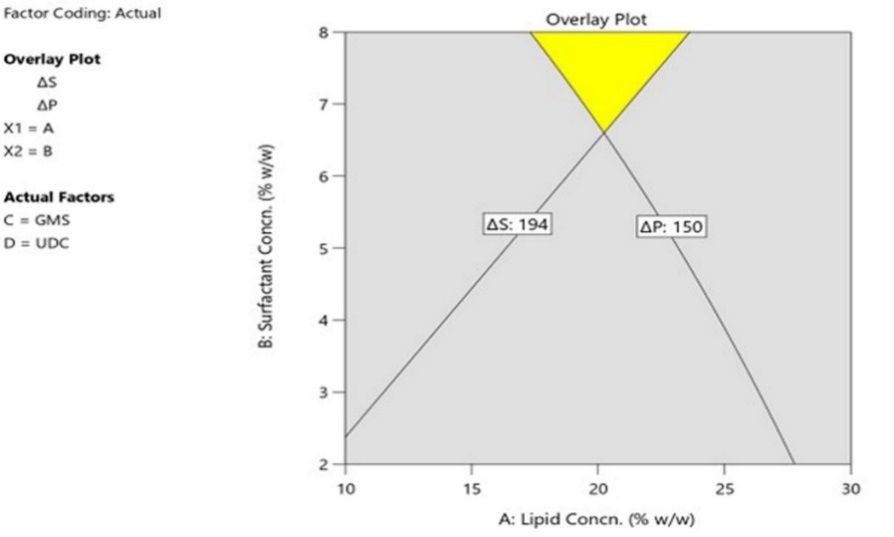
Fig. 6: Overlay plot depicting design space for the MSLNs formulation
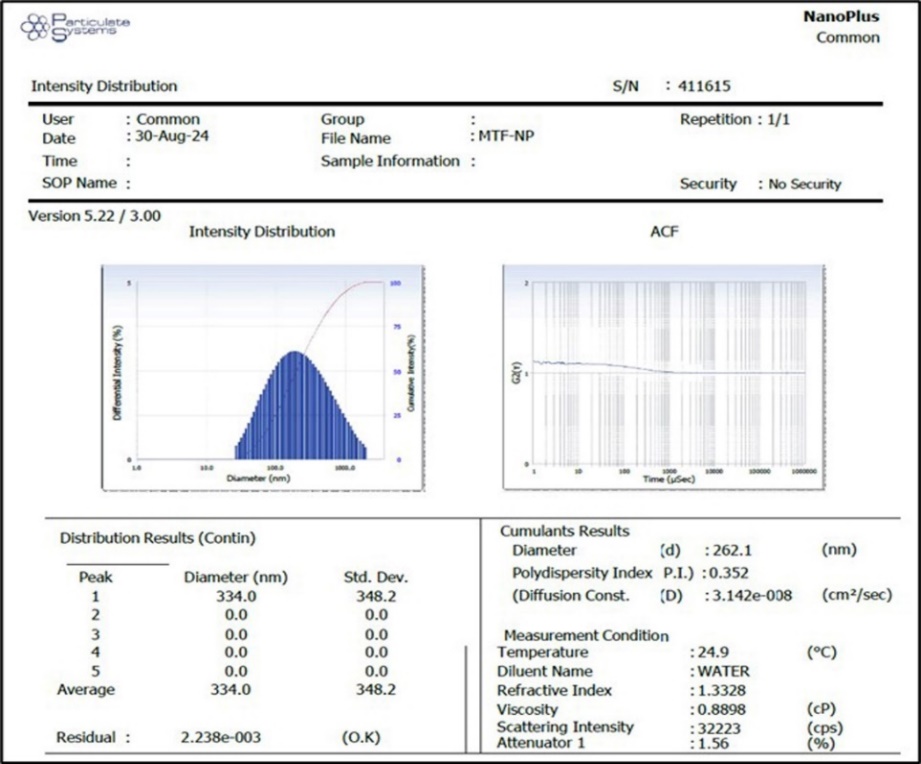
Fig. 7: Spectrum of particle size analysis of the optimized MSLNs
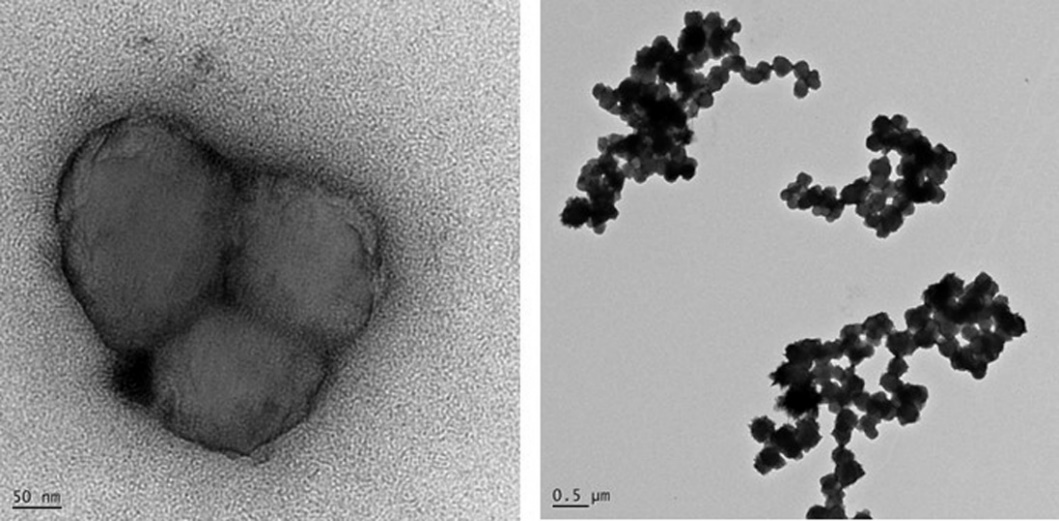
Fig. 8: TEM micrographs depicting surface morphology of the optimized MSLNs
Characterization of the optimized MSLNs
In addition to the solubility and permeability the optimized MSLNs were also characterized for particle size, surface morphology, and in vitro dissolution. Particle size was determined by using differential light scattering technique and the obtained result is illustrated in fig. 7. The particle size was found to be 262.1 nm with a polydispersity index (PDI) of 0.352. This relatively lower PDI indicated that the MSLNs could exhibit good stability against sedimentation and also less variability during scale-up. This optimized MSLNs were produced in triplicate batches and the particle size results were highly close to one another among the three batches. This size was highly acceptable to recognize the product as nanoparticles. This particle size can have additional advantages under in vivo conditions like rapid dissolution and lymphatic absorption which can aid in improved bioavailability. Surface morphology of the MSLNs was studied by TEM analysis and the observed micrographs are presented in fig. 8. These images illustrated that the MSLNs were near to spherical shape and have a uniform texture.
The optimized MSLNs was subjected to dissolution testing in comparison with pure MTF. The obtained data is presented as the dissolution profiles in fig. 9. The findings of the dissolution test conveyed that the dissolution of MTF from the optimized MSLN was extended up to 12 min. from 9 min. in case of pure MTF. This could be attributed to the presence of lipids in the MSLNs formulation which might hinder the dissolution of MTF. This further can be attributed to the decreased solubility of MTF from the MSLNs. Even though, the dissolution was extended, still the time required for complete dissolution of MTF was found to be 12 min. For a drug to be considered as very rapidly dissolving as per the BCS, it should dissolve completely within 15 min. Hence, the optimized MSLNs formulation could make the MTF very rapidly dissolving in addition to make highly permeable [46]. Mixing by vertexing followed by sonication were employed for preparation of the MSLNs by the double emulsion technique. These techniques are already well developed and established for large scale manufacturing of emulsions. So, scale-up of the optimized MSLNs may not be a challenge. Owing to the enough solubility, enhanced permeability and high dissolution rate of this optimized MSLN formulation, it can be translated into a viable product after suitable in vivo bioavailability, pharmacokinetic and stability studies.
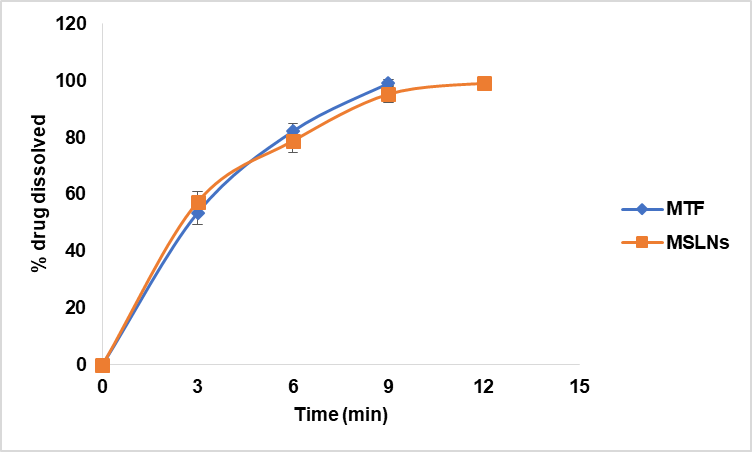
Fig. 9: Comparative dissolution profiles of MTF from pure drug and from the optimized MSLNs
CONCLUSION
This study was carried out with an objective of enhancing the permeability-limited bioavailability of highly soluble drug MTF. MSLNs with different lipids and surfactants including bile acid were formulated. A QbD approach was used to design the formulation, to analyze the influences of the formulation factors on the solubility and permeability of the MSLNs and finally to optimize the formulation. After optimization, an MSLNs formulation prepared by taking GMS as lipid at 21.76 %w/w and UDC as the bile acid/surfactant at 7.73 % w/w was the optimized formulation. This formulation exhibited a solubility of 200.8 mg/ml, permeability of 2.14x10⁻⁵ cm/sec, particle size of 262.1 nm. The results of in vitro dissolution in addition to the solubility, confirmed that the formulation of MTF into MSLNs retained the high solubility and very rapidly dissolving characteristics in spite of enhancing the permeability. Hence, these optimized MSLNs can enhance the permeation-limited bioavailability of MTF. The permeability was enhanced with still maintaining the solubility under ‘high soluble’ category; this technology could be suitable to other BCS class III drugs suffering from poor bioavailability and higher doses.
ACKNOWLEDGMENT
The authors are acknowledged to Bharath Institute of Higher Education and Research, Chennai, and Hindu College of Pharmacy, Guntur.
FUNDING
Nil
AUTHORS CONTRIBUTIONS
Saravanan Ravindran developed the concept plan of work reviewed and approved the experimental results and manuscript writing. Muggu Sankara Bhavani involved in plan of work, execution of the work, collected the data and wrote the manuscript.
CONFLICT OF INTERESTS
Declared none
REFERENCES
Bidulka P, Lugo Palacios DG, Carroll O, O Neill S, Adler AI, Basu A. Comparative effectiveness of second-line oral antidiabetic treatments among people with type 2 diabetes mellitus: emulation of a target trial using routinely collected health data. BMJ. 2024 May 8;385:e077097. doi: 10.1136/bmj-2023-077097, PMID 38719492.
Metry M, Shu Y, Abrahamsson B, Cristofoletti R, Dressman JB, Groot DW. Biowaiver monographs for immediate release solid oral dosage forms: metformin hydrochloride. J Pharm Sci. 2021 Apr;110(4):1513-26. doi: 10.1016/j.xphs.2021.01.011, PMID 33450218.
Cheng CL, YU LX, Lee HL, Yang CY, Lue CS, Chou CH. Biowaiver extension potential to BCS Class III high solubility low permeability drugs: bridging evidence for metformin immediate release tablet. Eur J Pharm Sci. 2004 Jul;22(4):297-304. doi: 10.1016/j.ejps.2004.03.016, PMID 15196586.
Derosa G, D Angelo A, Romano D, Maffioli P. Effects of metformin extended release compared to immediate release formula on glycemic control and glycemic variability in patients with type 2 diabetes. Drug Des Dev Ther. 2017 May 16;11:1481-8. doi: 10.2147/DDDT.S131670, PMID 28553078.
Kotha AA, Ahmad SU, Dewan I, Bhuiyan MA, Rahman FI, Naina Mohamed I. Metformin hydrochloride loaded mucoadhesive microspheres and nanoparticles for anti-hyperglycemic and anticancer effects using factorial experimental design. Drug Des Dev Ther. 2023 Dec 6;17:3661-84. doi: 10.2147/DDDT.S432790, PMID 38084128.
Ossai EC, Madueke AC, Amadi BE, Ogugofor MO, Momoh AM, Okpala CO. Potential enhancement of metformin hydrochloride in lipid vesicles targeting therapeutic efficacy in diabetic treatment. Int J Mol Sci. 2021 Mar 11;22(6):2852. doi: 10.3390/ijms22062852, PMID 33799652.
Kenechukwu FC, Isaac GT, Nnamani DO, Momoh MA, Attama AA. Enhanced circulation longevity and pharmacodynamics of metformin from surface-modified nanostructured lipid carriers based on solidified reverse micellar solutions. Heliyon. 2022 Mar 15;8(3):e09100. doi: 10.1016/j.heliyon.2022.e09100, PMID 35313488.
Gangavarapu A, Tapia Lopez LV, Sarkar B, Pena Zacarias J, Badruddoza AZ, Nurunnabi M. Lipid nanoparticles for enhancing oral bioavailability. Nanoscale. 2024 Oct 10;16(39):18319-38. doi: 10.1039/d4nr01487a, PMID 39291697.
Chettupalli AK, Bukke SP, Rahaman SA, Unnisa A, Adepu M, Kavitha M. Ritonavir loaded solid lipid nanoparticles for oral drug delivery and bioavailability enhancement. Discov Appl Sci. 2025 Jan 7;7(1):58. doi: 10.1007/s42452-024-06322-1.
AN V, John AP, Priya S, Raviraj C, Ashtekar H. Optimized solid lipid nanoparticles for enhanced oral bioavailability and osteogenic effect of ipriflavone: formulation characterization and in vitro evaluation. Int J App Pharm. 2024 Nov;16(6):79-89. doi: 10.22159/ijap.2024v16i6.51890.
Gaowa A, Horibe T, Kohno M, Kawakami K. Bile acid as an effective absorption enhancer for oral delivery of epidermal growth factor receptor-targeted hybrid peptide. J Pharm Sci. 2018 May;107(5):1322-9. doi: 10.1016/j.xphs.2017.12.012, PMID 29273347.
Pavlovic N, Golocorbin Kon S, Danic M, Stanimirov B, Al Salami H, Stankov K. Bile acids and their derivatives as potential modifiers of drug release and pharmacokinetic profiles. Front Pharmacol. 2018 Nov 8;9:1283. doi: 10.3389/fphar.2018.01283, PMID 30467479.
Asad M, Rasul A, Abbas G, Shah MA, Nazir I. Self-emulsifying drug delivery systems: a versatile approach to enhance the oral delivery of BCS class III drug via hydrophobic ion pairing. PLOS One. 2023 Jun 9;18(6):e0286668. doi: 10.1371/journal.pone.0286668, PMID 37294790.
Fleishman JS, Kumar S. Bile acid metabolism and signaling in health and disease: molecular mechanisms and therapeutic targets. Signal Transduct Target Ther. 2024 Apr 26;9(1):97. doi: 10.1038/s41392-024-01811-6, PMID 38664391.
Chakravarthy PS, Grandhi S, Swami R, Singh I. Quality by design based optimization and development of cyclodextrin inclusion complexes of quercetin for solubility enhancement. Biointerface Res Appl Chem. 2023;13(5):424. doi: 10.33263/BRIAC135.424.
Nadendla RR, Priyanka PV. Optimizing transdermal patch formulation for enhanced delivery of rivaroxaban: a comprehensive design of experiments approach. Int J Pharm Pharm Sci. 2024;16(12):8-20. doi: 10.22159/ijpps.2024v16i12.51075.
Srikar G, Gouthamib KS, Manasac B, Sirishad AS. Formulation optimization and characterization of amlodipine oral disintegrating tablets prepared by co-grinding technique. Pharm Lett. 2013;5(4):335-43.
Hippalgaonkar K, Adelli GR, Hippalgaonkar K, Repka MA, Majumdar S. Indomethacin loaded solid lipid nanoparticles for ocular delivery: development characterization and in vitro evaluation. J Ocul Pharmacol Ther. 2013 Mar;29(2):216-28. doi: 10.1089/jop.2012.0069, PMID 23421502.
Subroto E, Andoyo R, Indiarto R. Solid lipid nanoparticles: review of the current research on encapsulation and delivery systems for active and antioxidant compounds. Antioxidants (Basel). 2023 Mar 3;12(3):633. doi: 10.3390/antiox12030633, PMID 36978881.
Singh S, Dobhal AK, Jain A, Pandit JK, Chakraborty S. Formulation and evaluation of solid lipid nanoparticles of a water soluble drug: zidovudine. Chem Pharm Bull (Tokyo). 2010 May;58(5):650-5. doi: 10.1248/cpb.58.650, PMID 20460791.
Yeo S, Kim MJ, Shim YK, Yoon I, Lee WK. Solid lipid nanoparticles of curcumin designed for enhanced bioavailability and anticancer efficiency. ACS Omega. 2022 Sep 28;7(40):35875-84. doi: 10.1021/acsomega.2c04407, PMID 36249382.
Al Hattali WS, Samuel BA, Philip AK. Enhancing fluconazole solubility and bioavailability through solid dispersion techniques: evaluation of polyethylene glycol 6000 and sodium carboxymethylcellulose systems using fiber optics. Int J Pharm Pharm Sci. 2024;16(12):51-9. doi: 10.22159/ijpps.2024v16i12.52739.
Baka E, Comer JE, Takacs Novak K. Study of equilibrium solubility measurement by saturation shake flask method using hydrochlorothiazide as model compound. J Pharm Biomed Anal. 2008 Jan 22;46(2):335-41. doi: 10.1016/j.jpba.2007.10.030, PMID 18055153.
Navapariya V, M TM. Formulation and characterisation of risedronate sodium sublingual spray. Int J Curr Pharm Sci. 2024;16(6):69-77. doi: 10.22159/ijcpr.2024v16i6.6004.
Jha SK, Karki R, Puttegowda VD, Harinarayana D. In vitro intestinal permeability studies and pharmacokinetic evaluation of famotidine microemulsion for oral delivery. Int Sch Res Not. 2014 Dec 7;2014:452051. doi: 10.1155/2014/452051, PMID 27379272.
Artursson P. Epithelial transport of drugs in cell culture. I: a model for studying the passive diffusion of drugs over intestinal absorptive (caco-2) cells. J Pharm Sci. 1990 Jun;79(6):476-82. doi: 10.1002/jps.2600790604, PMID 1975619.
Podder S, Mukherjee S. Response surface methodology (RSM) as a tool in pharmaceutical formulation development. Asian J Pharm Clin Res. 2024;17(11):18-25. doi: 10.22159/ajpcr.2024v17i11.52149.
Srikar G, Rani AP. Tenofovir loaded poly (lactide-co-glycolide) nanocapsules: formulation optimization by desirability functions approach. Indian J Pharm Educ Res. 2020 Apr 1;54(2S):s230-40. doi: 10.5530/ijper.54.2s.79.
Umeta B, Bekele A, Mohammed T, Duguma M, Teshome H, Mekonnen Y. Dissolution profile evaluation of eight brands of metformin hydrochloride tablets available in Jimma Southwest Ethiopia. Diabetes Metab Syndr Obes. 2021 Aug 5;14:3499-506. doi: 10.2147/DMSO.S316187, PMID 34385824.
Djebbar M, Chaffai N, Bouchal F. Development of floating tablets of metformin HCl by thermoplastic granulation. Part ii: in vitro evaluation of the combined effect of acacia gum/HPMC on biopharmaceutical performances. Adv Pharm Bull. 2020 Jul;10(3):399-407. doi: 10.34172/apb.2020.048, PMID 32665898.
Rojek B, Wesolowski M. A combined differential scanning calorimetry and thermogravimetry approach for the effective assessment of drug substance-excipient compatibility. J Therm Anal Calorim. 2023;148(3):845-58. doi: 10.1007/s10973-022-11849-9.
Joshi AS, Patel HS, Belgamwar VS, Agrawal A, Tekade AR. Solid lipid nanoparticles of ondansetron HCl for intranasal delivery: development optimization and evaluation. J Mater Sci Mater Med. 2012 Sep;23(9):2163-75. doi: 10.1007/s10856-012-4702-7, PMID 22802103.
Grandhi S, Rani AP, Pathuri R. Voriconazole solid lipid nanoparticles: optimization of formulation and process parameters. Res J Pharm Technol. 2018 Jul;11(7):2829-35. doi: 10.5958/0974-360X.2018.00522.
Zoubari G, Staufenbiel S, Volz P, Alexiev U, Bodmeier R. Effect of drug solubility and lipid carrier on drug release from lipid nanoparticles for dermal delivery. Eur J Pharm Biopharm. 2017 Jan;110:39-46. doi: 10.1016/j.ejpb.2016.10.021, PMID 27810471.
Mirchandani Y, Patravale VB, SB. Solid lipid nanoparticles for hydrophilic drugs. J Control Release. 2021 Jul 10;335:457-64. doi: 10.1016/j.jconrel.2021.05.032, PMID 34048841.
Hanafi NI, Mohamed AS, Sheikh Abdul Kadir SH, Othman MH. Overview of bile acids signaling and perspective on the signal of ursodeoxycholic acid the most hydrophilic bile acid in the heart. Biomolecules. 2018 Nov 27;8(4):159. doi: 10.3390/biom8040159, PMID 30486474.
Chen WN, Shaikh MF, Bhuvanendran S, Date A, Ansari MT, Radhakrishnan AK. Poloxamer 188 (P188) a potential polymeric protective agent for central nervous system disorders: a systematic review. Curr Neuropharmacol. 2022;20(4):799-808. doi: 10.2174/1570159X19666210528155801, PMID 34077349.
Pokhrel DR, Sah MK, Gautam B, Basak HK, Bhattarai A, Chatterjee A. A recent overview of surfactant drug interactions and their importance. RSC Adv. 2023 Jun 12;13(26):17685-704. doi: 10.1039/d3ra02883f, PMID 37312992.
Paliwal R, Rai S, Vaidya B, Khatri K, Goyal AK, Mishra N. Effect of lipid core material on characteristics of solid lipid nanoparticles designed for oral lymphatic delivery. Nanomedicine. 2009 Jun;5(2):184-91. doi: 10.1016/j.nano.2008.08.003, PMID 19095502.
Kunieda H, Ohyama KI. Three phase behavior and HLB numbers of bile salts and lecithin in a water oil system. J Colloid Interface Sci. 1990 May 1;136(2):432-9. doi: 10.1016/0021-9797(90)90390-A.
Sivadasan D, Ramakrishnan K, Mahendran J, Ranganathan H, Karuppaiah A, Rahman H. Solid lipid nanoparticles: applications and prospects in cancer treatment. Int J Mol Sci. 2023 Mar 24;24(7):6199. doi: 10.3390/ijms24076199, PMID 37047172.
Bhalekar M, Upadhaya P, Madgulkar A. Formulation and characterization of solid lipid nanoparticles for an anti-retroviral drug darunavir. Appl Nanosci. 2017 Feb;7(1-2):47-57. doi: 10.1007/s13204-017-0547-1.
Aguilera Garrido A, Arranz E, Galvez Ruiz MJ, Marchal JA, Galisteo Gonzalez F, Giblin L. Solid lipid nanoparticles to improve bioaccessibility and permeability of orally administered maslinic acid. Drug Deliv. 2022 Dec;29(1):1971-82. doi: 10.1080/10717544.2022.2086937, PMID 35762633.
Tan JY, Yoon BK, Cho NJ, Lovric J, Jug M, Jackman JA. Lipid nanoparticle technology for delivering biologically active fatty acids and monoglycerides. Int J Mol Sci. 2021 Sep 7;22(18):9664. doi: 10.3390/ijms22189664, PMID 34575831.
Samineni R, Chimakurthy J, Konidala S. Emerging role of biopharmaceutical classification and biopharmaceutical drug disposition system in dosage form development: a systematic review. Turk J Pharm Sci. 2022 Dec 21;19(6):706-13. doi: 10.4274/tjps.galenos.2021.73554, PMID 36544401.
Sherif AY, Harisa GI, Alanazi FK, Nasr FA, Alqahtani AS. Pegylated SLN as a promising approach for lymphatic delivery of gefitinib to lung cancer. Int J Nanomedicine. 2022 Jul 28;17:3287-311. doi: 10.2147/IJN.S365974, PMID 35924261.