
Int J App Pharm, Vol 17, Issue 3, 2025, 180-188Original Article
PREPARATION OF MULTICOMPONENT CRYSTAL TICAGRELOR-MEGLUMINE AND ITS PHYSICOCHEMICAL CHARACTERIZATION
SALMAN UMAR1, AHDI DINIL HAQ. AH1,2, MUHAMMAD NASRUL SIREGAR1, ERIZAL ZAINI1*
1*Department of Pharmaceutics, Faculty of Pharmacy, Universitas Andalas, West Sumatera, Indonesia. 2Akademi Farmasi Dwi Farma Bukittinggi, Indonesia
*Corresponding author: Erizal Zaini; *Email: erizal@phar.unand.ac.id
Received: 22 Dec 2024, Revised and Accepted: 19 Mar 2025
ABSTRACT
Objective: Ticagrelor (TICA), an antiplatelet agent used in cardiovascular treatment, is classified as a Class IV compound in the Biopharmaceutical Classification System, characterized by low solubility and low permeability, leading to poor bioavailability. This study aimed to enhance the solubility and dissolution rate of TICA through the formation of a multicomponent crystal with meglumine.
Methods: Multicomponent crystals were prepared using the solvent drop grinding method. A binary phase diagram of ticagrelor and Meglumine (MEG) was constructed to determine the eutectic composition and temperature. Characterization was conducted using Differential Scanning Calorimetry, Fourier Transform Infrared Spectroscopy, Powder X-ray diffraction, and Scanning Electron Microscopy. Solubility tests and in vitro dissolution studies were performed to evaluate improvements in solubility and dissolution rate.
Results: The binary phase diagram confirmed a simple eutectic mixture at a 4:6 molar ratio, with a eutectic temperature of 124.31 °C. The multicomponent crystal demonstrated 1.4 times higher solubility compared to intact ticagrelor. Dissolution studies showed significant improvements: 70.44% in 0.1 N HCl and 62.27% in CO₂-free distilled water within 60 min, compared to 40.39% and 31.38%, respectively, for intact TICA (P<0.05).
Conclusion: The formation of TICA and MEG multicomponent crystals significantly enhanced solubility and dissolution rates, suggesting its potential to improve the bioavailability of TICA. This approach highlights the promise of multicomponent crystal technology in addressing the bioavailability challenges of Class IV drugs.
Keywords: Ticagrelor, Meglumine, Multicomponent crystal, Eutectic mixture, Dissolution rate, Solubility
© 2025 The Authors. Published by Innovare Academic Sciences Pvt Ltd. This is an open access article under the CC BY license (https://creativecommons.org/licenses/by/4.0/)
DOI: https://dx.doi.org/10.22159/ijap.2025v17i3.53485 Journal homepage: https://innovareacademics.in/journals/index.php/ijap
INTRODUCTION
Solubility plays an important role in demonstrating good bioavailability, effectiveness and pharmacological response. There are several techniques that can improve drug solubility such as particle size reduction, preparation salt formation, microemulsion, solid dispersion, complexation, amorphous dispersion and co-crystallization. Co-crystallization is the process of preparing multicomponent crystals, which is a combination of two or more components in certain molar ratio amounts consisting of Active Pharmaceutical Ingredients (APIs) with coformers that have or do not have pharmacological activities [1].
Multicomponent crystal can improve the physicochemical properties of drug compounds, such as solubility, dissolution rate, stability, and compressibility by modifying the crystal structure without changing its pharmacological activity [2]. Multicomponent crystal consist of cocrystals, solvates, hydrates, salts, solid solutions (crystal mixtures), and eutectic mixtures. Eutectic mixture refers to a system consisting of two or more components that, when mixed in a specific ratio, melt at a temperature lower than the melting point of each pure component. This property allows eutectic mixtures to enhance solubility and dissolution rates by providing a unique microenvironment for drug release. Multicomponent crystals are designed by selecting a suitable coformer that can interact with drug molecules through non-covalent bonds to form a new crystalline phase [3]. The preparation of multicomponent crystals can be done by various methods, such as the solvent evaporation method, solvent drop grinding, solid-state grinding, and melting method [4].
Active pharmaceutical ingredient (API) that used in the preparation of multicomponent crystals is a poorly soluble in water such as Ticagrelor (TICA). TICA is an antiplatelet classified into class IV in biopharmaceutical classification system (BCS) which has poor solubility and permeability thus has a low oral bioavailability. The bioavailability of TICA is about 30-42% and half-life about 7-9 h with an onset time in 30 min by perorally and duration of action about 3-4 d [5-7]. There are several techniques in increasing the permeability of APIs, including the preparation of solid dispersions using β-cyclodextrin, the addition of Poloxamer-407 excipients [8, 9], the preparation of liposomes [10] and addition of some enhancers [11, 12].
The preparation of multicomponent crystals represents an innovative pharmaceutical technology to address the solubility challenges associated with TICA. This approach requires the selection of a suitable coformer, which acts as a multicomponent forming agent. Coformers are typically water-soluble, inert, and non-toxic compounds, ensuring their safety for pharmaceutical use [13, 14]. Several studies have explored the use of various coformers to prepare multicomponent crystals of TICA. For example, tartrate acid was utilized as a coformer in molar ratios of 1:1 and 2:1, resulting in solubility enhancements of 2.7-fold and 2.6-fold, respectively, compared to the intact substance [15]. Shane et al. [16] employed quercetin as a coformer, achieving a 1.6-fold improvement in solubility. Similarly, a study using nicotinamide as a coformer in a 1:1 molar ratio demonstrated a significant 4-fold increase in solubility compared to the marketed drug [17]. These findings highlight the potential of multicomponent crystals in enhancing the solubility of poorly soluble drugs like TICA, underscoring the importance of selecting appropriate coformers for this purpose.
Among the various coformers available, Meglumine (MEG) has been widely recognized as a safe and non-toxic option for pharmaceutical applications. It is an organic base synthesized from D-glucose and methylamine, making it a biocompatible and pharmaceutically acceptable compound. MEG’s potential as a coformer has been demonstrated in several studies. For instance, it was employed in the preparation of usnic acid cocrystals using the solvent evaporation method [18], resulting in a significant enhancement of solubility. Similarly, Meg was utilized in the formation of a eutectic mixture of usnic acid via the solvent drop grinding method [19], and in a binary system of mefenamic acid prepared through the solvent evaporation method. These approaches achieved solubility improvements ranging from 24-fold to as much as 297-fold, showcasing its effectiveness as a coformer [20]. The selection of MEG as a coformer in this study is guided by its established safety profile, its ability to form stable interactions with APIs, and its proven capability to enhance solubility in various multicomponent systems. These attributes make MEG a compelling candidate for the preparation of TICA multicomponent crystals, an area that has not been previously explored.
The purpose of this research is to prepare a multicomponent crystal of TICA using MEG as a coformer by solvent drop grinding method to increase the solubility and dissolution rate of TICA. A multicomponent crystal will be characterized using (differential scanning calorimetry) DSC for thermal analysis, powder x-Ray diffraction (PXRD), fourier transform infrared spectroscopy (FTIR) and microscopic analysis using scanning electron microscopy (SEM).
MATERIALS AND METHODS
Materials
TICA (Dr. Reddy's Lab: PT. Tatarasa Primatama), MEG (TCI, Japan), ethyl acetate (Merck, USA), hydrochloric acid (Merck, USA), methanol pro analysis (Merck, USA), acetonitrile (Merck, USA) and CO2-free aquadest.
Preparation of multicomponent crystal TICA–MEG using solvent drop grinding method
The multicomponent crystal of TICA-MEG was prepared by homogeneously grinding both substances, followed by the addition of 1-5 drops of ethyl acetate. The mixture was then ground manually using a mortar and pestle for approximately 15 min, placed in a desiccator, and subsequently characterized [19].
Two-phase diagram preparation
Multicomponent crystal TICA-MEG made by solvent drop grinding method with 9 formulas which are 1:9, 2:8, 3:7, 4:6, 5:5, 6:4, 7:3, 8:2 and 9:1 molar ratio. Multicomponent crystals characterized by using DSC, PXRD, FTIR and SEM [21].
Multicomponent crystal characterization
Differential scanning calorimetry (DSC)
Thermal analysis of the samples was carried out using a temperature was calibrated using DSC apparatus (DSC-STA PT 1600, USA) on TICA, MEG and multicomponent crystal compounds. Some samples were placed in a closed aluminum pan and the DSC device was programmed at a temperature range of 30-250 ℃ heating rate of 10 ℃/min, under a flow of 30 Psi nitrogen gas [19, 22].
Powder X-ray diffraction (PXRD)
Analysis was carried out on TICA, MEG and multicomponent crystals. X-ray diffraction analysis of sample powders was performed at room temperature using an X-ray diffractometer (Philips X'Pert Powder, The Nedherlands) with Cu K radiation (λ= 1.54178Å), 40 kV voltage, 40 mA current. Samples were measured for mode reflection at 0.05 theta with an angle range of 3⁰ to 40⁰ theta at a scan rate of 5⁰/minute [19].
Fourier transform infrared spectroscopy (FTIR)
Analysis was carried out on TICA, MEG and multicomponent crystalline compounds. A small amount of sample was taken after which the FTIR instrument (Thermo Fisher Scientific, USA) program and the sample was analyzed at room temperature. Spectra were measured in the wave number range of 4000-600 cm-1[19].
Scanning electron microscopy (SEM)
SEM analysis was performed on the TICA, MEG and multicomponent crystals using SEM instrument (Hitachi FLEXSEM 100, Japan). The samples were coated with a thin layer of palladium-gold before analysis. The SEM used a beam speed of 20 kV [19].
Solubility test
Solubility tests were performed on intact TICA and multicomponent crystals; both prepared as saturated solutions. A total of 25 mg of intact TICA and an amount of multicomponent crystal equivalent to 25 mg of TICA were each placed into a 250 ml Erlenmeyer flask, followed by the addition of 100 ml of CO₂-free distilled water. The test was conducted using an orbital shaker (Memmert WNB 29, Germany) set at 100 rpm for 24 h under controlled room temperature conditions of 25 °C. After the shaking process, the samples were filtered using Whatman filter paper, and the filtrates were analyzed using a UV spectrophotometer at the maximum wavelength [22].
Dissolution rate profile
The dissolution profile of TICA was determined using a paddle method dissolution apparatus (type II USP) (Dissolution Tester DIS 800i, USA). The dissolution medium consisted of 900 ml of 0.1 N HCl and CO₂-free distilled water, selected due to its acidic and near-neutral pH properties, as recommended in Martin’s Physical Pharmacy [23]. The temperature was maintained at 37±0.5 °C. A total of 25 mg of intact TICA and an amount of multicomponent crystal equivalent to 25 mg of TICA were introduced into the dissolution medium and stirred at 100 rpm. Aliquots of 5 ml were withdrawn at predefined intervals of 5, 10, 15, 30, 45, and 60 min. The dissolved TICA content in the samples was quantified using a UV-Vis spectrophotometer (Shimadzu UV-Vis 1800, USA) at the maximum wavelength [22].
Data analysis
Data from the solubility and dissolution rate tests were statistically analyzed using IBM SPSS Statistics (version 26.0, IBM Corp., Armonk, NY, USA). Homogeneity and normality were assessed to ensure the validity of the results. One-way ANOVA was employed to determine the statistical significance of differences between the solubility values across the tested formulations. A p-value of<0.05 was considered statistically significant.
RESULTS AND DISCUSSION
Two phases diagram analysis
Characterization results show a simple eutectic mixture of TICA-MEG. A eutectic mixture is a combination of a binary mixture which has a lower melting point than the melting point of each intact component [21], so a variation of the molar ratio of the mixture was made to determine the eutectic point (table 1). From the DSC result of 9 molar ratio variations, it can be confirmed that the multicomponent crystals are eutectic mixtures, where the eutectic point for TICA-MEG is at 4:6 molar ratio. The thermogram overlay of the result from 9 multicomponent molar ratio variations can be seen in fig. 1 and fig. 2.
Table 1: Thermogram data of TICA-MEG binary mixture
| Mixture molar ratio | Melting point (℃) |
| 1:9 | 129.62 |
| 2:8 | 129.22 |
| 3:7 | 128.94 |
| 4:6 | 124.31 |
| 5:5 | 124.64 |
| 6:4 | 124.75 |
| 7:3 | 126.15 |
| 8:2 | 125.96 |
| 9:1 | 135.30 |
Nine variations of molar ratio of TICA and MEG were designed to clarify the eutectic point of the two mixtures then analyzed with a two-phase diagram. Two-phase diagram is a kind of graph used to show the equilibrium conditions between different phases of the same substance with the lowest point of the 9 mixture variations [24]. TICA-MEG mixture has an eutectic point at a molar ratio of 4:6. This occur due to the eutectic mixture that has a minimum melting point, which indicates a lower lattice energy and a decrease in the enthalpy of fusion, which means a decrease in the degree of crystallinity of the compound [25].
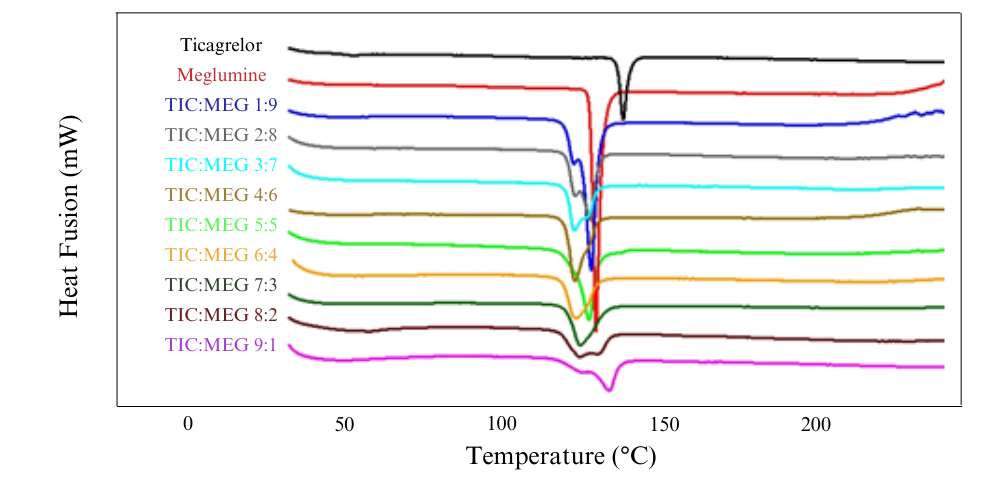
Fig. 1: DSC thermograms of various TICA-MEG binary mixtures in molar ratio 1:9, 2:8, 3:7, 4:6, 5:5, 6:4, 7:3 8:2 and 9:1
Two-phase diagram of TICA-MEG (fig. 4) shows a mixture that almost forms a classic V pattern, where the minimum point will represent the mole ratio and temperature at the eutectic point. The eutectic point made at 124.31 ℃ temperature. This temperature is the solid temperature on the two-phase diagram. A decrease in melting point indicates weaker lattice energy. Crystals with strong lattices have higher melting points and thus require greater heat. Solubility requires disruption of the crystal lattice so that the weaker the crystal lattice, the better the solubility [26].
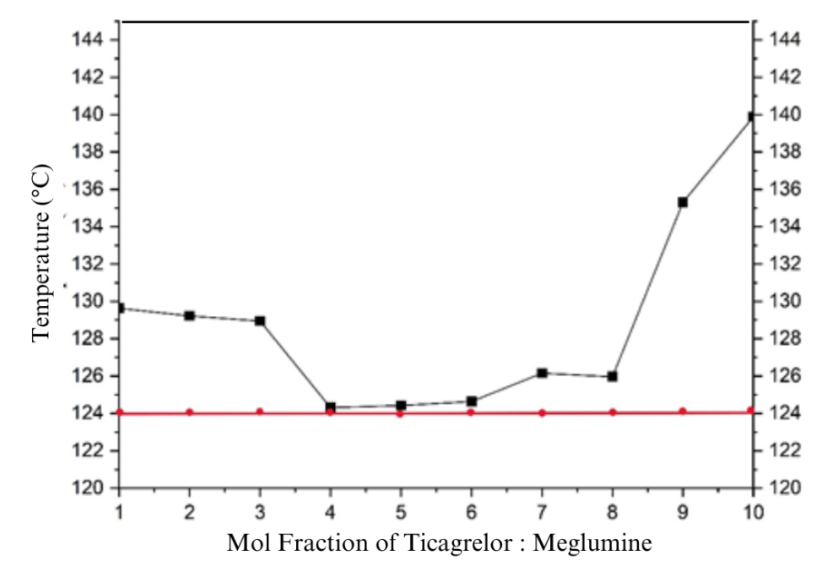
Fig. 2: Two-phase diagram of multicomponent crystal TICA-MEG
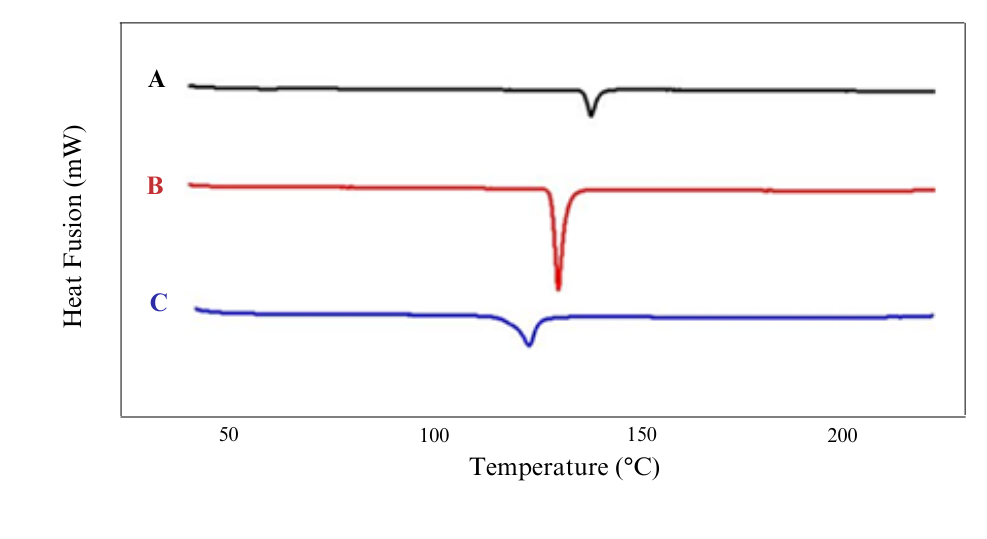
Fig. 3: Thermograms of TICA (A), MEG (B), multicomponent crystal TICA-MEG 1:1 (C)
Differential scanning calorimetry (DSC) analysis
The result of thermal analysis by using DSC showed that ban initial study of the preparation of multicomponent crystals with 1:1 molar ratio shows a decrease in the melting point of the mixture compared to the melting point of intact component. Fig. 3 shows the melting point of TICA and MEG at 139.88 ℃ and 131.19 ℃, while the multicomponent melting point of TICA-MEG 1:1 crystal showed lower results than the intact substances, which is 124.64 ℃. Based on observations, there is a change in the melting point of the 1:1 multicomponent crystal, which is 124.64 ℃. This change in the melting point of the multicomponent indicates the interaction that occurs between TICA and MEG.
Powder X-ray diffraction (XRD) analysis
PXRD results at 2θ showed that the TICA-MEG mixture did not exhibit any new diffraction peaks, indicating no formation of new crystalline phases from the mixture. The diffractogram overlay of TICA, MEG, and the multicomponent crystal TICA-MEG is presented in fig. 4, demonstrating a decrease in the intensity of identical diffraction peaks. This reduced intensity is likely attributed to rearrangement or decreased regularity in the crystal lattice due to thermodynamic activity [27]. Additionally, differences in diffraction peak intensity between the physical mixture and the multicomponent crystal are due to variations in particle size distribution and particle orientation during the PXRD measurement process. Similar peak patterns were observed before and after the stability study, confirming that no changes occurred in the crystal lattice structure [21].
Fourier transform infrared (FT-IR) spectroscopy analysis
The preparation of multicomponent crystal is indicated by significant differences in functional group vibrations when compared to the intact component based on hetero and homo synthon supramolecular [28]. FTIR result of TICA, MEG and multicomponent crystals can be seen in fig. 5. Comparison of wave numbers of TICA, MEG and multicomponent can be seen in table 2.
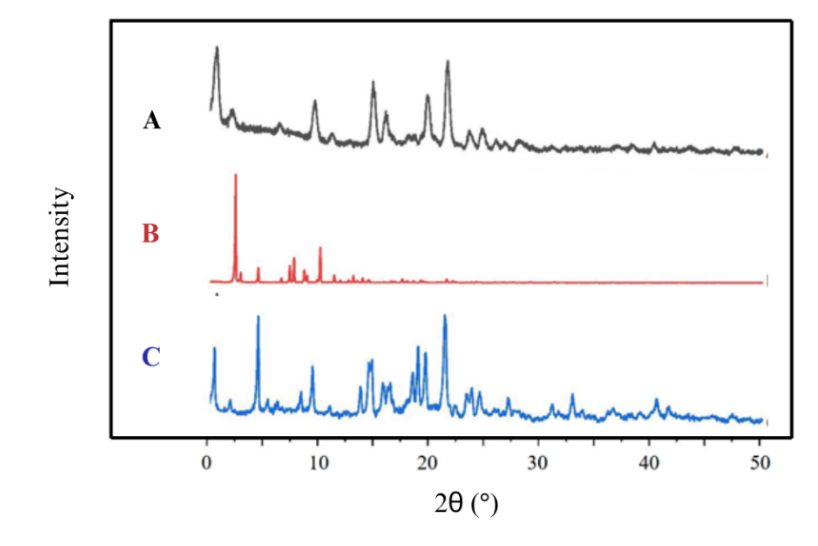
Fig. 4: X-ray diffractogram of TICA (A), MEG (B), multicomponent crystal TICA-MEG 1:1 (C)
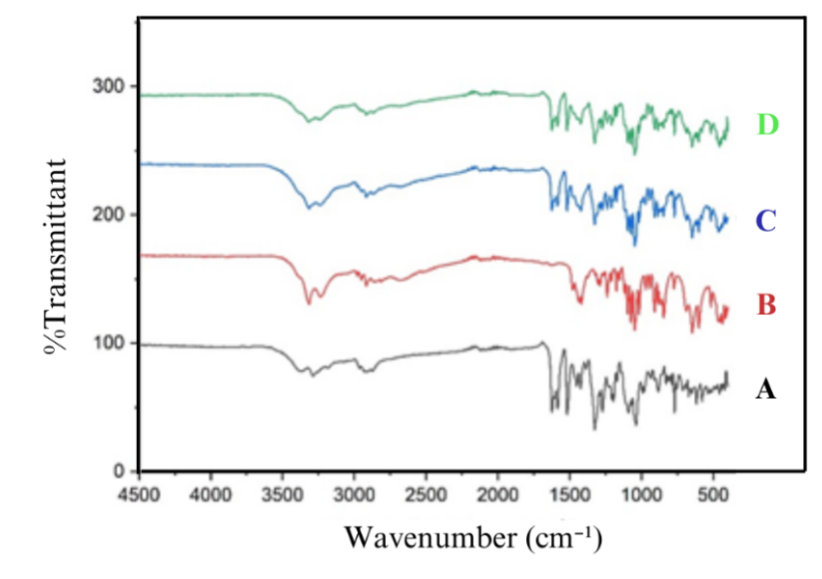
Fig. 5: FTIR spectra of (A) TICA, (B) MEG, (C) TICA-MEG 4:6 and (D) physical mixture
C-O bond strain at wave numbers 1275-1500 cm-1, in TICA 1452.04 cm-1, MEG 1479.4 cm-1, physical mixture 1450.47 cm-1 and multicomponent crystal TICA-MEG 1423.47 cm-1. O-H bond strain at wave numbers 3500-2500 cm-1, in TICA 3288.53 cm-1, MEG 3238.48 cm-1 and in multicomponent crystal TICA-MEG 3248.13 cm-1. Some studies suggest that a slight shift in wave numbers indicates the presence of weak hydrogen bonds [29].
Scanning electron microscopy (SEM) analysis
Morphological analysis using SEM was performed on TICA, MEG, eutectic mixture TICA-MEG and physical mixture TICA-MEG at 4000 times magnification. The result of SEM analysis showed the morphology of TICA and MEG, as seen in fig. 6A and fig. 6B, the shape showed an irregular crystal surface of TICA and MEG. TICA shows crystal morphology in the form of small particles aggregating with each other while MEG shows crystal morphology that tends to be single, irregularly shaped like flakes.
In the physical mixture of TICA-MEG (fig. 6C) an aggregate between TICA and MEG which is characterized by the visible intact crystal habit which is quite clear. In the eutectic mixture of TICA-MEG, the aggregate size is smaller and the MEG crystal habit is not significant compared to TICA. In addition, fig. 6D also shows aggregate between TICA and MEG that are not completely mixed but have smaller particle size than the physical mixture of TICA-MEG. This change in particle size can occur due to the pressure in the grinding process during the formation of multicomponent TICA-MEG crystals [27].
Table 2: Comparison number wave numbers FTIR TICA, MEG, TICA-MEG multicomponent and physical mixture
| Functional group | Wave numbers (cm-1) | |||
| TICA | MEG | TICA-MEG | Physical mixture | |
| N-H/O-H | 3288.63 | 3238.48 | 3248.13 | 3244.27 |
| C-N | 1624.06 | 1687.71 | 1624.04 | 1624.06 |
| C-O | 1452.04 | 1479.4 | 1423.47 | 1450.47 |
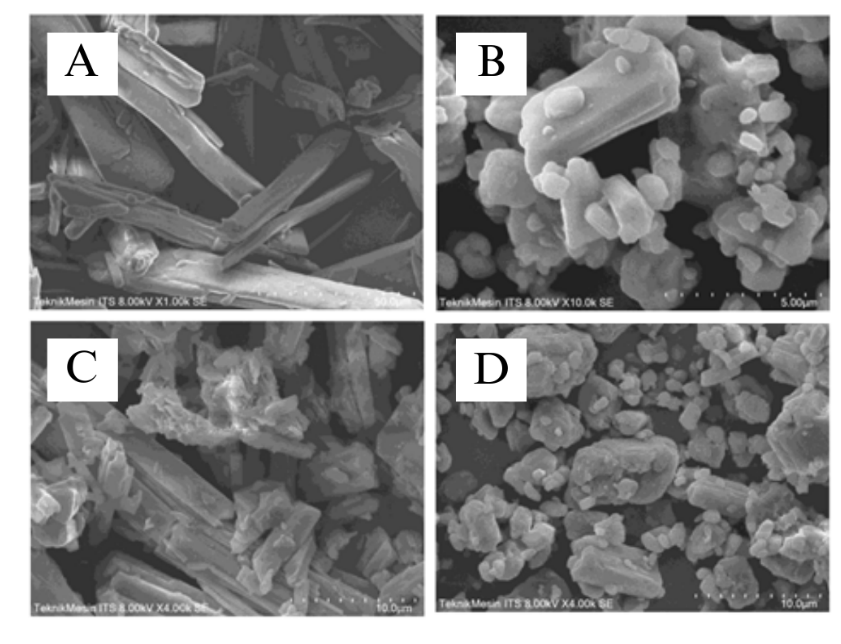
Fig. 6: Characterization of particle shape using SEM. A MEG, B TICA, C TICA-MEG physical mixture, and D TICA-MEG eutectic mixture
Solubility test
Linearity test was carried out using intact TICA analyte solutions with concentrations 10, 15, 20, 25 and 30 μg/ml in distilled water. Furthermore, absorbance measurements were made at a maximum wavelength 220 nm. From the calibration curve y = 0.0278x-0.053 was obtained, r = 0.999. These results shows that the correlation coefficient value meets the acceptance requirements so it can be concluded that the TICA calibration provides a good linearity value.
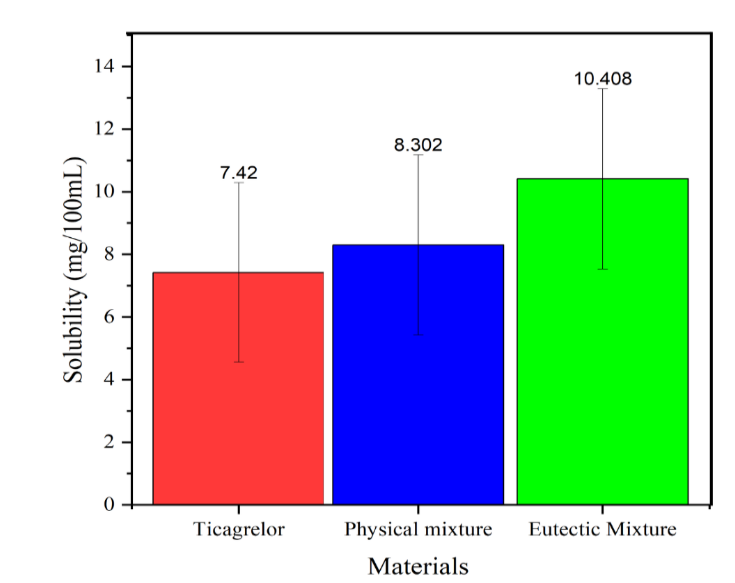
Fig. 7: Solubility histogram of TICA, physical mixture and eutectic mixture
Solubility histogram of TICA, physical mixture, and eutectic mixture, illustrating solubility variations among the formulations. Data are presented as mean±SD (0.00208), with n=3 for each measurement.
The increase in solubility of TICA in the physical mixture and eutectic mixture was 1.12 and 1.40 times. From the solubility data, it can be seen that the eutectic mixture has a higher solubility compared to intact TICA and the physical mixture; the increase in solubility between the eutectic mixture compared to the physical mixture of TICA-MEG is 1.23 times higher, as shown in fig. 7 and table 3. The increase in solubility is corroborated by DSC and PXRD analysis, which demonstrate the lowest melting point for the eutectic mixture compared to intact TICA. The reduced melting point indicates a decrease in lattice energy, facilitating the dissolution of particles in water [20]. The enhanced dissolution rate is attributed to the less rigid crystalline nature of the eutectic mixture system. This weaker crystalline structure results from the molecular arrangement of the components, which exhibit a heterogeneous and less densely packed structural organization. Consequently, the eutectic mixture experiences minimal lattice interactions, reducing barriers to dissolution and contributing to improved thermodynamic properties [21].
Table 3: Solubility averages of TICA, physical mixture and eutectic mixture
| Sample | Average of soluble TICA (%) | Solubility improvement | Standard deviation |
| TICA | 7.420 | - | 0.00208 |
| Physical mixture | 8.302 | 1.12 times | 0.00208 |
| Eutectic mixture | 10.408 | 1.40 times | 0.00208 |
Solubility values are expressed as mean±SD (0.00208), n=3. The eutectic mixture showed the highest solubility, demonstrating a significant improvement compared to TICA and the physical mixture.
Solubility tests were confirmed to meet the assumptions of homogeneity and normality, as determined using SPSS (p>0.05). Subsequently, a one-way ANOVA was conducted to assess the effect of the eutectic mixture on the solubility enhancement of TICA. The statistical analysis demonstrated a highly significant result, with a p-value of 0.001 and an F-value of 102973.483, indicating that the TICA-MEG eutectic mixture significantly enhanced the solubility of TICA. Post-hoc analysis using Tukey HSD revealed significant pairwise differences in solubility between all groups (p<0.05). The eutectic mixture exhibited a significantly higher solubility compared to intact TICA (mean difference = 2.988±0.007 mg/ml, p<0.001) and the physical mixture (mean difference = 2.096±0.007 mg/ml, p<0.001). Similarly, the physical mixture showed significantly higher solubility than intact TICA (mean difference = 0.893±0.007 mg/ml, p<0.001). These findings further substantiate the solubility enhancement provided by the eutectic system, which outperforms both the physical mixture and the intact drug in aqueous environments.
Dissolution rate profile
Dissolution tests were conducted using 0.1 N HCl medium and CO2-free aquadest because 70% of the adult human body composition consists of water [30]. Determination of linearity and calibration curves were carried out using an intact TICA analyte in 0.1 N HCl medium. The concentrations of the series solution tested in the preparation of calibration curves were 20, 25, 30, 35 and 40 μg/ml. Absorbance measurements were taken at the maximum wavelength, 298 nm where y = 0.00111x+0.019 with r = 0.998. These results indicate that the correlation coefficient value meets the acceptance requirements so it can be concluded that the TICA calibration provides a good linearity value.
One of the important properties in developing and designing quality solid dosage forms is the dissolution rate profile of API in gastrointestinal fluids. Dissolution rate is the slowest stage in the absorption process for poorly soluble drug substances classified into BCS class II and IV systems. The dissolution rate is influenced by several factors, such as the physicochemical properties and formulation of the dosage form, including stirring speed, test temperature, viscosity, pH, composition of the dissolution medium, and the presence or absence of wetting agents. For more reproducible results, the pharmaceutical industry prefers to modify the dissolution rate with a physicochemical properties approach [31, 32].
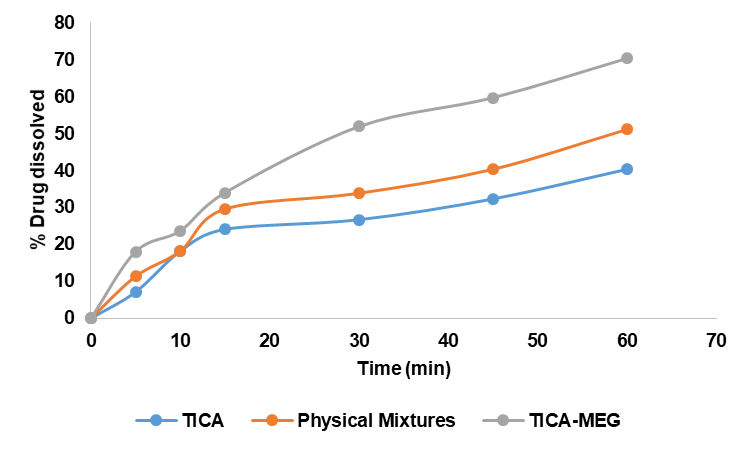
Fig. 8: Percentage of dissolution rate of TICA, physical mixture and eutectic mixture in 0.1 N HCl medium
Dissolution rate data in 0.1 N HCl and CO₂-free aquadest were analyzed using SPSS, confirming normality and homogeneity (p>0.05). Two-way ANOVA showed a significant effect of the TICA-MEG eutectic mixture on TICA dissolution, with a notable interaction between sample type and time. Data represent dissolution profiles of TICA, physical mixture, and eutectic mixture in 0.1 N HCl medium (n=3).
Based on the dissolution results in fig. 8 and fig. 9, showed that the eutectic mixture has a fast dissolution rate, both in 0.1 N HCl medium and CO2-free aquadest medium due to its high internal energy so that the particles interact more easily with water molecules and cause an increase in its solubility in water. Preparations whose solubility is high, the speed of dissolution of the active substance from the dosage form will be faster, on the other hand, preparations whose solubility is low, the speed of dissolution of the active substance from the dosage form will be slower [33]. Molecular proportions play an important role in the stability of a preparation and a molar ratio of 1:1 usually shows optimal physical stability due to the large number of specific intermolecular interactions with the formation of heterodimers through hydrogen bonds [34].
Dissolution rate in 0.1 N HCl medium and CO2-free aquadest were declared homogeneous and normally distributed tested using SPSS with p>0.05. The dissolution test data were processed by two-way ANOVA statistic test to see the effect of time and eutectic mixture on TICA dissolution rate results. The statistical data showed that the TICA-MEG eutectic mixture influenced the dissolution rate of TICA significantly. Furthermore, a significant difference between the time and the percentage dissolved. The statistical data also shows the relationship between sample and time to the percentage dissolved. The statistical results show that there is a relationship between sample and time in influencing the percentage dissolved.
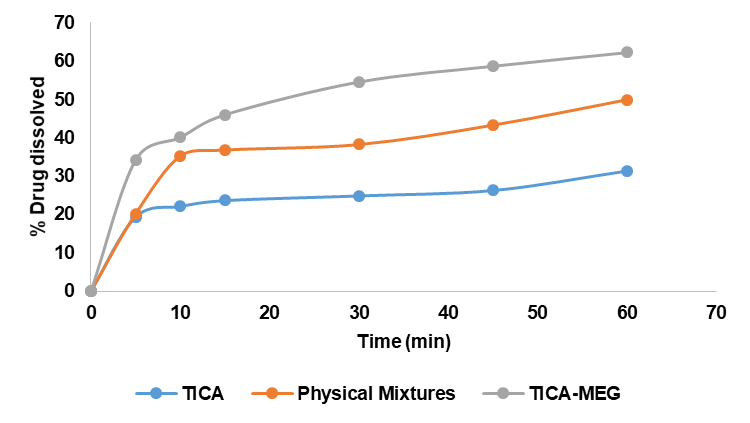
Fig. 9: Percentage of dissolution rate of TICA, physical mixture and eutectic mixture in CO2-free aquadest medium, dissolution profiles of TICA, physical mixture, and eutectic mixture in CO₂-free aquadest medium (n=3)
Dissolution efficiency is a parameter used to determine the AUC (area under curve) value of the amount of drug dissolved per unit time; as in BA/BE studies this value can be guided to compare the amount and rate of drugs in general. Table 4 shows that the average of percentage efficiency of TICA in 0.1 N HCl medium for pure TICA, physical mixture and eutectic mixture were 10.72%, 13.26% and 18.56%, respectively. While in CO2-free aquadest medium, the efficiency of intact TICA, physical mixture and eutectic mixture were 11.01%, 16.81% and 22.07%, respectively. Dissolution efficiency of Tica, physical mixture and eutectic mixture showed that the multicomponent TICA-MEG crystals and eutectic mixture affected the dissolution efficiency of TICA significantly (p<0.05).
Table 4: Percentage averages of dissolution efficiency of intact TICA, physical mixture and eutectic mixture in 0.1 N HCl medium and CO2-free aquadest medium
| Sample | Dissolution efficiency percentages (%)±SD | |
| HCl 0,1 N | CO2-free aquadest | |
| TICA | 10.72±0.001 | 11.01±0.012 |
| Physical mixture | 13.26±0.022 | 16.81±0.022 |
| Eutectic mixture | 18.56±0.029 | 22.07±0.008 |
Dissolution efficiency percentages (%DE) were calculated for TICA, physical mixture, and eutectic mixture in 0.1 N HCl and CO₂-free aquadest media. Data represent the average of three measurements (n=3).
The kinetics of drug release from a dissolution test is important to determine the release model of the active substance from a preparation. Determination of the TICA kinetic of release model has been carried out based on the zero-order, first-order, Higuchi, and Korsmeyer-Peppas equations. The zero-order equation is a linear relationship between the amount of drug dissolved and time, while the first-order equation represents the linear relationship between the logarithm of the amount of drug dissolved and time. The Higuchi equation describes a linear relationship between the amount of drug dissolved and the square root of time, which typically indicates drug diffusion through the matrix [35]. According to Lapidus and Lordi [36], drug release is controlled by matrix erosion when the relationship between the amount of drug dissolved and time is linear. Conversely, when the relationship between the amount of drug dissolved and the square root of time is linear, the release is governed by drug diffusion through the matrix.
Based on the dissolution test results, it was found that TICA, the TICA-MEG eutectic mixture, and the physical mixture followed the Korsmeyer-Peppas kinetic model of release in 0.1 N HCl medium and the Higuchi kinetic model in CO2-free aquadest, both showing correlation coefficient values close to 1. This suggests that the release of TICA in the acidic medium occurs predominantly through a combination of diffusion and erosion mechanisms, while in CO2-free aquadest, drug release is diffusion-controlled through the matrix. The Korsmeyer-Peppas model was specifically developed to describe drug release from polymeric or non-polymeric matrices [37]. The suitability of this model for TICA release indicates that the medium influences the kinetic behavior by affecting the matrix structure or the interactions between the drug and excipients. For example, the acidic environment of 0.1 N HCl may enhance erosion and diffusion due to partial matrix degradation or solubilization of the components, whereas CO2-free aquadest, with its near-neutral pH, primarily supports diffusion-controlled release. These findings highlight the importance of the dissolution medium in determining the dominant release mechanism and the kinetic model of drug release.
CONCLUSION
The multicomponent crystal between TICA-MEG is an eutectic mixture with a low melting point at 124.31 ℃ with 4:6 molar ratio and FTIR spectrum showed intramolecular interactions. The eutectic mixture can increase the solubility of TICA by 1.40 times compared to intact TICA; the dissolution rate increased by 1.73 times in CO2-free aquadest medium and 2 times in 0.1 N HCl medium. Furthermore, the development of multicomponent crystals, such as this TICA-MEG eutectic mixture, offers a promising strategy to address solubility challenges in poorly water-soluble drugs. By enhancing solubility and dissolution rates, this approach can facilitate the formulation of more effective pharmaceutical products and serve as a cost-effective solution to improve therapeutic outcomes.
ACKNOWLEDGMENT
Thank you to the Faculty of Pharmacy, Universitas Andalas, and Dwi Farma Pharmacy Academy for their support in providing research funding and instrumentation facilities, as well as to everyone who contributed to the research and preparation of this article.
AUTHORS CONTRIBUTIONS
Erizal Zaini and Salman Umar contributed to the conceptualization of the study, resource provision, and supervision. Ahdi Dinil Haq. Ah and Muhammad Nasrul Siregar were responsible for data curation and investigation. Formal analysis was conducted by Erizal Zaini, Salman Umar, Ahdi Dinil Haq. Ah, and Muhammad Nasrul Siregar, while validation was performed by Ahdi Dinil Haq. Ah, Erizal Zaini, and Muhammad Nasrul Siregar. The research methodology was developed by Ahdi Dinil Haq. Ah. Data visualization was carried out by Ahdi Dinil Haq. Ah and Muhammad Nasrul Siregar. The original draft of the manuscript was written by Erizal Zaini, Salman Umar, and Ahdi Dinil Haq. Ah, whereas the review and editing process was conducted by Erizal Zaini and Muhammad Nasrul Siregar.
CONFLICT OF INTERESTS
The authors declare no conflict of interest.
REFERENCES
Zaini E, Azhari D, Fitriani L. Identification and characterization of solid binary system of quercetin nicotinamide. Orient J Chem. 2016;32(3):1545-50. doi: 10.13005/ojc/320330.
Putra OD, Furuishi T, Yonemochi E, Terada K, Uekusa H. Drug-drug multicomponent crystals as an effective technique to overcome weaknesses in parent drugs. Cryst Growth Des. 2016;16(7):3577-81. doi: 10.1021/acs.cgd.6b00639.
Grothe E, Meekes H, Vlieg E, Ter Horst JH, DE Gelder R. Solvates salts and cocrystals: a proposal for a feasible classification system. Cryst Growth Des. 2016;16(6):3237-43. doi: 10.1021/acs.cgd.6b00200.
Guo M, Sun X, Chen J, Cai T. Pharmaceutical cocrystals: a review of preparations physicochemical properties and applications. Acta Pharm Sin B. 2021;11(8):2537-64. doi: 10.1016/j.apsb.2021.03.030, PMID 34522597.
Bayoumi AA. Enhancement of solubility of a poorly soluble antiplatelet aggregation drug by cogrinding technique. Asian J Pharm Clin Res. 2018;11(10). doi: 10.22159/ajpcr.2018.v11i10.27136.
Dobesh PP, Oestreich JH. Ticagrelor: pharmacokinetics pharmacodynamics clinical efficacy and safety. Pharmacotherapy. 2014;34(10):1077-90. doi: 10.1002/phar.1477, PMID 25164528.
Hamm CW, Bassand JP, Agewall S, Bax J, Boersma E, Bueno H. ESC guidelines for the management of acute coronary syndromes in patients presenting without persistent ST-segment elevation: the task force for the management of acute coronary syndromes (ACS) in patients presenting without persistent ST-segment elevation of the European society of cardiology (ESC). Eur Heart J. 2011;32(23):2999-3054. doi: 10.1093/eurheartj/ehr236, PMID 21873419.
Chaudhari S, Dhumal SV, Daswadkar, Shirode D. Study of formulation variables on bioavailability of metformin hydrochloride. Medicine Chemistry 2016;3(11):484-97.
Ashok KA, Wahid AA. Formulation development and absorption enhancement of metformin hydrochloride by using spray drying technique. SJIF J. 2021;2(5):1685-703. doi: 10.20959/wjpr202317-29690.
Manconi M, Nacher A, Merino V, Merino Sanjuan M, Manca ML, Mura C. Improving oral bioavailability and pharmacokinetics of liposomal metformin by glycerolphosphate chitosan microcomplexation. AAPS Pharm Sci Tech. 2013;14(2):485-96. doi: 10.1208/s12249-013-9926-4, PMID 23471836.
Kumar A, Bansal M. Formulation and evaluation of antidiabetic tablets: effect of absorption enhancer. SJIF J. 2021;2(5):1685-703. doi: 10.20959/wjpr202317-29690.
Adimulapu AK, Srinivasa Rao NS, Anusha A, Banusha S, Akhila V. Formulation development and oral permeability of metformin HCl under the influence of permeability enhancers. Res J Pharm Technol. 2024;17(7):3209-12. doi: 10.52711/0974-360X.2024.00502.
Docherty R, Pencheva K, Abramov YA. Low solubility in drug development: de-convoluting the relative importance of solvation and crystal packing. J Pharm Pharmacol. 2015;67(6):847-56. doi: 10.1111/jphp.12393, PMID 25880016.
Haneef J, Arora P, Chadha R. Implication of coformer structural diversity on cocrystallization outcomes of telmisartan with improved biopharmaceutical performance. AAPS Pharm Sci Tech. 2019;21(1):10. doi: 10.1208/s12249-019-1559-9, PMID 31802267.
Shane NL, Chamle AH, Vasantharaju V, Pai A, Pai G, Sathyanarayana MB. Fabrication and solid state characterization of ticagrelor co-crystals with improved solubility and dissolution. Int J Pharm Qual Assur. 2017;8(1):1-8. doi: 10.25258/ijpqa.v8i1.8433.
Shane, Pai, Pai, Pai V SG, Sathyanarayana. Solubility enhancement of ticagrelor by co-crystal technology: preparation solid-state characterization and solubility studies. Lat Am J Pharm. 2019;38(10):2051-6.
Inam M, WU J, Shen J, Phan CU, Tang G, HU X. Preparation and characterization of novel pharmaceutical co-crystals: ticagrelor with nicotinamide. Crystals. 2018;8(9):336. doi: 10.3390/cryst8090336.
Erizal SY, Cahyati SY, Nurono SS, Halim A. Effect of milling on solid-state transformation of sulfamethoxazole. Int J Pharmacol. 2008;4(2):140-4. doi: 10.3923/ijp.2008.140.144.
Fitriani L, Fadina H, Usman H, Zaini E. Formation and characterization of multicomponent crystal of trimethoprim and mandelic acid by solvent drop grinding method. Int J App Pharm. 2023;15(1):75-9. doi: 10.22159/ijap.2023.v15s1.06.
Zaini E, Fitriani L, Effendy S, Noviza D, Halim A. Preparation and characterization of solid dispersion telmisartan hydroxypropyl methylcellulose (HPMC) e5 lv by co-grinding method. Orient J Chem. 2017;33(2):873-8. doi: 10.13005/ojc/330236.
Fandaruff C, Quiros Fallas MI, Vega Baudrit JR, Navarro Hoyos M, Lamas DG, Araya Sibaja AM. Saquinavir piperine eutectic mixture: preparation characterization and dissolution profile. Pharmaceutics. 2023;15(10):2446. doi: 10.3390/pharmaceutics15102446, PMID 37896206.
Hasanah U, Azfitri Y, Fitriani L, Zaini E. Tenoxicam tromethamine multicomponent crystal: physicochemical characteristics solubility and dissolution evaluation. Int J App Pharm. 2024;16(1):23-7. doi: 10.22159/ijap.2024.v16s1.04.
Martin AN, Sinko PJ, Singh Y. Martins physical pharmacy and pharmaceutical sciences. 6th editio. Philadelphia: Lippincott Williams & Wilkins; 2011.
Gorniak A, Wojakowska A, Karolewicz B, Pluta J. Phase diagram and dissolution studies of the fenofibrate acetylsalicylic acid system. J Therm Anal Calorim. 2011;104(3):1195-200. doi: 10.1007/s10973-010-1148-3.
Umar S, Putri N, Deni B, Erizal A. Multicomponent crystal of fenofibric acid-saccharin: characterization and antihyperlipidemic effectiveness. Adv Heal Sci Res. doi: 10.2991/ahsr.k.211105.015.
Dwichandra Putra O, Yonemochi E, Uekusa H. Isostructural multicomponent gliclazide crystals with improved solubility. Cryst Growth Des. 2016;16(11):6568-73. doi: 10.1021/acs.cgd.6b01279.
Ainurofiq A, Mauludin R, Mudhakir D, Setianto AB, Soewandhi SN. The effect of compression force on alteration of desloratadine and its multicomponent crystal crystallinities using x-ray diffraction and atr-ftir techniques. Key Eng Mater. 2018;787:43-51. doi: 10.4028/www.scientific.net/KEM.787.43.
Sarma JA, Desiraju GR. The supramolecular synthon approach to crystal structure prediction. Cryst Growth Des. 2002;2(2):93-100. doi: 10.1021/cg015576u.
Bazzo GC, Pezzini BR, Stulzer HK. Eutectic mixtures as an approach to enhance solubility dissolution rate and oral bioavailability of poorly water-soluble drugs. Int J Pharm. 2020 Aug;588:119741. doi: 10.1016/j.ijpharm.2020.119741, PMID 32783978.
Munteanu C, Teoibas Serban D, Iordache L, Balaurea M, Blendea CD. Water intake meets the water from inside the human body physiological, cultural and health perspectives synthetic and systematic literature review. Balneo and PRM Research Journal. 2021;12(3):196-209. doi: 10.12680/balneo.2021.439.
Douroumis D, Fahr A. Drug delivery strategies for poorly water-soluble drugs. Drug Deliv. 2013:403-16. doi: 10.1002/9781118444726.
Fitriani L, Rismawati E, Umar S, Zaini E. Solid dispersion of usnic acid-PVP K30 and evaluation of antioxidant activity. Rasayan J Chem. 2018;11(4):1643-8. doi: 10.31788/RJC.2018.1144076.
Petersen EF, Larsen BS, Nielsen RB, Pijpers I, Versweyveld D, Holm R. Co-release of paclitaxel and encequidar from amorphous solid dispersions increase oral paclitaxel bioavailability in rats. Int J Pharm. 2024;654:123965. doi: 10.1016/j.ijpharm.2024.123965, PMID 38442796.
Saikia B, Seidel Morgenstern A, Lorenz H. Multicomponent materials to improve solubility: eutectics of drug aminoglutethimide. Crystals. 2021;12(1):40. doi: 10.3390/cryst12010040.
Higuchi T. Mechanism of sustained action medication. Theoretical analysis of rate of release of solid drugs dispersed in solid matrices. J Pharm Sci. 1963;52(12):1145-9. doi: 10.1002/jps.2600521210, PMID 14088963.
Lapidus H, Lordi NG. Drug release from compressed hydrophilic matrices. J Pharm Sci. 1968;57(8):1292-301. doi: 10.1002/jps.2600570803, PMID 5677330.
Samaha D, Shehayeb R, Kyriacos S. Modeling and comparison of dissolution profiles of diltiazem modified release formulations. Dissolution Technol. 2009;16(2):41-6. doi: 10.14227/DT160209P41.