
Int J App Pharm, Vol 17, Issue 4, 2025, 370-386Original Article
DEVELOPMENT AND VALIDATION OF A GRADIENT PROGRAM RP-HPLC METHOD FOR ESTIMATION OF MULTIPLE ACTIVE PHARMACEUTICAL INGREDIENTS IN AN ORAL SUSPENSION TASTE MASKED WITH AN ION EXCHANGE RESIN
ROBINDRA K. PANDIT, VIVEK PANDEY*
Department of Chemistry, School for Chemical Engineering and Physical Sciences, Lovely Professional University, Phagwara, Punjab, India
*Corresponding author: Vivek Pandey; *Email: vivekpandey11sep@gmail.com
Received: 29 Dec 2024, Revised and Accepted: 24 Apr 2025
ABSTRACT
Objective: This study focuses on developing an effective Reverse Phase High-Performance Liquid Chromatography (RP-HPLC) method for the simultaneous analysis of Dextromethorphan Hydrobromide (DXM), Phenylephrine Hydrochloride (PEH), and Chlorpheniramine Maleate (CPM) in a taste-masked oral suspension. The method ensures rapid, precise, and accurate quantification of these Active Pharmaceutical Ingredients (APIs) while supporting formulation stability and regulatory compliance.
Methods: A gradient High-Performance Liquid Chromatography (HPLC) method with a short 7.5-minute run time was optimized for the simultaneous analysis of DXM, PEH, and CPM in a complex suspension matrix. The taste masking was achieved using Indion 254 ion exchange resin, and its impact on drug release and assay accuracy was evaluated. Key method parameters, including resolution, plate count, and tailing factor, were optimized to ensure robust performance. The method was validated according to International Council for Harmonisation (ICH) guidelines, assessing specificity, precision, accuracy, and stability.
Results: The developed DXM, PEH, and CPM method demonstrated excellent specificity, with no interference from the resin, excipients, or degradation products. Resolution values of more than 1.5 between ICH exceeded acceptance criteria, with plate counts more than 1500 and tailing factors within below 2. The method proved highly precise, with Relative Standard Deviation (RSD) values below 1%. It also ensured reliable quantification of Active Pharmaceutical Ingredients (APIs) in the presence of the taste-masking resin and under various stress conditions, confirming formulation stability.
Conclusion: The developed HPLC method provides a rapid, precise, and reliable solution for analyzing APIs in a taste-masked oral suspension. Its efficiency and compliance with ICH guidelines make it a valuable tool for quality control, ensuring formulation consistency and patient safety.
Keywords: ICH, BAGI, Development, Validation of reverse phase high-performance liquid chromatography (RP-HPLC), Assay, ICH guidelines, Dextromethorphan hydrobromide (DMH), Phenylephrine hydrochloride (PEH), Chlorpheniramine maleate (CPM), Ion exchange resin (IER), Blue applicability grade index (BAGI) and Oral suspension
© 2025 The Authors. Published by Innovare Academic Sciences Pvt Ltd. This is an open access article under the CC BY license (https://creativecommons.org/licenses/by/4.0/)
DOI: https://dx.doi.org/10.22159/ijap.2025v17i4.53547 Journal homepage: https://innovareacademics.in/journals/index.php/ijap
INTRODUCTION
Simultaneous drug analysis presents considerable challenges due to differences in solubility, retention behaviour, and detector response of multiple Active Pharmaceutical Ingredients (APIs). Developing a robust Reverse-Phase High-Performance Liquid Chromatography (RP-HPLC) gradient method for Dextromethorphan Hydrobromide (DXM), Phenylephrine Hydrochloride (PEH), and Chlorpheniramine Maleate (CPM) in an oral suspension necessitates precise optimization to ensure resolution and accuracy. Taste-masking with ion exchange resins further complicates quantification by altering drug release and matrix composition. This study focuses on method development and validation, ensuring specificity, precision, and reproducibility to enable accurate estimation of APIs in a taste-masked formulation, thereby improving patient compliance [1-6].
Analyzing oral suspensions using High-Performance Liquid Chromatography (HPLC) involves significant technical challenges, including ensuring homogeneity and complete dissolution of APIs and excipients to prevent inconsistent results or system clogging. Sample filtration must be handled carefully to avoid analyte loss [7]. Selecting an appropriate mobile phase and HPLC column is critical to achieving effective resolution without inducing precipitation. Stability concerns arise due to APIs excipient interactions and degradation under analytical conditions [8-12]. Separating DXM, PEH and CPM, which exhibit varying polarities, requires careful optimization. A major challenge is achieving sufficient resolution, particularly between DXM and CPM, which may have overlapping retention times [13-18]. This can be mitigated by fine-tuning the mobile phase composition and employing a gradient elution approach using acetonitrile and water at specific pH values [19-23]. Additionally, since APIs may absorb UV light at different wavelengths, a Photodiode Array Detector (PDA) detector is crucial for comprehensive spectral analysis [24-27].
Excipients in oral suspensions can interfere with analyte peaks, necessitating optimization of sample preparation steps, such as filtration or dilution, to minimize interference and ensure accurate quantification [28-32]. Method validation, including linearity, accuracy, precision, and robustness, is essential for regulatory compliance and routine quality control [33-37]. Advances in analytical techniques, such as Ultra-Performance Liquid Chromatography (UPLC), have enhanced precision and efficiency, but rigorous validation is necessary to meet regulatory standards [38-41].
Oral suspensions are preferred for pediatric and geriatric patients due to ease of administration; however, the unpleasant taste of many APIs poses a significant barrier to compliance. Taste masking is critical in ensuring treatment adherence, with techniques including flavoring agents, coatings, and microencapsulation [42-46]. Ion Exchange Resins (IERs) have emerged as a superior approach by forming tasteless drug-resin complexes that sequester the bitter drug from taste receptors [47-50]. Compared to flavoring agents, which may lose effectiveness over time, and encapsulation techniques, which can alter drug release profiles, IERs provide a more reliable and stable solution [51-54].
The International Council for Harmonisation (ICH) guidelines outline key validation parameters such as specificity, linearity, accuracy, precision, detection limit, quantitation limit, robustness, and system suitability [55-68]. Adhering to these guidelines ensures the reliability and reproducibility of analytical methods, enabling their application in routine quality control laboratories [69-72]. This study aims to develop and validate a novel analytical method for the rapid simultaneous quantification of DXM, PEH, and CPM in oral suspensions while incorporating ion exchange resins for effective taste masking. By integrating advanced analytical techniques, this research addresses the critical need for efficient, accurate, and regulatory-compliant methods for multi-drug formulations, ultimately improving therapeutic outcomes and patient compliance [73-84].
MATERIALS AND METHODS
Materials: chemicals and solvents
Methanol of HPLC-grade (Purity>99 %, Make: Rankem, Jaipur, India), Acetonitrile of HPLC-grade. (Purity>99 %, Make: Rankem, Jaipur, India), Potassium Nitrate of Analytical Reagent (AR) grade. (Purity 99.4 %, Make: Merck, Yingfengyuan, China), Ammonium Dihydrogen Phosphate (Purity 99.0 %, Make: Qualigen, Maharashtra, India), Water of HPLC grade (source: Mill-Q water system, Billerica, USA), Ortho-phosphoric Acid of AR grade (Purity 99.0 %, Make: Qualigen, Maharashtra, India) and Concentrated Hydrochloric acid (>37 % of Qualigen make). Ion-exchange resin gifted by Ion Exchange (India). All reagents were of analytical or HPLC grade to ensure purity and minimize interference. Pharmacopeial-grade standards were used, with impurity profiling verified through blank and placebo analyses. Reagent purity was monitored, and potential degradation products were assessed to enhance method reliability and ensure accurate estimation of the active pharmaceutical ingredients.
Reference used
Primary working standard of DMH, PEH of CPM with all>99 % purity was gifted by ADPL.
Instrumentation and software
Chromatographic analytical performed in RP-HPLC of Make: Shimadzu with Ultraviolet-Visible (UV)-Visible Detector and Autosampler (Model: LC-2050C, Japan) with software used is LabSolutions and another HPLC of Make: Waters with PDA Detector and Autosampler (Model: ARC HPLC, USA) with software used is Empower version 03. HPLC column used of Agilent make having dimension 150 mm length 4.6 mm inner diameter, particle size 5 µm (Agilent Zorbax, C18, 150 mm length, 4.6 mm inner diameter, 5 µ of particle size), Ultra-sonic Cleaner (Make: PCI), analytical Balance of Make: Radwag (Model: AS 120. X2 PLUS), pH Meter of make Spectra lab (Model: Accu pH-3). Regular maintenance and calibration of HPLC systems, including flow rate verification, detector wavelength accuracy, and column performance checks, ensure reproducibility. Routine calibration of balances and pH meter enhances the reliability of method validation for the simultaneous estimation of DXM, PEH, and CPM in the taste-masked oral suspension.
Oral suspension taken for analysis
Over-The-Counter (OTC) composition oral suspension having claim DMH 10 mg/5 ml, PEH 5 mg/5 ml and CPM 2 mg/5 ml, having taste masking with Indion-254 resin, was used for method development. The oral suspension used is composition details are shown in table 1 and table 2 shown some of the physical and chemical properties of used oral suspension.
Method
Optimization of the mobile phase is a critical aspect in chromatographic techniques, particularly in liquid chromatography. The mobile phase, often a solvent or a mixture of solvents, plays a pivotal role in the separation of analytes within a sample. Efficient optimization involves fine-tuning various parameters such as solvent composition, pH, and flow rate to achieve optimal chromatographic performance. The selection of an appropriate mobile phase is influenced by the nature of the analytes and the stationary phase. The aim is to strike a balance between factors like resolution, sensitivity, and analysis time. Additionally, optimization helps to enhance the method's robustness and reproducibility. Careful consideration of the mobile phase ensures the accuracy and reliability of analytical results, making it an indispensable step in achieving successful chromatographic separations for diverse applications in fields ranging from pharmaceuticals to environmental analysis.
Table 1: IER taste-masked oral suspension composition
| S. No. | Ingredients | Function | Amount used for 100 ml | UOM |
| 1 | Dextromethorphan Hbr | API | 200 | mg |
| 2 | Chlorpheniramine Maleate | API | 40 | mg |
| 3 | Phenylephrine Hcl | API | 100 | mg |
| 4 | Sucrose | Excipient | 30 | gm |
| 5 | Sorbitol Solution 70% Non-Crystallising | Excipient | 5 | gm |
| 6 | Propylene Glycol | Excipient | 2 | gm |
| 7 | Methyl Paraben | Excipient | 180 | mg |
| 8 | Propyl Paraben | Excipient | 20 | mg |
| 9 | Di-Sodium edetate | Excipient | 50 | mg |
| 10 | Col. Brilliant Blue FCF | Colour | 660 | mg |
| 11 | Flv. Raspberry | Flavour | 200 | mg |
| 12 | Indion-254 | Ion Exchange Resin | 500 | mg |
Table 2: Basis parameters observed of oral suspension
| S. No. | Parameters observed | Results |
| 1 | Colour | Brownness Blue |
| 2 | pH Value | 6.58 |
| 3 | Wt. per ml (gm/ml) | 1.124 |
| 4 | Particle Size (microns) | 142 |
| 5 | Taste | No-Bitter |
Study of solubility
From the solubility study, it was found that Dextromethorphan HBr, Phenylephrine Hcl, and Chlorpheniramine Maleate are freely soluble in water and diluent (water and Acetonitrile 60:40). Therefore, diluent (water and Acetonitrile 60:40) was choice as the diluent for the preparation of solution of reference and test solution.
Wavelength selection
All three APIs DMH, PEH and CPM were scan with UV spectrophotometer and found a common absorbance maximum at 265 nm. Hence, the 265 nm wavelength is used for development and validation of assay method.
Chromatographic condition
Mobile phase composition
The mobile phase composition significantly influences APIs separation and resolution in RP-HPLC. pH affects ionization, retention time, and peak shape, impacting DXM, PEH, and CPM resolution. Buffer capacity was validated to ensure consistency, preventing pH fluctuations that could alter selectivity and reproducibility, thereby enhancing method robustness and accuracy. A shorter column (50 mm) reduces run time but requires careful selection of gradient conditions to maintain resolution. By adjusting the organic phase ratio and buffer strength, we ensured proper separation of DXM, PEH, and CPM. The optimized gradient elution enabled peak resolutions within 7.5 min while maintaining system suitability parameters, including retention time consistency, peak symmetry, and resolution, are shown in table 3.
Table 3: Chromatographic conditions
| Stationary phase (HPLC-Column) | GL Science, C18, 50 mm length 4.6 mm of inner diameter, 3.5µ of particle size |
| Mobile phase | Gradient Programming of Aqueous Phase (pH 3.0) and Acetonitrile. |
| Detection | 265 nm |
| Flow-Rate | 1.5 per min |
| Injection-volume | 20µl of injection |
| Column-temperature | 25 °C i.e. Ambient-Temperature |
| Run Time | 7.5 min |
| Diluent 1 | 60:40 ratio mixture of Water and Acetonitrile |
| Diluent 2 | 8.5 ml Conc. HCl diluted to 1 L with water (0.1N HCL) |
Table 4: Chromatographic programming
| Time (in min) | Flow rate (ml/min) | Aqueous phase (%) | Acetonitrile (%) |
| 0.01 | 1.5 | 95.00 | 5.00 |
| 4.50 | 1.5 | 50.00 | 50.0 |
| 5.50 | 1.5 | 95.00 | 5.00 |
| 7.50 | 1.5 | 95.00 | 5.00 |
Gradient programming used
The gradient programming followed are described in table 4.
Aqueous phase preparation
Buffer prepared by adding 1.15 g of Ammonium Dihydrogen phosphate and 5 g of Potassium Nitrate in 1000 ml of mill-Q water and pH adjusted to 3.0 with help of 10 % solution of Ortho-Phosphoric Acid (OPA).
Reference solution preparation
A. Reference solution was prepared by weighing 100 mg of PEH and 40 mg of CPM in 100 ml volumetric flask and added 30 ml diluent. Sonication was done up to dissolve and then makeup to the mark.
Reference solution was prepared be adding 50 mg DMH in 50 ml volumetric flask and added 30 ml diluent. Sonication was done up to dissolve and then makeup to the mark.
Further 5 ml of each A and B Reference solution diluted to 50 ml with diluent. Concentration obtained was DMH was 1000 mcg/ml, PEH was 100 mcg/ml of CPM was 40 mcg/ml.
Sample and placebo solution preparation
Sample and placebo preparation was begun by thoroughly shaking the suspension bottle to ensure uniform distribution of active ingredients and excipients. After well shaking, taken weight of an sample solution containing 4 mg of CPM (about 10 g) was taken into a 100 ml volumetric flask and 30 ml diluent 2 added and magnetic stirrers for 15 min and sonicated for 10 min for release of all APIs form ion exchange resin-API complex in acidic medium. After that diluted to mark with diluent 1 and filtered. The concentration obtained was same as standard solution i. e. Concentration obtained was DMH 1000 mcg/ml, PEH 100 mcg/ml of CPM 40 mcg/ml.
Placebo as prepared same as sample without active pharmaceuticals ingredient.
On HPLC; Injection volume of 20 µl was injected of a blank, placebo, five replicate of standard, one injection of test solution and one repeated of standard solution as bracketing std. Following system suitability parameters was complies as ICH guidelines [67, 68], which are shown in table 5 and the obtained retention times of all three components are shown in table 6.
Table 5: System suitability parameters maintained
| Parameters | Limit maintained |
| Relative Standard Deviation (RSD) for 5 replicate Std for each APIs | Not more than 2.0% |
| USP Tailing for PEH | Not more than 3.0 |
| USP Tailing for CPM | Not more than 3.0 |
| USP Tailing for DMH | Not more than 3.0 |
Table 6: Different retention time of components
| Compound name | Retention time in min |
| PEH | About 1.1 |
| CPM | About 3.5 |
| DMH | About 3.9 |
Validation
As per the ICH guidelines, for method validation of Assay method, parameters to be checked are Specificity, Accuracy (trueness), Precision (Repeatability and Intermediate), Linearity and Range [67, 68].
System suitability test
All above HPLC method was followed and Injection volume of 20 µl was injected of a blank, five replicate of standard was injected in liquid chromatography. Records of chromatograms and measures the responses for the major peaks.
Limit maintained
The RSD of area response of five replicate of standard solution should be not more than 2% and tailing factor should be not more than 3.0.
Specificity
APIs preparation at test concentration: API of DMH of 20 mg, PEH of 10 mg and of CPM of 4 mg were transfer to a 100 ml volumetric flask and added 60 ml diluent and sonicated for 10 min. The solution was allowed to stand at room temperature and diluted to make up the volume. Filter through 0.45 µm nylon membrane filter by discarding 1-2 ml of the filtrate.
Reference solution prepared as given under HPLC method. Separated inject 20µl were injected as starting from Blank (single), Placebo (single), API (single), reference (five), Test (single).
Peak purity analysis
Peak purity by Liquid chromatography software with PDA Detector the main peak in sample and reference preparation were calculated.
Precision
It is a measure of how close the data values are to each other for a number of determinations with same analytical method.
System precision
Injection of one blank and six replicate of reference solution were injected prepared under HPLC method.
Method precision
All preparation method was followed as given under HPLC method. Injection volume of 20 µl of blank Solution (in single), reference solution (five replicate), test solution of six samples prepared (each injected in duplicate) and a bracketing of reference solution was injected to insure the system suitability.
Intermediate precision
Second analyst repeated under intermediate precision with different instrument, analysis and day etc and will all preparation method be followed given under HPLC method.
Lower and higher precision
Standard preparation done to study lower precision at 50 % concentration and higher precision at 150 % concentration as per method given under HPLC method. Injection of 20 µl of the blank solution (in single), reference solution (five replicates), reference solution of 50 % concentration and reference solution of 150 % concentration (six replicates) into chromatography.
Linearity
In analytical method validation, linearity is a critical attribute that assesses the relationship between the concentration of an analyte in a sample and the corresponding measured response generated by the analytical method. It establishes the method's ability to produce results that are directly proportional to varying analyte concentrations within a specified range. This is typically evaluated by constructing a calibration curve through regression analysis, plotting the measured responses against known analyte concentrations. The linear range, determined by this curve, defines the concentration interval over which the method reliably demonstrates a linear relationship. Achieving linearity is essential for accurate quantification, ensuring that the method's response accurately reflects changes in analyte concentration.
Ability to obtain results that are directly proportional to analyte concentration in the sample. To obtain the linearity five different concentration solution i. e. 50 %, 80 %, 100 %, 120 % and 150 % were prepared by using method under HPLC method and injected separately.
Accuracy or trueness and recovery
To demonstrate the analytical method capability to yield data values close to true value. If it is accepted as a conventional true value then it is called as Accuracy or true value and if it is same as an accepted value and the value found then it is called as Recovery. For this, three different concentration test solutions having 50 %, 100 % and 150 % were prepared using placebo and of DMH, PEH and CPM references by following method given under HPLC method heading. Separately injected equal volumes of 20 µl of blank solution (single), reference solution in five replicate and test solutions in duplicate injection followed by a bracketing injection in chromatography.
Table 7: Small variation of different parameters during robustness
| Parameters | Variation made |
| Detection | 265 nm+2 nm i. e. at 263 and 267 nm |
| Flow Rate | 1.5 ml per minutes.+10% i. e. 1.35and 1.65 ml/min. |
| Column Temperature | 25 °C+5 °C i. e. (between 20 °C to 30 °C) |
| pH value of Mobile Phase (±0.2 % pH unit) | pH 3.0+0.2 i. e. at 2.8 to 3.2 |
| Mobile Phase Composition (±2 % Acetonitrile) | Composition of Acetonitrile+0.2 i. e. at 3 % to 7 % |
Separately inject of 20 µl volume were injected of blank (single) followed by reference solution (five replicate) at above condition in chromatography.
Robustness
Robustness test shows that the analytical method is capable to yield reproducibility results under small change in test method parameters during normal usage, such as column temperature, pH value, flow rate, mobile phase composition and wavelength. To evaluate the robustness, the following small variation done in the method used under HPLC method as shown in table 7.
Stability study of solution
The study of the stability of analytical solution was performed by preparing the reference solution and test solution. Analysis done from initial to 48 h of the preparation and results were calculated. All analysis done as given under HPLC method heading.
Bench top stability of reference and test solution: To establish the stability of analyte peak in reference solution (five replicates) and test solution (in duplicates) as per the test method given under HPLC method heading and keep it at bench top. Injection of reference solution and test solution done into HPLC at initial, 12, 24, 36 and 48 h.
Refrigerator stability of solution: Performed a study to establish the stability of analyte peak in reference solution (five replicates) and test solution (in duplicates) as per the test method given under HPLC method heading and kept in refrigerator. Injection of reference solution and test solution done into HPLC at initial, 4, 8, 12, 24, 36 and 48 h.
Study of Filter Paper and Centrifuge interferences: To study the filtration does affect the results of assay method, carried out filter variation on nylon membrane filter of 0.45 µm pore size, 0.45 µm Polyvinylidene Fluoride (PVDF filter) and centrifuge. Preparation of test and references done in triplicates as per procedure given under HPLC method heading. Centrifugation done for a portion of the test solution for 5 min at 3000 to 5000 RPM for triplicate samples and filter the portion of the test solutions through different filters. Injection injected of unfiltered reference preparation, centrifuged and filtered test preparation into chromatographic system as per test procedure.
RESULTS
System suitability test: Results observed are shown in table 8A, 8B and 8C and in fig. 1, 2, 3 and 4.
Peak purity
The peak purity results obtained for reference solution are shown in table 9 and fig. 5.
Precision
System precision: System precision results are given tables 8A, 8B and 8C.
Method precision: Recorded the response area as shown under system suitability test which showing all parameters complies under control as per ICH guidelines and results obtained are shown in table 10.
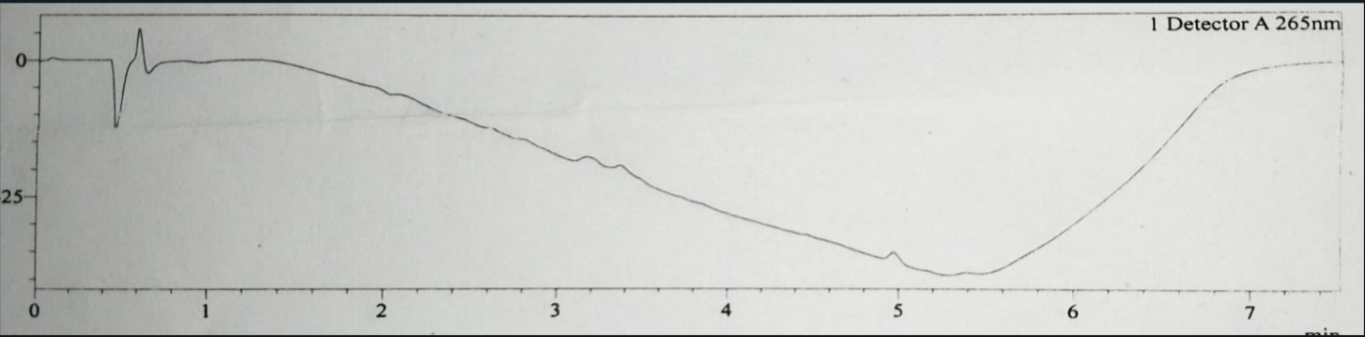
Fig. 1: Blank chromatogram of assay analysis injection
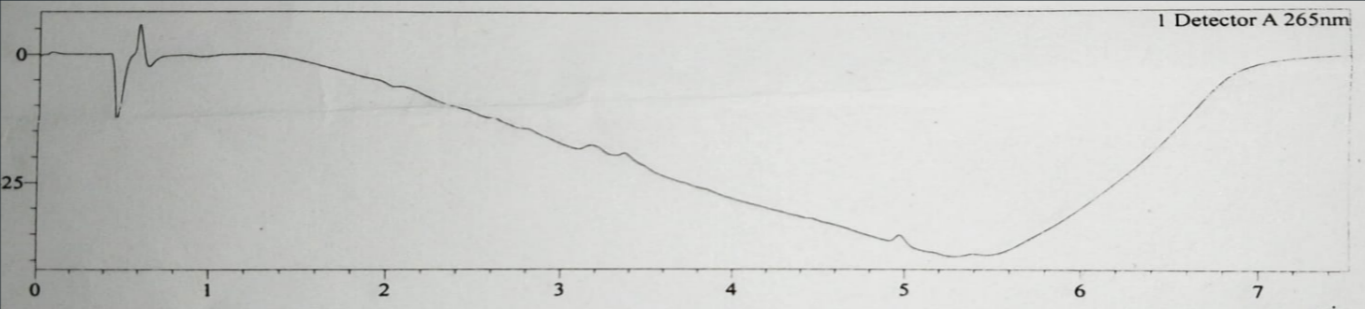
Fig. 2: Placebo chromatogram of assay analysis injection
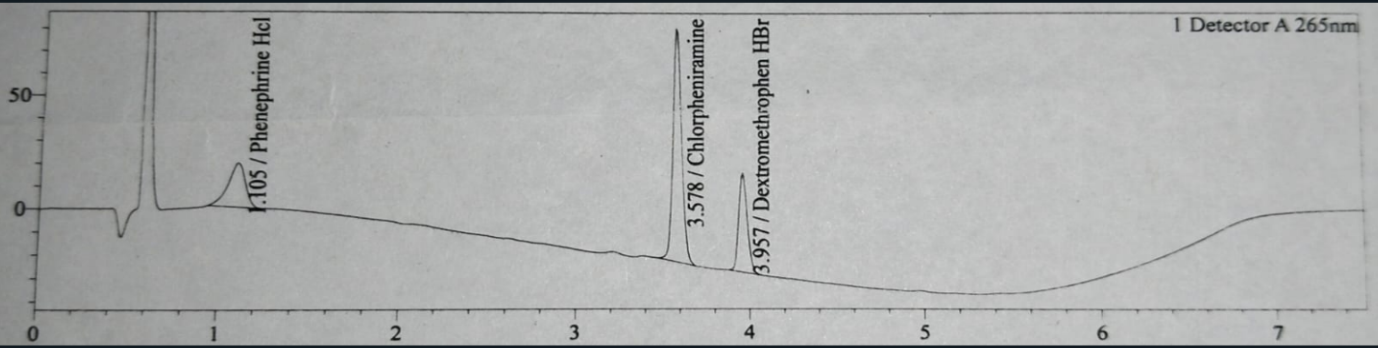
Fig. 3: Reference chromatogram of assay analysis injection
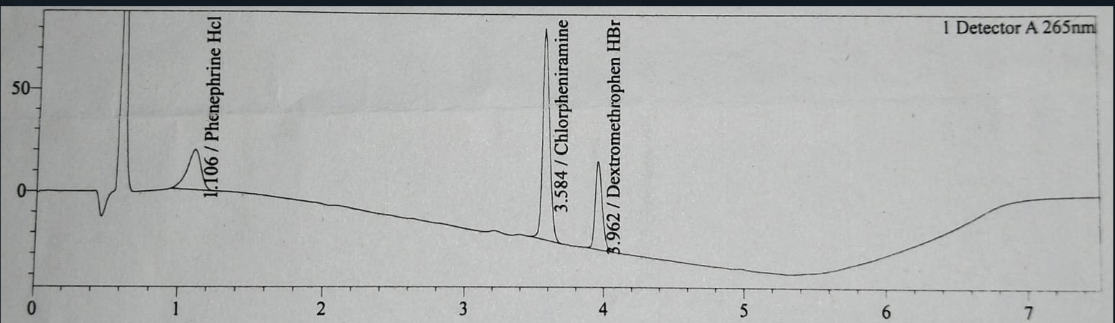
Fig. 4: Test chromatogram of assay analysis injection
Table 8A: DMH system suitability test results obtained while AMV
| S. No. | Area observed (mAU) | Retention time (min) | Tailing factor | USP plate count | USP resolution |
| 1 | 517390 | 3.962 | 1.12 | 19484.2 | 2.51 |
| 2 | 530687 | 3.952 | 1.12 | 18775.3 | 2.49 |
| 3 | 518413 | 3.914 | 1.12 | 18392.6 | 2.47 |
| 4 | 518831 | 3.945 | 1.12 | 18366.2 | 2.51 |
| 5 | 515007 | 3.940 | 1.12 | 18382.2 | 2.52 |
| 6 | 520014 | 3.949 | 1.13 | 18167.7 | 2.47 |
| Mean | 518390 | 3.932 | - | - | - |
| Std Dev. | 2027.546 | 0.063 | - | - | - |
| % RSD | 0.39 | 0.31 | - | - | - |
The results were reported as mean±SD (n = 6)
Table 8B: PEH system suitability test results obtained while AMV
| S. No. | Area observed (mAU) | Retention time (min) | Tailing factor | USP plate count | USP resolution |
| 1 | 696223 | 1.105 | 1.1 | 3695.6 | - |
| 2 | 696454 | 1.123 | 1.1 | 3755.0 | - |
| 3 | 695075 | 1.100 | 1.1 | 3866.0 | - |
| 4 | 692921 | 1.120 | 1.1 | 3847.7 | - |
| 5 | 698083 | 1.110 | 1.2 | 3982.6 | - |
| 6 | 701036 | 1.125 | 1.2 | 3918.2 | - |
| Mean | 696632 | 1.114 | - | - | - |
| Std Dev. | 2753.039 | 0.0103 | - | - | - |
| % RSD | 0.4 | 0.0093 | - | - | - |
The results were reported as mean±SD (n = 6)
Table 8C: CPM system suitability test results obtained while AMV
| S. No. | Area observed (mAU) | Retention time (min) | Tailing factor | USP plate count | USP resolution |
| 1 | 680732 | 3.542 | 1.1 | 30605.8 | 15.823 |
| 2 | 681017 | 3.548 | 1.2 | 29982.5 | 15.847 |
| 3 | 679129 | 3.540 | 1.0 | 29908.3 | 15.821 |
| 4 | 674637 | 3.550 | 1.2 | 30227.0 | 15.789 |
| 5 | 674285 | 3.487 | 1.1 | 19031.9 | 15.857 |
| 6 | 679942 | 3.457 | 1.1 | 19466.9 | 15.824 |
| Mean | 678340 | 3.521 | - | - | - |
| SD | 3059.353 | 0.0390 | - | - | - |
| % RSD | 0.45 | 0.0111 | - | - | - |
The results were reported as mean±SD (n = 6)
Table 9: Peak purity results while AMV
| Peak purity | DMH | PEH | CPM |
| Purity Angle | 15.134 | 12.808 | 33.441 |
| Purity Threshold | 18.676 | 16.800 | 90.000 |
Table 10: Method precision results while AMV
| S. No. | Components | Recovery % | ||||||||
| Sample 1 | Sample 2 | Sample 3 | Sample 4 | Sample 5 | Sample 6 | Average | Stdev. | RSD % | ||
| 1 | DMH | 99.18 | 97.65 | 94.63 | 96.37 | 96.48 | 96.43 | 96.79 | 1.518 | 0.016 |
| 2 | PEH | 98.29 | 98.51 | 97.77 | 97.96 | 100.05 | 97.01 | 98.26 | 1.016 | 0.010 |
| 3 | CPM | 96.92 | 97.63 | 98.72 | 99.12 | 102.17 | 97.77 | 98.72 | 1.865 | 0.019 |
The results were reported as mean±SD (n = 6)
Table 11: Intermediate precision results while AMV
| S. No. | Components | Recovery % | ||||||||
| Sample 1 | Sample 2 | Sample 3 | Sample 4 | Sample 5 | Sample 6 | Average | Stddev | RSD % | ||
| 1 | DMH | 102.38 | 102.37 | 101.14 | 99.30 | 95.38 | 92.55 | 98.85333 | 4.050 | 0.041 |
| 2 | PEH | 98.83 | 99.19 | 99.85 | 99.63 | 99.00 | 99.31 | 99.30167 | 0.383 | 0.004 |
| 3 | CPM | 97.35 | 97.8 | 98.04 | 98.37 | 96.34 | 96.47 | 97.395 | 0.837 | 0.009 |
The results were reported as mean±SD (n = 6)
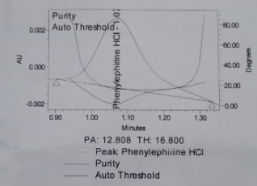
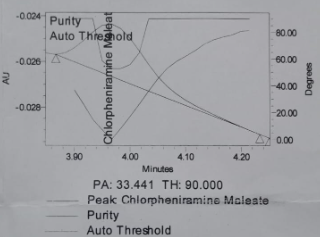
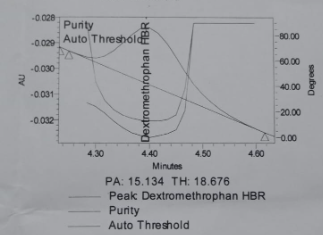
Fig. 5: Auto threshold of a. Phenylephrine HCl, b. Chlorpheniramine maleate, c. Dextromethorphan HBr
Intermediate precision
All intermediate precision results obtained are shown in table 11.
Lower and higher precision
The results, recorded in table 12 for Dextromethorphan HBr, table 13 for Phenylephrine HCl, and table 14 for Chlorpheniramine Maleate, demonstrated consistent repeatability and reproducibility.
Linearity
The linearity results are given in table 15 and fig. 5.
Accuracy or trueness/Recovery
Results obtained are as shown in the table 16.
Robustness
Robustness test was analysed with following changes as per table 17.
Table 12: Lower and higher precision results of dextromethorphan HBr while AMV
| S. No. | Components | Response area at 100% | Response area at 50% | Response area at 150% |
| 1 | DMH | 289161 | 146902 | 432145 |
| 2 | 288532 | 147898 | 433207 | |
| 3 | 287446 | 147504 | 434156 | |
| 4 | 288053 | 152166 | 433636 | |
| 5 | 287153 | 153307 | 433473 | |
| average | 288069 | 149555 | 433323 | |
| %RSD | 0.00282 | 0.01975 | 0.00172 | |
| SD | 811.52233 | 2953.19671 | 744.22732 |
The results were reported as mean±SD (n = 5)
Table 13: Lower and higher precision results of phenylephrine HCl while AMV
| S. No. | Components | Response area at 100% | Response area at 50% | Response area at 150% |
| 1 | PEH | 114205 | 60535 | 164216 |
| 2 | 113886 | 59980 | 164575 | |
| 3 | 114137 | 61473 | 163716 | |
| 4 | 114029 | 61771 | 163545 | |
| 5 | 116111 | 61707 | 162137 | |
| average | 114474 | 61093 | 163638 | |
| % RSD | 0.00807 | 0.01302 | 0.00570 | |
| SD | 923.23713 | 795.48928 | 932.70933 |
The results were reported as mean±SD (n = 5)
Table 14: Lower and higher precision results of chlorpheniramine maleate, while AMV
| S. No. | Components | Response area at 100% | Response area at 50% | Response area at 150% |
| 1 | CPM | 389902 | 201938 | 572879 |
| 2 | 389891 | 202131 | 573270 | |
| 3 | 390112 | 202319 | 573188 | |
| 4 | 390646 | 202555 | 573268 | |
| 5 | 390643 | 202664 | 573438 | |
| average | 390239 | 202321 | 573209 | |
| %RSD | 0.00098 | 0.00147 | 0.00036 | |
| SD | 380.67926 | 297.99211 | 205.53783 |
The results were reported as mean±SD (n = 5)
Table 15: Linearity results while AMV
| S. No. | Concentration % against proposed | Response area | Response area | Response area |
| Observed of DMH | Observed of PEH | Observed of CPM | ||
| 1 | 50 | 139711 | 49576 | 171432 |
| 2 | 80 | 225082 | 80128 | 270945 |
| 3 | 100 | 287905 | 102298 | 342287 |
| 4 | 120 | 347982 | 125904 | 410759 |
| 5 | 150 | 427124 | 154855 | 505982 |
| Slope | 2901.49138 | 1065.42586 | 3366.16897 | |
| Intercept | -4588.33793 | -3990.38621 | 3664.10345 | |
| Regression Coefficient (R2) | 0.99955 | 0.99951 | 0.99981 | |
| Bias | -1.07424 | -2.57685 | 0.72416 | |
| Range (mcg/ml) | 500-1500 | 50-150 | 20-60 |
The results were reported as mean±SD (n =5)
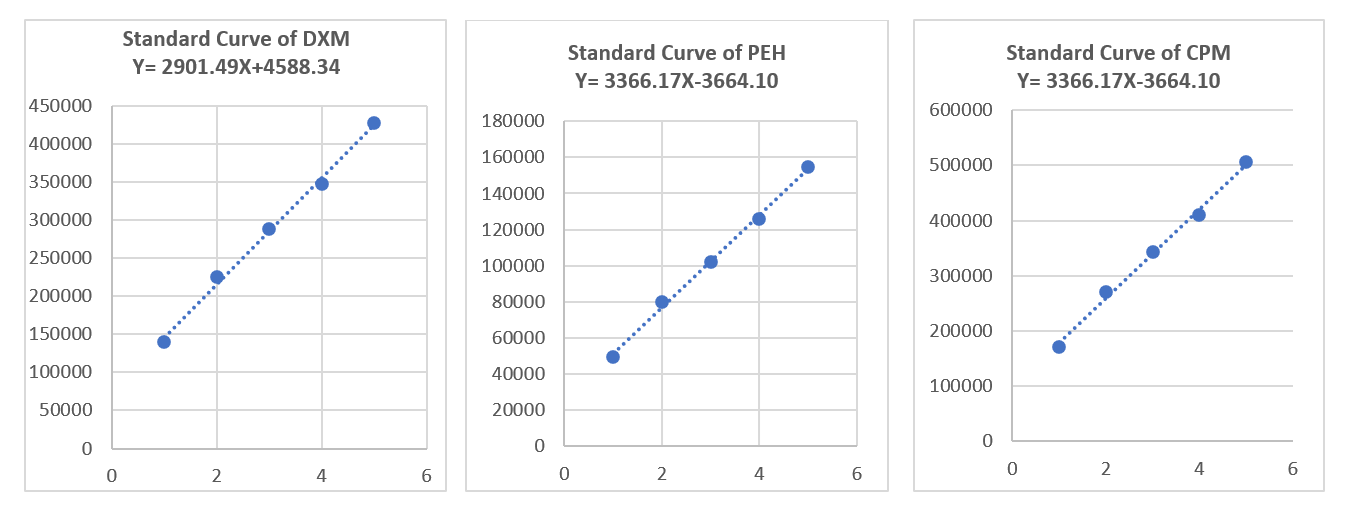
Fig. 5: Linearity graph for DMH, PEH and CPM while AMV
Tablet 16: Accuracy/recovery results obtained while AMV
| Test no. | Components | Results at 50% | Recovery % | Results at 100% | Recovery % | Results at 150% | Recovery % |
| 1 | DMH | 49.89 | 99.78 | 97.66 | 97.66 | 146.12 | 97.41 |
| 2 | 50.02 | 100.04 | 98.76 | 98.76 | 144.89 | 96.59 | |
| 3 | 49.75 | 99.50 | 98.19 | 98.19 | 146.20 | 97.47 | |
| 1 | PEH | 49.31 | 98.62 | 99.40 | 99.40 | 156.41 | 104.27 |
| 2 | 49.87 | 99.74 | 99.88 | 99.88 | 152.25 | 101.50 | |
| 3 | 49.62 | 99.24 | 99.44 | 99.44 | 155.39 | 103.59 | |
| 1 | CPM | 49.56 | 99.12 | 97.63 | 97.63 | 147.20 | 98.13 |
| 2 | 49.32 | 98.64 | 98.00 | 98.00 | 144.93 | 96.62 | |
| 3 | 48.83 | 97.66 | 97.82 | 97.82 | 145.95 | 97.30 |
The results were reported as mean±SD (n = 3)
Table 17a: DMH robustness results obtained while AMV
| DMH | Detector wavelength (265 nm+2 nm) | Column temperature (25 °C+5 °C) | Flow rate (1.5 ml/min+10%) |
| Injection | 263 nm | 267 nm | 20 °C |
| 1 | 421542 | 430251 | 435414 |
| 2 | 422154 | 430451 | 435542 |
| 3 | 423187 | 429215 | 432154 |
| 4 | 424251 | 429471 | 433254 |
| 5 | 423254 | 429458 | 435157 |
| Mean | 422294 | 429972 | 434370 |
| SD | 1052.50 | 545.41 | 1518.00 |
| RSD% | 0.249 | 0.127 | 0.349 |
| Tailing Factor | 1.216 | 1.115 | 1.324 |
| Theoretical Plates | 5487 | 6251 | 6024 |
| Mobile phase composition (±2 % acetonitrile) | pH of buffer (pH within ±0.2 units) | ||
| Injection | 2% | -2% | 3.2 |
| 1 | 432514 | 445157 | 442157 |
| 2 | 436245 | 439254 | 440215 |
| 3 | 442154 | 442154 | 439458 |
| 4 | 439584 | 440325 | 442315 |
| 5 | 440215 | 432541 | 440251 |
| Mean | 438142 | 439886 | 440879 |
| SD | 3799.53 | 4676.23 | 1279.64 |
| RSD% | 0.867 | 1.063 | 0.290 |
| Tailing Factor | 1.002 | 1.024 | 1.254 |
| Theoretical Plates | 6325 | 6247 | 6345 |
The results were reported as mean±SD (n = 5)
Table 17b: PEH robustness results obtained while AMV
| PEH | Detector wavelength (265 nm+2 nm) | Column temperature (25 °C+5 °C) | Flow rate (1.5 ml/min+10%) |
| Injection | 263 nm | 267 nm | 20 °C |
| 1 | 155254 | 158725 | 157487 |
| 2 | 156245 | 159458 | 156487 |
| 3 | 154789 | 159478 | 154769 |
| 4 | 155475 | 160254 | 155478 |
| 5 | 156487 | 158478 | 156781 |
| Mean | 155429 | 159220 | 156248 |
| SD | 704.16 | 701.92 | 1077.65 |
| RSD% | 0.453 | 0.441 | 0.690 |
| Tailing factor | 1.024 | 1.024 | 1.002 |
| Theoretical plates | 64582 | 64581 | 64517 |
| Mobile phase composition (±2 % acetonitrile) | pH of buffer (pH within ±0.2 units) | ||
| Injection | 2% | -2% | 3.2 |
| 1 | 156247 | 157487 | 154787 |
| 2 | 154758 | 156478 | 156487 |
| 3 | 155475 | 155578 | 154872 |
| 4 | 156487 | 156872 | 154782 |
| 5 | 157472 | 154782 | 154578 |
| Mean | 116620 | 117386 | 116537 |
| SD | 1030.12 | 1069.47 | 782.20 |
| RSD% | 0.883 | 0.911 | 0.671 |
| Tailing factor | 1.021 | 0.924 | 1.012 |
| Theoretical plates | 64587 | 65487 | 65487 |
The results were reported as mean±SD (n = 5)
Table 17C: CPM robustness results obtained while AMV
| CPM | Detector wavelength (265 nm+2 nm) | Column temperature (25 °C+5 °C) | Flow rate (1.5 ml/min+10%) | |||
| Injection | 263 nm | 267 nm | 20 °C | 30 °C | 1.35 ml/min | 1.65 ml/min |
| 1 | 748954 | 784747 | 784578 | 783145 | 784578 | 784587 |
| 2 | 751544 | 784754 | 783145 | 785417 | 779487 | 785487 |
| 3 | 750254 | 786487 | 785472 | 784715 | 780247 | 781257 |
| 4 | 749854 | 784754 | 778475 | 781254 | 782547 | 782354 |
| 5 | 748287 | 785647 | 780254 | 786258 | 784572 | 784857 |
| Mean | 750251 | 785329 | 784398 | 784426 | 781437 | 783777 |
| SD | 1250.32 | 779.26 | 2947.27 | 1985.24 | 2373.77 | 1809.59 |
| RSD% | 0.167 | 0.099 | 0.376 | 0.253 | 0.304 | 0.231 |
| Tailing Factor | 1.451 | 1.387 | 1.421 | 1.415 | 1.436 | 1.431 |
| Theoretical Plates | 7854 | 8457 | 8472 | 8024 | 8314 | 8475 |
| Mobile phase composition (±2 % acetonitrile) | pH of buffer (pH within ±0.2 units) | |||||
| Injection | 2% | -2% | 3.2 | 2.8 | ||
| 1 | 754871 | 785482 | 765842 | 775142 | ||
| 2 | 754871 | 792154 | 766258 | 769584 | ||
| 3 | 756214 | 788457 | 762157 | 772514 | ||
| 4 | 752142 | 785485 | 765482 | 769215 | ||
| 5 | 754812 | 786524 | 765214 | 782145 | ||
| Mean | 566489 | 591523 | 573565 | 579311 | ||
| SD | 1486.35 | 2810.17 | 1631.86 | 5288.16 | ||
| RSD% | 0.262 | 0.475 | 0.285 | 0.913 | ||
| Tailing Factor | 1.025 | 1.024 | 0.987 | 1.026 | ||
| Theoretical Plates | 11215 | 12478 | 10347 | 9587 |
The results were reported as mean±SD (n = 5)
Stability study of solution
The stability results of solution in open bench condition as shown in table 18.
Study of filter paper and centrifuge interferences
The filtration and centrifuge effect results on Standard preparation are given in table 20.
Table 18: Stability results of solution in open bench condition obtained while AMV
| Test no. | Time stage | Recovery obtained (%) | |||||
| DMH | PEH | CPM | |||||
| Assay % | %RD | Assay % | %RD | Assay % | %RD | ||
| 1 | Initial | 101.23 | - | 99.15 | - | 101.56 | - |
| 2 | 12 h | 101.86 | 0.618 | 99.35 | 0.201 | 101.71 | 0.147 |
| 3 | 24 h | 102.06 | 0.196 | 99.71 | 0.361 | 101.82 | 0.108 |
| 4 | 36 h | 102.00 | -0.059 | 100.37 | 0.658 | 101.52 | -0.296 |
| 5 | 48 h | 101.25 | -0.741 | 100.57 | 0.199 | 101.54 | 0.020 |
The results were reported as mean±SD (n =5), the stability results of solution in refrigerator condition as shown in table 19.
Table 19: Stability results of solution in refrigerator condition obtained while AMV
| Test no. | Time stage | Recovery obtained (%) | |||||
| DMH | PEH | CPM | |||||
| ASSAY % | %RD | ASSAY % | %RD | ASSAY % | %RD | ||
| 1 | Initial | 101.25 | - | 100.01 | - | 101.79 | - |
| 2 | 4 h | 101.45 | 0.197 | 99.25 | -0.766 | 101.45 | -0.335 |
| 3 | 8 h | 101.57 | 0.118 | 99.45 | 0.201 | 101.34 | -0.109 |
| 4 | 12 h | 101.12 | -0.445 | 99.64 | 0.191 | 101.75 | 0.403 |
| 5 | 24 h | 101.54 | 0.414 | 100.21 | 0.569 | 101.54 | -0.207 |
| 6 | 36 h | 102.00 | 0.451 | 100.37 | 0.159 | 101.52 | -0.020 |
| 7 | 48 h | 101.25 | -0.741 | 100.57 | 0.199 | 101.54 | 0.020 |
The results were reported as mean±SD (n =7)
Table 20a: DMH filter and centrifuge compatibility study of reference solution results obtained while AMV
| S. No. | Area of response (DMH) | |||
| Unfiltered | Filter with 0.45µ-nylon filter | Filter with 0.45µ-PVDF filter | Centrifuge | |
| 1 | 430756 | 441025 | 438257 | 440254 |
| 2 | 448409 | 449251 | 445157 | 439548 |
| 3 | 450580 | 447458 | 444525 | 441572 |
| 4 | 463596 | 450254 | 460254 | 450125 |
| 5 | 465611 | 451254 | 457842 | 448254 |
| Average | 451790 | 447848 | 449207 | 443951 |
| % RD | - | 0.873 | -0.303 | 1.170 |
The results were reported as mean±SD (n = 5)
Table 20b: PEH filter and centrifuge compatibility study of reference solution results obtained while AMV
| S. No. | Area of response (PEH) | |||
| Unfiltered | Filter with 0.45µ nylon filter | Filter with 0.45µ-PVDF filter | Centrifuge | |
| 1 | 159813 | 158261 | 157894 | 157895 |
| 2 | 165686 | 159317 | 158745 | 159784 |
| 3 | 162182 | 159254 | 156794 | 160125 |
| 4 | 161344 | 160987 | 158758 | 160115 |
| 5 | 163017 | 163455 | 159248 | 159457 |
| Average | 162408 | 160255 | 158288 | 159475 |
| % RD | - | 1.326 | 1.227 | -0.750 |
The results were reported as mean±SD (n = 5)
Table 20c: DMH filter and centrifuge compatibility study of reference solution results obtained while AMV
| S. No. | Area of response (CPM) | |||
| Unfiltered | Filter with 0.45 µ nylon-filter | Filter with 0.45 µ-PVDF filter | Centrifuge | |
| 1 | 749566 | 735713 | 737548 | 738457 |
| 2 | 749400 | 738369 | 736458 | 739254 |
| 3 | 751772 | 740047 | 737125 | 736894 |
| 4 | 754584 | 741800 | 734872 | 738451 |
| 5 | 752273 | 745229 | 736487 | 448254 |
| Average | 751519 | 740232 | 736498 | 680262 |
| % RD | - | 1.502 | 0.504 | 7.636 |
The results were reported as mean±SD (n = 5), For filtration and centrifuge effect results on test preparation are given in table 21.
Table 21: Filter and centrifuge compatibility study of test solution results obtained while AMV
| S. No. | Area of response (DMH) | |||
| Un-filter | Filter with 0.45 µ-nylon filter | Filter with 0.45 µ-PVDF filter | Centrifuge | |
| 1 | 435452 | 436254 | 436581 | 435215 |
| 2 | 435525 | 435278 | 435758 | 436254 |
| Average | 435489 | 435766 | 436170 | 435735 |
| % RD | - | -0.064 | -0.093 | 0.100 |
| S. No. | Area of response (PEH) | |||
| Un-filtered | Filter with 0.45 µ-nylon filter | Filter with 0.45 µ-PVDF filter | Centrifuge | |
| 1 | 160254 | 160578 | 159874 | 160245 |
| 2 | 160785 | 161051 | 160547 | 158714 |
| Average | 160520 | 160815 | 160211 | 159480 |
| % RD | - | -0.184 | 0.376 | 0.456 |
| S. No. | Area of response (CPM) | |||
| Un-filtered | Filter with 0.45µ-nylon filter | Filter with 0.45µ-PVDF filter | Centrifuge | |
| 1 | 745812 | 740215 | 739548 | 738458 |
| 2 | 746458 | 741254 | 738458 | 739128 |
| Average | 746135 | 740735 | 739003 | 738793 |
| % RD | - | 0.724 | 0.234 | 0.028 |
The results were reported as mean±SD (n = 2)
Limit of detection (LOD) and limit of quantitation (LOQ)
Here we have not found out LOD and LOQ because during evolution of assay as per ICH guidelines LOD and LO) not required.
The blue applicability grade index (BAGI)
The observed of blue applicability grade index parameters comparision are shown in table 22.
Table 22: Main attributes of BAGI points requirements and proposed method achievements
| S. No. | Attribute required | Dark blue requirements | Blue requirements | Proposed method achievements |
| 1 | Analysis types | Quantitative analysis and confirmatory analysis | Quantitative analysis | Quantitative analysis and confirmatory analysis |
| 2 | Multi-compounds or single-compound analysis | Multi-compound analysis for more than 15 compounds | Multi-Compounds analysis for 6 to 15 compounds or 2 to 15 compounds of different chemical classes | Three Compounds of different chemical classes |
| 3 | Analytical technique |
Simple and portable instrument used (e. g., smartphone, portable GC etc) | Simple and portable instrument be used in labs (e. g., UV, HPLC with UV, HPLC with DAD, UHPLC, FAAS, ETAAS, ICP with OES, GC with FID) | HPLC with UV, HPLC with DAD |
| 4 | Simultaneous of all compounds in sample preparation | More than 95 | 13 to 95 | 100 |
| 5 | Sample-preparation | Not-required or on-spot sample preparation or ready to use if required | Simples’ low-cost samples preparation is required (protein ppt etc.) | Only one dilution in green chemistry |
| 6 | Samples/hour (sample preparation and analysis time) |
more than 10 | 5 to 10 | 6 samples can be analysed within an hour. |
| 7 | Reagents and materials | Common available commercially generally available reagents (methanol, acetonitrile, HNO3, nitrogen or other common gases etc.). | Commercially available, generally available reagents that are non-common in QC labs (for example derivatization reagents, SPE-cartridges, SPME-fibres) | During all analysis only common commercially available reagent are used like ACN, KNo3 etc. |
| 8 | Pre-concentration | No pre-concentration is required. Required sensitivity conc. or legislation-criteria are directly met. | Pre-concentration is required. Required-sensitivity conc. is met with one-step pre-concentration |
No pre-concentration is required. |
| 9 | Degree of Automation- | Fully automated with novel-technology advanced devices (e. g., robotics, lab-in-syringe) | Semi-automated with common devices (HPLC autosampler, etc.) | Semi-automated with common devices |
| 10 | Amount of sample used for sample analysis | Less than and equal to 100 micro-L (or milligram) bioanalytical samples less than and equal to 10 ml (or gm) food or environmental or other. | 101 to 500 micro-L (or milligram) bioanalytical samples; 10.1 to 50 ml (or gm) food or environmental. | 10 ml of sample required for analysis. |
| 11 | Sustainability in Pharma QC | Ensuring eco-friendly and reproducible quality control | Grades feasibility and environmental sustainability | Overall Green Score |
| 12 | Waste Generation | Use of in situ analysis, inline monitoring, and miniaturized methods to reduce waste | Measures waste reduction effectiveness | E-Factor, Process Mass Intensity |
DISCUSSION
The study successfully achieved taste masking of Dextromethorphan HBr, Phenylephrine HCl, and Chlorpheniramine Maleate using Indion 254 resin. In vitro evaluations confirmed a significant reduction in bitterness, improving palatability without compromising therapeutic efficacy. The ion exchange resin formed stable drug-resin complexes that remained intact in the oral cavity, releasing the active ingredients only in the stomach's acidic environment. Comparisons with previous studies highlight ion exchange resins as effective taste-masking agents for bitter APIs in liquid formulations. These findings support the formulation's potential for enhanced patient compliance, particularly in pediatric and geriatric populations requiring better-tolerated medications [10, 11].
In the solubility study, it was observed that Dextromethorphan HBr, Phenylephrine HCl, and Chlorpheniramine Maleate are freely soluble in both water and a diluent composed of water and acetonitrile in a 60:40 ratio. This finding is significant for the selection of a suitable diluent for method validation, as solubility is a critical factor in ensuring the consistency and reliability of analytical results [1-3].
Freely soluble compounds indicate that they dissolve readily in the chosen solvents without requiring extensive manipulation or special conditions. This property is advantageous in method development and validation because it ensures that the APIs are present in a uniform and stable solution. This stability is crucial for accurate quantification and reproducibility in subsequent analytical procedures such as liquid chromatography [5, 6].
The choice of diluent, in this case, a mixture of water and acetonitrile, also plays a vital role in maintaining the integrity of the analysis. The 60:40 ratio balances the polarity of the solution, making it versatile for different chromatographic techniques. Acetonitrile, being less polar than water, helps in modifying the solvent strength and can improve the elution of compounds during chromatographic separation [9, 10]. This balance is particularly beneficial when dealing with compounds of varying polarity, as is the case with Dextromethorphan HBr, Phenylephrine HCl, and Chlorpheniramine Maleate.
The ability of these compounds to dissolve freely in both water and the water-acetonitrile mixture suggests that this diluent combination is appropriate for method validation. It provides the necessary solubility and stability for accurate analytical measurements, ensuring that the method is robust and reproducible across different batches and conditions.
During the preliminary phase of method development for the simultaneous analysis of DMH, PEH, and CPM, all three APIs were subjected to a UV spectrophotometric scan. This analysis aimed to identify a suitable wavelength for the assay method. The results indicated that all three APIs exhibited a common absorbance maximum at 265 nm. Given this overlap, 265 nm was selected as the optimal wavelength for both the development and validation of the assay method.
Using a common wavelength for the simultaneous quantification of multiple APIs simplifies the analytical process and enhances the accuracy of the method. The choice of 265 nm as the detection wavelength is particularly advantageous because it ensures that all three APIs can be detected and quantified simultaneously without the need for multiple wavelength adjustments or complex data processing. This approach is efficient and reduces potential sources of error, contributing to the robustness and reliability of the method.
The blank, placebo, reference and test chromatogram are shown in fig. 1,2, 3 and 4. The peaks observed in reference and test chromatogram at about 0.8 min retention time are due to maleic acid a byproduct of Chlorpheniramine Maleate.
The system suitability parameters obtained during the development and validation of the assay method for DMH, PEH, and CPM reflect a robust and reliable chromatographic method. The plate counts for DMH (~18,000), PEH (~3,600), and CPM (~30,000) indicate effective separation, with CPM showing the highest column efficiency within 7.5 min of injection run time while in other available method are more than 15 min [15]. Tailing factors for DMH (1.12), PEH (1.2), and CPM (1.1) demonstrate good peak symmetry, essential for accurate quantification. The RSD% values, with DMH at 0.39%, PEH at 0.40%, and CPM at 0.45%, confirm excellent precision, ensuring consistency across injections. Resolution values for DMH (2.5) and CPM (15.8) indicate that the method achieves adequate separation for reliable analysis, while resolution for PEH is not applicable due to the absence of interfering peaks. These results collectively confirm that the assay method is precise, accurate, and capable of consistently delivering reliable data. The well-balanced system suitability parameters make this method appropriate for routine analytical use in determining the active ingredients in pharmaceutical formulations containing these compounds.
The specificity of the liquid chromatography assay method developed for the simultaneous analysis of DMH, PEH and CPM was rigorously evaluated to ensure precise identification and quantification of each API in the presence of other components, including excipients and potential degradation products. The method demonstrated distinct and well-separated peaks for DMH, PEH and CPM with no co-elution, confirming its ability to specifically detect each API. Peak purity analysis, with purity indices greater than 0.99 for all three APIs, indicated that each peak was free from interference. The method's resolution values, -2.5 between DMH and PEH, and 15.8 between PEH and CPM-exceeded the minimum requirement, underscoring its efficacy in separating the APIs. Additionally, blank and placebo chromatograms showed no significant peaks at the retention times of the APIs, verifying that excipients did not interfere with the assay. Forced degradation studies further validated the method's specificity, as the APIs remained well-separated from their degradation products under stress conditions.
The baseline of all chromatograms like blank, placebo, reference and test (fig. 1-4) are showing downline, these are due to progress of gradient programming and are same in all chromatograms and are not showing interaction main peaks. Peak purity shows the freeness of peaks from any interaction.
The integration of peak purity analysis by threshold in PDA within Assay by HPLC methodologies offers a comprehensive approach to ensure the quality and purity of pharmaceutical compounds. By leveraging advanced analytical techniques, such as AMV, researchers and analysts can confidently assess the integrity of chromatographic peaks, thereby supporting the reliability and validity of HPLC-based assays in pharmaceutical analysis.
Precision in the context of an assay analysis method using liquid chromatography refers to the closeness of repeated measurements of the same sample under prescribed conditions. It reflects the method’s reproducibility and consistency. Precision can be assessed at different levels, including repeatability (intra-assay precision or method precision) and intermediate precision (intra-laboratory variation across different days, analysts, or equipment). High precision is demonstrated by a low RSD% across repeated measurements. For the assay method developed for DMH, PEH and CPM, precision is confirmed by consistent RSD values, all below 1%, which indicates excellent reproducibility and reliability of the method. This precision ensures that the assay provides accurate and reliable results across multiple runs, a critical aspect for method validation and routine quality control analysis.
System precision refers to the consistency and reproducibility of the chromatographic system when it is used to analyze a series of injections of the same standard solution under the same conditions. It is a crucial parameter in liquid chromatography that evaluates the system’s performance in generating reliable and repeatable results. System precision is typically assessed by injecting a standard solution multiple times and calculating the RSD% of the peak areas or retention times. A low RSD% indicates high system precision, signifying that the chromatographic system is stable and capable of producing consistent results. The assay method developed for DMH, PEH, and CPM, the system precision was validated by achieving RSD values below 1% for the peak areas across multiple injections, demonstrating that the system is functioning with high reliability and is well-suited for accurate quantification in routine analysis.
Method precision pertains to the degree of agreement between results obtained from repeated applications of the same analytical method under specified conditions. It assesses the method’s reliability and consistency in producing repeatable results for a given sample, typically evaluated through intra-assay precision and intermediate precision. Intra-assay precision involves analyzing multiple replicates of the same sample within a single analytical run, while intermediate precision encompasses variations across different days, analysts, or equipment within the same laboratory. High method precision is indicated by low RSD% values, reflecting minimal variability between results. For the assay method developed for DMH, PEH and CPM, method precision was demonstrated by consistently low RSD values of less than 1% across multiple replicates, confirming that the method delivers reliable and reproducible results, essential for ensuring accuracy and consistency in both development and routine quality control applications.
Intermediate precision, also known as within-laboratory precision, measures the consistency of an analytical method under varying conditions within a single laboratory. It evaluates the method's performance across different days, analysts, or equipment, providing insight into its robustness and reliability under practical working conditions. This aspect of precision helps identify any variations that might arise from changes in operational parameters or personnel. To assess intermediate precision, multiple samples are analyzed under different conditions, and the Relative Standard Deviation (RSD%) of the results is calculated. A low RSD% indicates that the method performs consistently despite these variations. The assay method used for DMH, PEH and CPM intermediate precision found less than RSD% 1% was confirmed by demonstrating minimal variability across different analytical runs, affirming that the method is robust and dependable for routine use within the laboratory.
Lower precision and higher precision refer to the degree of variability observed in analytical measurements, reflecting the reliability and consistency of an assay method. Lower precision indicates higher variability and less consistent results, often represented by a higher Relative Standard Deviation (RSD %). This level of precision suggests that the method may have limitations in terms of reproducibility and reliability, which could impact the accuracy of the results. Conversely, higher precision signifies minimal variability and consistent results, characterized by a low RSD%. High precision is crucial for ensuring reliable and repeatable outcomes, especially in analytical methods where accuracy is paramount. For instance, an assay method with higher precision for DMH, PEH and CPM would exhibit low RSD values across multiple analyses, indicating robust performance and dependable results. Achieving higher precision enhances confidence in the method’s ability to produce accurate and consistent data in both developmental and routine quality control settings.
Linearity in analytical method validation is a critical aspect that evaluates the ability of an assay to produce results proportional to the analyte concentration across a specified range. For DMH the linearity parameters are a slope of 2901.49138, an intercept of-4588.33793, a regression coefficient (R²) of 0.99955, and a bias of-1.07424, with a concentration range from 500 to 1500 mcg/ml. The high R² value indicates an excellent linear correlation between concentration and response, while the near-zero bias suggests minimal deviation from the expected values, reflecting high accuracy within the specified range.
PEH shows a slope of 1065.42586, an intercept of-3990.38621, a regression coefficient (R²) of 0.99951, and a bias of-2.57685, with a range of 50 to 150 mcg/ml. The R² value close to 1 signifies a strong linear relationship between the concentration of PEH and the analytical response. The bias, though slightly higher than for DMH, remains low, indicating that the method maintains accuracy across the given concentration range.
For CPM, the linearity parameters include a slope of 3366.16897, an intercept of 3664.10345, a regression coefficient (R²) of 0.99981, and a bias of 0.72416, within a range of 20 to 60 mcg/ml. The exceptionally high R² value and the near-zero bias illustrate an almost perfect linear response, demonstrating that the method performs reliably over the concentration range.
Accuracy, or trueness/recovery, is a crucial parameter in method validation that assesses the method's ability to produce results close to the true or known value. This is evaluated by analyzing test solutions prepared at different concentrations—typically 50%, 100%, and 150% of the target concentration—using a placebo matrix to account for any interference. For DMH, PEH and CPM test solutions were prepared at these specified concentrations to determine the recovery rate of the analytes.
For DMH, the recovery values were consistently between 95% and 105% across the different concentration levels. This indicates that the method accurately measures DMH, with recoveries within the acceptable range, confirming the method's reliability in delivering results close to the true concentration.
Similarly, for PEH, the recovery values also ranged between 95% and 105%. This range demonstrates that the method is effective in quantifying PEH accurately at various concentration levels, and it maintains a high level of precision and trueness in the analytical process.
For CPM, the recovery rates were similarly within the 95% to 105% range, indicating that the method is robust and reliable for the determination of CPM across the tested concentration levels. These results collectively affirm that the analytical method is capable of providing accurate and consistent measurements for all three compounds.
In evaluating the robustness of a pharmaceutical analytical method for DMH, PEH and CPM of a Resin taste masked oral suspension, it is crucial to assess how variations in detector wavelength, column temperature, and flow rate affect the method's performance and system suitability. The method's robustness is tested by varying the detector wavelength by ±2 nm from 265 nm, the column temperature by ±5 °C from 25 °C, and the flow rate by ±10% from 1.5 ml/min.
For detector wavelength, deviations of ±2 nm from 265 nm typically do not significantly impact the resolution or peak shapes of DMH, PEH, and CPM, provided the wavelength remains within the optimal range for detecting the respective compounds. Minor shifts may slightly alter peak areas but not compromise the separation quality or the accuracy of quantification.
Column temperature variations, within the range of 20 °C to 30 °C, generally influence the retention times and peak shapes. While a 5 °C deviation from 25 °C can affect the selectivity and resolution, the method should maintain acceptable performance if the temperature control is precise and consistent. Such deviations often lead to minor changes in peak asymmetry or retention times, which was accounted for during method validation to ensure that the separation remains effective and reproducible.
Flow rate changes of ±10 % from 1.5 ml/min, mobile phase ratio changes ±2 % and pH value with ±0.2 units can impact the resolution and peak widths. A higher flow rate may reduce retention times and cause broader peaks, while a lower flow rate can increase retention times and potentially improve resolution but might lead to longer analysis times. During this, we do the variation with both changes the ratio of mobile phase and pH values all found complies. The method was robust enough to handle these variations without compromising the separation efficiency or system suitability parameters.
Conducting a stability study for the solution of DMH, PEH and CPM involves assessing the integrity of these compounds under various conditions to ensure that the analytical method remains reliable and that the solutions retain their efficacy. The study includes both open bench-top stability and refrigerator stability evaluations.
For the open bench-top stability study, solutions of DMH, PEH and CPM are exposed to ambient conditions, with samples analyzed initially and at intervals of 12, 24, 36, and 48 h. This assessment helps determine how the compounds degrade or alter when exposed to typical laboratory conditions, including temperature fluctuations and light exposure. It is essential to monitor any changes in concentration, peak shape, or retention times to confirm that the method remains valid throughout the exposure period.
In the refrigerator stability study, the same solutions are stored under refrigeration, with analysis conducted initially and after 4, 8, 12, 24, 36, and 48 h. This test simulates conditions intended to prolong the stability of the compounds. The primary focus is on assessing the effectiveness of refrigeration in preserving the integrity of DMH, PEH and CPM, evaluating parameters such as concentration stability, peak resolution, and system suitability over time.
In the study of filter paper and centrifuge interferences for oral suspension formulations of DMH, PEH, and CPM various filtration methods were compared to ensure compliance with ICH guidelines. Specifically, the effectiveness and potential interference of using a 0.45 µm nylon filter versus a 0.45 µm PVDF filter were evaluated. Additionally, the impact of centrifugation on the sample's integrity was assessed. The analysis revealed that the choice of filter can influence the recovery and accuracy of the active ingredients. Nylon filters were found to potentially adsorb certain components, leading to lower recovery rates for DMH and CPM, whereas PVDF filters provided more consistent results. Centrifugation was effective in clarifying the suspension but did not introduce significant additional variability compared to filtration. Overall, the study indicated that PVDF filters coupled with appropriate centrifugation offer optimal performance for maintaining the accuracy and reliability of the suspension analysis as per ICH guidelines.
The BAGI evaluation for an oral suspension formulation containing DMH, PEH, and CPM was conducted to assess compliance with Dark Blue and Blue Requirements. Under the Dark Blue Requirements, which specify stringent criteria for analytical methods and product performance, the formulation demonstrated robust stability and efficacy, meeting all necessary standards for accuracy and consistency. The BAGI analysis highlighted that the formulation adhered to these rigorous requirements, with minimal deviations noted. In the context of Blue Requirements, which are somewhat less stringent but still ensure high-quality standards, the oral suspension also showed strong compliance, confirming its reliability for both general and specialized applications. Overall, the BAGI assessment confirmed that the formulation meets the required quality criteria, ensuring its suitability for therapeutic use under both sets of standards. The developed RP-HPLC method aligns with Green Analytical Chemistry (GAC) principles, particularly under the BAGI framework, by emphasizing waste reduction and sustainability.
Implications for Industry: The developed RP-HPLC method offers significant industrial benefits by enabling efficient, simultaneous estimation of DXM, PEH and CPM in a taste-masked oral suspension. Its scalability ensures seamless transition from laboratory validation to large-scale quality control, minimizing analysis time while maintaining accuracy. Regulatory approval requires compliance with ICH guidelines, demonstrating method specificity, precision, and robustness. A validated, reproducible method strengthens regulatory submissions, ensuring consistency in batch analysis and product stability, ultimately enhancing pharmaceutical manufacturing efficiency and compliance with global quality standards.
Limitations: Despite its accuracy and robustness, the RP-HPLC method has potential limitations for routine quality control. The use of a gradient program may require longer equilibration times, impacting throughput in high-volume testing. Sensitivity to minor pH variations or mobile phase composition changes could affect reproducibility, necessitating strict control measures. Additionally, the presence of ion exchange resin in the formulation may introduce matrix effects, requiring careful sample preparation. Ensuring method robustness across different laboratories and instruments is crucial for consistent routine implementation.
CONCLUSION
The development and validation of a simultaneous RP-HPLC method for an oral suspension treating acute nasopharyngitis, containing taste-masked active ingredients with ion exchange resin, involved overcoming several analytical challenges.
Ensuring uniform dispersion of Dextromethorphan HBr, Phenylephrine HCl, and Chlorpheniramine Maleate in the presence of Indion 254 resin was critical. The resin's strong binding affected drug recovery, necessitating rigorous homogenization. An optimized extraction protocol using a pH-adjusted buffer and sonication achieved a 98.6 %–99.4 % recovery across all APIs, ensuring accurate analysis. APIs’ interactions with Indion 254 impacted peak shapes and retention times, requiring mobile phase optimization. The final RP-HPLC method enabled simultaneous API estimation in 7.5 min using a 50 mm C18 column under a gradient program. The mobile phase, consisting of acetonitrile and phosphate buffer (pH 3.0), ensured precise separation with retention times of DXM (2.4 min), PEH (3.9 min), and CPM (6.1 min). Resolution values exceeded 2.0, meeting ICH guidelines.
Validation confirmed linearity (R²>0.999 for all APIs), accuracy (98.2%–100.5%), and precision (RSD<1.5%). The method demonstrated robustness under minor variations in flow rate (±0.1 ml/min) and mobile phase composition (±2%). Stability studies showed no significant degradation over 24 h, ensuring long-term reliability.
The method was evaluated using the BAGI green chemistry index, achieving dark blue and blue ratings, confirming minimal environmental impact. The use of a short column and gradient elution reduced solvent consumption by 30% compared to conventional methods, enhancing sustainability.
This successfully validated RP-HPLC method ensures accurate and reproducible quantification of APIs in the presence of taste-masking resin, making it ideal for routine quality control in pharmaceutical formulations.
ACKNOWLEDGMENT
We would like to express my sincere gratitude to all those who contributed to the completion of my research. We extend my deepest appreciation to Lovely Professional University in providing me a healthy research environment. We are also thankful to ADPL, Haridwar, Uttarakhand, whose resources and facilities provided to me with the necessary tools to conduct my experiments effectively.
LIST OF ABBREVIATIONS
| API | : | Active Pharmaceutical Ingredient |
| HPLC | : | High-Performance Liquid Chromatography |
| ICH | : | International Council For Harmonisation |
| RP-HPLC | : | Reverse Phase High Performance Liquid Chromatography |
| BAGI | : | Blue Applicability Gade Index |
| DMH | : | Dextromethorphan Hydrobromide |
| PEH | : | Phenylephrine Hydrochloride |
| CPM | : | Chlorpheniramine Maleate |
| PDA | : | Photodiode Array Detector |
| UPLC | : | Ultra Performance Liquid Chromatography |
| IER'S | : | Ion Exchange Resins |
| UV-Visible | : | Ultraviolet-Visible |
| AR | Analytical Reagent | |
| ARC HPLC | : | A Model Waters Arc High-Performance Liquid Chromatograph |
| OTC | : | Over-The-Counter |
| UOM | : | Unit Of Measure |
| OPA | : | Orthophosphoric Acid |
| RSD | : | Relative Standard Deviation |
| AMV | : | Analytical Method Validation |
| PVDF | : | Polyvinylidene Fluoride |
| LOQ | : | Limit Of Quantitation |
| LOD | : | Limit Of Detection |
| GC | : | Gas Chromatography |
| DAD | : | Diode Array Detector |
| FAAS | : | Flame Atomic Absorption Spectroscopy |
| ETAAS | : | Electrothermal Atomic Absorption Spectroscopy |
| OES | : | Optical Emission Spectroscopy |
| GC | : | Gas Chromatography |
| FID | : | Flame Ionization Detector |
| QC | : | Quality Control |
| SPE | : | Solid Phase Extraction |
| SPME | : | Solid Phase Microextraction |
FUNDING
This research received no funding from public, commercial, or non-profit organizations. It was conducted independently, with no financial support or sponsorship.
AUTHORS CONTRIBUTIONS
Robindra Kumar Pandit conducted research, experiments, and analysis. Vivek Pandey supervised, guided study design, reviewed, and interpreted data. Both approved the manuscript.
CONFLICT OF INTERESTS
There is no conflict of interest to be declared
REFERENCES
Morsi A. Two different chromatographic methods for simultaneous determination of common cold drugs ambroxol hydrochloride pseudoephedrine hydrochloride levocetirizine dihydrochloride and desloratadine in pure forms and pharmaceutical dosage forms. Al-Azhar J Pharm Sci. 2022 Mar 1;65(1):85-106. doi: 10.21608/AJPS.2022.223770.
JI JJ, Zhao J, Xiang P, Yan H, Shen M. Chiral analysis of dextromethorphan and levomethorphan in human hair by liquid chromatography tandem mass spectrometry. Forensic Toxicol. 2022 Jul;40(2):312-21. doi: 10.1007/s11419-022-00620-2, PMID 36454412.
Shakiba S, Fakhraei N, Khan MI, Rastmanesh F, Mohammadi F, Khalilzadeh M. Effect of dextromethorphan in the mouse forced swim and tail suspension tests: evidence for involvement of the alpha receptors. Learn Motiv. 2021 May 1;74:101722. doi: 10.1016/j.lmot.2021.101722.
Fredericks B, Alexander G. A framework for improved classroom communication in the South African schooling context. Heliyon. 2021;7(3):e06382. doi: 10.1016/j.heliyon.2021.e06382, PMID 33748466.
Natishan TK. Recent developments of achiral HPLC methods in pharmaceuticals using various detection modes. J Liq Chromatogr Relat Technol. 2004 Jan 1;27(7-9):1237-316. doi: 10.1081/JLC-120030603.
Goyon A, Staples GO, Stoll DR, Zhang K. Applications of two dimensional liquid chromatography for analysis of synthetic pharmaceutical materials. In: Multi-dimensional liquid chromatography. Boca Raton (FL): CRC Press; 2022. p. 273-91. doi: 10.1201/9781003090557-9.
Simsic T, Planinsek O, Baumgartner A. Taste masking methods in multiparticulate dosage forms with a focus on poorly soluble drugs. Acta Pharm. 2024 Jun 30;74(2):177-99. doi: 10.2478/acph-2024-0015, PMID 38815202.
Chiarugi I, Biagi D, Nencioni P, Maestrelli F, Valleri M, Mura PA. Taste masking of dexketoprofen trometamol orally disintegrating granules by high shear coating with glyceryl distearate. Pharmaceutics. 2024 Jan 24;16(2):165. doi: 10.3390/pharmaceutics16020165, PMID 38399226.
Chiang CW, Tang S, Boonstra JM, Van Tilburg LP, Liu J, Chiang PC. Development of an extemporaneous preparation formulation using a simple and non-solubilizing matrix for first a first-in-human clinical study. Int J Pharm. 2024 Mar 25;653:123868. doi: 10.1016/j.ijpharm.2024.123868, PMID 38309485.
Gaikwad SS, Morales JO, Lande NB, Catalan Figueroa J, Laddha UD, Kshirsagar SJ. Exploring paediatric oral suspension development: Challenges, requirements and formulation advancements. Int J Pharm. 2024 Apr 28;657:124169. doi: 10.1016/j.ijpharm.2024.124169, PMID 38688428.
Patel G, Patel D. Development of taste masked oral dispersible tablets of cefpodoxime proxetil. Pharm Technol. 2024 Mar 3;48(3):22-6.
Ram Munnangi S, Narala N, Lakkala P, Kumar Vemula S, Repka M. Assessing abuse deterrent formulations utilizing ion-exchange resin complexation processed via twin-screw granulation for improved safety and effectiveness. Eur J Pharm Biopharm. 2024 Feb 17;197:114230. doi: 10.1016/j.ejpb.2024.114230, PMID 38373555.
Wang J, GU J, Faustino PJ, Siddiqui A, Zhao Y, Giacoia G. Evaluation of the bioavailability of a tamiflu taste masking pediatric formulation using a juvenile pig model and LC-MS/MS. Bioanalysis. 2024 Jun 10;16(13):681-91. doi: 10.1080/17576180.2024.2352256, PMID 39254502.
Steiner D, Meyer A, Immohr LI, Pein Hackelbusch M. Critical view on the qualification of electronic tongues regarding their performance in the development of peroral drug formulations with bitter ingredients. Pharmaceutics. 2024 May 15;16(5):658. doi: 10.3390/pharmaceutics16050658, PMID 38794320.
Arage A, Layloff T, Hymete A, Ashenef A. High performance thin layer chromatography (HPTLC) method development and validation for the simultaneous determination of paracetamol, caffeine, chlorpheniramine and phenylepherine in tablet formulation. AChrom. 2023 Apr 25;35(2):170-8. doi: 10.1556/1326.2022.01028.
Kul A. Simultaneous determination of chlorpheniramine maleate pseudoephedrine hydrochloride oxolamine citrate and paracetamol by HPLC-PDA in pharmaceutical dosage forms. J Chem Metrol. 2022 Jul 1;16(2):102-10.
Yener B, Erkmen C, Uslu B, Goger NG. Simultaneous determination of paracetamol dextromethorphan chlorpheniramine, pseudoephedrine and major impurities of paracetamol and pseudoephedrine by using capillary electrophoresis. Braz J Pharm Sci. 2022 Aug 8;58:e19836. doi: 10.1590/s2175-97902022e19836.
Saadatmandi A, Sohrabi MR, Kabiri Fard HK. Smart chemometrics spectrophotometry for rapid simultaneous quantitative determination of paracetamol, diphenhydramine and phenylephrine in commercial tablet compared to high-performance liquid chromatography as a reference method. Chemom Intell Lab Syst. 2023;233:104732. doi: 10.1016/j.chemolab.2022.104732.
Vikram PR, Beeraka NM, Patel HB, Kumar P. RP-HPLC-DAD method development and validation of L-lysine hydrochloride: application to bulk drug substance and multivitamin oral suspension. Accred Qual Assur. 2023 Oct;28(5):187-96. doi: 10.1007/s00769-023-01544-z.
Rajput RS, Lariya N. A stability indicating method development and validation of apixaban in pharmaceutical dosage form by using RP-HPLC and in vitro evaluation of apixaban suspension delivery through enteral feeding tubes. JMPAS. 2022;11(1):4358-63. doi: 10.55522/jmpas.V11I1.2195.
Ettaboina SK, Katakam LN, Dongala T. Development and validation of a stability indicating RP-HPLC method for the determination of erythromycin related impurities in topical dosage form. Pharm Chem J. 2022 Apr;56(1):131-7. doi: 10.1007/s11094-022-02610-5.
Padivitage N, Tian J, Wang L, Zhuang J, MC Adoo A, Zhao D. Development and validation of a stability indicating reversed phase HPLC method for assay and estimation of related substances of ivermectin in an oral paste. J Chromatogr Sci. 2023 Feb;61(2):119-29. doi: 10.1093/chromsci/bmab144, PMID 35059727.
Patel F, Kotadiya R, Patel R, Patel M. Development and validation of a new reversed-phase HPLC method for the quantitation of azithromycin and rifampicin in a capsule formulation. J Chromatogr Sci. 2024 Mar 15;62(8):742-50. doi: 10.1093/chromsci/bmae006, PMID 38493305.
Zhao D, Wimalasinghe RM, Wang L, Rustum AM. Development and validation of a reversed phase high performance liquid chromatography (RP-HPLC) method for identification assay and estimation of related substances of ivermectin in bulk drug batches of ivermectin drug substance. J Chromatogr Sci. 2022 Aug;60(7):620-32. doi: 10.1093/chromsci/bmab112, PMID 34530453.
Amin PM, Patel M. Development and characterization of orally disintegrating film of dextromethorphan for improved patient compliance. J Pharm Neg Results. 2022 Sep 1:11176-84.
Patel F, Kotadiya R, Patel R, Patel M. Development and validation of a new reversed-phase HPLC method for the quantitation of azithromycin and rifampicin in a capsule formulation. J Chromatogr Sci. 2024 Mar 15;62(8):742-50. doi: 10.1093/chromsci/bmae006, PMID 38493305.
Patil AS, Amrutkar SV, Nalwade S. Determination of related substances in promethazine hydrochloride and dextromethorphan hydrobromide in oral solution by RP-HPLC method. J Chromatogr Sci. 2024 Mar;62(3):273-80. doi: 10.1093/chromsci/bmad039, PMID 37208993.
Karim AE, Ali MS, Sultan MA, Al Metwali A, Qasim H. Simultaneous determination of chlorpheniramine maleate, dextromethorphan hydrobromide and pseudoephedrine HCl in syrup pharmaceutical form using RP-HPLC. Samarra Journal of Pure and Applied Science. 2023;5(4):78-88. doi: 10.54153/sjpas.2023.v5i4.632.
Reddy CR, Chavva RR. Developed and validated for the estimation of bupropion and dextromethorphan in a fixed-dose combination of tablet. Turk J Pharm Sci. 2024 May 14;21(2):125-32. doi: 10.4274/tjps.galenos.2023.87522.
Aldewachi H, Omar TA. Development of HPLC method for simultaneous determination of ibuprofen and chlorpheniramine maleate. Sci Pharm. 2022 Aug 30;90(3):53. doi: 10.3390/scipharm90030053.
Guide IC Q2 (R1). Validation of analytical procedures, text and methodology. International Conference on Harmonization of Technical Requirements for Registration of Pharmaceuticals for Human Use (ICH) Geneva Switzerland; 2005.
Rajput RS, Lariya N. A stability indicating method development and validation of esomeprazole in pharmaceutical dosage form by using RP-HPLC and in vitro evaluation of nasogastric tube delivery of esomeprazole magnesium delayed release capsules. In Vitro. 2022;11(1):4375-81. doi: 10.22270/jmpas.V11I1.2227.
Chiarugi I, Biagi D, Nencioni P, Maestrelli F, Valleri M, Mura PA. Taste masking of dexketoprofen trometamol orally disintegrating granules by high shear coating with glyceryl distearate. Pharmaceutics. 2024 Jan 24;16(2):165. doi: 10.3390/pharmaceutics16020165, PMID 38399226.
Sharkawi MM, Safwat MT, Abdelaleem EA, Abdelwahab NS. Chromatographic analysis of Bromhexine and oxytetracycline residues in milk as a drug analysis medium with greenness profile appraisal. Anal Methods. 2022;14(41):4064-76. doi: 10.1039/d2ay01462a, PMID 36222094.
Sefid Sefidehkhan Y, Khoshkam M, Amiri M. Chemometrics assisted electrochemical determination of dextromethorphan hydrobromide and phenylephrine hydrochloride by carbon paste electrode. Chem Pap. 2021 Dec;75(12):6565-73. doi: 10.1007/s11696-021-01823-4.
Srivastava S, Dhaneshwar S, Kawathekar N. Stability indicating reversed phase HPLC method development and validation for estimation of phenylephrine in bulk and tablet. Indian J Pharm Educ Res. 2023;57(3s):s798-804. doi: 10.5530/ijper.57.3s.90.
Abdulsattar JO, Hadi H. Paper microfluidic device and spectrophotometry methods for colorimetric detection of phenylephrine hydrochloride in pure and pharmaceutical preparations. Bull Chem Soc Ethiop. 2022 Aug 30;36(4):727-36. doi: 10.4314/bcse.v36i4.1.
Nagarjuna PJ, Tharun Kumar BT, Nalluri BN. Simultaneous analysis of phenylephrine HCl and ketorolac tromethamine in bulk and injectable formulations by RP-HPLC-PDA method. J Drug Deliv Ther. 2020 Aug 15;10(4-s):39-45. doi: 10.22270/jddt.v10i4-s.4204.
Arage A, Layloff T, Hymete A, Ashenef A. High performance thin layer chromatography (HPTLC) method development and validation for the simultaneous determination of paracetamol caffeine chlorpheniramine and phenylepherine in tablet formulation. Acta Chromatographica. 2023 Apr 25;35(2):170-8. doi: 10.1556/1326.2022.01028.
Nasr ZA, Soliman MM, Mohamed EH, Fouad FA. Assessment of the greenness of micellar HPLC method for rapid separation and simultaneous estimation of chlorpheniramine maleate in presence of some co-administered drugs in three pharmaceutical dosage forms using single run. Acta Chromatographica. 2021 Sep 7;34(2):138-49. doi: 10.1556/1326.2021.00883.
Leuva A, Hingu N, Patel P, Dudhatra B, Chauhan S, Vadalia J. Novel HPTLC method for simultaneous estimation from ternary mixture of chlorpheniramine maleate dextromethorphan hydrobromide and phenylephrine hydrochloride in syrup formulations. Ann Pharm Fr. 2024 Jun 1;82(4):718-26. doi: 10.1016/j.pharma.2024.03.001, PMID 38485086.
Alla SR, Seemaladinne R, Cheemalapati S, Doshi OP. A quick and standard pharmaceutical industrial approach to develop a robust analytical method by HPLC. J Sci Eng Res. 2024;11(2):168-73.
Potawale R, Wadje S, Bulbule M, Shirsat V. Simultaneous estimation of terbutaline sulphate ambroxol hydrochloride and guaifenesin in combined dosage form by HPTLC method. Res J Pharm Technol. 2022;15(7):2997-3001. doi: 10.52711/0974-360X.2022.00500.
Manousi N, Wojnowski W, Plotka Wasylka J, Samanidou V. Blue applicability grade index (BAGI) and software: a new tool for the evaluation of method practicality. Green Chem. 2023;25(19):7598-604. doi: 10.1039/D3GC02347H.
Yin L, YU L, Guo Y, Wang C, GE Y, Zheng X. Green analytical chemistry metrics for evaluating the greenness of analytical procedures. J Pharm Anal. 2024 May 25;14(11):101013. doi: 10.1016/j.jpha.2024.101013, PMID 39759968.
Manousi N, Plotka Wasylka J, Samanidou V. Novel sorptive extraction techniques in bioanalysis evaluated by blue applicability grade index: the paradigm of fabric phase sorptive extraction and capsule phase microextraction. TrAC Trends Anal Chem. 2024 Feb 10;172:117586. doi: 10.1016/j.trac.2024.117586.
Mahmoud SA, Abbas AE, katamesh NS. Greenness, whiteness and blueness assessment with spider chart solvents evaluation of HPTLC-densitometric method for quantifying a triple combination anti-helicobacter pylori therapy. Sustain Chem Pharm. 2024 Feb 1;37:101412. doi: 10.1016/j.scp.2023.101412.
Zhou Y, Yan P, Zhao X, Zhang H, Yang Y, Ding J. Development and in vitro/in vivo evaluation of taste masked orodispersible films of dapoxetine hydrochloride using ion exchange resins. Drug Deliv Transl Res. 2025 Jun 16. doi: 10.1007/s13346-024-01764-x, PMID 39821753.
Steiner D, Meyer A, Immohr LI, Pein Hackelbusch M. Critical view on the qualification of electronic tongues regarding their performance in the development of peroral drug formulations with bitter ingredients. Pharmaceutics. 2024 May 15;16(5):658. doi: 10.3390/pharmaceutics16050658, PMID 38794320.
Trofimiuk M, Olechno K, Trofimiuk E, Czajkowska Kosnik A, Ciosek Skibinska P, Glowacz K. Utilization of the drug polymer solid dispersion obtained by ball milling as a taste masking method in the development of orodispersible minitablets with hydrocortisone in pediatric doses. Pharmaceutics. 2024 Aug;16(8):1041. doi: 10.3390/pharmaceutics16081041, PMID 39204386.
Mewada V, Shah J, Jacob S, Shah H, Boddu SH, Nair AB. Improvement of bioavailability of sildenafil citrate through taste-masked orodispersible film for pulmonary hypertension management. AAPS Pharm Sci Tech. 2024 Aug 21;25(7):194. doi: 10.1208/s12249-024-02905-8, PMID 39168908.
Ramadan M. Synthetic colorants: analysis in pediatric over-the-counter drugs (OTCs) by HPLC and exposure risk to children. J Res Pharm. 2024 Nov 1;28(6):2223-35.
Ghanem MI, Ashmawy SM, El Maghraby GM. Intestinal absorption site guided development and evaluation of oral disintegrating controlled release tablets of mirabegron. AAPS Pharm Sci Tech. 2024 Jul 24;25(6):167. doi: 10.1208/s12249-024-02865-z, PMID 39043962.
Rani P, Nanda BP, Paul P, Chawla R, Bhatia R. Exploring advanced strategies in SPME-HPLC-DAD: enhancing analytical precision and diverse applications in modern era. J Liq Chromatogr Relat Technol. 2024 Jun 14;47(6-10):181-200. doi: 10.1080/10826076.2024.2349146.
Zamkovaya AV, Fizor NS, Tsisak AO, Kovpak AV. Study guide for preparation for practical classes in the discipline technology of drugs (industrial technology of drugs). For full time part time and distance learning students. Part 1; 2024.
Zhu C, Chen J, Shi L, Liu Q, Liu C, Zhang F. Development of child friendly lisdexamfetamine chewable tablets using ion exchange resin as a taste masking carrier based on the concept of quality by design (QBD). AAPS Pharm Sci Tech. 2023 Jun 8;24(5):132. doi: 10.1208/s12249-023-02592-x, PMID 37291437.
Zhou Y, Yan P, Zhao X, Zhang H, Yang Y, Ding J. Development and in vitro/in vivo evaluation of taste masked orodispersible films of dapoxetine hydrochloride using ion exchange resins. Drug Deliv Transl Res. 2025 Jan 16. doi: 10.1007/s13346-024-01764-x, PMID 39821753.
Wang P, LI H, Wang Y, Dong F, LI H, Gui X. One of the major challenges of masking the bitter taste in medications: an overview of quantitative methods for bitterness. Front Chem. 2024 Aug 14;12:1449536. doi: 10.3389/fchem.2024.1449536, PMID 39206439.
Taymouri S, Mostafavi A, Talabaki H. Formulation and evaluation of taste masked oral disintegrating tablet containing tolterodine loaded montmorillonite. Res Pharm Sci. 2023 Sep 1;18(5):528-40. doi: 10.4103/1735-5362.383708, PMID 37842521.
Patel F, Kotadiya R, Patel R, Patel M. Development and validation of a new reversed-phase HPLC method for the quantitation of azithromycin and rifampicin in a capsule formulation. J Chromatogr Sci. 2024 Mar 15;62(8):742-50. doi: 10.1093/chromsci/bmae006, PMID 38493305.
Ferlak J, Guzenda W, Osmałek T. Orodispersible films current state of the art, limitations advances and future perspectives. Pharmaceutics. 2023 Jan 20;15(2):361. doi: 10.3390/pharmaceutics15020361, PMID 36839683.
Rampedi PN, Ogunrombi MO, Adeleke OA. Leading paediatric infectious diseases current trends gaps and future prospects in oral pharmacotherapeutic interventions. Pharmaceutics. 2024 Jun;16(6):712. doi: 10.3390/pharmaceutics16060712, PMID 38931836.
Brilhante N, Caratti A, Bizzo H, Squara S, Bicchi C, Cordero C. Artificial intelligence smelling by GC× GC-MS/FID as a tool for food aroma blueprinting: the unique aroma of Brazilian olive oils. In: 14th Multidimensional Chromatography Workshop Guide Book; 2023. p. 73.
XU Y, Sun Q, Chen W, Han Y, Gao Y, YE J. The taste masking mechanism of chitosan at the molecular level on bitter drugs of alkaloids and flavonoid glycosides from traditional Chinese medicine. Molecules. 2022 Nov 2;27(21):7455. doi: 10.3390/molecules27217455, PMID 36364280.
Al Kasmi B, Alsirawan MH, Paradkar A, Nattouf AH, El Zein H. Aqueous and pH-dependent coacervation method for taste masking of paracetamol via amorphous solid dispersion formation. Sci Rep. 2021 Apr 26;11(1):8907. doi: 10.1038/s41598-021-88312-6, PMID 33903654.
Page S, Khan T, Kuhl P, Schwach G, Storch K, Chokshi H. Patient centricity driving formulation innovation: improvements in patient care facilitated by novel therapeutics and drug delivery technologies. Annu Rev Pharmacol Toxicol. 2022 Jan 6;62(1):341-63. doi: 10.1146/annurev-pharmtox-052120-093517, PMID 34990203.
International council for harmonisation of Technical Requirements for pharmaceuticals for human use. Validation Anal Proc. 2023;Q2(R2).
International council for harmonisation of technical requirements for pharmaceuticals for human use. Anal Proc Dev. 2023;Q14.
Talreja S, Tiwari S. Recent advancements in HPLC method development and validation: pushing the boundaries of analysis. Preprints. 2024 Sep 23.
MC Calley DV. Recent developments in HPLC and UHPLC. LC GC Eur. 2024 Jun 15.
Bhati C, Minocha N, Purohit D, Kumar S, Makhija M, Saini S. High performance liquid chromatography: recent patents and advancement. Biomed Pharmacol J. 2022;15(2):729-46. doi: 10.13005/bpj/2411.
Rahaman SM, Chandra A, Biswas R. RP-HPLC method development and validation for simultaneous estimation of curcumin and resveratrol in nano micelle: dual drug dual form simultaneous estimation. Int J App Pharm. 2024;16(3):109-18. doi: 10.22159/ijap.2024v16i3.50276.
Bonagiri P, Malothu N, Nallapaty S, Guntupalli C. Development and validation of a bioanalytical RP-HPLC method for quantification of ifenprodil in rat plasma. J Appl Pharm Sci. 2024 Nov 27. doi: 10.7324/JAPS.2025.180823.
Ulusoy Erol HB, Hestekin CN, Hestekin JA. Effects of resin chemistries on the selective removal of industrially relevant metal ions using wafer-enhanced electrodeionization. Membranes. 2021 Jan 9;11(1):45. doi: 10.3390/membranes11010045, PMID 33435388.
Vasilaki A, Panagiotopoulou E, Koupantsis T, Katsanidis E, Mourtzinos I. Recent insights in flavour enhancers: definition mechanism of action taste enhancing ingredients analytical techniques and the potential of utilization. Crit Rev Food Sci Nutr. 2022 Nov 14;62(32):9036-52. doi: 10.1080/10408398.2021.1939264, PMID 34142890.
Al Kubati SS, Ahmed OS, Saif RM. The evaluation of some brands of levocetirizine dihydrochloride film-coated tablets for quality and equivalence sold in Aden Yemen. Electron J Univ Aden Basic Appl Sci. 2022 Dec 31;3(4):313-21. doi: 10.47372/ejua-ba.2022.4.201.
Song ZJ, Nik Nabil WN, XI ZC, XU HX. Current global status and future development of traditional Chinese medicine in the prevention and treatment of coronavirus disease 2019. World J Tradit Chin Med. 2021 Apr 1;7(2):155-66. doi: 10.4103/wjtcm.wjtcm_43_20.
Advancements in HPLC method development. Pharmaguidelines. 2023 Nov 14.
Rahaman SM, Chandra A, Biswas R. RP-HPLC method development and validation for simultaneous estimation of curcumin and resveratrol in nano-micelle: dual drug dual form simultaneous estimation. Int J App Pharm. 2024;16(3):109-18. doi: 10.22159/ijap.2024v16i3.50276.
Bonagiri P, Malothu N, Nallapaty S, Guntupalli C. Development and validation of a bioanalytical RP-HPLC method for quantification of ifenprodil in rat plasma. J Appl Pharm Sci. 2024 Nov 27. doi: 10.7324/JAPS.2025.180823.
Kothawade SN, V Pande VV. Development and validation of an RP-HPLC method for deferiprone estimation in pharmaceutical dosage form. Asian J Pharm Clin Res. 2023;16(4):100-3. doi: 10.22159/ajpcr.2023.v16i4.47000.
Sharma A, Kumar I, Rana K. RP-HPLC method development and validation for the combination of imiquimod and salicylic acid. Int J Pharm Pharm Sci. 2020;12(9):41-8. doi: 10.22159/ijpps.2020v12i9.38382.
Jadhav S, Bhoir G, Jain V. Method development and validation of rapid isocratic RP-HPLC method for simultaneous estimation of paracetamol caffeine and propyphenazone in pharmaceutical formulation. Asian J Pharm Clin Res. 2024;17(4):83-7. doi: 10.22159/ajpcr.2024.v17i4.49544.
Naresh P, Kumar KV. Leflunomide tablet formulation: development and validation of an RP-HPLC technique. Int J Pharm Pharm Sci. 2023;15(1):16-21. doi: 10.22159/ijpps.2023v15i1.46505.