
Int J App Pharm, Vol 17, Issue 5, 2025, 285-291Original Article
AN LC–ESI-MS/MS METHOD DEVELOPMENTAND ITS VALIDATIONFOR THE QUANTIFICATION OF PRALSETINIB IN K2EDTA HUMANPLASMA
SUNIL DATTATRAY PAWAR*, DEEPAK D. KAYANDE, KOKILA PAWAR, MAZAHAR FAROOQUI, ANIL SHANKARWAR, AMOL DESHPANDE, SUNIL SHANKARWAR
Dr. Babasaheb Ambedkar Marathwada University Aurangabad, Department of Chemistry of S. B. E. S. Collage Aurangabad-431001, Maharashtra, India
*Corresponding author: Sunil Dattatray Pawar; *Email: sunilpaward@yahoo.com.au
Received: 24 Dec 2024, Revised and Accepted: 11 Jun 2025
ABSTRACT
Objective: Aim of the work is to developa simple LC-ESI-MS/MS approach for a sensitive, specific, and quantitative determination of pralsetinib in human K2EDTA plasma.
Methods: The samples were separated using an isocratic mobile phase made up of 0.1%HCOOH, methanol and acetonitrile in 10:70:20(% v/v) fractions. In multiple reaction monitoring mode, mass transitions for pralsetinib were m/z 534.27/302.19 and for asciminib internal standard, they were 450.1/257.10 in positive ionization mode.
Results: Linearity and a high r2 value (>0.99) characterize the calibration curve, which spans 141.5–5660 ng/ml. Theintra-batchaccuracywaswithin-8.44 to 5.69% relative errorandtheprecisionwaswithin3.14 to 4.92%. Theinter-batchaccuracywaswithin-5.26 to 4.63% relative error and the precision was within 3.32 to 4.93%. The extraction recoveries executed at three quality control levels and their mean recovery was 97.45%.
Conclusion: In conclusion, a new approach to evaluating pralsetinib in human K2EDTA plasma has been approved for use in clinical, bioavailability, and bioequivalence investigations, and it may be used to quantify pralsetinib.
Keywords: Pralsetinib, Cancer, LC-MS/MS, K2EDT aplasma, Validation
© 2025 The Authors. Published by Innovare Academic Sciences Pvt Ltd. This is an open access article under the CC BY license (https://creativecommons.org/licenses/by/4.0/)
DOI: https://dx.doi.org/10.22159/ijap.2025v17i5.53561 Journal homepage: https://innovareacademics.in/journals/index.php/ijap
INTRODUCTION
Pralsetinib is approved for treating metastatic non-small cell lung cancer (NSCLC) in adult patients with a confirmed rearranged during transfection (RET) gene fusion, as identified by an FDA-approved test. This treatment is also indicated for adult and pediatric patients aged 12 y and older who are dealing with advanced or metastatic RET fusion-positive thyroid cancer, particularly for those in need of systemic therapy when radioactive iodine is not suitable. The approval for advanced or metastatic RET fusion-positive thyroid cancer was granted under accelerated conditions, relying on the overall response rate and the duration of that response. Continued approval for this indication may depend on the verification and demonstration of clinical benefit in confirmatory trials [1, 2].
Rearranged during transfection (RET) is a type of protein called a receptor tyrosine kinase. It has parts that extend outside the cell, cross the cell membrane, and are inside the cell. RET is important for the right growth of the kidney and nervous system. Constitutive activation of RET happens via chromosomal rearrangements that form 5' fusions of dimerizable domains to the 3' RET tyrosine kinase domain, resulting in ongoing dimerization and autophosphorylation. The most common fusions are KIF5B-RET and CCDC6-RET, and more than 35 genes have been found to fuse with RET. Constitutive stimulation results in heightened downstream signaling and is linked to tumour spread, migration, and proliferation [3].
Pralsetinib molecular weight and chemical formula (fig. 1) are 533.612 g•mol−1 and N-[(1S)-1-[6-(4-fluoropyrazol-1-yl)pyridin-3-yl]ethyl]-1-methoxy-4-[4-methyl-6-[(5-methyl-1H-pyrazol-3-yl)amino]pyrimidin-2-yl]cyclohexane-1-carboxamide [4-6].
There have been no studies reported that use HPLC with tandem mass spectrometry (LC-MSMS) to measure pralsetinib by itself in human K2EDTA plasma. There are two ways reported for using LC-MS/MS with other drugs in rat plasma. The main goal of this study was to establish and test an efficient, accurate method using LC-MSMS to measure pralsetinib in K2EDTA human plasma.
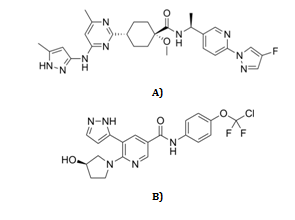
Fig. 1: A) pralsetinib and B) Asciminib chemical structures
MATERIALS AND METHODS
Reagent chemicals
The pure pralsetiniband asciminib standards came from SoluClinipharm Private Limited, in Mumbai, India. Acetonitrile and formic acid that are suitable for HPLC were provided by Finar Chemicals in Ahmedabad, India. HPLC grade water (Millipore, USA) was made by filtering it through a Millipore MilliQ plus device.
Instrument
Quantum Discovery TSQ mass spectrometryanalyzer (Thermo Finnigans, Sans Jose, C. A, USA) with an electrospray ionization interface was used for chromatography. It had an auto sampling and degassing system, and pumps connected to it. The test was done on a Zorbax C18 (50 × 2.1 mm i. d., 3μm particles size) reversed phase column. The Xcalibur program (version 1.4) was used to handle all the tasks, including gathering and analyzingdata.
Mass and liquid chromatographic system conditions
The samples were separated using an isocratic mobile phase consisting of 0.1%HCOOH, methanol, and acetonitrile in 10:70:20(% v/v/v) fractions. The column was maintained at a temperature of 30 °C and a flow rate of 0.5 ml/min. The spray voltage was set to 4500V, the vaporizer temperature to 250 °C, and the capillary temperature to 350 °C in order to monitor multiple reactions. pralsetinib's optimal MS transitions in MRM mode were m/z 534.27/302.19, while asciminib 's were 450.1/257.10 in positive ionization mode.
Processing of calibration, quality control and standard solutions
The IS (1000µg/ml) and the stock solution of pralsetinib (1000µg/ml) were processed individually in methanol and subsequently monitored at 5 °C in a refrigerating system [7-13]. In order to process the standards for working controls for pralsetinib and 250 ng/ml for asciminib (IS), appropriate dilutions were prepared in mobile phase. The standard controls for pralsetinib and asciminib were executed when required and retained in a refrigerator at 2 to 8 °C.
Linearity control solutions of pralsetinib were processed by introducing 1% quantities of control solutions into plasma blank. The calibration curve was determined to have eight levels. The plasma concentrations of pralsetinib were 141.5, 450, 900, 1600, 2400, 3400, 4500 and 5660 ng/ml at the end of the study [14-19]. The quality control (QC) levels were similarly executed with plasma blank to get 141.5ng/ml, 396.2 ng/ml, 2830ng/ml, and 4245ng/ml for the LLOQ, LQC, MQC, and HQC, respectively. The plasma sample preparation procedure was followed for all contaminated samples.
Processing of sample solution
50μL aliquots of each linearity level, Q. C sample solutions, and test solutions were combined with 150μl of aninternal working standard solution (1µg/ml) and shaken vigorously using a vortexer [16-22]. Following vortex mixing, every solution was rapidly cooled by adding 800μl of methanol and subjected to mixing for 30 sec. Mixture was then subjected to centrifugation at 15,000 revolutions per minute for at least 25 min at a temperature of 4 °C. Following centrifugation, the liquid portion above the sediment was meticulously isolated, and 5μl portion was introduced into an LC–ESI-MSMS instrument for quantification.
Validation of the analytical method
Developed an LC–ESI-MSMS technique to assess pralsetinib from biological matrices was validated as per the U. S. FDA bioanalytical method validation guidelines (2018) [7-15]. Developed procedure was subjected for validation for the parameters selectivity, accuracy, linearity, specificity, matrix effect, extraction recoveries, precision, carryover, dilution integrity and stability.
Selectivity
The evaluation of selectivity was conducted using the K2EDTA plasma without any substances present. The assessment of selectivity should indicate that there were no notable interferences detected for IS and pralsetinib retention times in blank plasma [9-12].
Calibration plot and sensitivity
Linearity was detected across eight calibration curves spanning a concentration range of 141.5ng/ml to 5660ng/ml for pralsetinib. The linerarityplots were generated by graphing peak response fractions of pralsetinib to asciminib against the control solutions of linearity controls [10].
Accuracy and precisions
To ensure method's precision and accuracy, every QC level was tested 6 times in 3 separate batches, both intra-day and inter-day. Precision and accuracies findings within a range of ±15% were deemed acceptable, with the exception of concentrations at LLOQ, for which a tolerance of 20% was deemed acceptable [11].
Matrix effect and extraction recoveries
The extraction recoveries was assessed by computing the fraction of response of QC levels containing known quantities of pralsetinib to response of pralsetinib introduced at similar quantities to blank plasma after protein precipitation. This analysis was performed three times (n = 3) [12, 13]. The matrix impact was assessed by comparing the quantities of pralsetinib dissolved into matrix blank extract to those of pure standards (n = 3).
Dilution linearity
Dilution integrity refers to the evaluation of diluting process of the sample to ensure that it does not affect precision and accuracies of assessed concentrations of pralsetinib. The solutions diluted were tested and their precision and accuracies were evaluated to expected findings. Results that fell within a range of ±15% were deemed to be satisfactory in terms of both accuracy and precision [14-17].
Carryover
The carryover was evaluated by measuring peak responses of pralsetinib by injection of blank matrix samples in a sequential manner after the injection of the highest calibration standard sample [16, 19].
Stability
The stability of the human K2EDTA plasma samples was examined by assessing them at two distinct concentration levels of quality control (QC) samples. This analysis was conducted under various settings, comparing the samples against recently created calibration curves and QC samples. The concentrations of the QC samples were 396.2 and 4245 ng/ml, with a total of 6 samples analyzed. The plasma samples underwent storage for a minimum of 6 h at room temperature, at a temperature of-20 °C for ten days, 3 cycles of freezing and thawing, and for 24h at a temperature of 4 °C in auto sampler [19-21].
RESULTS AND DISCUSSION
Validation of the analytical method
Selectivity
Fig. 2 and 3 demonstrate that there was no interference detected in retaining times of pralsetinib (0.83 min) and asciminib (1.14 min) in chromatograms of plasma blank solutions taken from different 6 batches. Findings demonstrated that pralsetinib test exhibited a high degree of specificity and selectivity.
Calibration plot and sensitivity of pralsetinib
Linearity controls were executed and examined at eight distinct concentration levels ranging from 141.5ng/ml to 5660ng/ml. Linearity graph for pralsetinib exhibited satisfactory linearity throughout the specified concentration range, as shown by a mean correlation coefficient (r2) greater than 0.99 [21-26]. The curve was weighted using a factor of 1/x2. The equation for linear regression is y = 0.000442x-0.00665, as shown in table 1. These calculated concentrations fell within the acceptable range of ±15%, except for the LLOQ, where the acceptable range was ±20%.
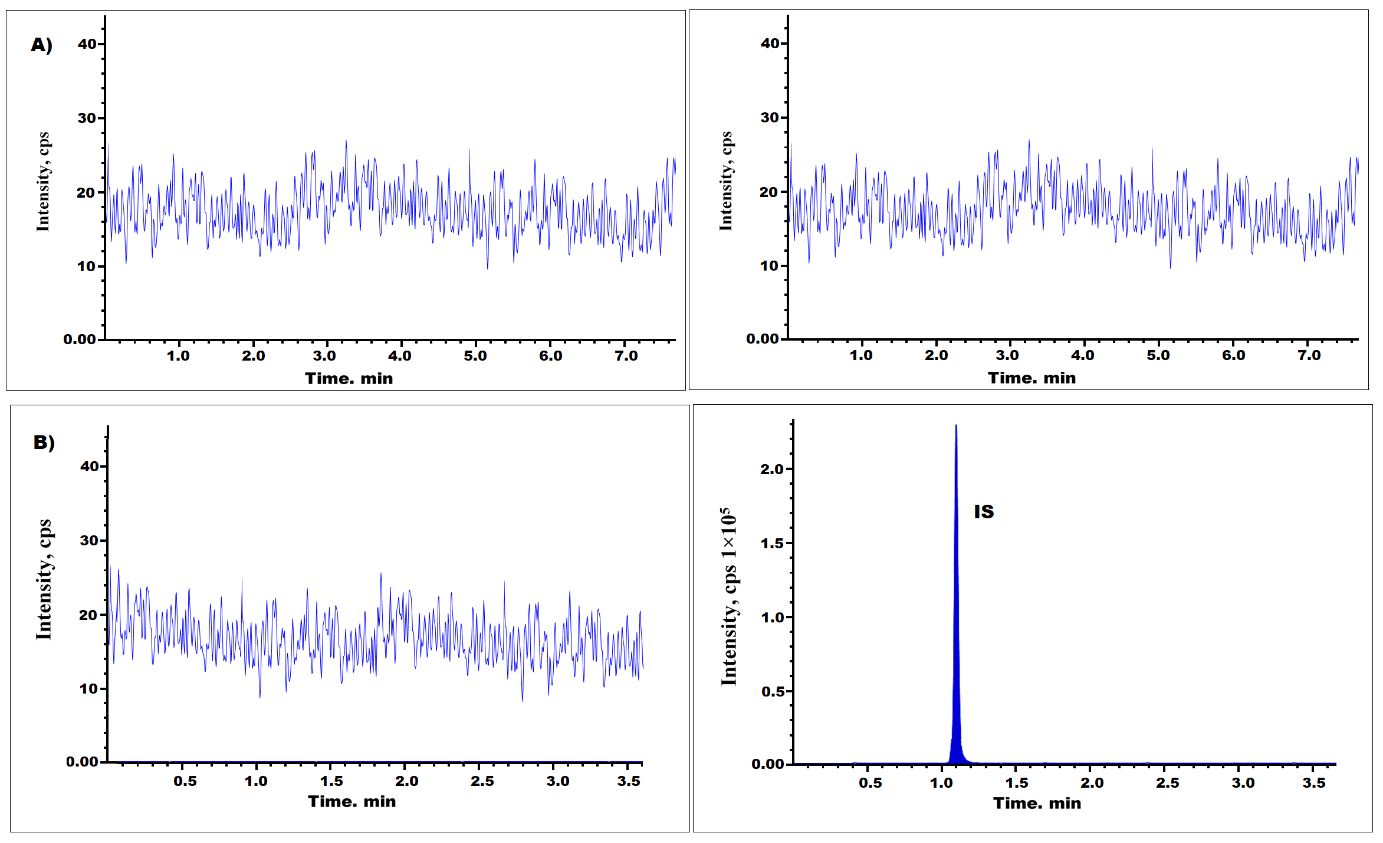
Fig. 2: Pralsetinib chromatograms at blank plasma (A), and blank plasma with IS (B)
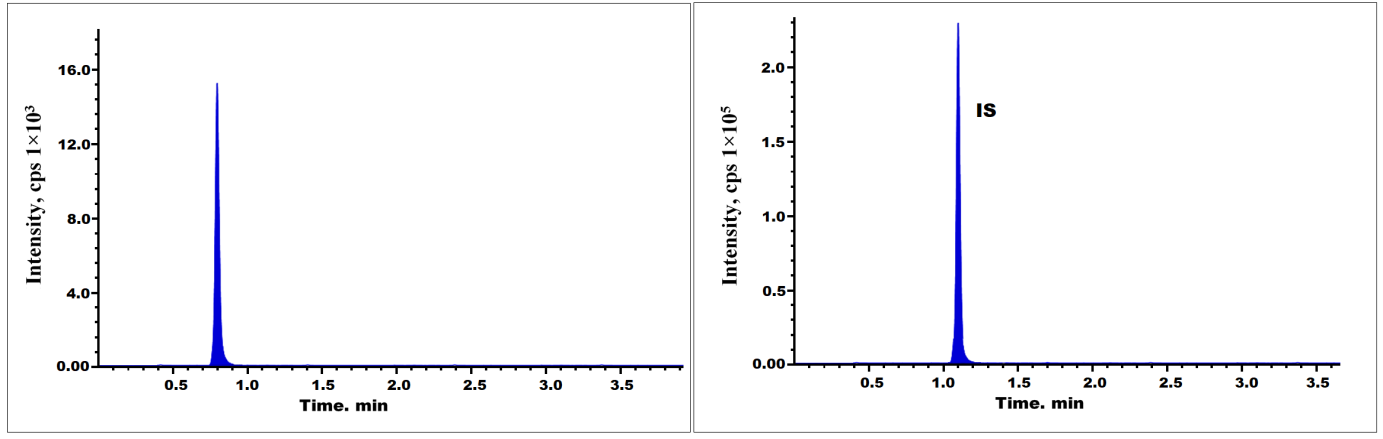
Fig. 3: pralsetinib chromatogram at LLOQ level
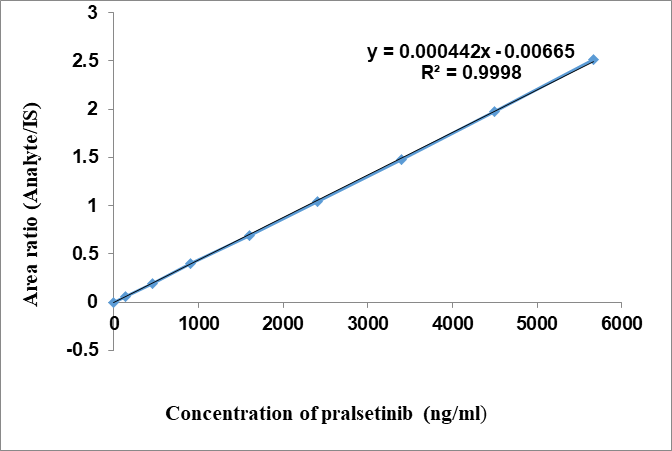
Fig. 4: Linearity of pralsetinib
Table 1: Pralsetinib linearity data
| LS-ID | Concentrations in ng/ml | Meann area | IS area | Analyte/IS area |
| LS1 | 141.5 | 15025 | 243364 | 0.061739 |
| LS2 | 450 | 47782 | 243951 | 0.195867 |
| LS3 | 900 | 96165 | 243457 | 0.394998 |
| LS4 | 1600 | 168893 | 243749 | 0.692897 |
| LS5 | 2400 | 254740 | 243634 | 1.045585 |
| LS6 | 3400 | 360824 | 243368 | 1.482627 |
| LS7 | 4500 | 479026 | 242813 | 1.972819 |
| LS8 | 5660 | 611846 | 242994 | 2.517947 |
LS: Linearity standard; n=6number of replicates.
Precision and accuracies
The intra-batchaccuracy was within 8.44 to 5.69% relative error and the precision was within 3.14 to 4.92%. Theinter-batchaccuracywaswithin-5.26 to 4.63% relative error and the precision was within 3.32 to 4.93%. The assay results, as shown in table 2, were below 15% and met the approved limit. This indicates that the quantification of pralsetinib in human K2EDTA plasma was accurate and precise.
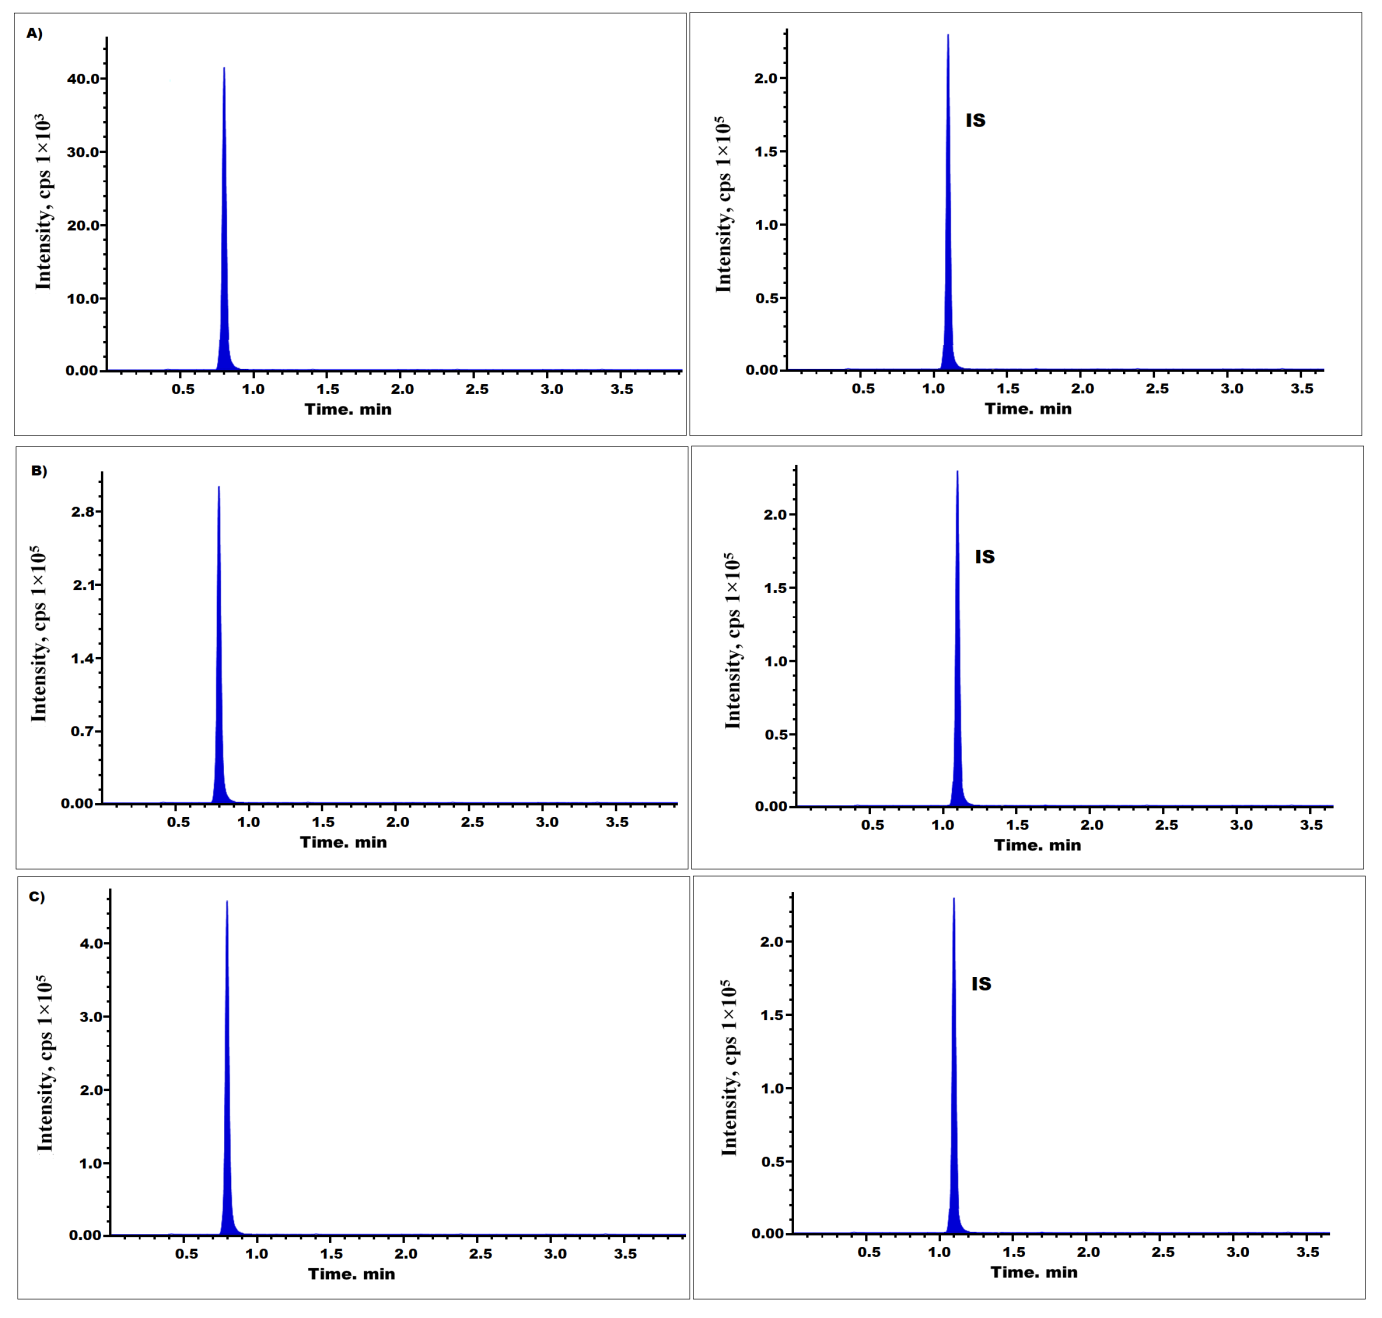
Fig. 5: Pralsetinib chromatograms at LQC (A), MQC (B), and HQC (C) levels
Table 2: Intraday and interday precision and accuracies of pralsetinib
Level of drug spiked (ng/ml) |
Intra-daya | Inter-dayb | |||||
| Concentrations found (mean±SD; ng/ml) | Precision (%RSD) | Accuracy (% RE) | Concentration found (mean±SD; ng/ml) | Precision (% RSD) | Accuracy (%RE) | ||
| Pralsetinib | 141.5 | 139.06±5.35 | 3.85 | -1.73 | 148.06±4.93 | 3.33 | 4.63 |
| 396.2 | 418.76±15.87 | 3.79 | 5.69 | 408.76±16.32 | 3.99 | 3.17 | |
| 2830 | 2591.15±127.38 | 4.92 | -8.44 | 131.81±131.81 | 4.93 | -5.26 | |
| 4245 | 4024.73±126.23 | 3.14 | -5.19 | 136.24±136.24 | 3.32 | -3.19 | |
a: 6 number of replicates; b: 18 number of replicates.
Matrix effects and extraction recoveries
The analysis of extraction recoveries (table 3 and fig. 5) and matrix effect revealed that the extraction recoveries for pralsetinib satisfied the specified parameters, and the matrix impact in this assay was found to be insignificant (table 4).
Dilution integrity
Six duplicate samples, each containing pralsetinib at a concentration of 6 μg/ml, were diluted by factors of 5 and 10 using blank plasma. The analyte exhibited a precision (%CV) of less than 15% and an accuracies within 85-115%.
Carryover
Within the scope of this investigation, the blank matrix samples were evaluated in a sequential manner following the highest linearity concentration, and there was no evidence of a carryover effects.
Stability
Pralsetinib demonstrated stability in human K2EDTA plasma under the following temperature and time conditions: a minimum of 6 h at room temperature, storage at-20 °C for 10 d, exposure to three freeze-thaw cycles, and stored at 4 °C for 24 h in auto sampler. The stability test results are shown in table 5.
Table 3: Pralsetinib extraction recoveries
| QC level | X | Y | % Recoveries | % mean recoveries | %RSD |
| LQC | 42216 | 39602 | 93.81 | 97.45 | 4.34 |
| MQC | 300583 | 286034 | 95.16 | ||
| HQC | 450763 | 465953 | 103.37 | ||
| IS | 243179 | 238169 | 97.94 |
X, average recoveries of (n=3) unextracted samples; Y, average (n=3) recoveries of extracted samples
Table 4: Pralsetinib matrix effect at LQC and HQC levels
| S. No. | LQC | HQC | ||||
| Peak responses in absence of matrices | Peak responses in existence of matrices | Matrix factor | Peak responses in lack of matrices |
Peak areas in presence of matrices |
Matrix factors | |
| 1 | 42147 | 39833 | 94.51 | 453148 | 430944 | 95.1 |
| 2 | 42364 | 40686 | 96.04 | 452753 | 467558 | 103.27 |
| 3 | 42741 | 43749 | 102.36 | 453617 | 431299 | 95.08 |
| 4 | 42073 | 39468 | 93.81 | 452581 | 423706 | 93.62 |
| 5 | 42259 | 39081 | 92.48 | 453624 | 470453 | 103.71 |
| 6 | 42627 | 44464 | 104.31 | 451963 | 425116 | 94.06 |
| Mean±SD | 97.25±4.89 | 97.47±4.69 | ||||
| % RSD | 5.03 | 4.82 | ||||
Table 5: Stability findings of anaytes (n = 3)
| Storage temperature | LQC | HQC | ||
| %Accuracy | Precision | %Accuracy | Precision | |
| 6 h at ambient temperature | 95.28 | 4.01 | 95.32 | 2.84 |
| 4 °C in auto sampler | 94.37 | 3.91 | 98.07 | 3.61 |
| 3 freeze-thaw cycles | 97.01 | 2.87 | 93.64 | 4.37 |
| −20 °C for 10 d | 93.27 | 4.31 | 92.57 | 4.09 |
Recently one method was reported on UPLC-MS/MS for the determination of pralsetinib in Human Plasma and Cerebrospinal Fluid [27] using ACQUITY UPLC HSS T3 column (2.1×100 mm, 1.8 μm) with a gradient elution using 0.1% formic acid (solution A) and acetonitrile (solution B) as mobile phases at a flow rate of 0.4 ml/min. In the present method chromatography was executed on a Zorbax C18 (50 × 2.1 mm i. d., 3μm particles size) reversed phase column with an isocratic mobile phase consisting of 0.1%HCOOH, methanol, and acetonitrile in 10:70:20(% v/v/v) fractions. In the reported method a linear relationship of pralsetinib in both plasma and CSF was successfully established, and the calibration ranges were found to be 1.0-64.0 μg/ml and 50.0ng/ml-12.8 μg/ml for pralsetinib in the plasma and CSF, respectively. In the current method linearity was detected across eight calibration curves spanning a concentration range of 141.5ng/ml to 5660ng/ml for pralsetinib. The equation for linear regression is y = 0.000442x-0.00665.
CONCLUSION
Aim of the work is to present a simple LC-ESI-MS/MS approach for a sensitive, specific, and quantitative determination of pralsetinib in human K2EDTA plasma. The samples were separated using an isocratic mobile phase made up of 0.1%HCOOH, methanol and acetonitrile in 10:70:20 (% v/v) fractions. In multiple reaction monitoring mode, mass transitions for pralsetinib were m/z 534.27/302.19 and for asciminib internal standard, they were 450.1/257.10 in positive ionization mode. Linearity and a high r2 value (>0.99) characterize the calibration curve, which spans 141.5–5660 ng/ml. The intra-batch accuracy was with in-8.44 to 5.69% relative error and the precision was within 3.14 to 4.92%. The inter-batch accuracy was with in-5.26 to 4.63% relative error and the precision was within 3.32 to 4.93%. The extraction recoveries executed at three quality control levels and their mean recovery was 97.45%. As per the bioanalytical technique validation guideline, the LC-MS/MS method was validated in terms of accuracy, linearity, precision, specificity, stability, dilution integrity, extraction recoveries,
ACKNOWLEDGMENT
We would like to thank all Scientist and Research guides who supported and shared valuable guidance for the Novel “LC-MS-MS method development and validation for anticancer drug”. Thanks for the research laboratories CDMO-APSL Analytical research and Development, SBES collage of science, Dept. Chemistry and DR. BAMU Aurangabad, Department of Chemistry. Special thanks to Specialist statistical Programmer Mrs. Kokila Pawarfor the data collection, tabulation and statistical treatment and other research scientist Rohit Wakoadkar and Sripad Deshpande.
FUNDING
Nil
AUTHORS OF CONTRIBUTIONS
Sunil Dattatray Pawar performed the research work and prepared the manuscript. Deepak D Kayande, Kokila Pawar, Mazahar Farooqui, Anil Shankar war, Amol Deshpande, and Sunil Shankar war were corrected the manuscript.
CONFLICT OF INTERESTS
Declared none
REFERENCES
Russo A, Lopes AR, McCusker MG, Garrigues SG, Ricciardi GR, Arensmeyer KE. New targets in lung cancer (excluding EGFR, ALK, ROS1). Curr Oncol Rep. 2020 Apr 16;22(5):48. doi: 10.1007/s11912-020-00909-8, PMID 32296961.
Li AY, McCusker MG, Russo A, Scilla KA, Gittens A, Arensmeyer K. RET fusions in solid tumors. Cancer Treat Rev. 2019 Dec;81:101911. doi: 10.1016/j.ctrv.2019.101911, PMID 31715421.
Subbiah V, Yang D, Velcheti V, Drilon A, Meric Bernstam F. State of the art strategies for targeting RET-dependent cancers. J Clin Oncol. 2020 Apr 10;38(11):1209-21. doi: 10.1200/JCO.19.02551, PMID 32083997.
Stinchcombe TE. Current management of RET rearranged non-small cell lung cancer. Ther Adv Med Oncol. 2020 Jul 26;12:1758835920928634. doi: 10.1177/1758835920928634, PMID 32782485.
Subbiah V, Gainor JF, Rahal R, Brubaker JD, Kim JL, Maynard M. Precision targeted therapy with BLU-667 for RET-driven cancers. Cancer Discov. 2018 Jul;8(7):836-49. doi: 10.1158/2159-8290.CD-18-0338, PMID 29657135.
Takahashi M, Ritz J, Cooper GM. Activation of a novel human transforming gene ret by DNA rearrangement. Cell. 1985 Sep;42(2):581-8. doi: 10.1016/0092-8674(85)90115-1, PMID 2992805.
US department of health and human services food and drug administration center for drug evaluation and research (CDER) center for veterinary medicine (CVM). FDA Guidance for Industry Bioanalytical Method Validation; 2001 May.
Q2B. Harmonized tripartite guideline validation of analytical procedure: methodology. Proceedings of the International Conference on Harmonization Geneva International Conference on Harmonization. International Federation of Pharmaceutical Manufacturers Associations; 1996.
Henion J, Brewer E, Rule G. Sample preparation for LC/MS/MS: analyzing biological and environmental samples. Anal Chem. 1998 Oct 1;70(19):650A-6A. doi: 10.1021/ac981991q, PMID 9784742.
Tandrima M, Shiva Kumar G. Development and validation of LC–MS/MS method for alpelisib quantification in human plasma: application to pharmacokinetics in healthy rabbits. J Appl Pharm Sci. 2023 Mar;13(3):89-96. doi: 10.7324/JAPS.2023.75269.
Khadernaick AB, Gubbiyappa KS. Application of validated LC-MS/MS method development to quantify pexidartinib in biological media: in vivo bioavailability studies in healthy rabbits. J Appl Pharm Sci. 2021 Jun;11(6):78-86. doi: 10.7324/JAPS.2021.110609.
Song E, Shim WS, Choi D, Song Y, Jo HG, Lee S. Development of a simple and validated LC-MS/MS method for quantitative determination of ketotifen in beagle dog plasma and its application to bioequivalence study of ketotifen syrup dosage form. Molecules. 2024 Sep 23;29(18):4505. doi: 10.3390/molecules29184505, PMID 39339502.
Dadhaniya T, Chaudhary K, Mehta P. Development of LC-MS/MS method for determination of iloperidone in rabbit plasma: application to a pharmacokinetic study. Int J Pharm Pharm Sci. 2013;7(4):294-7.
Shankar CH, Bhikshapathi D, Arjuna RN, Sadasivam RK. Bioanalytical method development and validation for the quantitation of larotrectinib in human plasma: application to pharmacokinetics in healthy rabbits. J Appl Pharm Sci. 2023;13(11):111-8. doi: 10.7324/JAPS.2023.127799.
Puttagunta SB, Shaik RP, Bannoth CK, Challa BS, Awen BZ. Bioanalytical method for quantification of solifenacin in rat plasma by LC-MS/MS and its application to pharmacokinetic study. J Anal Sci Technol. 2014;5(1):35. doi: 10.1186/s40543-014-0035-0.
Hoetelmans RM, Van Essenberg M, Meenhorst PL, Mulder JW, Beijnen JH. Determination of saquinavir in human plasma saliva and cerebrospinal fluid by ion-pair high performance liquid chromatography with ultraviolet detection. J Chromatogr B Biomed Sci Appl. 1997;698(1-2):235-41. doi: 10.1016/s0378-4347(97)00268-5, PMID 9367213.
Ravi Y, Bhikshapathi D, Cheruku S, Rajkamal B. Development of fast and simple LC-ESI-MS/MS technique for the quantification of regorafenib; application to pharmacokinetics in healthy rabbits. Curr Pharm Anal. 2021 Jun;17(4):554-63. doi: 10.2174/1573412916666191111144707.
Lolla S, Gubbiyappa KS, Cheruku S, Bhikshapathi DV. Validation of an LC-MS/MS method for quantitation of fostemsavir in plasma. J Pharmacol Toxicol Methods. 2023 Mar-Apr;120:107254. doi: 10.1016/j.vascn.2023.107254, PMID 36863666.
He Y, Miggiels P, Wouters B, Drouin N, Guled F, Hankemeier T. A high throughput ultrafast and online three phase electro extraction method for analysis of trace level pharmaceuticals. Anal Chim Acta. 2021 Mar;1149:338204. doi: 10.1016/j.aca.2021.338204, PMID 33551054.
Ji YS, Kim TK. Pharmacokinetic studies of a novel tubulin inhibitor SK1326 in rat plasma by UPLC-MS/MS. Biomed Chromatogr. 2020 Apr;34(4):e4749. doi: 10.1002/bmc.4749, PMID 31743475.
He Y, Drouin N, Wouters B, Miggiels P, Hankemeier T, Lindenburg PW. Development of a fast online three phase electroextraction hyphenated to fast liquid chromatography mass spectrometry for analysis of trace level acid pharmaceuticals in plasma. Anal Chim Acta. 2022 Feb 1;1192:339-64. doi: 10.1016/j.aca.2021.339364, PMID 35057963.
Vogg N, Kurzinger L, Kendl S, Pamporaki C, Eisenhofer G, Adolf C. A novel LC-MS/MS-based assay for the simultaneous quantification of aldosterone-related steroids in human urine. Clin Chem Lab Med. 2023 Nov;62(5):919-28. doi: 10.1515/cclm-2023-0250.
Kiran G Sai Uday, Sandhya P, Shankar CH, Bhikshapathi DV, Mamatha P. An LC–MS/MS quantification method development and validation for the dabrafenib in biological matrices. J Appl Pharm Sci. 2023 Jan;13(1):180-6. doi: 10.7324/JAPS.2023.130117.
Sellappan M, Devakumar D. Development and validation of RP-HPLC method for the estimation of escitalopram oxalate and flupentixoldihydrochloride in combined dosage form and plasma. Int J Pharm Pharm Sci. 2021 Feb;13(2):61-6. doi: 10.22159/ijpps.2021v13i2.30158.
Gurav P, Damle M. Bioanalytical method for estimation of teriflunomide in human plasma. Int J Pharm Pharm Sci. 2022 Sep;14(9):19-23. doi: 10.22159/ijpps.2022v14i9.45151.
Ravi Y, Bhikshapathi D, Cheruku S, Rajkamal B. Development of fast and simple LC-ESI-MS/MS technique for the quantification of regorafenib; application to pharmacokinetics in healthy rabbits. CPA. 2021 Apr;17(4):554-63. doi: 10.2174/1573412916666191111144707.
Zhao Z, Pu Q, Sun T, Huang Q, Tong L, Fan T. Determination of pralsetinib in human plasma and cerebrospinal fluid for therapeutic drug monitoring by ultra-performance liquid chromatography tandem mass spectrometry (UPLC-MS/MS). Anti Cancer Agents Med Chem. 2024;24(11):867-77. doi: 10.2174/0118715206290110240326071909, PMID 38584556.