
Int J App Pharm, Vol 17, Issue 5, 2025, 465-470Original Article
STABILITY INDICATING LC–ESI-MS/MS METHOD DEVELOPMENT AND VALIDATION FOR THE QUANTITATION OF LURBINECTEDIN IN BIOLOGICAL MATRICES
MANTRAVADI ANUSHA, RAMREDDY GODELA*, KUMAR SHIVA GUBBIYAPPA
Department of Pharmaceutical Analysis, GITAM School of Pharmacy, GITAM Deemed to be Univeristy, Rudraram, Patancheru, Telangana, India
*Corresponding author: Ramreddy Godela; *Email: rgodela@gitam.edu
Received: 24 Dec 2024, Revised and Accepted: 11 Jun 2025
ABSTRACT
Objective: A new and validated liquid chromatography-tandem mass spectrometry (LC-MS/MS) method was developed and used for the quantitative analysis of the anticancer drug Lurbinectedin in plasma samples.
Methods: Liquid-liquid extraction method was used to extract the Lurbinectedin from plasma, and Ledipasvir was used as an internal standard (IS), Chromatographic separation of Lurbinectedin was accomplished with Zorbax SB-C18 column (250 mm×4.6 mm, 5 µm) using a mobile phase comprises of 0.1% v/v formic acid and acetonitrile (10:90, v/v) pumped at a flow rate of 0.80 ml/min. The total run time for Lurbinectedin and internal standard elution was 3.5 min. The linearity was attained for a concentration range of 1.50–5000 ng/ml with a correlation coefficient (r²) of 0.9994 by the optimized method. The lower limit of quantification (LLOQ) was established at 1.50 ng/ml, which resembles the sensitivity of the method toward Lurbinectedin.
Results: The method showed high accuracy, ranging from 95.31% to 104.06% of nominal values, with intra-and inter-day precision within a 4.32% coefficient of variance (%CV). Matrix effects at the low-quality control (LQC) level varied between 94.25% and 104.85% (%CV: 4.61), while at the high-quality control (HQC) level, they ranged from 94.62% to 103.88% (%CV: 4.02). The mean recovery across all control standards was 95.58%.
Conclusion: Stability assessments confirmed the robustness of the method. The developed LC-MS/MS approach is reliable for routine bioanalytical applications, including quality control, pharmacokinetic studies, and bioequivalence assessments of Lurbinectedin in biological matrices.
Keywords: Lurbinectedin, LC-ESI-MS/MS, Bioanalytical method, Precision, Sensitivity, Zorbax SB-C18 column
© 2025 The Authors. Published by Innovare Academic Sciences Pvt Ltd. This is an open access article under the CC BY license (https://creativecommons.org/licenses/by/4.0/)
DOI: https://dx.doi.org/10.22159/ijap.2025v17i5.53562 Journal homepage: https://innovareacademics.in/journals/index.php/ijap
INTRODUCTION
A DNA alkylating medication known as Lurbinectedin has been investigated for potential use in treating many cancers, including CLL (fig. 1), mesothelioma, breast cancer, and SCLC. The anticancer chemical Ecteinascidin (trabectedin) is derived from the marine tunicate Ecteinascidia turbinata. The primary change is that Lurbinectedin is more effective against tumors than trabectedin due to the substitution of a tetrahydro β‐carboline for tetrahydroisoquinoline [1].
As it binds to guanine residues in the DNA's minor groove, it generates adducts that cause the DNA helix to bend toward the major groove. A cascade of events begins at this step, altering the function of transcription factors and decreasing the efficacy of DNA repair pathways. Ultimately, this leads to cell death by breaking double-stranded DNA. It also inhibits RNA-polymerase-II activity, nucleotide transfer inhibits EWS-FL11 protein expression, and inhibits human monocyte activity and macrophage entrance into tumor tissue, among other mechanisms [2].
Strong DNA attachment is the mechanism by which Lurbinectedin exerts its chemotherapeutic action, causing DNA strand breakage and cell death [3]. Because Lurbinectedin has been associated with myelosuppression, patients using this medication should have cytopenias monitored carefully. Verify that the platelet count is more than 100,000/mm3 and the neutrophil count is greater than 1,500 cells/mm3 prior to beginning therapy. If the neutrophil count falls below 500 cells/mm3, it may be prudent to consider administering granulocyte colony-stimulating factor (G-CSF). Lurbinectedin has also been associated with liver damage. During and after therapy, it is important to monitor liver function tests. Delaying, reducing, or discontinuing treatment entirely may be necessary depending on the severity of the hepatotoxicity [4-6].
There are just two published protocols on LCMS/MS in the literature on Lurbinectedin [7, 8]. Nicholas et al. developed a method having a calibration curves displayed good linearity over 0.1 to 50 ng/ml for lurbinectedin and 0.5 to 20 ng/ml for the metabolites. This method has poor recovery results with a 12.9% error [7]. Andel et al. developed a method having linearity up to 100 ng/ml [8]. The method was linear over 0.1–100 ng/ml and 1–1000 ng/ml in plasma and urine, respectively, with accuracies and precisions within ±15% (20% for LLOQ) and below 15% (20% for LLOQ), respectively. The fields of pharmacodynamics, forensics, and pharmacokinetics studies require specific methods with good recovery values. Hence, there is a need for an LC-MS/MS approach to studying human K2 EDTA plasma.

Fig. 1: Chemical structure of lurbinectedin
MATERIALS AND METHODS
Reagent chemicals
Hetero Pharmaceuticals of Hyderabad, India, supplied the Ledipasvir (with a purity level of 99.52 percent). The drug Lurbinectedin was sourced from Selleck Chemicals in Houston, Texas, USA. Plasma from the Vivekananda Blood Bank in Hyderabad, India, which is devoid of drugs and contains the anticoagulant K2-EDTA, was obtained. The study effort used an HPLC-water purification system developed by Millipore in the United States of America, known as MilliQ. We sourced our high-grade ethyl acetate, ammonium acetate, HCOOH, acetonitrile, and HPLC-grade methanol from local vendors.
Standard preparation
A methanolic solution containing 1000 μg/ml of each analyte (Lurbinectedin and Ledipasvir) was processed by dissolving 100 mg of Lurbinectedin and Ledipasvir in 100 ml of methanol individually. Lurbinectedin concentration range of 1.50 to 5000ng/ml was achieved by subjecting the resulting solution to successive dilutions with methanol.
Linearity standards preparation
In order to prepare the calibration standards, 960μl of pooled plasma containing K2EDTA was combined with 20μl of Lurbinectedin and IS standard solution. The concentrations of Lurbinectedin and IS were selected based on the final concentration to be produced, like LQC, MQC and HQC etc [9-15]. Solutions with concentrations ranging from 1.5 to 5000.0 ng/ml were made and kept in a freezer at temperatures below-20 °C.
Quality control standards
High-quality control (HQC), Median-quality control (MQC), and low-quality control (LQC) standards were processed at three different concentrations [14-18]. The QC (quality control) solutions were adjusted to 3750.00 ng/ml for HQC, 2500.00 ng/ml for MQC, and 4.2 ng/ml for LQC according to the calibration standard solutions.
Internal standard preparation
In the present study, ledipasvir was selected as an internal standard for the reason of the similarity of solubility in methanol, acetonitrile and chromatographic separation with Lurbinectedin. A distinct conical flask was used for processing 1 mg/ml stock quantities of ledipasvir in acetonitrile, with the internal standard serving as ledipasvir [17-20]. A 1µg/ml solution was obtained by diluting the resulting stock with acetonitrile.
Sample processing
The plasma sample solution was processed by adding 50µl* of ledipasvir (1µg/ml) and Lurbinectedin to 200µl of blank plasma in a pre-labeled tube and sonicating it for 10 min. Centrifugation was processed at 3500 rpm/min for 20 min to extract Lubinectedin and ledipasvir from a solution containing 5.0 ml of a solvent system consisting of ethyl acetate and dichloromethane in a 3:1 ratio. The organic phase was separated and then dried using a lyophilizer [12-18]. A 250µl solution of a moveable solvent was added to the residue and transferred into a vials to inject into the LC-MS/MS system.
Chromatographic conditions
An isocratic mobile phase containing 0.1 %V/V ACN(acetonitrile) and HCOOH in a proportion of 90:10, (%v/v) was used at 0.80 ml/min flowrate of, and 10µl* of the sample was injected onto an RP-Zorbax SB (250 mm x 4.6 mm, 5 µm) C18 analytical column. A total of 3.5 min were spent chromatographically, with the analytical column maintained at 45 °C. The chromatographic system used a combination of a Shimadzu HPLC and an Applied Biosystems API-5000 mass spectrometer.
Mass equipment
In order to accomplish MRM, the +ve ionization method made use of the electro spray ionization technique. The operational parameters were adjusted as shown in table 1 by injecting a diluted drug stock solution. Pressures of 45 psi were used for auxiliary gas (GS2) and 40 psi were used for nebulizer gas (GS1). Our starting point was 280 degrees Celsius. Unit resolution was used to monitor Q3 and Q1. Excellent peak intensities were achieved by improvising protonation of analytes when HCOOH was added to the mobile phase. Lurbinectedin was monitored in MRM mode at m/z 785.30/725.30, whereas ledipasvir was monitored at m/z 889.42/130.10. Using the analyst software 1.5.1 regression line, we were able to estimate the sample concentrations. This technique made use of peak response ratios.
Validation
Following USFDA guidelines, the developed LC-MS/MS work was validated for specificity, sensitivity, accuracy, linearity, precision (both between and within days), precision, stability, and correctness [9-16].
RESULTS AND DISCUSSION
Method development
In order to quantify very minute amounts of pharmaceutical formulations present in biological sample solutions using the selective and sensitive LC-MS/MS technique, precise and effective sample clean-up procedures were necessary. When processing biological materials, three procedures were often used: protein precipitation (PPT), liquid-liquid extraction (LLE), and solid-phase extraction (SPE). Although the organic segment protein precipitation strategy was straightforward, it was not without the possibility of interference from matrix components. After that, we gave LLE a go using dichloromethane and ethyl acetate as solvents. The final solvent for sample extraction was a mixture of ethyl acetate and dichloromethane at a ratio of 3:1, and it produced excellent recovery.
Method validation
Selectivity
Eight separate lots of K2 EDTA human plasma, one lipemic lot, and one hemolytic lot were used to establish method selectivity [10-13]. When the peak regions of the blanks and spiked LLOQ standards made of IS mixtures were compared, no interference components were found during the drug and IS retention times. As shown in fig. 2.
Recovery
The approach demonstrated strong analytical capabilities, yielding consistent and respectable recovery levels of Lurbinectedin and IS [14-16]. Assembling peak responses from spiking plasma samples (n = 6) prior to extraction with aqueous sample solutions allowed for the assessment of analyte extraction recoveries. Overall, 95.58% of QC criteria showed recovery, with a degree of accuracy. Data from fig. 3 to 5 and table 2 demonstrate that the IS recovery rate was 97.75%.
Table 1: Lurbinectedin and internal standard mass profiles
| Analyte/IS | Declustering potential (DP) (V) | Collision-activated dissociation (CAD) (psi) | Dwell time (ms) | Entrance potential (EP) (V) | Curtain gas flow (CUR) (psi) | Collision cell exit potential (CXP) (V) | Collision energy (CE) (V) | Ion source voltage (V) |
| Ledipasvir | 35 | 8 | 400 | 10 | 30 | 12 | 20 | 4500 |
| Lurbinectedin | 30 | 8 | 400 | 10 | 30 | 17 | 18 | 4500 |
Table 2: Rates of analyte extraction and recoveries
| Concentration | X | Y | % Recovery | % mean recovery | %RSD |
| HQC | 1324762 | 1257199 | 94.92 | 95.58 | 0.85 |
| MQC | 875456 | 846565 | 96.44 | ||
| LQC | 1484 | 1421 | 95.62 | ||
| IS | 452263 | 440846 | 97.73 | ||
| X, mean recoveries of un-extracted samples; Y, mean recoveries of extracted samples. |
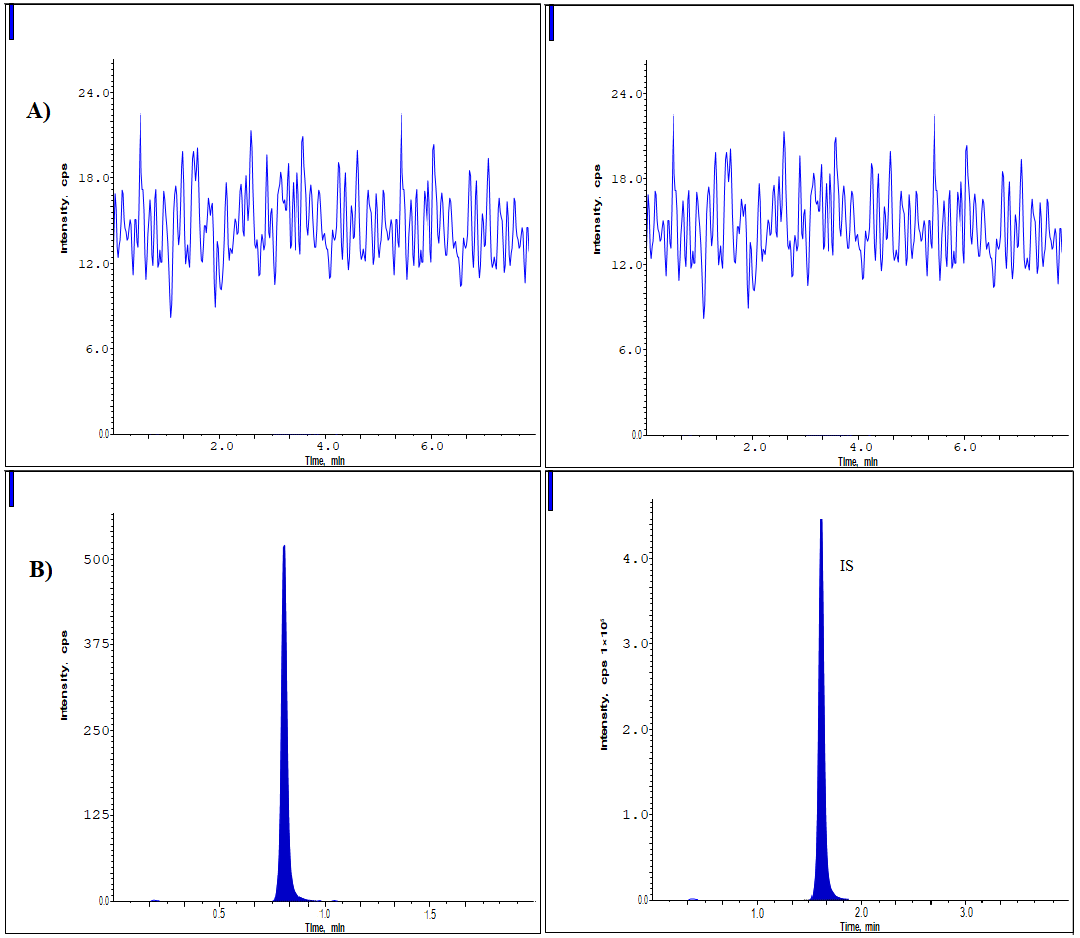
Fig. 2: Chromatograms of (A) Blank and (B) LLOQ samples
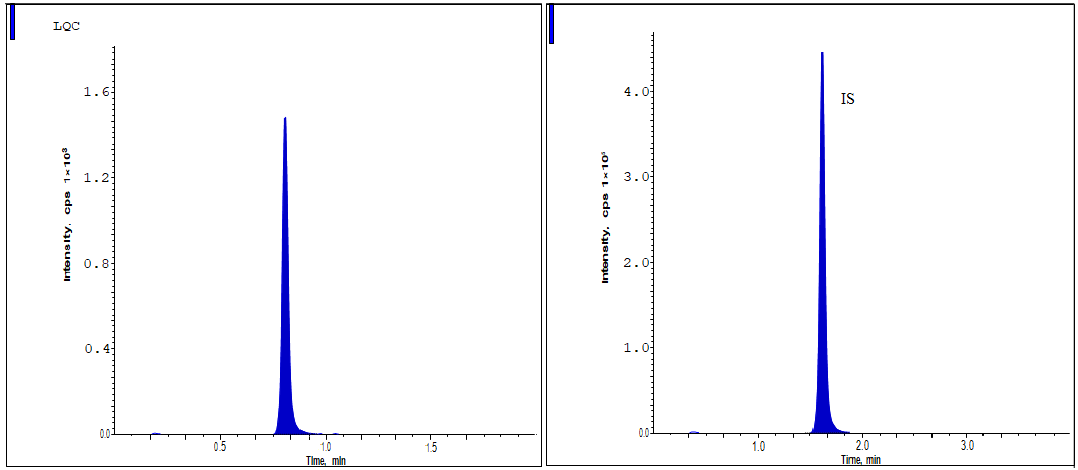
Fig. 3: The LQC standard shows the chromatographic peaks of lurbinectedin
Sensitivity and linearity
Analyte concentrations between 1.5 and 5000.00 ng/ml were used to produce an eight-point calibration curve. In order to assess the linear response of the calibration curve, the contrast between the drug concentration (x) and the fractions of the peak responses(y) to IS were shown. Equation y= 0.003216 x+0.00428 was determined to be linear, and the correlation coefficient was more than 0.999 (0.9994). Accurate values for each calibration standard were obtained by back-measuring the concentration measurements. The analyte's accuracy ranges for the calibration points were 95.41 to 103.93 [17, 18]. The results showed that the analyte had a precision of<4.19 and an accuracy of 96.42% at the LLOQ. Lurbinectedin has an LLOQ of 1.50 ng/ml according to the method. Accordingly, the results of the bioavailability experiments indicate that the method that was devised is superior.
Precision and accuracy
For each analytical concentration, we analyzed six duplicate solutions at QC levels (n = 6) using four different standards to determine the accuracy and precision between and within days [19-22]. The following concentrations were used as controls: 3750.00 ng/m (HQC), 2500.00ng/ml (MQC), 4.20 ng/ml (LQC), and 1.50 ng/ml (LLOQ). Table 3 displays the results for accuracy and precision. Within 4.32% of the nominal values, both interday and intraday precisions were achieved, and assay accuracies ranged from 95.32% to 104.06%.
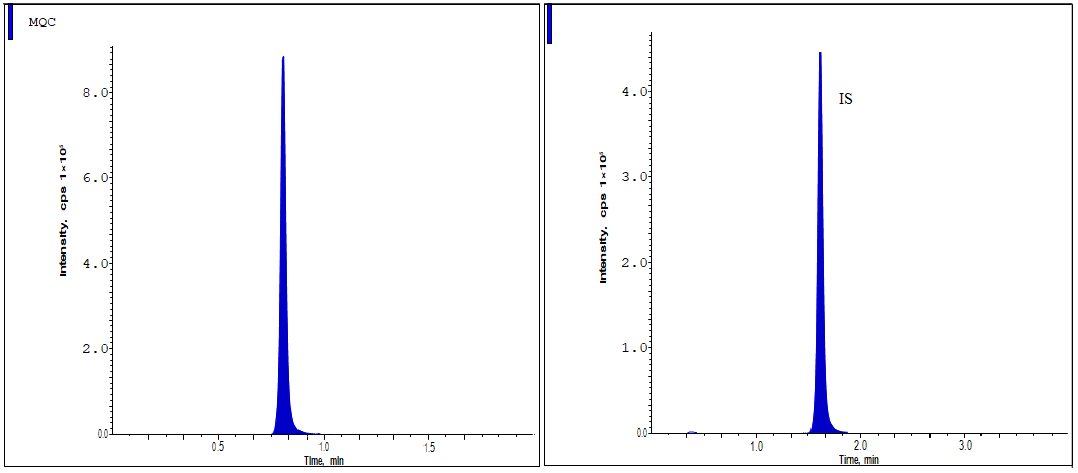
Fig. 4: The MQC standard shows the chromatographic peaks of Lurbinectedin
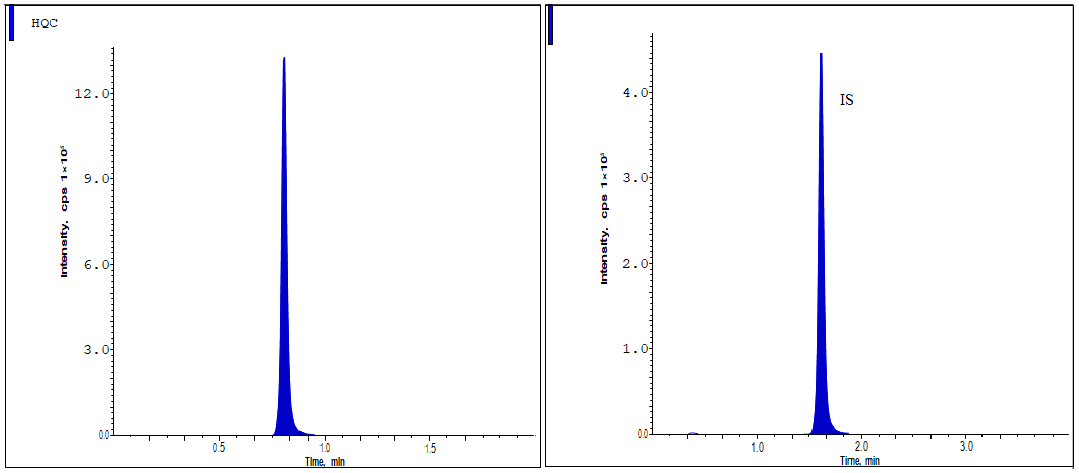
Fig. 5: The HQC standard shows the chromatographic peaks of lurbinectedin
Table 3: Intra and Inter batch, accuracy and precision
| Concentration level |
Concentration (ng/ml) |
Intra-batch | Inter-batch | ||||
| Amount found (ng/ml) |
% Accuracy |
%RSD | Amount found (ng/ml) |
% Accuracy |
%RSD | ||
| HQC | 3750.00 | 3613.51±65.23 | 96.37±8.95 | 1.75±0.3 | 3902.25±45.65 | 104.06±12.65 | 4.12±5.3 |
| MQC | 2500.00 | 2593.76±56.85 | 103.76±15.88 | 3.21±0.28 | 2466.75±31.21 | 98.67±15.24 | 3.92±0.2 |
| LQC | 4.20 | 4.03±0.34 | 96.25±13.28 | 2.89±0.47 | 4.31±0.84 | 102.55±6.54 | 2.53±0.31 |
| LLOQ | 1.50 | 1.45±0.47 | 97.53±18.52 | 4.32±1.24 | 1.43±0.85 | 95.31±10.8 | 3.16±0.23 |
RSD, Relative standard deviations, All the values were expressed in (n=6) Mean±SD
Matrix effects
Eight different lots, including lipemic-1 and hemolytic-1, were used to collect blank plasma samples in order to evaluate this parameter. Following the sample preparation procedure, 100 µl of blanks plasma was taken from each lot and processed [22]. Aqueous and post-extracted solutions were subjected to either HQCor LQC processing. The formula for estimating the matrix effect was as follows: % Matrix effect= A2/A1×100, where A1 is the peak responses of the aqueous samples and A2 is the peak responses of the post-extraction sample. Statistical analysis revealed that the analyte's mean matrix factor ranged from 94.25% to 104.85% at the LQC level and from 94.62% to 103.88% at the HQC level (table 4).
Table 4: Matrix effect of the sample at both the HQC and LQC levels
| S. No. | LQC | HQC | ||||
| Conc. in absence of matrix | Conc. in presence of matrix | Matrix factor | Conc. in absence of matrix | Conc. In presence of matrix | Matrix factor |
|
| 1 | 2510.47 | 2390.97 | 95.25 | 4.03 | 3.82 | 94.87 |
| 2 | 2481.86 | 2374.42 | 95.66 | 3.98 | 3.83 | 97.51 |
| 3 | 2472.68 | 2530.56 | 102.33 | 4.13 | 3.96 | 96.35 |
| 4 | 2326.16 | 2416.43 | 103.87 | 4.52 | 4.23 | 94.24 |
| 5 | 2306.76 | 2248.63 | 97.46 | 4.01 | 4.18 | 104.86 |
| 6 | 2556.98 | 2419.43 | 94.63 | 4.15 | 4.31 | 103.66 |
| Mean | 98.23 | 98.57 | ||||
| ± SD | 3.96 | 4.56 | ||||
| % CV | 4.03 | 4.63 | ||||
All the values were expressed in (n=6) Mean±SD
Dilution integrity
Six duplicates of the analyte solutions were made and compared to a new set of spiked calibration controls to get an estimate. It was shown that adding plasma blank to the drug higher concentration limit could raise it up to 5000.00ng/ml [15]. It was found that the average amounts of the analyte in sample solutions that had been reduced two and four times were between 96.41 and 103.83 percent. The coefficient of variation for this was less than 3.51 percent.
Carryover effects
In order to process this measure, sample solutions were used in the order of LLOQQC of the drug and the plasma blank and ULOQ (upper limit of quantitation) of the analyte and the blank plasma. There was no carryover of any IS or analyte found during study.
Stability study
Both matrix-based and water-based samples were used for stability tests. Both short-term and long-term stable studies were done on water samples [20-23].
Aqueous stability
MQC standard solutions were used to test short-term stability, and the samples were kept at 25.0 °C for 24 h. It was calculated whether there were any changes between six sets of these standards and a newly prepared MQC level solution at 25 °C. 95.64% of the time, it was stable. MQC standard solutions were used to test the long-term stability, and the samples were kept at 2 to 8.0 °C for 40 d. Six copies of these control solutions were infused, and any changes with a newly prepared MQC-level solution were calculated. 95.23% of the time, it was stable.
Stability in human plasma
Benchtop stability was assessed by subjecting MQC and LQC standards to plasma solutions. The samples were collected at-20 °C and then maintained at 25 °C for a duration of 7h Six duplicates of these standards were injected and assessed for any disparities compared to newly processed MQC and LQC concentration solutions. The stability ranged from 94.36% to 97.56% on average [14-17]. The stability of the injector was assessed by subjecting LQC and MQC standards to plasma solutions at a temperature of 10.0 °C in an autosampler for a duration of 22 h. The results showed that the stability ranged from 96.83% to 99.45%. The freeze and thaw stability tests were conducted using plasma solutions at both the LQC and MQC levels. After undergoing 4 freeze-thaw cycles, the proportion of the substance that was recovered was calculated and determined to be between 94.76% and 101.69%. The stability of the wet extracts were assessed by subjecting LQC and MQC standards to plasma solutions at a temperature of 25.0 °C for a duration of 7 h. The results showed that the stability ranged from 95.98% to 103.28% (table 5).
Table 5: Lurbinectedin stability studies
| Stability condition | QC level | B | A | %RSD | %Stability |
| Wet extract stabilities | LQC | 4.28 | 4.20 | 4.23±1.52 | 103.28±19.3 |
| HQC | 2477.93 | 2500 | 3.77±0.39 | 95.91±17.53 | |
| In-injector stabilities | LQC | 4.16 | 4.20 | 2.83±0.93 | 96.82±21.55 |
| HQC | 2446.67 | 2500 | 2.48±0.56 | 99.47±21.11 | |
| Benchtop stabilities | LQC | 4.08 | 4.20 | 3.79±0.48 | 97.53±14.57 |
| HQC | 2359.21 | 2500 | 4.15±1.13 | 94.35±12.25 | |
| Freeze–thaw stabilities | LQC | 3.93 | 4.20 | 3.93±0.67 | 94.77±13.45 |
| HQC | 2542.42 | 2500 | 4.03±0.88 | 101.69±17.55 | |
| Long-term stabilities (at −20 °C) for 63 d) | LQC | 3.96 | 4.20 | 2.4±0.54 | 94.25±14.58 |
| HQC | 2384.25 | 2500 | 4.6±0.73 | 95.37±17.86 |
A, nominal concentration (ng/ml); B, mean (n=3) concentrations (ng/ml) of analytes, All the values were expressed in (n=3) mean±SD
Extended precision and accuracy run
For the extended precision and accuracy run, forty sets of LQC and HQC, together with one lot of linearity curve standards, were prepared and estimated. The results concerning the accuracy and precision of the expanded model are shown in table 6. At the LQC level, Lurbinectedin had a precision of 4.2 and a stability of 98.87%; at the HQC level, it was 1.61 and 102.81%.
Table 6: Extended precision and accuracy analysis
| Analyte | QC level | Y | Z | %RSD | %Stability |
| Lurbinectedin | HQC | 2500.00 | 2570.32 | 1.63±0.88 | 102.82±21.55 |
| LQC | 4.20 | 4.14 | 4.23±1.13 | 98.86±24.67 |
Y, Original concentration (ng/ml); Z, average (n=6) concentrations (ng/ml), All the values were expressed in (n=6) mean±SD
CONCLUSION
The anticancer drug Lurbinectedin was measured in plasma samples using a newly designed and validated LC-ESI-MS/MS procedure. The drug's examination was conducted using ledipasvir as the internal standard. Following the liquid-liquid extraction of 200 μl of plasma, the samples were separated using a ZorbaxSB (25 0 mm x4.6 mm, 5 µm) C18 column. The mobile phase consisted of 0.1 %V/V HCOOH and ACN at a ratio of 10:90, and an infusion flow rate was 0.80 ml/min. The analytes were eluted in 3.5 min total. Using a concentration range of 1.50 to 5000ng/ml of Lurbinectedin and a correlation coefficient value of 0.9994, the method was validated in compliance with FDA standard standards. Assay accuracy ranged from 95.31% to 104.06% of the nominal values, and both intra and inter-day precisions results were within 4.32%. For the analyte at the LQC level, the matrix factor varies from 94.25% to 104.85% with a %CV of 4.61, whereas at the HQC level, it ranges from 94.62% to 103.88% with a %CV of 4.02. The results of the stability tests show that the approach is quite stable. Regular analysis in bioavailability, quality control, and bioequivalence investigations of biological matrices may be effectively performed using the established approach.
ACKNOWLEDGEMENT
None
FUNDING
Nil
CONTRIBUTIONS OF AUTHORS
MA prepared work plan, and RR and KSG reviewed and corrected the article. All authors agree with the submission and publication. Both authors have read and agreed to the published version of the manuscript.
CONFLICTS OF INTEREST
Declared none
REFERENCES
Takahashi R, Mabuchi S, Kawano M, Sasano T, Matsumoto Y, Kuroda H. Preclinical investigations of PM01183 (lurbinectedin) as a single agent or in combination with other anticancer agents for clear cell carcinoma of the ovary. PLOS One. 2016;11(3):e0151050. doi: 10.1371/journal.pone.0151050, PMID 26986199.
He W, Zhang Z, Ma D. A scalable total synthesis of the antitumor agents ET-743 and lurbinectedin. Angew Chem Int Ed Engl. 2019;58(12):3972-5. doi: 10.1002/anie.201900035, PMID 30689274.
Qian BZ, Pollard JW. Macrophage diversity enhances tumor progression and metastasis. Cell. 2010;141(1):39-51. doi: 10.1016/j.cell.2010.03.014, PMID 20371344.
Engblom C, Pfirschke C, Pittet MJ. The role of myeloid cells in cancer therapies. Nat Rev Cancer. 2016;16(7):447-62. doi: 10.1038/nrc.2016.54, PMID 27339708.
US Food and Drug Administration (FDA). Lurbinectedin orphan drug designation and approval; 2018 Aug 1. Available from: https://www.com.zepzelcapro. [Last accessed on 16 Jun 2020].
Paz Ares LG, Trigo Perez JM, Besse B, Moreno V, Lopez R, Sala MA. Efficacy and safety profile of lurbinectedin in second-line SCLC patients: results from a phase II single agent trial. J Clin Oncol. 2019;37(15Suppl):8506. doi: 10.1200/JCO.2019.37.15_suppl.8506.
King N, Garcia Martinez S, Alcaraz E, Grisalena A, Lubomirov R, Altares R. Quantitative determination of lurbinectedin its unbound fraction and its metabolites in human plasma utilizing ultra-performance LC-MS/MS. PLOS One. 2023;18(3):e0283783. doi: 10.1371/journal.pone.0283783, PMID 36996147.
Van Andel L, Rosing H, Lubomirov R, Aviles P, Fudio S, Tibben MM. Development and validation of a liquid chromatography tandem mass spectrometry assay for the quantification of lurbinectedin in human plasma and urine. J Pharm Biomed Anal. 2018 Sep 5;158:160-5. doi: 10.1016/j.jpba.2018.05.053, PMID 29883879.
US Food and Drug Administration (FDA). FDA grants accelerated approval to infigratinib for metastatic cholangiocarcinoma. Available from: https://www.fda.gov/drugs/resources-information-approved-drugs/fdagrants-accelerated-approval-infigratinib-metastatic-cholangiocarcinoma.
Wu YL, Smit EF, Bauer TM. Capmatinib for patients with non-small cell lung cancer with MET exon 14 skipping mutations: a review of preclinical and clinical studies. Cancer Treat Rev. 2021 Apr;95:102173. doi: 10.1016/j.ctrv.2021.102173, PMID 33740553.
Shah JV, Shah PA, Shah PV, Sanyal M, Shrivastav PS. Fast and sensitive LC–MS/MS method for the simultaneous determination of lisinopril and hydrochlorothiazide in human plasma. J Pharm Anal. 2017;7(3):163-9. doi: 10.1016/j.jpha.2016.11.004, PMID 29404033.
Lolla S, Gubbiyappa KS, Cheruku S, Bhikshapathi DV. Validation of an LC-MS/MS method for quantitation of fostemsavir in plasma. J Pharmacol Toxicol Methods. 2023 Mar-Apr;120:107254. doi: 10.1016/j.vascn.2023.107254, PMID 36863666.
Cheruku S, Darna B, Medipalli V, Nekkalapudi AR, Sadasivam RK. Bioanalytical method development and validation for the quantitation of larotrectinib in human plasma: application to pharmacokinetics in healthy rabbits. J Appl Pharm Sci. 2023;13(11):111-8. doi: 10.7324/JAPS.2023.127799.
US Food and Drug Administration. Guidance for industry: bioanalytical method validation. Rockville MD: Center for Drug Evaluation and Research (CDER); 2001.
Moreno V, Greil R, Yachnin J, Majem M, Wermke M, Arkenau HT. Pharmacokinetics and safety of capmatinib with food in patients with MET-dysregulated advanced solid tumors. Clin Ther. 2021;43(6):1092-111. doi: 10.1016/j.clinthera.2021.04.006, PMID 34053700.
Nihal S, Aysen K, Berrak G, Onursal S. Determination of dasatinib in human plasma by using liquid chromatography tandem mass spectrometry. Int J Analyt Bioanalyt Methods. 2019;1(1):1-6. doi: 10.35840/2633-8912/2402.
Dadhaniya T, Chaudhary K, Mehta P. Development of LC-MS/MS method for determination of iloperidone in rabbit plasma: application to a pharmacokinetic study. Int J Pharm Pharm Sci. 2013;7(4):294-7.
Puttagunta SB, Shaik RP, Bannoth CK, Challa BS, Awen BZ. Bioanalytical method for quantification of solifenacin in rat plasma by LC-MS/MS and its application to pharmacokinetic study. J Anal Sci Technol. 2014;5(1):35. doi: 10.1186/s40543-014-0035-0.
Kiran GS, Cheruku S, Cheruku S, Bhikshapathi D, Palanati M. An LC–MS/MS quantification method development and validation for the dabrafenib in biological matrices. J Appl Pharm Sci. 2023;13(1):180-6. doi: 10.7324/JAPS.2023.130117.
Fan X, Yang G, Cui W, Liu Q, Zhang Z, Zhang Z. Development and full validation of an LC–MS/MS methodology to quantify capmatinib (INC280) following intragastric administration to rats. Biomed Chromatogr. 2020;34(3):e4768. doi: 10.1002/bmc.4768, PMID 31821576.
Sellappan M, Devakumar D. Development and validation of RP-HPLC method for the estimation of escitalopram oxalate and flupentixol dihydrochloride in combined dosage form and plasma. Int J Pharm Pharm Sci. 2021;13(2):61-6. doi: 10.22159/ijpps.2021v13i2.30158.
Gurav P, Damle M. Bioanalytical method for estimation of teriflunomide in human plasma. Int J Pharm Pharm Sci. 2022;14(9):19-23. doi: 10.22159/ijpps.2022v14i9.45151.
Krishnan VS, Bhikshapathi D, Cheruku S. Method development and validation for the quantification of abametapir in biological matrices by LC-ESI-MS/MS. Ind J Pharm Edu Res. 2024;58(3s):s1028-33. doi: 10.5530/ijper.58.3s.102.