
Int J App Pharm, Vol 17, Issue 5, 2025, 193-202Original Article
OPTIMIZATION OF UHPLC METHOD FOR QUANTIFYING IBRUTINIB AND ITS PROCESS-RELATED IMPURITIES IN API: UTILIZING BOX-BEHNKEN DESIGN
KALPANA KRISHNARAJU1, MALARKODI VELRAJ2*
1Departments of Pharmaceutical Chemistry and Analysis, School of Pharmaceutical Sciences, VISTAS, Chennai, India. *2Department of Pharmacognosy, School of Pharmaceutical Sciences, Vels Institute of Science, Technology and Advanced Studies (VISTAS), Chennai, India
*Corresponding author: Malarkodi Velraj; *Email: malarkodiv.sps@velsuniv.ac.in
Received: 03 Jan 2025, Revised and Accepted: 16 Jun 2025
ABSTRACT
Objective: The objective of this work was to create, refine, and verify a reliable ultra-performance liquid chromatography (UPLC) technique for ibrutinib and its impurity analysis. The novelty of the work lies in the systematic application of a two-phase optimization approach, combining initial screening with Design of Experiments (DoE), to achieve superior chromatographic performance, enhanced sensitivity, and robust resolution metrics.
Methods: The method development involved two phases: (1) an initial screening phase to evaluate critical parameters, including the stationary phase, mobile phase substance, the pH, the flow rate, and the column temperature (2) a DoE phase using a Box-Behnken design to optimize these parameters. Five columns and three mobile phases were tested, with the ACQUITY UPLC® BEH the optimum conditions were determined to be a C18 column with a mobile phase of 0.02 M formic acid in a 50:50 v/v mixture of water and acetonitrile at pH 2.7. To assess the impacts of predictor factors (mobile phase pH, the flow rate, and the column temperature) on retention duration, resolution, and peak separation, quadratic models developed from ANOVA analysis were employed. The technique was verified according to ICH requirements, assessing system appropriateness, specificity, linearity, precision, accuracy, solution stability, and robustness.
Results: The optimized UPLC method achieved a resolution of 4.66 between ibrutinib and Impurity-I, with retention times of 2.64 min (ibrutinib) and 4.40 min (last eluting peak). Sensitivity was high, with LOD and LOQ values are 0.01 μg/ml and 0.025 μg/ml, respectively, for ibrutinib, and similar sensitivity for impurities. Linearity was excellent (correlation coefficients ≥ 0.9996), ranging from 0.025 to 100 μg/ml (ibrutinib) and 0.025 to 0.225 μg/ml (impurities). Precision (% RSD<2% for ibrutinib,<10% for impurities) and accuracy (recovery 93.58–104.75%) met ICH criteria. Robustness testing under varied conditions confirmed method reliability, ensuring compliance with regulatory standards for pharmaceutical quality control.
Conclusion: The UPLC method, optimized via Box-Behnken design, provides a sensitive, precise, and robust tool for quantifying ibrutinib and its impurities. Systematic optimization enhanced resolution, sensitivity, and robustness, ensuring regulatory compliance and supporting pharmaceutical quality control. This advancement enables reliable impurity profiling and accurate drug quantification.
Keywords: Ibrutinib, UHPLC, Process-related impurities, Box-behnken design, API
© 2025 The Authors. Published by Innovare Academic Sciences Pvt Ltd. This is an open access article under the CC BY license (https://creativecommons.org/licenses/by/4.0/)
DOI: https://dx.doi.org/10.22159/ijap.2025v17i5.53581 Journal homepage: https://innovareacademics.in/journals/index.php/ijap
INTRODUCTION
For the treatment of B-cell lymphoma, ibrutinib (IB), an inhibitor of Bruton's Tyrosine Kinase (BTK), is an authorised medication [1]. In order to permanently deactivate BTK and interfere with the signalling pathways that promote the growth of cancerous cells, it forms a covalent connection with the cysteine residue C481 of BTK [2]. Beyond BTK, ibrutinib inhibits a broad spectrum of kinases, including B lymphocyte kinase (BLK), TEC family kinase (TFK), Tyrosine-protein kinase (TEC), Janus protein tyrosine kinases (JAK3), Interleukin-2 (IL-2) inducible T-cell kinase (ITK), erythroblastic leukemia viral oncogene homologue (ERBB) receptor family, and Hematopoietic cell kinase (HCK) [3-5]. This extensive kinase inhibition profile suggests ibrutinib’s potential for treating a variety of tumor types in the future. Chemically, ibrutinib is a pyrazolopyrimidine-based organic small molecule (C25H24N6O2, 440.5 g/mol) with a melting point range of 149 °C to 158 °C [6]. It exhibits a partition coefficient of approximately 3.97 at pH 7 and a dissociation constant of about 3.74 [7].
During the synthesis of ibrutinib, the presence of impurities is inherent to the process. These impurities may arise from unreacted starting materials, reaction by-products, side products of secondary reactions, or degradation products. Post-marketing authorization, numerous quantitative methods utilizing HPLC [8, 9], UPLC [10, 11], and LC-MS [12, 13] have been reported for the precise quantification of ibrutinib in active pharmaceutical ingredients (API), finished products, and plasma. These methods often enable the concurrent measurement of ibrutinib alongside its active metabolites or co-administered drugs. However, the majority of these methods focus primarily on quantifying ibrutinib in formulations [14] and plasma samples [15-18], with limited attention given for the detection and measurement of process-associated contaminants. While some recent studies have described assay procedures for estimating ibrutinib and its degradation products, a notable deficiency exists in the literature about the design of methods to evaluate possible process-related contaminants. Ibrutinib is known to harbor four specific process-related impurities, as depicted in fig. 1, none of which have been adequately addressed in existing methods.
This research tackles this significant deficiency by establishing a systematic UPLC methodology for the identification and quantification of ibrutinib and its process-related contaminants. The unique contribution of this work lies in its ability to simultaneously quantify these impurities with improved resolution, addressing a key limitation of existing methods. To do this, we utilised failure mode effect analysis (FMEA) to systematically identify key method parameters (CMPs) and critical material characteristics (CMAs) necessary for addressing tightly spaced peaks. The data used as inputs for a Design of Experiments (DoE) research, employing the Box-Behnken approach to optimise procedure parameters. The Box-Behnken design was selected above alternative optimisation methods for its efficacy in investigating intricate variable interactions with fewer experimental trials, hence guaranteeing a reliable and reproducible approach.
The developed RP-UHPLC method is validated in accordance with ICH guidelines [19], providing a reliable and highly sensitive analytical instrument for quantifying ibrutinib and its process-related contaminants. This study not only addresses a significant deficiency in previous research but also provides a systematic approach to method development that can be applied to other pharmaceutical compounds, ensuring compliance with regulatory standards and enhancing quality control in pharmaceutical manufacturing.
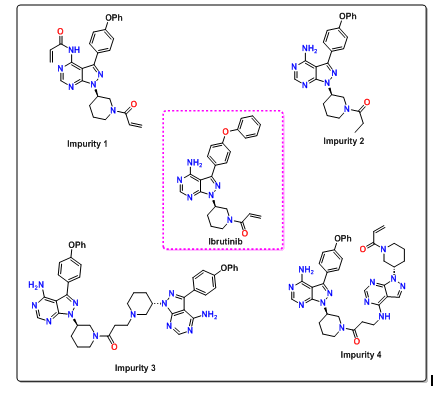
Fig. 1: Structures of ibrutinib and its process-related impurities
MATERIALS AND METHODS
Ibrutinib sample was provided by Rx Innovations, Hyderabad, India. All the reagents and solvent in the investigation were purchased from Sigma Aldrich in Bengaluru, India.
Solutions preparation
Stock standard solution of ibrutinib
In a 100 ml volumetric flask, 50 mg of the reference standard for ibrutinib was dissolved using sonication in 70 ml of diluent to create a standard drug solution. A standard ibrutinib solution with a 500 μg/ml concentration was then obtained by adjusting the volume to 100 ml with diluent.
Standard solution of ibrutinib
Ibrutinib was diluted by combining 10 millilitres of the standard solution with 70 millilitres of diluent in a 100 millilitre volumetric flask. A stock solution of ibrutinib at a concentration of 50 μg/ml was created by adjusting the volume to 100 ml with diluent after 5 min of sonication.
Stock solution-I of impurities
By sonicating 7.5 mg of each contaminant in 5 ml of methanol in a 100 ml volumetric flask, a Stock Solution-I of impurities was created. After that, the volume was adjusted to 100 ml using diluent, resulting in a stock solution of contaminants at 75 μg/ml.
Stock solution-II of impurities
In a 100 ml volumetric flask, 10 ml of Stock Solution-I and 70 ml of solvent were combined to create Stock Solution-II of impurities. A stock solution of contaminants at 7.5 μg/ml was obtained by modifying the volume to 100 ml using a diluent after 5 min of sonication.
Stock solution of ibrutinib impurities
In a 100 millilitre volumetric flask, 10 millilitres of normal ibrutinib solution and 1 millilitre of impurity stock solution-II were combined to form a stock solution of ibrutinib and impurities. In order to achieve concentrations of 50 μg/ml for ibrutinib and 0.075 μg/ml for each contaminant, the flask was then filled with diluent solution. The resulting solution was labelled as 'stock-ibrutinib-impurities.
Test solution of ibrutinib API
In a 500 ml volumetric flask, 25 mg of ibrutinib API had been dissolved in 300 ml of diluent to produce the test solution. A 50 μg/ml test solution of ibrutinib was obtained after 5 min of sonication and subsequent volume adjustment with diluent to 500 ml.
0.2 M formic solution in water
9.2 ml of formic acid and 100 ml of water were combined, sonicated for 5 min, and then diluted to 1000 ml with water to make a 0.2 M solution of formic acid in water.
Mobile phase
The mobile phase consists of a 0.02 M formic acid solution and acetonitrile in a 60:40 (v/v) ratio. A 0.02 M formic acid solution in water was created by diluting 100 ml of a 0.2 M formic acid solution with 500 ml of water, and thereafter diluting to a final volume of 1000 ml. The choice of 0.02 M formic acid concentration was based on its ability to enhance ionization and improve peak shape, which is critical for achieving optimal separation of ibrutinib and its impurities.
Diluent
Freshly prepared Acetonitrile: Water (50:50 V/V) was employed as diluent in this study.
Design of experiments (DoE)
The impurity-spiked sample underwent a DoE approach using a Box-Behnken design for method optimization, analysing the impact of variables and their interplay on methodological outcomes. Essential procedure parameters include the pH of the mobile phase and the column temperature and flow rate were identified as critical variables affecting accuracy, precision, robustness, and specificity from the preliminary experimental trials. These parameters were investigated to understand their impact on output parameters, including drug retention time, resolution between the drug peak and impurity-I, as well as the retention period of the late-eluting peak. The pH range (X1: 2.0-2.6), column temperature range (X2: 25-35 °C), and flow rate range (X3: 0.2-0.6 ml/min) were selected for experimentation. The pH range was chosen to ensure optimal ionization and separation, while the column temperature and flow rate ranges were selected to balance analysis time and resolution. Seventeen trials were conducted based on the Box-Behnken design, with experimental conditions outlined in table 1. All experiments were performed using an Ibrutinib-impurity stock solution (ibrutinib 50 μg/ml and impurity 0.075 μg/ml) [20].
Chromatographic conditions
The chromatographic conditions for the analysis were optimized using a Shimadzu Nexera X2 UPLC system equipped with an ACQUITY UPLC® BEH C18 column has a particle size of 1.7 µm and measures 2.1 x 50 mm. The mobile phase included a 60:40 (v/v) combination of 0.02 M formic acid in water and acetonitrile. Elution was carried out in isocratic mode for six minutes, with the flow rate set at 0.55 ml/min. A wavelength of 258 nm and an injection volume of 2 μl were used for detection. The column temperature was continually upheld at 28 °C throughout the investigation. A diluent consisting of acetonitrile and water in a 60:50 (v/v) ratio with a pH of 2.5 was used, and the pressure was automatically set [21].
Method validation
The UPLC approach, formulated based on design of experiments principles, was validated in compliance with ICH-Q2(R1) requirements. According to ICH Q2 (R1), 2005, the validation comprised assessments of the system's appropriateness, specificity, linearity, limits of detection (LOD) and quantification (LOQ), precision, accuracy, solution stability, and robustness [22, 23].
RESULTS
Method development
Two phases were conducted to optimize the chromatographic method. The screening phase analyzed factors affecting column selectivity: stationary phase, aqueous eluent pH, organic eluent type, flow rate, and column temperature. In the subsequent phase, chromatographic parameters influencing resolution were further investigated alongside additional instrument settings. The initial phase of the study focused on column screening to identify the optimal stationary phase for ibrutinib and its impurities. Parameters like pH, flow rate, temperature, and kind of organic solvent were assessed to get optimal resolution. Five distinct columns were employed: ACQUITY UPLC® BEH C8, ACQUITY UPLC® BEH C18, Inertsil ODS C18, Luna C18, and ACQUITY UPLC BEH Phenyl. Multiple solvent combinations were evaluated to estimate ibrutinib according to its solubility. The selection of the mobile phase was based on system appropriateness characteristics such as resolution (Rs), tailing factor (Tf), capacity factor (k), plate number (N), and retention duration (Rt). Three distinct movable stages were employed for preliminary screening: The mobile phase A (methanol) and phase B (water) comprised 5 mmol ammonium acetate with 0.2% formic acid (50:50 v/v) at pH 6.8, 0.02 M formic acid in water-acetonitrile (60:40 v/v) at pH 2.7, and 20 mmol ammonium bicarbonate (A) and acetonitrile (B) at pH 9.8. Formic acid at a concentration of 0.5% was utilised to modify the pH of the mobile phase. The flow rate in UPLC influences system pressure, chromatographic integrity, and duration of analysis. Experiments were conducted to evaluate the influence on resolution, sensitivity, and retention times utilising an ACQUITY UPLC® BEH C18 column (2.1 mm x 50 mm, 1.7 µm). The mobile phase comprised 0.02 M formic acid in water and acetonitrile (50:50 v/v) at pH 2.7. The column temperature was sustained at 30 °C, and flow rates from 0.3 ml/min to 0.7 ml/min were assessed. Initial experimental trials indicated the mobile phase and its composition, column temperature, and flow rate as essential parameters, which were optimised using the Design of Experiments methodology.
Optimization with design of experiments
Retention time of ibrutinib (R1)
Ibrutinib retention duration is significantly impacted by predictor variables (mobile phase pH, flow rate, column temperature, and their interactions), as shown by the ANOVA significance of the quadratic model (p<0.0001) in table 2. The derived equation for the retention time of Ibrutinib (Eq.1) provides valuable understanding into the relationship between predictor variables and the chromatographic response. The model for the retention time of ibrutinib (R1) demonstrates excellent fit, as evidenced by the high R² value of 0.9969 and adjusted R² value of 0.9929. These metrics indicate that approximately 99.7% of the variability in R1 is explained by the model, with minimal overfitting. The close agreement between R² and adjusted R² confirms the model's robustness. Additionally, the predicted R² value of 0.9726 suggests strong predictive capability, making the model reliable for optimizing retention time in real-world applications.
Retention time of Ibrutinib (R1) = 2.53838+-0.077825* A+0.035275*B+-0.03645*C+0.006125*AB+-0.032825*AC+-0.001225*BC+-0.0293025*A2+0.403547*B2+0.174998 * C2 Eq.1
Table 1: Summary data of box-behnken design experimental variables and responses
| Run | Factor 1 | Factor 2 | Factor 3 | Response 1 | Response 2 | Response 3 |
| A: Mobile phase pH | B: Flow rate (ml/min) | C: Column temperature (C) | Retention time of Ibrutinib | Resolution between ibrutinib and impurity-I | Retention time of last eluting peak | |
| 1 | 2 | 0.4 | 30 | 2.9625 | 2.6996 | 5.3845 |
| 2 | 2.3 | 0.5 | 30 | 2.515 | 4.9465 | 4.3972 |
| 3 | 2.6 | 0.6 | 30 | 2.875 | 2.8671 | 5.0732 |
| 4 | 2.3 | 0.5 | 30 | 2.5442 | 4.503 | 4.4166 |
| 5 | 2.3 | 0.5 | 30 | 2.5248 | 4.6956 | 4.4313 |
| 6 | 2.6 | 0.5 | 25 | 2.6901 | 2.2975 | 4.6453 |
| 7 | 2 | 0.6 | 30 | 3.0208 | 2.3681 | 5.1802 |
| 8 | 2.3 | 0.4 | 25 | 3.1035 | 2.349 | 5.1705 |
| 9 | 2.3 | 0.4 | 35 | 3.0598 | 2.817 | 5.0829 |
| 10 | 2.6 | 0.4 | 30 | 2.7922 | 3.2271 | 5.1753 |
| 11 | 2.6 | 0.5 | 35 | 2.5248 | 4.5851 | 4.3874 |
| 12 | 2 | 0.5 | 25 | 2.7777 | 3.5513 | 4.6258 |
| 13 | 2 | 0.5 | 35 | 2.7437 | 3.0239 | 4.7619 |
| 14 | 2.3 | 0.5 | 30 | 2.5442 | 4.3875 | 4.368 |
| 15 | 2.3 | 0.5 | 30 | 2.5637 | 4.782 | 4.3874 |
| 16 | 2.3 | 0.6 | 25 | 3.1765 | 1.9823 | 5.0392 |
| 17 | 2.3 | 0.6 | 35 | 3.1279 | 2.6906 | 5.044 |
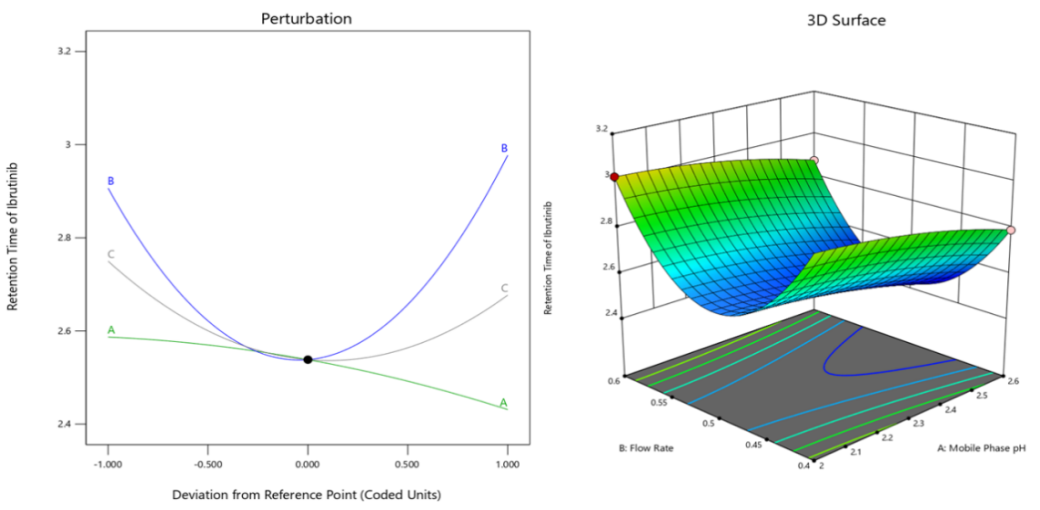
Main factors A (Mobile Phase pH), B (Flow Rate), and C (Column Temperature) are all significant (p<0.05), alongside highly significant quadratic terms for B and C (p<0.0001), suggesting nonlinear relationships with retention time (Perturbation Plot, fig. 2 a). The interaction terms, such as AB, AC, and BC, exhibit smaller coefficients compared to the main effects, suggesting weaker or negligible influences on retention time. This indicates that the combined effects of these factors do not significantly alter the retention behavior of Ibrutinib beyond the individual contributions of each factor. Furthermore, the quadratic terms for B and C (B² and C²) demonstrate substantial coefficients (0.403547 and 0.174998, respectively), indicating non-linear relationships with retention time (3D Surface Plot, fig. 2a). This implies that moderate adjustments to flow rate and column temperature may have more pronounced effects on retention time compared to linear changes, emphasizing the importance of carefully optimizing these parameters for precise control over chromatographic performance.
Resolution between ibrutinib and impurity-I (R2)
ANOVA results for the quadratic approach (table 2) concerning the resolution between Ibrutinib and Impurity-I, together with the produced quadratic equation (Eq. 2), reveals the substantial impacts of the independent important variables. Resolution is considerably impacted by at least one of the predictor variables (Mobile Phase pH, Flow Rate, Column Temperature, and their interactions), as confirmed by the very significant F-value (41.43) and related p-value (<0.0001).
(a)
(b)
(c)
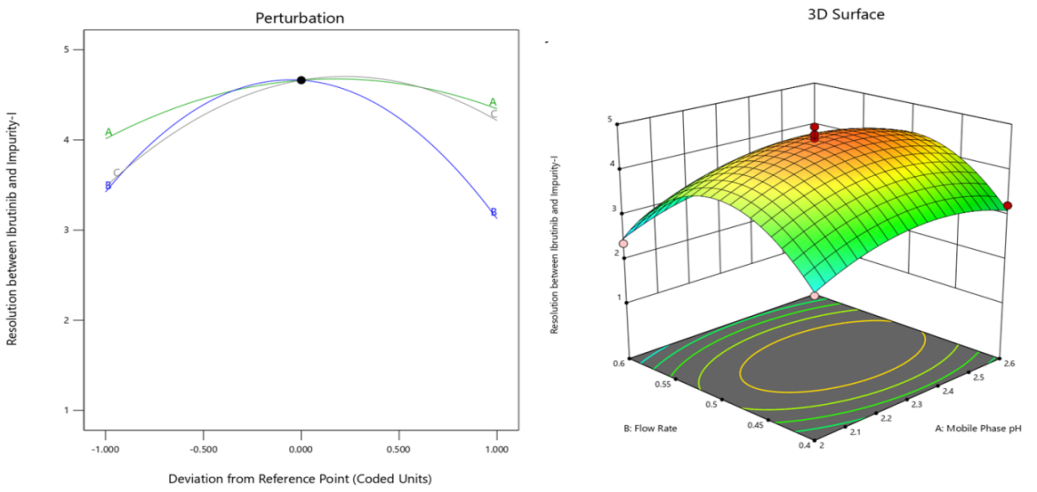
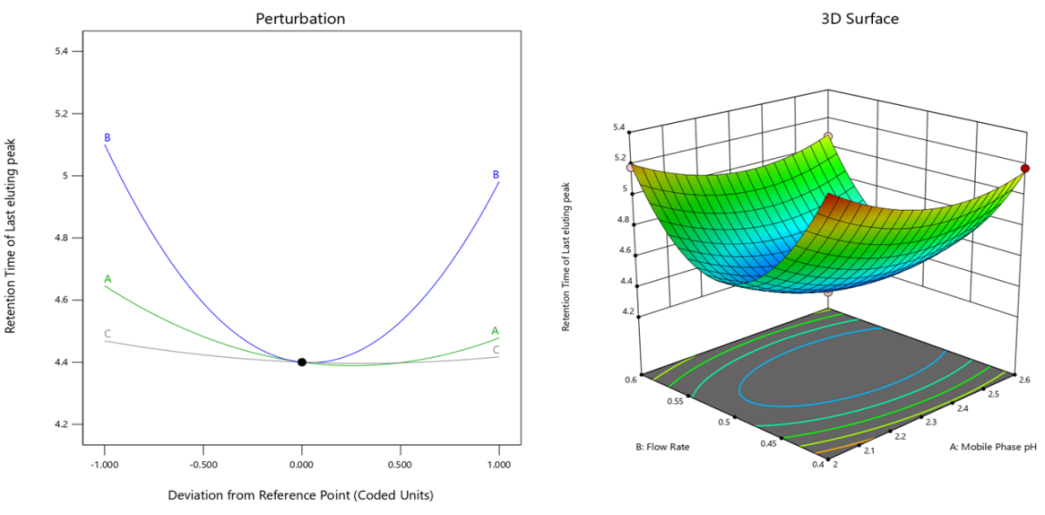
Fig. 2: Perturbation and 3D RSM plots of responses (a) Retention time of Ibrutinib (b) Resolution between ibrutinib and impurity-I (c) Retention time of last eluting peak
Table 2: Summary of anova study of response variables
| Source | Retention time of ibrutinib (R1) | Resolution between ibrutinib and impurity-I (R2) | Retention time of last eluting peak (R3) | Statistical significance | ||||||
| Sum of squares | F-value | p-value | Sum of squares | F-value | p-value | Sum of squares | F-value | p-value | ||
| Model | 0.9218 | 248.73 | <0.0001 | 16.47 | 41.43 | <0.0001 | 2.06 | 311.32 | <0.0001 | Significant |
| A-Mobile Phase pH | 0.0485 | 117.67 | <0.0001 | 0.2224 | 5.03 | 0.0598 | 0.0563 | 76.65 | <0.0001 | |
| B-Flow Rate | 0.0100 | 24.17 | 0.0017 | 0.1754 | 3.97 | 0.0866 | 0.0284 | 38.65 | 0.0004 | |
| C-Column Temperature | 0.0106 | 25.81 | 0.0014 | 1.08 | 24.40 | 0.0017 | 0.0052 | 7.12 | 0.0321 | |
| AB | 0.0002 | 0.3644 | 0.5651 | 0.0002 | 0.0046 | 0.9478 | 0.0026 | 3.55 | 0.1014 | |
| AC | 0.0043 | 10.47 | 0.0143 | 1.98 | 44.84 | 0.0003 | 0.0388 | 52.82 | 0.0002 | |
| BC | 6.0034 | 0.0146 | 0.9073 | 0.0144 | 0.3267 | 0.5855 | 0.0021 | 2.91 | 0.1321 | |
| A² | 0.0036 | 8.78 | 0.0210 | 0.9858 | 22.31 | 0.0021 | 0.1106 | 150.54 | <0.0001 | |
| B² | 0.6857 | 1665.14 | <0.0001 | 8.12 | 183.75 | <0.0001 | 1.73 | 2355.65 | <0.0001 | |
| C² | 0.1289 | 313.13 | <0.0001 | 2.79 | 63.24 | <0.0001 | 0.0078 | 10.56 | 0.0141 | |
| Residual | 0.0029 | 0.3093 | 0.0051 | |||||||
| Lack of Fit | 0.0014 | 1.34 | 0.3806 | 0.1122 | 0.7589 | 0.5727 | 0.0027 | 1.47 | 0.3493 | Not Significant |
| Pure Error | 0.0014 | 0.1971 | 0.0024 | |||||||
| Cor total | 0.9247 | 16.78 | 2.06 | |||||||
| Fit statistics | ||||||||||
| Parameter | Retention time of ibrutinib (R1) | Resolution between ibrutinib and impurity-I (R2) | Retention time of last eluting peak (R3) | |||||||
| Std. Dev. | 0.0203 | 0.2102 | 0.0271 | |||||||
| Mean | 2.80 | 3.40 | 4.80 | |||||||
| C. V. % | 0.7256 | 6.19 | 0.5649 | |||||||
| R² | 0.9969 | 0.9816 | 0.9975 | |||||||
| Adjusted R² | 0.9929 | 0.9579 | 0.9943 | |||||||
| Predicted R² | 0.9726 | 0.8747 | 0.9772 | |||||||
| Adeq Precision | 41.9501 | 17.2345 | 46.9097 | |||||||
*Sample Size n = 3, Average values are considered for the experimental optimization using Design Expert version 13.0.1.
The model demonstrates a strong match for the resolution between ibrutinib and Impurity-I (R2), evidenced by a R² value of 0.9816 and an adjusted R² value of 0.9579. The data demonstrate that the model accounts for 98.2% of the variability in R², with a slight reduction in adjusted R² due to the inclusion of non-significant terms. The predicted R² value of 0.8747 further validates the model's predictive accuracy, though it suggests some room for refinement. Overall, the model is adequate for guiding parameter adjustments to achieve optimal resolution.
Resolution between Ibrutinib and Impurity-I = 4.66292+0.166738 * A+-0.148075 * B+0.367063 * C+-0.007125 * AB+0.70375 * AC+0.060075 * BC+-0.48386 * A2+-1.38859 * B2+-0.81461 * C2 Eq.2
Among the main critical factors, while factors A (Mobile Phase pH) and B (Flow Rate) exhibit p-values slightly above 0.05, suggesting a marginal impact on resolution, factor C (Column Temperature) demonstrates a significant effect (p = 0.0017) (Perturbation Plot, fig. 2(b)). Additionally, the quadratic equations for all variables (A², B², and C²) are quite important (p<0.0021), indicating non-linear relationships with resolution. The interaction terms, such as AB, AC, and BC, demonstrate both positive and negative coefficients, indicating varying effects on resolution depending on the specific combination of factors. The interaction terms AC is highly significant (p = 0.0003), and the positive coefficient for AC (0.70375) suggests that the interaction between mobile phase pH and column temperature positively influences resolution. Furthermore, the quadratic terms for factors A, B, and C (A², B², and C²) reveal non-linear relationships with resolution. The negative coefficients for A² (-0.48386), B² (-1.38859), and C² (-0.81461) indicate that deviations from optimal levels of the mobile phase pH, flow rate, and column temperature may detrimentally impact resolution (3D Surface Plot, fig. 2(b)).
Retention time of last eluting peak (R3)
ANOVA results for the quadratic model (table 2) regarding the retention period of the last eluting peak and the corresponding quadratic equation (Eq. 3) reveal the substantial impacts of the independent key factors. The model for the retention period of the last eluting peak (R3) demonstrates an outstanding match, with a R² value of 0.9975 and an adjusted R² value of 0.9943. These metrics demonstrate that 99.8% of the variability in R3 is explained by the model, with little overfitting. The anticipated R² value of 0.9772 further substantiates the model's robust prediction capability, rendering it exceptionally dependable for optimising the retention period of the last eluting peak in actual applications.
Retention time of last eluting peak = 4.4001+-0.0839 * A+-0.059575 * B+-0.025575 * C+0.02555 * AB+-0.0985 * AC+0.0231 * BC+0.162075 * A2+0.641125 * B2+0.042925 * C2 Eq.3
A (pH of the mobile phase), B (flow rate), and C (column temperature) are some of the primary influences exhibit highly significant effects on retention time, with all associated p-values less than 0.05 (Perturbation Plot, fig. 2(c)). The quadratic terms for all components (A², B², and C²) are very significant (p<0.0001), signifying non-linear correlations with retention time.
The interaction term AC is very significant (p = 0.0002), indicating that the combined effect of Mobile Phase pH and Column Temperature considerably affects the retention period of the final eluting peak. However, the interaction terms AB, BC are not significant (p>0.05). The positive coefficients for A² (0.162075), B² (0.641125), and C² (0.042925) suggest that deviations from optimal levels of the mobile phase pH, flow rate, and column temperature may lead to longer retention times for the last eluting peak (3D Surface Plot, fig. 2(c)).
Method validation
Validation of an analytical method involves various assessments to establish documented evidence to high degree of assurance if the procedure is appropriate for its designated purpose. The established procedure was validated according to ICH criteria.
Six duplicate injections of 100% specification level ibrutinib standard solution (50 μg/ml) were used to evaluate the system applicability. Table 3 presents the essential parameters, including peak area, number of theoretical plates, tailing factor, and % RSD. The medication retention time was determined to be 2.64 min. The percent relative standard deviation of six duplicate injections was determined to be 0.60. All metrics were determined to be within the system appropriateness thresholds.
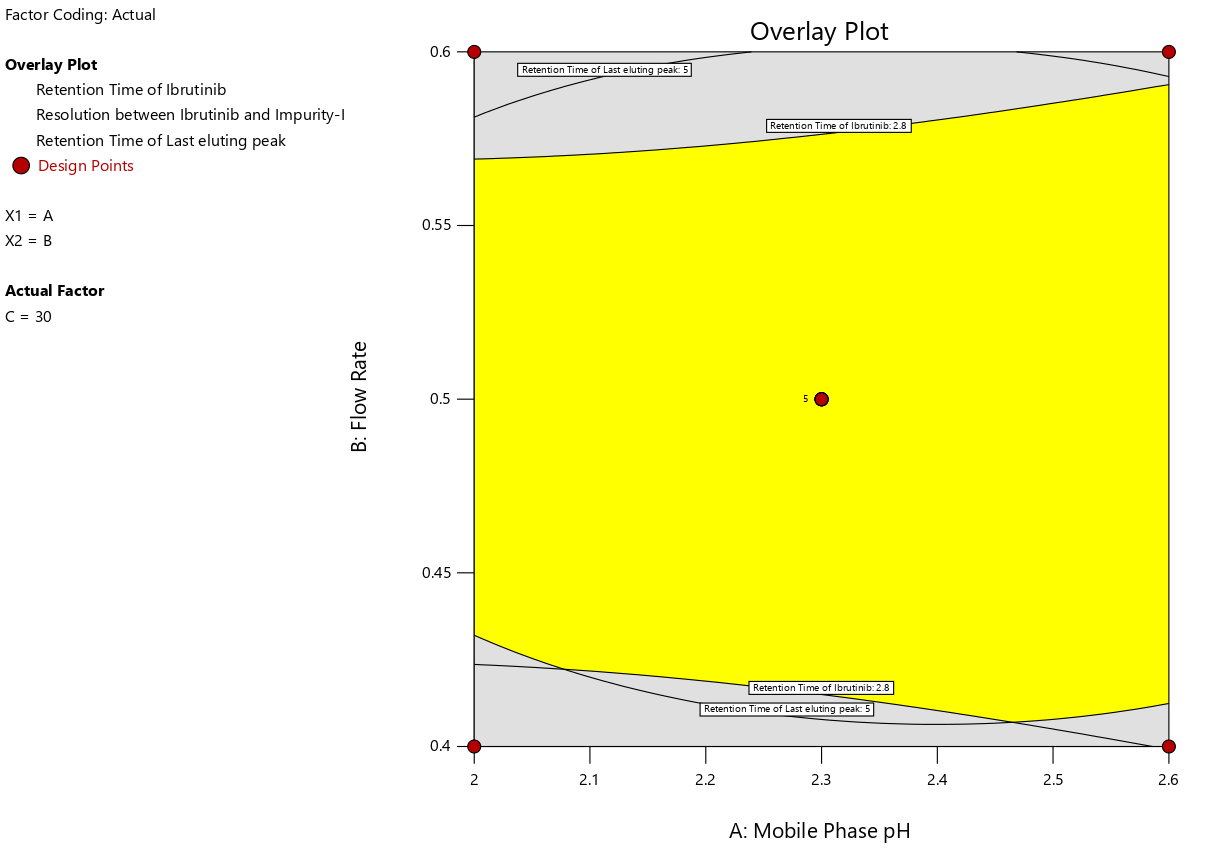
Fig. 3: Overlay plot of method optimization displaying the MODR
Table 3: Summary of system suitability results
| S. No. | Peak area | Number of theoretical plates | Tailing factor |
| 1 | 3332880 | 5755 | 1.034 |
| 2 | 3335040 | 5678 | 1.065 |
| 3 | 3322980 | 5637 | 1.078 |
| 4 | 3367080 | 4726 | 1.026 |
| 5 | 3341880 | 4598 | 0.921 |
| 6 | 3371400 | 4642 | 1.068 |
| Mean | 3345210 | ||
| SD | 19621.0734 | ||
| % RSD | 0.58 |
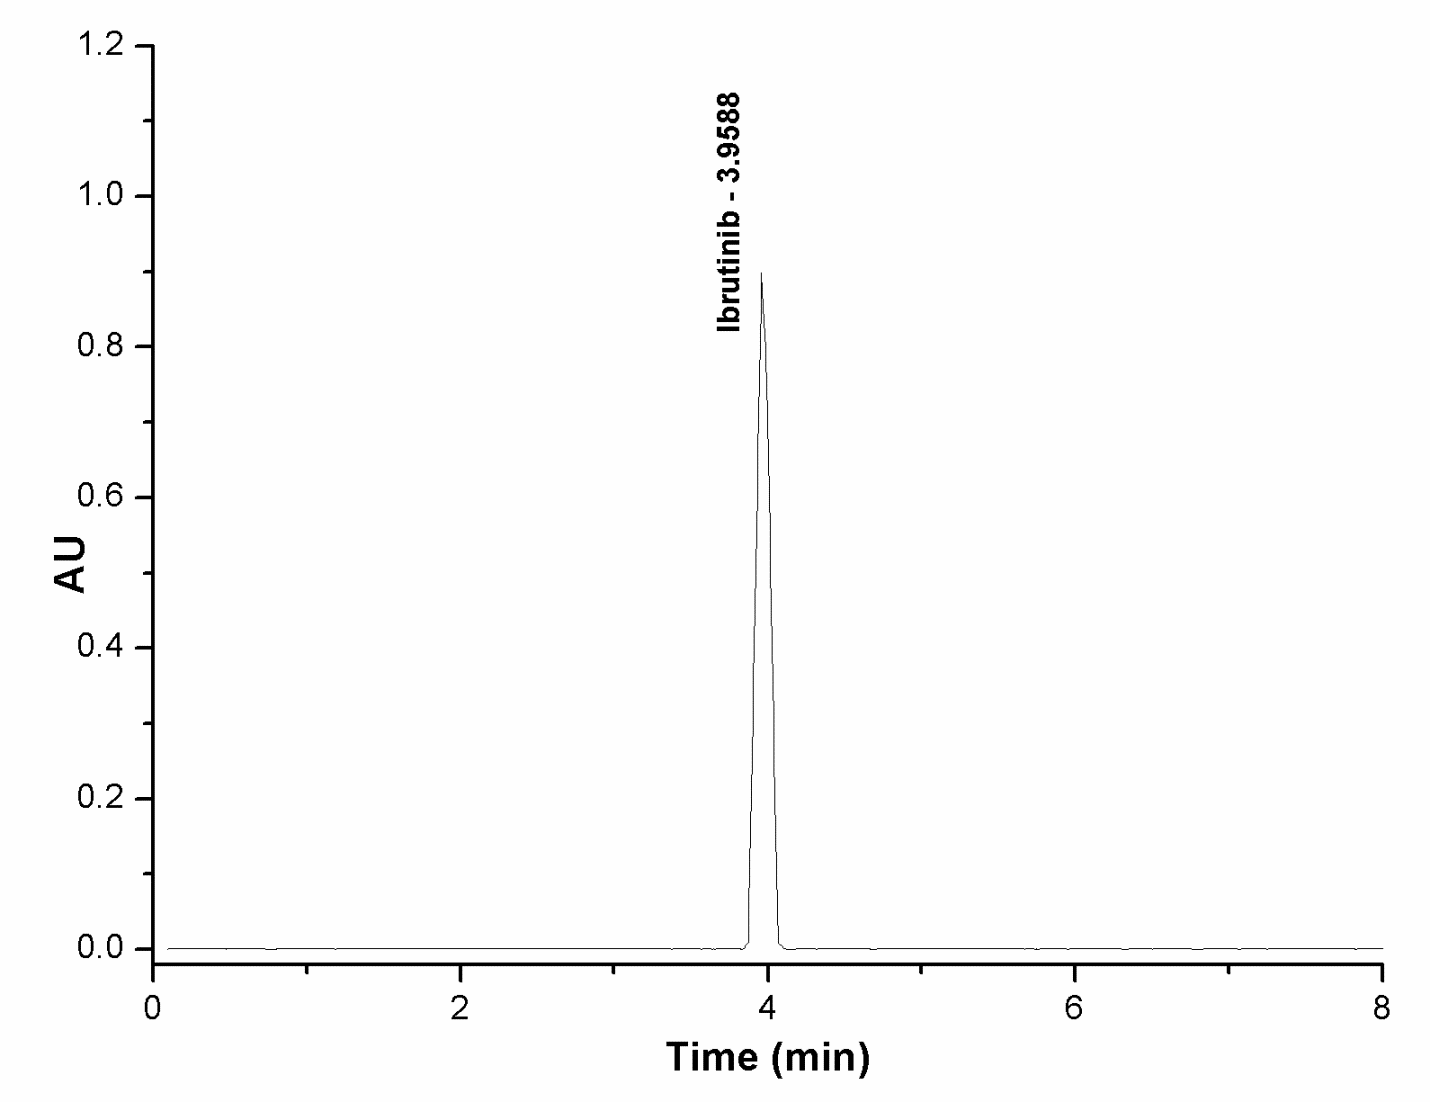
Fig. 4a: Ibrutinib standard at 50 μg/ml
The specificity of an analytical technique refers to its capacity to accurately evaluate the analyte's reaction in the presence of anticipated contaminants. The method's specificity was assessed by injecting standard, blank, and test samples of ibrutinib together with its process-related contaminants. All chromatograms were examined for any interference. The specificity findings demonstrate that ibrutinib exhibited no influence from any known or undiscovered contaminants. Furthermore, all the spiking pollutants were effectively isolated from one another with high resolution. Fig. 4 presents the typical chromatograms.
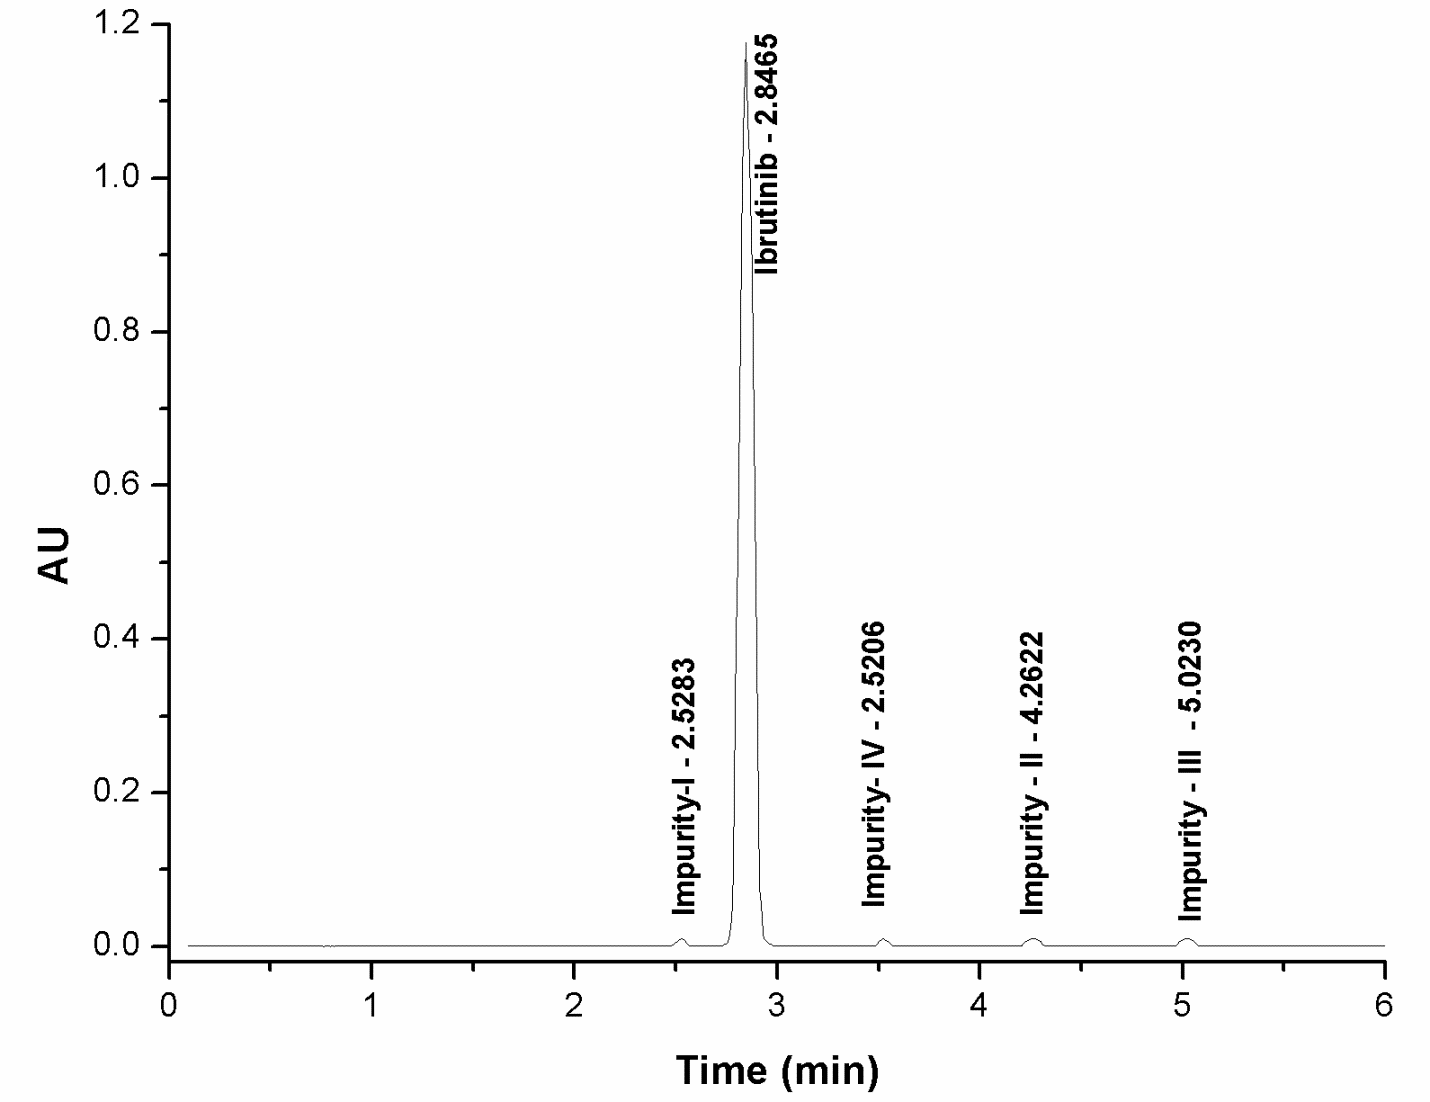
Fig. 4b: Ibrutinib test sample at specification levels
Seven distinct concentrations of contaminants injected into an ibrutinib standard solution were tested to evaluate the linearity of the proposed UPLC technique, encompassing both ibrutinib and the impurities. The concentration ranges were 0.025-100 μg/ml for ibrutinib and 0.025-0.225 μg/ml for contaminants. The findings of the linearity investigation are displayed in table 4. The statistical outcomes of the linearity test indicate that the UPLC-UV detector response exhibited a strong connection with the concentration of both the analyte and impurity, utilising the optimised UPLC technique (table 4). Ibrutinib, Impurity-I, Impurity-II, Impurity-III, and Impurity-IV have correspondingly observed correlation coefficient values of 0.9996, 0.9999, 0.9999, 0.9997, and 0.9999.
Table 4: Results of linearity experiments
| Linearity levels (μg/ml) | ||||||||||
| S. No. | Ibrutinib | Peak area | Impurity-I (μg/ml) | Peak area | Impurity-II (μg/ml) | Peak area | Impurity-III (μg/ml) | Peak area | Impurity-IV (μg/ml) | Peak area |
| 1 | 0.03 | 1828 | 0.025 | 1635 | 0.025 | 1990 | 0.025 | 1899 | 0.025 | 2194 |
| 2 | 2.5 | 174678 | 0.0375 | 3037 | 0.0375 | 3724 | 0.0375 | 3525 | 0.0375 | 4168 |
| 3 | 5 | 350027 | 0.075 | 6220 | 0.075 | 7438 | 0.075 | 7038 | 0.075 | 8145 |
| 4 | 25 | 1749178 | 0.15 | 12395 | 0.15 | 15036 | 0.15 | 14151 | 0.15 | 16319 |
| 5 | 50 | 3519180 | 0.225 | 18964 | 0.225 | 21996 | 0.225 | 20969 | 0.225 | 24361 |
| 6 | 75 | 5419560 | ||||||||
| 7 | 100 | 7015940 | ||||||||
Ibrutinib was found to have a limit of detection (LOD) of 0.01 μg/ml and a signal-to-noise ratio greater than 3. The LOQ of ibrutinib was determined to be 0.025 μg/ml with a signal-to-noise ratio higher than 10. Fig. 5 displays the chromatogram for the Limit of Detection (LOD) and Limit of Quantification (LOQ) of Ibrutinib. All four pollutants had a signal-to-noise ratio above 5 at a concentration of 0.01, which is considered the limit of detection (LOD). At 0.025 concentrations, the pollutants showed a signal-to-noise ratio higher than 10, which is considered the limit of quantification.
Table 5: Summary of accuracy and precision studies
| Accuracy | ||||
| Level (%) | % RSD values of accuracy in terms of percent recovery | |||
| Ibrutinib | Impurity-I | Impurity-II | Impurity-III | |
| LOQ | 2.48 | 3.05 | 2.88 | 3.45 |
| 100 | 1.73 | 2.97 | 3.61 | 3.92 |
| 150 | 1.46 | 3.56 | 3.84 | 2.81 |
| Precision at specification level | ||||
| Parameter | % RSD values of assay | |||
| Ibrutinib | Impurity-I | Impurity-II | Impurity-III | |
| Method Precision | 1.53 | 3.48 | 3.95 | 4.12 |
| Intermediate Precision | 1.84 | 3.27 | 3.61 | 3.82 |
The accuracy of the technique was assessed by giving six samples for testing of the drug at a 100% specified level. The % RSD of assay of ibrutinib test samples was within the acceptable limit (<2%). The % RSD for impurity assay were presented in table and are within the acceptable limit (<10%). The same concentration range was used for three days in a row to establish the intra-day and inter-day accuracy. The % RSD results of intermediate precision are within the acceptable limit (table 5).
The precision of the proposed UPLC technique was determined by injecting three distinct concentrations of impurity spiked ibrutinib sample (LOQ, 100 and 150 % of the specification limit). The percent recovery values of drug and impurities were ranged from 93.58 to 104.75% (table 5). % RSD values for accuracy experiments were well within the ICH limits for drug (<2%) as well as impurities (<10%).
The ibrutinib solution stability was tested by placing the samples (50 ppm Standard solution, 0.075 ppm Diluted Standard solution, and 50 ppm Test sample solution) in tightly sealed volumetric flasks and letting them sit at room temperature for 24 h. The samples were analysed at six-hour intervals. To evaluate the stability of the ibrutinib solution and its impurities, a spiking sample is kept for 48 h at room temperature in a tightly sealed volumetric flask. The quantity of each contaminant is assessed at six-hour intervals until the conclusion of the research period. The relative standard deviation (RSD) of the ibrutinib test during the stability studies is below 2%. The test values, reflecting the solution's stability, exhibited no substantial variations.
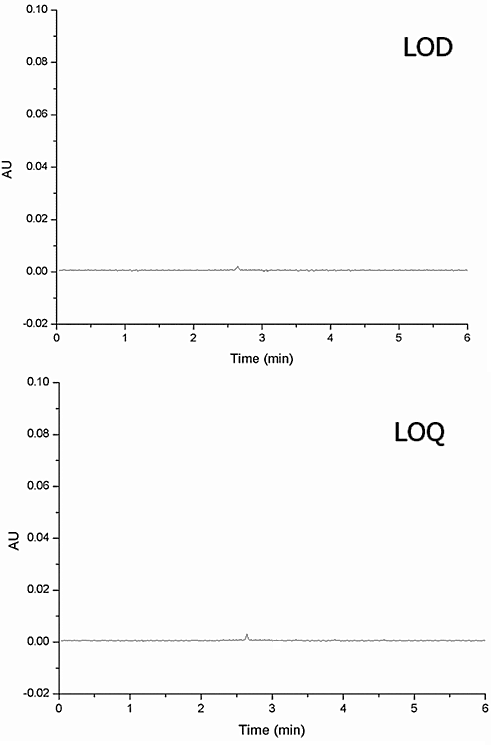
Fig. 5: LOD and LOQ chromatogram of ibrutinib
Changing the levels of crucial factors such as the mobile phase composition, the detection wavelength (250, 255, and 265 nm), and the flow rate (0.5 to 0.7 ml/min) allowed for the evaluation of the method's robustness. The substantial intentional modifications to several crucial technique parameters have not yielded any adverse outcomes. A satisfactory resolution was noted between the medication and all contaminants, demonstrating the method's robustness.
DISCUSSION
The development and optimization of the UPLC method for analyzing ibrutinib and its impurities demonstrated the critical role of systematic parameter optimization in achieving robust chromatographic performance. The two-phase approach, combining initial screening with Design of Experiments (DoE), allowed for the identification and refinement of key factors influencing resolution, retention time, and sensitivity. The relationship between predictor variables (pH of the mobile phase, flow rate, and column temperature) and chromatographic responses was thoroughly understood through the use of a Box-Behnken design. This revealed important non-linear interactions that were successfully represented by quadratic equations. This approach not only enhanced method performance but also ensured reproducibility and reliability [24-26].
The optimized method achieved a resolution of 4.66 between ibrutinib and Impurity-I, which is critical for accurate impurity profiling. The retention times of ibrutinib (2.64 min) and the last eluting peak (4.40 min) were well within acceptable limits, ensuring efficient separation and analysis. Similar studies on UPLC optimization for pharmaceutical compounds have reported the effectiveness of DoE in refining chromatographic conditions, enhancing separation efficiency, and improving detection sensitivity (27, 28). The sensitivity of the method was notably high, with LOD and LOQ values of 0.01 μg/ml and 0.025 μg/ml, respectively, for ibrutinib, and comparable sensitivity for its impurities. These metrics underscore the method's capability to detect and quantify low levels of impurities, which is essential for ensuring drug safety and quality [27].
The linearity of the method, demonstrated by correlation coefficients ≥ 0.9996 across the tested concentration ranges, highlights its suitability for quantitative analysis. Precision and accuracy were also confirmed, with % RSD values<2% for ibrutinib and<10% for impurities, and recovery rates ranging from 93.58% to 104.75%. These results align with ICH guidelines, ensuring the method's reliability for routine quality control [28]. Robustness testing further validated the method's stability under deliberate variations in critical parameters, such as mobile phase composition, detection wavelength, and flow rate, confirming its suitability for diverse analytical conditions [29-31].
The systematic optimization approach, particularly the use of DoE, represents a significant advancement in chromatographic method development. Previous studies had demonstrated that the application of statistical modeling in chromatographic method optimization improves method robustness and reproducibility, particularly for stability-indicating assays of pharmaceutical compounds [32-34]. By identifying and modeling the complex interactions between critical parameters, this study provides a framework for developing robust analytical methods for other pharmaceutical compounds. The validated UPLC method offers a reliable, sensitive, and precise tool for quantifying ibrutinib and its impurities, ensuring compliance with regulatory standards and supporting pharmaceutical quality control. This work highlights the importance of integrating statistical design and optimization in analytical method development to achieve superior performance and reproducibility.
CONCLUSION
This study successfully developed and optimized a robust chromatographic method for analyzing ibrutinib and its impurities using a systematic two-phase approach. Critical parameters, including the mobile phase composition, column temperature, and flow rate, were optimized through a DoE strategy, ensuring precise separation and quantification. The derived quadratic models highlighted the significant influence of predictor variables on key chromatographic responses, reinforcing the necessity of precise parameter control for method reliability. Method validation, aligned with ICH guidelines, confirmed its accuracy, precision, and robustness, making it suitable for API analysis, stability studies, clinical batch testing, and routine quality control. Additionally, its adaptability for forced degradation studies supports long-term stability assessments. Beyond ibrutinib, this approach sets a benchmark for developing robust chromatographic methods for impurity profiling in pharmaceutical research, enhancing drug safety and regulatory compliance.
ACKNOWLEDGMENT
The authors gratefully thank School of Pharmaceutical Sciences, VISTAS, Chennai, India. for providing support to execute the current research work.
FUNDING
There is no funding to report
AUTHORS CONTRIBUTIONS
Conceptualization: Kalpana Krishnaraj, Malarkodi Velraj; Writing original draft: Kalpana Krishnaraj; Review and editing: Kalpana Krishnaraj, Malarkodi Velraj; Supervision and final approval: Malarkodi Velraj. All authors have read and agreed to the published version of the manuscript.
CONFLICTS OF INTERESTS
The authors declare no conflict of interest
REFERENCES
Xue C, Wang X, Zhang L, Qu Q, Zhang Q, Jiang Y. Ibrutinib in B-cell lymphoma: single fighter might be enough? Cancer Cell Int. 2020 Sep 29;20:467. doi: 10.1186/s12935-020-01518-y, PMID 33005100.
Zain R, Vihinen M. Structure-function relationships of covalent and non-covalent BTK inhibitors. Front Immunol. 2021 Jul 19;12:694853. doi: 10.3389/fimmu.2021.694853, PMID 34349760.
Davids MS, Brown JR. Ibrutinib: a first-in-class covalent inhibitor of bruton's tyrosine kinase. Future Oncol. 2014;10(6):957-67. doi: 10.2217/fon.14.51, PMID 24941982.
Joseph RE, Amatya N, Fulton DB, Engen JR, Wales TE, Andreotti A. Differential impact of BTK active site inhibitors on the conformational state of full-length BTK. eLife. 2020 Nov 23;9:e60470. doi: 10.7554/eLife.60470, PMID 33226337.
Naylor Adamson L, Chacko AR, Booth Z, Caserta S, Jarvis J, Khan S. Bruton's tyrosine kinase inhibitors impair FcγRIIA-driven platelet responses to bacteria in chronic lymphocytic leukemia. Front Immunol. 2021;12:766272. doi: 10.3389/fimmu.2021.766272, PMID 34912339.
Song P, Tian Y, Hao G, Xu L, Sun Y, Sun Y. Preparation and evaluation of ibrutinib lipid-based formulations. J Drug Deliv Sci Technol. 2022;77:103912. doi: 10.1016/j.jddst.2022.103912.
Ashar F, Hani U, Osmani RA, Kazim SM, Selvamuthukumar S. Preparation and optimization of ibrutinib-loaded nanoliposomes using response surface methodology. Polymers (Basel). 2022;14(18):3886. doi: 10.3390/polym14183886, PMID 36146030.
Gopireddy RR, Maruthapillai A, Mahapatra S. A stability indicating method development and validation for separation of process-related impurities and characterization of unknown impurities of tyrosine kinase inhibitor ibrutinib using QBD approach by RP-HPLC, NMR spectroscopy and ESI-MS. J Chromatogr Sci. 2021;59(9):830-46. doi: 10.1093/chromsci/bmaa124, PMID 33420506.
Reddy Gopireddy RR, Maruthapillai A, Mahapatra S, Tamilselvi M. Development and validation of HPLC method for enantioseparation of ibrutinib on immobilized chiral stationary phase. Mater Today Proc. 2022;50:384-7. doi: 10.1016/j.matpr.2021.08.358.
Prasad SK, Kalpana D. Development and validation of a stability indicating ultra high performance liquid chromatography method for the estimation of ibrutinib and trace level quantification of related substances using quality by design approach. Biomed Chromatogr. 2024;38(3):e5798. doi: 10.1002/bmc.5798, PMID 38081478.
Konduru N, Gundla R, Katari NK, Paidikondala K, Reddy AS, Jagadabi V. Development and validation of a stability indicating method for ibrutinib: identification and separation of degradation products known and genotoxic impurities using RP-HPLC/PDA and QDa mass detectors. Anal Chem Lett. 2020;10(1):113-36. doi: 10.1080/22297928.2019.1673814.
Iqbal M, Shakeel F, Anwer T. Simple and sensitive UPLC-MS/MS method for high throughput analysis of ibrutinib in rat plasma: optimization by box-behnken experimental design. J AOAC Int. 2016;99(3):618-25. doi: 10.5740/jaoacint.15-0222.
Sun S, Cheng D, Kong S, Li X, Li T, Yu Q. A rapid and sensitive method for quantification of ibrutinib in rat plasma by UPLC–ESI–MS/MS: validation and application to pharmacokinetic studies of a novel ibrutinib nanocrystalline. Biomed Chromatogr. 2020;34(1):e4703. doi: 10.1002/bmc.4703, PMID 31629393.
Akbel E, Gungor S, Bulduk I. Alternative analytical methods for ibrutinib quantification in pharmaceutical formulation: a statistical comparison. Rev Anal Chem. 2022;41(1):146-57. doi: 10.1515/revac-2022-0039.
Yasu T, Momo K, Yasui H, Kuroda S. Simple determination of plasma ibrutinib concentration using high-performance liquid chromatography. Biomed Chromatogr. 2019;33(3):e4435. doi: 10.1002/bmc.4435, PMID 30421802.
Sun S, Cheng D, Kong S, Li X, Li T, Yu Q. A rapid and sensitive method for quantification of ibrutinib in rat plasma by UPLC-ESI-MS/MS: validation and application to pharmacokinetic studies of a novel ibrutinib nanocrystalline. Biomed Chromatogr. 2020;34(1):e4703. doi: 10.1002/bmc.4703, PMID 31629393.
Beauvais D, Goossens JF, Boyle E, Allal B, Lafont T, Chatelut E. Development and validation of an UHPLC-MS/MS method for simultaneous quantification of ibrutinib and its dihydrodiol metabolite in human cerebrospinal fluid. J Chromatogr B Analyt Technol Biomed Life Sci. 2018 Sep 1;1093-1094:158-66. doi: 10.1016/j.jchromb.2018.06.026, PMID 30029202.
Veeraraghavan S, Viswanadha S, Thappali S, Govindarajulu B, Vakkalanka S, Rangasamy M. Simultaneous quantification of lenalidomide ibrutinib and its active metabolite PCI-45227 in rat plasma by LC-MS/MS: application to a pharmacokinetic study. J Pharm Biomed Anal. 2015 Mar 25;107:151-8. doi: 10.1016/j.jpba.2014.11.041, PMID 25594893.
Satyadev TN, Ramakrishna C. A new related substances method development and validation of two anti-cancer drugs by using effective liquid chromatographic method. Int J App Pharm. 2022 Mar;14(2):116-24. doi: 10.22159/ijap.2022v14i2.43582.
Sharma S, Gupta P, Gupta A, Kawish SM, Iqbal Z, Vohora D. Rapid analytical method development and validation of RP-HPLC method for the simultaneous estimation of exemestane and genistein with specific application in lipid-based nanoformulations. ACS Omega. 2023;8(28):25101-13. doi: 10.1021/acsomega.3c01791, PMID 37483215.
Chhonker YS, Edi C, Murry DJ. LC-MS/MS method for simultaneous determination of diethylcarbamazine albendazole and albendazole metabolites in human plasma: application to a clinical pharmacokinetic study. J Pharm Biomed Anal. 2018 Mar 20;151:84-90. doi: 10.1016/j.jpba.2017.12.037, PMID 29310051.
Validation of analytical procedures: text and methodology international conference on harmonisation (ICH). Vol. Q2. Geneva: ICH; 2005. p. R1.
CB, Rao Kl N, ND, Kvn SR. Development and validation of stability indicating reversed-phase high-performance liquid chromatographic method for the determination of related substances in fampridine drug substance and tablet dosage forms. Asian J Pharm Clin Res. 2017;10(10):334-8. doi: 10.22159/ajpcr.2017.v10i10.19796.
Patel JS, Pooja B, Patel RM. Box-behnken design assisted ultra-performance liquid chromatography photodiode array detection method development validation and quantification of lunation peptide in plant-based vegan supplements. Indian J Pharm Sci. 2023;85(1):101-9.
Gumulka P, Zandarek J, Dabrowska M, Starek M. UPLC technique in pharmacy an important tool of the modern analyst. Processes. 2022;10(12):2498. doi: 10.3390/pr10122498.
Rao LV, Rao KT, Kandepi VV. A novel validated UHPLC method for estimation of assay and its related substances of trichostatin a. Int J Pharm Pharm Sci. 2020;12(7):51-8. doi: 10.22159/ijpps.2020v12i7.37198.
Schmidt AH, Molnar I. Using an innovative quality by design approach for development of a stability indicating UHPLC method for ebastine in the API and pharmaceutical formulations. J Pharm Biomed Anal. 2013 May 5;78-79:65-74. doi: 10.1016/j.jpba.2013.01.032, PMID 23454599.
Shetgar SS, Dharmasoth R, Keloth B, Rao BM. Development and validation of UPLC method for quantitative estimation of related impurities in tizanidine hydrochloride tablets. J Appl Pharm Sci. 2021;11(8):43-53. doi: 10.7324/JAPS.2021.110807.
Epshtein N, Sevastianova VL, Koroleva AI. Investigation of robustness at validation of HPLC and UPLC methods: a modern approach including risk analysis. Drug Dev Regist. 2018;1(22):96-109.
Gervais A, Dirksen EH, Pohl T, Bechtold Peters K, Burkitt W, D Alessio V. Compliance and regulatory considerations for the implementation of the multi-attribute method by mass spectrometry in a quality control laboratory. Eur J Pharm Biopharm. 2023 Oct;191:57-67. doi: 10.1016/j.ejpb.2023.08.008, PMID 37582411.
Unade TT, Pawar AK. A new stability-indicating UPLC method for the determination of two anti-diabetic drugs in combination: applications to bulk and tablet formulation. Int J Appl Pharm. 2022;14(4):192-9. doi: 10.22159/ijap.2022v14i4.44774.
Shukla SK, Kadry H, Bhatt JA, Elbatanony R, Ahsan F, Gupta V. Statistical optimization and validation of a novel ultra-performance liquid chromatography method for estimation of nintedanib in rat and human plasma. Bioanalysis. 2020 Feb;12(3):159-74. doi: 10.4155/bio-2019-0284, PMID 32052636.
Liu X, Liang L, Cai G, Guo Y, Gong J. Multivariate approach to assess the bioactive compounds of Atractylodes chinensis (DC.) Koidz in different harvest periods. J Chromatogr B Analyt Technol Biomed Life Sci. 2024 Oct 1;1246:124298. doi: 10.1016/j.jchromb.2024.124298, PMID 39244957.
Kotak V, Tanna N, Patel M, Patel R. Determination of asenapine maleate in pharmaceutical and biological matrices: a critical review of analytical techniques over the past decade. Crit Rev Anal Chem. 2022;52(8):1755-71. doi: 10.1080/10408347.2021.1919858, PMID 34061690.