
Int J App Pharm, Vol 17, Issue 4, 2025, 462-470Original Article
DEVELOPMENT AND VALIDATION OF UV-SPECTROPHOTOMETRIC AND RP-HPLC METHODS FOR CURCUMIN-TOFACITINIB NANOCARRIERS: A NOVEL PLATFORM FOR ENHANCED BREAST CANCER THERAPY
SUCHITA WAGHMARE* , UJBAN MD HUSSAIN, NILESH RAROKAR, PRAMOD KHEDEKAR
Department of Pharmaceutical Sciences, Rashtrasant Tukadoji Maharaj Nagpur University, Nagpur-440033, Maharashtra, India
*Corresponding author: Suchita Waghmare; *Email: suchitawaghmare26@gmail.com
Received: 08 Jan 2025, Revised and Accepted: 01 May 2025
ABSTRACT
Objective: The objective of this study is to develop and validate analytical techniques for the accurate quantification, stability assessment, and quality control of curcumin-tofacitinib-loaded nanocarriers (CS-TF-NCs).
Methods: A new RP-HPLC (Reverse Phase-High Performance Liquid Chromatography) and UV-spectrophotometric method was developed and validated to quantify CS (Curcumin), TF (Tofacitinib), and CS-TF-NCs (Curcumin-Tofacitinib-Nanocarriers). UV-spectrophotometry detected λmax values of 426 nm (CS) and 286 nm (TF), and shifts to 287 nm and 421 nm for nanocarrier-loaded samples, with excellent linearity (R² = 0.9994) in the range of 5–25 μg/ml. RP-HPLC analysis was found to be very sensitive with low LOD (Limit of Detection) (LOD = 0.045 μg/ml) and LOQ (Limit of Quantification) (LOQ = 0.07 μg/ml). Recovery levels were between 97% and 99%, and retention times were 2.212 and 4.285 min for CS and TF, respectively.
Results: CS and TF revealed λ max values of 426 nm and 286 nm by UV-spectrophotometry, with high correlation coefficients of R² = 0.9962 and 0.998. For CS-TF-NCs, the values were determined at 287 nm and 421 nm with a high R² = 0.9994 that validates linearity for the entire range of concentration of 5–25 μg/ml. Validation through RP-HPLC has exhibited good sensitivity, LOD being 0.045 μg/ml, and high precision (%RSD<1.5%). The nanocarriers were characterized by good solubility and sustained release profiles, giving recovery and retention times of 97–99% with 2.212 and 4.285 min for CS and TF, respectively.
Conclusion: This work established CS-TF-NCs as a platform with the potential to deliver targeted, effective breast cancer therapy.
Keywords: Breast cancer, Curcumin, Tofacitinib, Nanocarriers, Combination therapy, RP-HPLC, UV-spectrophotometry, Drug solubility, Bioavailability, Stability studies
© 2025 The Authors. Published by Innovare Academic Sciences Pvt Ltd. This is an open access article under the CC BY license (https://creativecommons.org/licenses/by/4.0/)
DOI: https://dx.doi.org/10.22159/ijap.2025v17i4.53621 Journal homepage: https://innovareacademics.in/journals/index.php/ijap
INTRODUCTION
The cornerstone of modern anticancer therapy is a combination therapy that takes advantage of synergistic or additive effects conferred by two or more therapeutic drugs acting on various pathways in the tumour's growth [1, 2]. Combination therapy has been reported to suppress tumour growth and drug resistance, together with the ability to metastasize and reduce the number of cancer stem cells [2]. Of all the crucial pathways involved in breast cancer, the IL-6/JAK2/STAT3 (Interleukin 6/Janus Kinase 2/Signal Transducer and Activator of Transcription 3) pathway is the most pivotal pathway involved in tumorigenesis, proliferation, and metastasis [3]. Misregulation of the path has the potential to induce oncogenic signalling; hence, small-molecule inhibitors against the JAK/STAT proteins have been effective [4]. Curcumin (CS), a polyphenol, is a compound obtained from natural origins and possesses the ability to regulate the JAK/STAT pathway.
Analytical research on CS, for instance, by Zoiet al., has been reported to inhibit STAT3 phosphorylation and downregulate its downstream gene expression, which results in decreased tumour burden in breast cancer models [5]. Likewise, the effective JAK-STAT pathway inhibitor, tofacitinib (TF), drastically lowers the viability of breast cancer cells, augmenting the effectiveness of other anticancer drugs, according to research by Gravina et al., [6]. CS and TF are presently established to be novel therapeutic strategies in synergistic mixtures directed toward the IL-6/JAK/STAT3 pathway. Though CS is a potent therapeutic molecule, it is associated with low solubility, bioavailability, and stability [7].
TF is hampered by systemic toxicity and lacks selectivity. Thus, the research work presently focuses on mitigating these disadvantages with the help of nanocarrier-based drug delivery systems [8]. Al Thani et al., showed that nanocarriers enhance the solubility and stability of the contained agents, which might allow for site-specific targeting at tumour sites and thereby reduce off-target effects [9]. More to that were the characteristics V. C. Deivayanai et al. showed for long-term drug delivery and therapeutic effects in cancer treatment. Quantitative analysis methods are vital in assessing the effectiveness of such nanocarrier systems [10].
Methods that Gorantla et al. came up with utilized UV-spectrophotometric methods of drug quantitation in bulk materials. However, such methods cannot provide the sensitivity needed to undertake complex formulations using nanocarriers [11]. RP-HPLC methods for the study of stability in anticancer drugs such as TF and CS were developed by Srividya Gorantla et al. Yet, these methods tend to require enhancement in managing drug combinations in nanoscale systems [12]. The intricacy of curcumin-tofacitinib nanocarriers requires more stringent and accurate methodologies. This study will fill these lacunae through the design and validation of sophisticated analytical methods for curcumin-tofacitinib-loaded nanocarriers. Through this, it hopes to enhance UV-spectrophotometric and RP-HPLC methods for the reliable quantification and characterization of the drugs in both bulk and pharmaceutical states. In addition to overcoming significant shortcomings in earlier approaches, this research also offers a platform for the successful clinical application of curcumin-tofacitinib nanocarriers in the treatment of breast cancer.
MATERIALS AND METHODS
Chemicals and reagents
Curcumin (CS) was obtained from SRL Chemicals, and Tofacitinib (TF) was kindly provided as a gift sample by Hetero Pharma Ltd., India. HPLC-grade methanol was procured from Sigma Aldrich Corporation, Mumbai, provided. Other reagents used in the study include ortho-phosphoric acid, sodium phosphate monobasic and dibasic, HPLC-grade water, acetonitrile (ACN), and methanol, which were of analytical grade.
Instrumentation
The instruments used for the quantification of CS, TF and Curcumin Tofacitinib Nanocarrier’s (CS-TF-NCs) were a double Beam UV-visible spectrophotometer (JASCO V-630), having wavelength scanner range from 800 nm to 190 nm used for UV-visible spectroscopy-related studies. A silica quartz square cell cuvette with dimensions of 3 cm in length and 1 cm in route length was used for the entire experiment, having a transmittance of 50.4±0.2%. For High-Performance Liquid Chromatography (HPLC) related studies, Agilet (1100) with Jasco UV 2075 Plus detector coupled with autosampler, a Jasco Lc-net 11/Adc valve, a G1310A Iso pump, a C18 (Agilent) id (4.6 x 250 mm) column and equipped with chemstation chromatography data system for analysis was used. An analytical balance (Shimadzu, Japan), a pH meter (Systronics, Ahmedabad, India), and other instruments were used for the study.
Preformulation study of curcumin and tofacitinib
The preformulation analysis and conformation of CS and TF were conducted to evaluate its purity by using various advanced methods, such as X-ray Diffraction (XRD), Differential Scanning Calorimeter (DSC). Fourier transform infrared spectroscopy (FTIR), followed by its organoleptic characteristics. The above studies were also conducted to assess the compatibility of curcumin and tofacitinib [13].
The compatibility between CS and TF was evaluated by X-ray Diffraction (XRD), Differential Scanning Calorimetry (DSC), and Fourier Transform Infrared Spectroscopy (FTIR). Combination-induced changes in crystallinity were measured using XRD, DSC examined possible thermal interactions through the detection of changes in melting points or exothermic/endothermic behavior, and FTIR determined probable chemical interactions by correlating functional group shifts in the spectra of the single drugs and the combined drug. These tests assured the stability and compatibility of curcumin with tofacitinib prior to nanocarrier formulation [15, 16].
UV-visible spectroscopy-based quantification of pure curcumin, Tofacitinib, and a combination of Curcumin-tofacitinib and CTNs
Preparation of std. stock solution
A standard stock solution (1000 µg/ml) of CS and TF was prepared by weighing 10 mg and adding in 10 ml methanol for curcumin and 10 ml water for tofacitinib, employing a 10 ml volumetric flask. The combination of Curcumin and Tofacitinib stock solution was prepared by weighing 5 mg each of curcumin and 10 ml methanol. This will be used for measurement of the maximum absorption of λmax of CS, TF, CS-TF, and CS-TF-NCs.
Preparation of a working solution
To achieve a concentration of 10 μg/ml, the working stock solution was further diluted with the respective solvent (1 ml to 10 ml). 1 ml of the standard stock solution was diluted to 10 ml to create the working stock solution (100 μg/ml).
Preparation of sample of CS-TF-NCs
A sample of CS-TF-NCs was prepared by measuring an accurate amount of CS-TF-NCs (equivalent to 5 mg each of CS and TF) and dissolving it in some amount of ethanol followed by transferring the resulting solution to a 50 ml volumetric flask and making up the volume to the mark by addition of ethanol to obtain a concentration of 100 µg/ml. Further, 1 ml of the prepared solution was diluted in 10 ml of methanol to obtain a solution with a final concentration of 10 µg/ml (fig. 1).

Fig. 1: Sample preparation of curcumin tofacitinib nanocarriers
Selection of λmax
The prepared solution was scanned against ethanol as a blank in the wavelength range of 200–400 nm. A prominent absorption peak was observed at 425 nm for curcumin and 286 nm for tofacitinib, which is depicted in the UV-visible spectra (fig. 2A). This wavelength (λmax) was selected for further analysis. For the generation of the calibration curve, the stock solution was further diluted with ethanol to prepare a series of concentrations ranging from 2 to 10 μg/ml, which were then scanned at the respective wavelengths.
Validation of analytical method
The analytical method developed was validated in accordance with the ICH Q2 (R1) guidelines, which encompass aspects such as linearity, accuracy, precision, specificity, robustness, and LOD and LOQ. The linearity of the method was obtained through the analysis of serial dilutions from 1 to 180 μg/ml and plotting the peak area against the concentration. Data obtained were confirmed for linearity through least-square regression analysis. The suitability of the method in terms of accuracy was further checked by spiking a 10 µg/ml standard solution with excess amounts of the drug as 80 % (8 µg/ml), 100 % (10 µg/ml), and 120 % (12 µg/ml). Furthermore, SD and % RSD were calculated to assess the accuracy of the method [17].
Precision was established by preparation of three different concentration levels for the drug, that is, 5 μg/ml, 10 μg/ml, and 15 μg/ml, at different time intervals on the same day (intra-day precision) and their repeated estimations on another day (inter-day precision). Then, mean percentage recovery, SD (Standard Deviation), and %RSD (Relative Standard Deviation) were calculated to establish the method's precision. The LOD and LOQ were obtained from the slope of the linearity plot, S, and the standard deviation of the blank response, σ, and calculated by using equations 1 and 2.
LOD = 3.6σ/S ……….. Eq. 1
LOQ = 10σ/S ………. Eq. 2
Analysis of six replicative analyses were used to assess the system's suitability on a standard solution of 30 μg/ml. Then, SD and %RSD for peak area, as well as retention time, were calculated. Finally, specificity was evidenced by concentrating a 30 µg/ml sample solution prepared from the reference standard in conditions that might reasonably be expected to cause degradation and analysing any degradation products produced for their interference potential with the reference standard [18]
HPLC quantification of CS, TF, CS-TF and CS-TF-NCs
Chromatographic conditions
HPLC of CS, TF, CS-TF, and CS-TF-NCs was carried out using C18[Agilent) column employing Methanol and Orthophosphoric acid pH 3.5 as mobile phase
Preparation of sample
Samples of CS, TF, CS-TF, and CS-TF-NCs were prepared using varying proportions of Methanol and water using HPLC, isocratic mode at a constant flow rate of 0.7 ml/min, the estimation was carried out by maintaining the column temperature 30℃, the sample injection volume being 20 µl** for 10 min, and the detection is done at the respective wavelengths table 1. The mobile phase for RP-HPLC was optimized on the basis of both experimental trials and previous literature to obtain maximum separation, peak resolution, and minimum tailing. Various ratios of methanol and aqueous orthophosphoric acid (pH 3.5) were tried, and a final ratio of 80:20 (v/v) methanol: orthophosphoric acid was chosen. This mixture gave sharp peaks, best retention times (2.212 min for curcumin and 4.285 min for tofacitinib], and high sensitivity. The pH of 3.5 was selected because it improved peak symmetry and reduced peak broadening, which ensured high reproducibility in drug quantification [15].
Table 1: Chromatographic conditions for HPLC estimation of Curcumin, tofacitinib, and curcumin tofacitinib nanocarriers
| S. No. | Sample | Column | Mobile phase | Flow rate | Detector |
| 1 | CS | C18[Agilent) | Methanol: Orthophosphoric Acid pH 3.5 (80:20) | 0.8 ml/min | Jasco UV 2075 Plus detector |
| 2 | TF | C18[Agilent) | Methanol: Orthophosphoric Acid pH 3.5 (80:20) | 0.8 ml/min | Jasco UV 2075 Plus detector |
| 3 | CS-TF-NCs | C18[Agilent) | Methanol: Orthophosphoric Acid pH 3.5 (70:30) | 0.8 ml/min | Jasco UV 2075 Plus detector |
Method validation
The validation of High-Performance Liquid Chromatography (HPLC) for estimating CS and TF in the mobile phase was based on ICH guidelines Q2 (R1), including parameters such as linearity, precision, accuracy, repeatability, limit of detection (LOD), and limit of quantification (LOQ). The linearity was checked over a concentration range of 2-50 μg/ml using a linear regression model and the least-squares method. A calibration curve was prepared by plotting the peak area against the analyte concentration of CS and TF in a mobile phase consisting of Methanol: water in an 80:20 ratio, using five standard solutions at concentrations of 2, 4, 6, 8, and 10 μg/ml to calculate the regression line [16].
Precision and accuracy were determined through repeatability and intermediate precision studies. Repeatability was established by determining intraday variation, which consisted of three replicates at three levels of concentration (2, 6, and 8 μg/ml) carried out at different times of the same day. Intermediate precision was checked by interday variation, where the same concentrations were measured over three different days. SD and RSD were used to check the accuracy of the data for intraday and interday variation. System suitability was further established by analyzing the CS and TF samples at a concentration of 10 μg/ml in triplicate; tailing factor (T), height equivalent to a theoretical plate (HEPT), and the number of theoretical plates (N) were used to ascertain the system performance.
The robustness of the method was checked by minor changes in critical analytical parameters, such as variations in mobile phase composition (Methanol: Water at an 80:20 ratio), temperature fluctuations (25±1 °C), and flow rate alterations (0.7 ml/min and 1 ml/min). The test solutions were prepared at 2, 6, and 8 μg/ml concentrations, and the data collected under the modified conditions were analyzed using RSD and percentage recovery to evaluate the performance of the method under the altered conditions.
The calculated values for LOD and LOQ are based on ICH guidelines, using the slope of the calibration curve (S) and the standard deviation for the response value. Subsequently, their results have been confirmed experimentally. A validated method can offer remarkably high reliability and good precision and hence proves robust enough to conduct quantification of CS and TF by its suitability in a prescribed mobile phase [17].
Statistical analysis
For every experiment, at least six experiments were carried out. Mean±standard deviation (SD) was used to present the data. Every piece of data was compared using one-way analysis of variance (ANOVA). A variety of techniques in addition to the Newman-Keul's test, a standardised test that corresponds with them. At p<0.05, a significant difference was determined [22].
RESULTS AND DISCUSSION
This research takes advantage of the synergistic action of curcumin (CS), a plant-based anti-inflammatory agent, and tofacitinib (TF), a Janus kinase inhibitor, on the IL-6/JAK/STAT3 pathway-a key pathway involved in breast cancer development and metastasis. Combination therapy approaches have been increasingly confirmed to have synergistic action in tumor inhibition and immune modulation. Consistent with earlier research, Boța et al. (2024) demonstrated the therapeutic benefit of natural compound–drug combinations in lung cancer, affirming the synergy concept across cancer types [23].
In breast cancer, this two-mechanism strategy holds promise for increasing efficacy while minimizing drug resistance. The design of the current study mirrors the trend toward multi-targeted nanotherapy platforms, further affirming novel clinical approaches in precision oncology [24].
Preformulation studies of curcumin and tofacitinib
An analysis of organoleptic characteristics revealed that CS had a characteristic odour, yellow in color, and in the form of powder, while TF was odourless, white in colour, and an amorphous powder. Using a digital melting point apparatus (Electronics India 935, India), the melting point was observed to be within a range of 179–183 °C for CS and in range of 199–206 °C for TF, which corresponded with the reported reference (ELHAM et al., 2023). The melting point was also confirmed by, Differntial Scanning Calorimeter (DSC) (Mettler-Toledo, Japan). The range of determination was 20 to 250 °C. At 175.9 °C, the DSC thermogram (fig. 2A and 2D) displayed a strong peak and end set value indicating crystalline nature for CS and at 212.9 °C for TF. The FTIR spectra (fig. 2C and 2E) from Shimadzu, Japan, display the appropriate band at curcumin reveals key functional groups, including O-H (hydroxyl) stretching at 3700–3508 cm⁻¹, C=O (carbonyl) stretching at 1626–1599 cm⁻¹, and C=C (aromatic ring) vibrations around 1506 cm⁻¹. These confirm curcumin's aromatic, keto-enol structure with hydroxyl and alkyl groups [18].
DSC, XRD, and FTIR analyses confirmed the structural integrity and compatibility of CS and TF prior to formulation. No significant thermal or chemical interactions were observed, supporting the stability of the CS-TF mixture. The use of orthogonal techniques aligns with the standards described by Saatkamp et al. (2023), who recommended multi-modal preformulation analyses in drug development [15].
UV-Visible spectroscopy-based quantification of pure curcumin tofacitinib and CS-TF-NCs
It was observed that CS and TF were soluble in methanol. As indicated in fig. 2A and C, the absorption maximum (λmax) was determined to be 426 nm and 286 nm, respectively. With a correlation value (R2) = 0.9962 (fig. 2B) and (R2) = 0.998 (fig. 2D) respectively high linearity within the concentration range of 10–50 μg/ml table 2, the regression equation of the curve was determined to bey = 0.0317x+0.0114 at 426 nm and y = 0.026x+0.121 at 286 nm, respectively. The absorption maximum (λmax) for CS-TF-NCs was determined to be 287 nm and 421 nm as indicated in (fig. 3 A) having a high linearity in the concentration range of 5–25 μg/ml table 2 with a correlation value (R2) = 0.999 at 287 nm and (R2) = 0.9994 at 421 nm, the regression equation of the curve was determined to be y = 0.0186x+0.0072 at 287 nm and y = 0.0117x-0.0081 (fig. 3B). The precision intra-day and inter-day data shows strong reproducibility with a percentage RSD less than 1.5% in table 3, indicating that the approach is precise. It was discovered that the mean recovery value (table 4) at various doses was greater than 95%, the procedure is accurate. CS, TF and CS-TF-NCs LOD and LOQ were discovered to be 0.012 μg/ml, 0.027μg/ml and 0.04 μg/ml, respectively and were reported in table 5 [19, 27].


Fig. 2: Preformulation study of curcumin (A) DSC, (B) XRD, (C) FTIR and Tofacitinib = (D) DSC, (E) XRD, (F) FTIR
Table 2: Data for calibration curve of curcumin, tofacitinib, CS-TF, and CS-TF-NCs
| S. No. | Concentration (µG/ml) | Absorbance | |||
| CS | TF | CS-TF-NCS | |||
| AT 287 NM | AT 427 NM | ||||
| 1 | 10 | 0.376±0.005 | 0.317±0.003 | 0.099±0.002 | 0.053±0.006 |
| 2 | 20 | 0.665±0.007 | 0.664±0.008 | 0.192±0.006 | 0.106±0.007 |
| 3 | 30 | 0.896±0.003 | 0.982±0.001 | 0.292±0.004 | 0.165±0.006 |
| 4 | 40 | 1.197±0.004 | 1.23±0.01 | 0.372±0.005 | 0.225±0.001 |
| 5 | 50 | 1.43±0.01 | 1.619±0.009 | 0.473±0.008 | 0.285±0.004 |
All the values are expressed as mean±SD, n=6
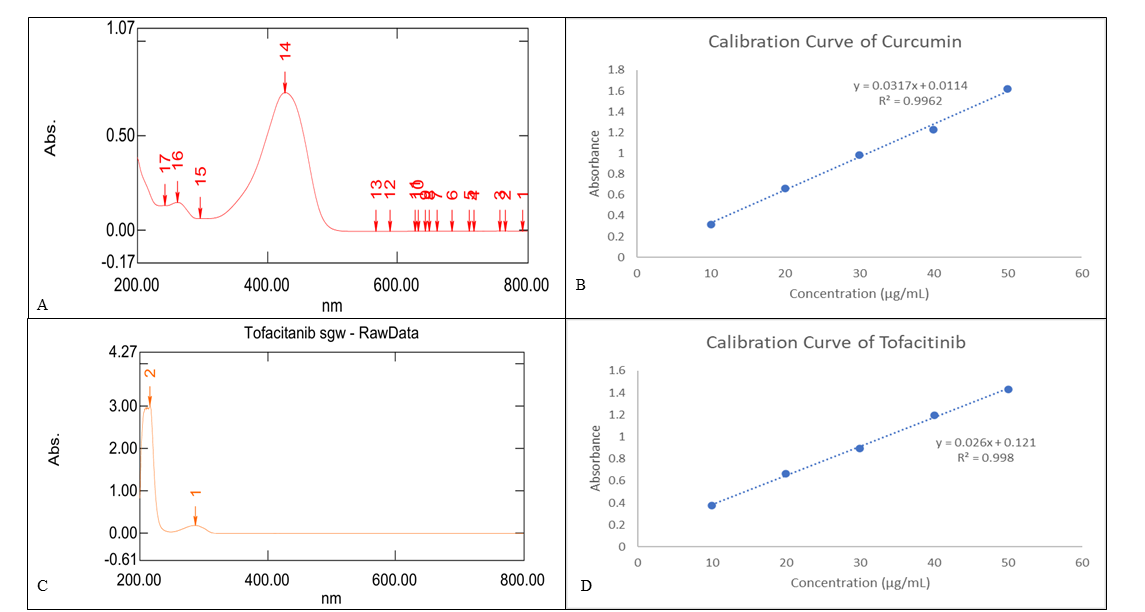
Fig. 2: (A) λmax of Curcumin, (B) Calibration curve of Curcuminat 426 nm, (C)λmax of Tofactinib, (D) Calibration curve of Tofactinib 277 at nm

Fig. 3: (A) λmax of CS-TF-NCs, (B) Calibration curve of CS-TF-NCs
Table 3: Results of intra- and inter-day precision
| Concentration (µG/ml) | Intra day | Inter day | ||||||||||
| CS | TF | CS-TF-NCS | CS | TF | CS-TF-NCS | |||||||
| Absorbance (NM)±SD | %RSD | Absorbance (NM)±SD | %RSD | Absorbance (NM)±SD | %RSD | Absorbance (NM)±SD | %RSD | Absorbance (NM)±SD | %RSD | Absorbance (NM)±SD | %RSD | |
| 20 | 0.661±0.04 | 0.0915 | 0.666±0.07 | 0.093 | 0.192±0.006 | 0.09 | 0.68±0.02 | 0.92 | 0.67±0.05 | 0.097 | 0.188±0.003 | 0.07 |
| 20 | 0.670±0.02 | 0.0927 | 0.661±0.05 | 0.097 | 0.187±0.004 | 0.08 | 0.678±0.05 | 0.97 | 0.668±0.06 | 0.095 | 0.182±0.007 | 0.09 |
| 20 | 0.660±0.05 | 0.097 | 0.664±0.08 | 0.091 | 0.191±0.002 | 0.05 | 0.675±0.05 | 0.95 | 0.670±0.05 | 0.093 | 0.191±0.007 | 0.05 |
All the values are expressed as mean±SD, n=6
Table 4: Recovery study of CS, TF and CS-TF-NCs
| λmax (NM) | Level of recovery (%) | Amount spiked recovery (mg/ml) | Amount recovered (mg/ml) | Recovery (%) | Mean recovery |
|---|---|---|---|---|---|
| CS | |||||
| 426 nm | 140 | 14 | 12.89±0.28 | 92.1%±0.2% | 94.4 %±0.5% |
| 160 | 16 | 15.31±0.21 | 95.6%±0.4% | ||
| 180 | 18 | 17.21±0.18 | 95.6%±0.7% | ||
| TF | |||||
| 277 nm | 140 | 14 | 13.21±0.23 | 94.3%±0.6% | 95.5%±0.6% |
| 160 | 16 | 15.43±0.31 | 96.4%±0.3% | ||
| 180 | 18 | 17.25±0.25 | 95.8%±0.5% | ||
| CS-TF-NCs | |||||
| 287 and 421 nm | 150 | 15 | 14.7±0.32 | 98%±0.9% | 98.1%±0.3% |
| 180 | 18 | 17.8±0.21 | 98.8%±0.1% | ||
| 200 | 20 | 19.5±0.18 | 97.5%±0.8% |
All the values are expressed as mean±SD, n=6
Table 5: Validation parameters
| Validation parameters | Results | ||
|---|---|---|---|
| CS | TF | CS-TF-NCS | |
| Λmax | 426 nm | 277 nm | 287 and 421 nm |
| Beer’s law range (μg/ml) | 10–50 µg/ml | 10–50 µg/ml | 5-25 µg/ml |
| Correlation coefficient (R2) | 0.9962 | 0.998 | 0.999 and 0.9994 |
| Slope (m) | 0.317 | 0.026 | 0.0186 and 0.0117 |
| Intercept (c) | 0.0114 | 0.121 | 0.0072 and 0.0081 |
| Accuracy | 94.09 | 95.12 | 97.15 |
| Precision (%RSD) | 0.309 | 0.255 | 0.215 |
| Intra-day | 0.0996 | 0.2064 | 0.095 |
| Inter-day | 0.1051 | 0.1029 | 0.099 |
| LOD (μg/ml) | 0.012 | 0.027 | 0.045 |
| LOQ (μg/ml) | 0.03 | 0.055 | 0.07 |
RSD: Relative standard deviation, LOD: Limit of detection, LOQ: Limit of quantification.
Compared to Ahmed et al. (2015), who validated a UV method for tolfenamic acid in simple matrices, this study extends UV applicability to a complex nanocarrier system, offering higher sensitivity and broader pharmaceutical utility [28].
UV-spectrophotometric analysis revealed distinct λmax values for CS (426 nm) and TF (286 nm), which shifted to 421 and 287 nm upon nanocarrier encapsulation. This shift may indicate molecular interactions or alterations in the microenvironment around the drugs. The high correlation coefficient (R² = 0.9994) in the range of 5–25 µg/ml demonstrates excellent linearity, while the LOD and LOQ (0.012 µg/ml and 0.03 µg/ml for CS) confirmed high sensitivity.
High-performance liquid chromatography
To estimate CS and TF in formulated nanocarrier, a validated HPLC method was developed. The HPLC approach is superior to UV spectrophotometric assessment because it allows for approximation even at lower concentrations. In addition, this technique's simple actions make it easier to detect even at very small concentrations Depending on the solubility of CS and TF, different solvents such as ethanol, methanol, and 2-propanolol were tried, and their proportions were adjusted with water. This was the first step in the isocratic chromatographic quantification of CS and TF. Numerous trial runs were conducted with different combinations of methanol and orthophosphoric acid pH 3.5, and the chromatograms produced showed uneven peaks, poor separation, and tailing factors less than 5. Simultaneously, the tailing factor was less than 3 and the ratio Methanol: orthophosphoric acid pH 3.5 (75:25) provided comparatively acceptable resolution. The best separation of CS and TF was obtained using Methanol: orthophosphoric acid pH 3.5 (80:20), with chromatographic parameters including a column temperature of 26 °C, an injection volume of 20 µl, a flow rate of 0.8 ml/min, and a detection wavelength of 302 nm [29]. Under ambient settings, 2.630±0.005 and 2.631±0.003 was the retention time (Rt) at which CS and TF were discovered respectively (fig. 4A). The theoretical plate (TP) value of 2268±55 and 2268±67 and the factor (TF) of 0.91±0.003 and 0.89±0.007 were both within the predetermined bounds table 6. By maintaining the other chromatographic conditions as previously described, the primary goal of analytical profiling of CS, TF, and CS-TF-NCs was achieved. The solubility of CS-TF-NCs was checked by using different solvents such as ethanol, methanol, isopropyl alcohol and other polar solvents, CS-TF-NCs was found to be soluble in methanol and its proportion was adjusted with orthophosphoric acid pH 3.5, isocratic mode of HPLC was used for quantification of nanocarrier which showed uneven peaks and tailing factors less than 3. Simultaneously, the tailing factor was less than 3.5 and the ratio Methanol: orthophosphoric acid pH 3.5 (60:40) provided comparatively acceptable resolution. The best separation of CS-TF-NCs was obtained using Methanol: orthophosphoric acid pH 3.5 in a ratio of 80:20, with chromatographic parameters including a column temperature of 26 °C, an injection volume of 20 µl, a flow rate of 0.8 ml/min, and a detection wavelength of 302 nm. Under ambient settings, 2.212±0.008 and 4.285±0.01was the retention time (Rt) at which CS and TF were discovered, respectively (fig. 4B). The theoretical plate (TP) value of 3968±45 and 6668±77 and the factor (TF) of 0.85±0.005 and 0.75±0.003 table 6.

Fig. 4: HPLC chromatograms of (A) Curcumin and Tofactinib in mobile phase (B) Curcumin-Tofacitinib-Nanocarriers. Chromatographic conditions were injection volume 20 µl**; flow rate 0.8 ml/min; temperature 25 ◦C; run time 10 min; detection wavelength 302 nm
Table 6: System suitability parameters
| Parameter | CS | TF | CS-TF-NCS | |||
|---|---|---|---|---|---|---|
| Mean±SD | %RSD | Mean±SD | %RSD | Mean±SD | %RSD | |
| Rt | 2.630±0.005 | 0.172 | 2.631±0.003 | 0.165 | 2.212±0.008 and 4.285±0.01 | 0.25 |
| TF | 0.91±0.003 | 0.1 | 0.89±0.007 | 0.15 | 0.85±0.005 and 0.75±0.003 | 0.13 |
| TP | 2268±55 | 2.7 | 2268±67 | 3.1 | 3968±45 and 6668±77 | 2.1 |
All the values are expressed as mean±SD, n=6
The RP-HPLC technique provided better resolution and detection. Well-defined peaks with retention times of 2.212 min (CS) and 4.285 min (TF) and low LODs (0.045 µg/ml) confirm the sensitivity of the system. Recovery of 97% to 99%, and RSD values always<1.5%, confirm precision and repeatability.
Relative to Gorantla et al. (2021), who prepared HPLC protocols for TF in liquid crystalline nanoparticles, this work breaks new ground through the validation of the simultaneous detection of both drugs within a combination nanocarrier system [13]. In addition, Trivedi et al. 2021) provided HPLC-based quantitation of thymoquinone with greater LODs, implying that the current method is superior to earlier models in terms of sensitivity [18].
Method validation
The calibration curve was used to verify the linearity of the devised analytical method by examining the relationship between the response and the concentration of CS and TF in the sample. A calibration curve was built (n = 6) for the CS and TF in the mobile phase Methanol: Orthophosphoric acid pH 3.5 in a ratio of 80:20 for five concentrations ranging from 5 to 25 μg/ml. The regression equations for the Methanol: Orthophosphoric acid pH 3.5 in a ratio of 80:20, respectively, were found to be y = 0.0257x+0.0102; correlation coefficient (R2) = 0.9951 and it was determined from the equations and quality of curve that the results were significant and linear, with a rise in response observed as the concentration of CS and TF in the sample increased [30, 31].
The study examined the repeatability and intermediate precision of CS and TF at three distinct doses. In the mobile phase, the concentrations were 5 µg/ml (low), 10 µg/ml (medium), and 15 µg/ml (high) table 7. The analysis was conducted on the same day (repeatability) and over three separate days (intermediate precision). The maximum %RSD values table 8 were less than 2, indicating that the developed approach had higher precision.
Table 7: Recovery study
| Concentration (µG/ml) | CS | TF | CS-TF-NCS |
|---|---|---|---|
| % Recovery | % Recovery | % Recovery | |
| 5 | 97.7±0.29% | 97.6±0.27% | 98.6±0.09% |
| 10 | 97.8±0.25% | 98.9±0.11% | 98.8±0.06% |
| 15 | 98.5±0.23% | 99.7±0.33% | 98.9±0.07% |
All the values are expressed as mean±SD, n=6
Table 8: Repeatability and intermediate precision
| Concentration (µg/ml) | Inter day | Intra day | ||||||||||
|---|---|---|---|---|---|---|---|---|---|---|---|---|
| CS | TF | CS-TF-NCS | CS | TF | CS-TF-NCS | |||||||
| Mean±SD | %RSD | Mean±SD | Mean±SD | %RSD | Mean±SD | Mean±SD | %RSD | Mean±SD | Mean±SD | %RSD | ||
| 5 | 99.21±0.07 | 0.35 | 99.11±0.2 | 0.317 | 98.86±0.23 | 0.185 | 97.83±0.39 | 0.317 | 99.31±0.09 | 0.215 | 99.03±0.12 | 0.317 |
| 10 | 98.2±09 | 0.28 | 95.07±03 | 0.279 | 98.75±31 | 0.165 | 96.21±13 | 0.279 | 98.91±10 | 0.186 | 97.87±07 | 0.279 |
| 15 | 99.87±0.27 | 0.34 | 99.17±0.4 | 0.208 | 98.01±0.05 | 0.238 | 98.05±0.08 | 0.208 | 99.10±0.32 | 0.149 | 98.90±0.27 | 0.208 |
All the values are expressed as mean±SD, n=6
The standard deviation of the response and the slope obtained from linear regression of the calibration curve were used to calculate the LOD and LOQ within acceptable precision and accuracy. The minimum quantity of CS, TF and CS-TF-NCs that can be found, or LOD and LOQ in Methanol: Orthophosphoric acid pH 3.5 in a ratio of 80:20, For n = 6, the corresponding values were 27.95±0.67 ng/ml, 31.11±0.45 ng/ml, and 97.09±0.5 ng/ml, 99.51±0.37 ng/ml.
A comparative analysis of UV-spectrophotometry and RP-HPLC for curcumin-tofacitinib nanocarriers showed high precision, sensitivity, and accuracy. UV-spectrophotometry had a linearity range of 10–50 μg/ml for CS and TF with excellent correlation coefficients (R² = 0.9962 and R² = 0.998). The LOD values were 0.012 μg/ml (CS) and 0.027 μg/ml (TF), and LOQ values were 0.03 μg/ml (CS) and 0.055 μg/ml (TF), indicating that the method was of high sensitivity.
RP-HPLC analysis yielded retention times of 2.212 min (CS) and 4.285 min (TF) (fig. 4). The approach was found to be highly precise, with %RSD<1.5% at all concentrations tested table 8. Recovery levels varied between 97% and 99%, proving the accuracy and reproducibility of nanocarrier quantitation.
The established methods present a solid analytical protocol for pharmaceutical uses, assuring accurate drug measurement, stability testing, and quality control in nanocarrier formulations.
CONCLUSION
This research effectively formulated and validated sophisticated analytical techniques for the quantification and characterization of curcumin-tofacitinib nanocarriers (CS-TF-NCs) to overcome solubility, bioavailability, and systemic toxicity limitations. The improved UV-spectrophotometry and RP-HPLC techniques were highly sensitive, accurate, and reproducible with λmax values of 287 nm and 421 nm and R² = 0.9994 in a 5–25 μg/ml range. Recovery yields for CS, TF, and CS-TF-NCs were 94.09%, 95.12%, and 97.15%, respectively, with retention times of 2.212 and 4.285 min under the optimal chromatographic conditions. LOD and LOQ were 0.045 μg/ml and 0.07 μg/ml, validating the precision of the method for use in pharmaceutical applications.
Aside from these observations, further studies are needed to generalize this method's use in other combination therapies, explore its use in different drug delivery systems, and perform in vivo studies to confirm therapeutic effectiveness in breast cancer models. These follow-up studies will continue to enhance the clinical significance and translational value of curcumin-tofacitinib nanocarriers in oncology.
ACKNOWLEDGEMENT
We would like to acknowledge and express our gratitude to Department of Pharmaceutical Sciences, Rashtrasant Tukadoji Maharaj Nagpur University Nagpur, Maharashtra, India for providing research facilities.
FUNDING
I would like to thank Mahatma Jyotiba Phule Research Fellowship for MJRF2022 Fellowship.
AUTHORS CONTRIBUTIONS
Experimentation and data analysis were done by Ms. Suchita Waghmare, Manuscript drafting and experimentation work was carried out by Mr. Ujban Hussain, the concept for the work was proposed by Nilesh Rarokar, this work was carried out under the supervision of Dr. P. B. Khedekar.
CONFLICT OF INTERESTS
The writers confirm that their work was not impacted by personal or financial interests.
REFERENCES
Bota M, Vlaia L, Jijie AR, Marcovici I, Crisan F, Oancea C. Exploring synergistic interactions between natural compounds and conventional chemotherapeutic drugs in preclinical models of lung cancer. Pharmaceuticals (Basel). 2024 May 8;17(5):598. doi: 10.3390/ph17050598, PMID 38794168.
Trivedi S, Hussain U, Agade R, Belgamwar V. A comprehensive review on exploring thymoquinone as novel therapeutic molecule for clinical management of glioblastoma multiforme. Pharmacological Research Natural Products. 2024 Dec 1;5:100107. doi: 10.1016/j.prenap.2024.100107.
Chu X, Tian W, Ning J, Xiao G, Zhou Y, Wang Z. Cancer stem cells: advances in knowledge and implications for cancer therapy. Signal Transduct Target Ther. 2024;9(1):170. doi: 10.1038/s41392-024-01851-y, PMID 38965243.
Jiang RY, Zhu JY, Zhang HP, YU Y, Dong ZX, Zhou HH. STAT3: key targets of growth promoting receptor positive breast cancer. Cancer Cell Int. 2024;24(1):356. doi: 10.1186/s12935-024-03541-9, PMID 39468521.
LV Y, MI P, Babon JJ, Fan G, QI J, Cao L. Small molecule drug discovery targeting the JAK STAT pathway. Pharmacol Res. 2024 Mar;204:107217. doi: 10.1016/j.phrs.2024.107217.
Zoi V, Kyritsis AP, Galani V, Lazari D, Sioka C, Voulgaris S. The role of curcumin in cancer: A focus on the PI3K/Akt pathway. Cancers (Basel). 2024;16(8):1554. doi: 10.3390/cancers16081554, PMID 38672636.
Gravina AG, Pellegrino R, Esposito A, Cipullo M, Romeo M, Palladino G. The JAK-STAT pathway as a therapeutic strategy in cancer patients with immune checkpoint inhibitor induced colitis: a narrative review. Cancers (Basel). 2024;16(3):611. doi: 10.3390/cancers16030611, PMID 38339367.
Fernandes DA. Comprehensive review on the development of phytonanomedicines for cancer treatment. Biomedical Materials & Devices; 2025. doi: 10.1007/s44174-025-00280-x.
Seegobin N, MC Coubrey LE, Vignal C, Waxin C, Abdalla Y, Fan Y. Dual action tofacitinib loaded PLGA nanoparticles alleviate colitis in an IBD mouse model. Drug Deliv Transl Res. 2024 Non 11. doi: 10.1007/s13346-024-01736-1, PMID 39527394.
Al Thani AN, Jan AG, Abbas M, Geetha M, Sadasivuni KK. Nanoparticles in cancer theragnostic and drug delivery: A comprehensive review. Life Sci. 2024 Mar;352:122899. doi: 10.1016/j.lfs.2024.122899, PMID 38992574.
Deivayanai VC, Thamarai P, Karishma S, Saravanan A, Yaashikaa PR, Vickram AS. A comprehensive review on advances in nanoparticle mediated cancer therapeutics: current research and future perspectives. Cancer Pathog Ther. 2024 Dec 9. doi: 10.1016/j.cpt.2024.11.002.
Gorantla S, Saha RN, Singhvi G. Spectrophotometric method to quantify tofacitinib in lyotropic liquid crystalline nanoparticles and skin layers: application in ex vivo dermal distribution studies. Spectrochim Acta A Mol Biomol Spectrosc. 2021 Jul 5;255:119719. doi: 10.1016/j.saa.2021.119719, PMID 33789189.
Gorantla S, Saha RN, Singhvi G. Design of experiment driven stability indicating RP-HPLC method for the determination of tofacitinib in nanoparticles and skin matrix. Futur J Pharm Sci. 2021;7(1). doi: 10.1186/s43094-021-00325-0.
Agade R, Hussain U, Trivedi S, Belgamwar V. Analytical quantification of bosutinib in nanocarrier using UV and HPLC: method development and validation. Int J App Pharm. 2024;16(5):139-45. doi: 10.22159/ijap.2024v16i5.51394.
Saatkamp RH, Dos Santos BM, Sanches MP, Conte J, Rauber GS, Caon T. Drug excipient compatibility studies in formulation development: a case study with benznidazole and monoglycerides. J Pharm Biomed Anal. 2023 Oct 25;235:115634. doi: 10.1016/j.jpba.2023.115634, PMID 37595356.
Salve PS, Qutub M, Hussain UM, Tatode AA, Tammewar S. Transferosome enhanced transdermal therapy: a novel approach for duloxetine delivery for management of neuropathic pain. Bio Nano Science. 2025;15(2):272. doi: 10.1007/s12668-025-01877-8.
Zambre D, Hussain U, Sheikh S, Jaiswal S, Belgamwar V. Stability indicating HPLC analysis of azilsartan medoxomil potassium: a QBD based method development and validation. J Chromatogr B Analyt Technol Biomed Life Sci. 2025 Apr 26;1259:124599. doi: 10.1016/j.jchromb.2025.124599, PMID 40311482.
Trivedi S, Belgamwar V, Wadher K. Development and validation of ultra visible spectrophotometric method for the estimation of thymoquinone. AJACR. 2021 Apr;8(2):25-30. doi: 10.9734/ajacr/2021/v8i230189.
Mallya P, Yarlagadda DL, Lewis S. A novel stability indicating RP-HPLC method for the simultaneous estimation and in vitro and in vivo evaluation: curcumin and naringin co-amorphous system. Food Anal Methods. 2024;17(5):751-65. doi: 10.1007/s12161-024-02606-9.
Gupta S, Gupta J. Development optimization and assessment of naproxen microsponges by box behnken design as a targetted and controlled release drug delivery. Int J App Pharm. 2024;16(6):359-67. doi: 10.22159/ijap.2024v16i6.51765.
Wadher K, Trivedi S, Rarokar N, Umekar M. Development and assessment of rutin loaded transfersomes to improve ex vivo membrane permeability and in vitro efficacy. Hybrid Adv. 2024 Apr;5:100144. doi: 10.1016/j.hybadv.2024.100144.
Puranik PK, Chainani YD, Hussain UM. Quetiapine fumarate loaded mixed micelles in nasal in situ gels: enhancing efficacy for schizophrenia management. Next Res. 2025 Jun 1;2(2):100234. doi: 10.1016/j.nexres.2025.100234.
Boța M, Vlaia L, Jijie AR, Marcovici I, Crişan F, Oancea C. Exploring synergistic interactions between natural compounds and conventional chemotherapeutic drugs in preclinical models of lung cancer. Pharmaceuticals (Basel). 2024;17(5):598. doi: 10.3390/ph17050598, PMID 38794168.
Jahan S. Al saigul AM, Abdelgadir MH. Breast cancer breast cancer. J R Soc Med. 2016;70(8):515-7.
Trivedi S, Belgamwar V. Fabrication and optimization of chitosan-g-m-PEG-NH2 copolymer for advanced glioblastoma therapy using surface engineered lentinan loaded nanovesicles for nasal delivery. Int J Biol Macromol. 2024 Jul 1;273(2):133125. doi: 10.1016/j.ijbiomac.2024.133125, PMID 38897498.
Ahmed S, Mustaan N, Sheraz MA, Nabi SA, Ahmad I. Validation of a UV spectrometric method for the assay of tolfenamic acid in organic solvents. J Pharm (Cairo). 2015;2015:216249. doi: 10.1155/2015/216249, PMID 26783497.
Patil K, Salve PS, Hussain U, Tatode A. Nano trends enhanced therapy for diabetic neuropathy utilizing venlafaxine hydrochloride loaded transferosome based transdermal gel. Nano Trends. 2025 Jan;9:100085. doi: 10.1016/j.nwnano.2025.100085.
Ahmed S, Mustaan N, Sheraz MA, Nabi SA, Ahmad I. Validation of a UV spectrometric method for the assay of tolfenamic acid in organic solvents. J Pharm (Cairo). 2015;2015:216249. doi: 10.1155/2015/216249, PMID 26783497.
Trivedi S, Deshpande A, Belgamwar V, Bhoyar V, Wadher K. Stability indicating HPLC method for estimation of thymoquinone in nasal simulated fluid: method development and validation. J Pharm Res Int. 2021;33(60A):233-40. doi: 10.9734/jpri/2021/v33i60A34480.
Trivedi S, Kause S, Belgamwar V. Intranasal delivery of poly (D-glucosamine) encrusted self-assembled lipidic nanovesicles to enhanced brain uptake of thymoquinone for management of glioblastoma multiforme. J Drug Deliv Sci Technol. 2023 Dec 1;90:105149. doi: 10.1016/j.jddst.2023.105149.
Trivedi S, Patel K, Belgamwar V, Wadher K. Functional polysaccharide lentinan: role in anti-cancer therapies and management of carcinomas. Pharmacological Research Modern Chinese Medicine. 2022 Mar;2:100045. doi: 10.1016/j.prmcm.2022.100045.