
Int J App Pharm, Vol 17, Issue 6, 2025, 464-470Original Article
A NOVEL LC-MS/MS TECHNIQUE FOR THE QUANTITATION OF LURBINECTEDIN IN HUMAN PLASMA: APPLICATION OF STABILITY STUDIES
PRATHYUSHA KOTHA1, CHANDRASHEKARA RAO BARU2*, CHAMAKURI KANTLAM3
1Bharatiya Engineering Science and Technology Innovation University, Anantapur-515231, Andhra Pradesh, India. 2Department of Pharmacy, Chilkur Balaji College of Pharmacy, Aziz Nagar, Moinabad Road-500075, Telangana, India. 3Faculty of Pharmacy, Brilliant Grammar School Educational Society’s Group of Institutions-Integrated Campus(Faculty of Engineering and Faculty of Pharmacy), Rangareddy, Hyderabad-501505, Telangana, India
*Corresponding author: Chandrashekara Rao Baru; *Email: barupharma@gmail.com
Received: 09 Jan 2025, Revised and Accepted: 02 Oct 2025
ABSTRACT
Objective: A linear and precise liquid chromatography coupled with tandem mass spectrometry method was developed and validated for the quantification of lurbinectedin in plasma. Canagliflozin served as an internal standard (IS).
Methods: The plasma extraction utilized 5 ml of ethyl acetate as the solvent. The examination was performed utilizing a Zorbax ODS (50 mm × 2.1 mm x 3µ) stationary phase at ambient conditions, with a mobile phase comprising 0.1% HCOOH, acetonitrile, and methyl alcohol in a ratio of 15:50:35. The measurement of the mobile phase's flow rate was recorded at 0.4 ml/min. In positive ionization mode utilizing electrospray, the drug and internal standard were detected, resulting in mass transitions of (m/z): Lurbinectedin, 785.30/711.20 and Canagliflozin (IS), 445.15/267.12.
Results: A linear correlation was established between the concentrations of Lurbinectedin and their corresponding peak proportions to canagliflozin across the concentration range of 0.2-3200 ng/ml. The precision for Lurbinectedin, measured both within the same day and across different days, was determined to be ≤5.18%. Inter and intra-day bias ranged from −4.17% to 4.53. The measured average extraction recovery for Lurbinectedin was found to be 99.23%. The measurement of the internal standard's recovery was found to be 98.31%. Lurbinectedin was subjected to thorough assessment regarding its long-term, freeze-thaw, bench top, short-term stability, auto sampler, dry extract, and stock solution stability at both low quality control (QC) and high QC levels, showing consistent stability across all evaluated conditions.
Conclusion: The developed method has become a cornerstone of modern clinical laboratories due to its versatility, sensitivity, and precision, and its ability to support both routine clinical diagnostics and cutting-edge personalized medicine.
Keywords: Cancer, Lurbinectedin, LC-MS/MS, Validation, Accuracy
© 2025 The Authors. Published by Innovare Academic Sciences Pvt Ltd. This is an open access article under the CC BY license (https://creativecommons.org/licenses/by/4.0/)
DOI: https://dx.doi.org/10.22159/ijap.2025v17i6.53642 Journal homepage: https://innovareacademics.in/journals/index.php/ijap
INTRODUCTION
A medication that alkylates deoxyribonucleic acid (DNA), identified as lurbinectedin, has been studied for its potential application in the treatment of various cancers, such as chronic lymphocytic leukemia (CLL) (fig. 1), mesothelioma, breast cancer, and small cell lung cancer (SCLC). The anticancer compound ecteinascidin (trabectedin) is sourced from the marine tunicate Ecteinascidiaturbinata. The main difference is that lurbinectedin demonstrates greater efficacy against tumors compared to trabectedin, attributed to the replacement of a tetrahydro β‐carboline with a tetrahydroisoquinoline [1].
By interacting with guanine residues located in the minor groove of DNA, it forms adducts that induce a bending of the DNA helix toward the major groove. A series of events initiates at this stage, modifying the role of transcription factors and reducing the effectiveness of DNA repair mechanisms. Ultimately, this results in cellular demise through the disruption of double-stranded DNA. The compound also suppresses the activity of ribonucleic acid (RNA) polymerase II, interferes with nucleotide transfer leading to reduced expression of the EWS-FL11 protein, and hinders the activity of human monocytes as well as the infiltration of macrophages into tumor tissue, among various other mechanisms [2].

Fig. 1: Chemical structure of lurbinectedin
The mechanism through which lurbinectedin exerts its chemotherapeutic effect involves a robust attachment to DNA, leading to the breakage of DNA strands and subsequent cell death [3]. Due to the association of lurbinectedin with myelosuppression, it is essential for patients on this medication to have their cytopenias closely monitored. Confirm that the platelet count exceeds 100,000/mm3 and that the neutrophil count is above 1,500 cells/mm3 before initiating treatment. Should the neutrophil count decrease to less than 500 cells/mm3, it would be wise to evaluate the option of administering granulocyte colony-stimulating factor (G-CSF). Lurbinectedin has been linked to hepatic injury. Monitoring liver function tests is crucial both during and after therapy. It may be essential to postpone, lessen, or completely cease treatment based on the extent of the liver toxicity [4-6].
Only two studies [7, 8] regarding LCMS/MS for lurbinectedin have been documented in the existing literature. Reported methods are having poor recovery values of 91.25% and the stability studies are also very poor. The domains of pharmacodynamics, forensics, and pharmacokinetics could all gain from a more focused and systematic LCMSMS methodology for analyzing biological solutions. So, there is a need of better method for the study of lurbinectedin in human dipotassium salt of ethylenediaminetetraacetic acid (K2EDTA) plasma.
MATERIALS AND METHODS
Reagent chemicals
Canagliflozin (99.52%) and Lurbinectedin (99.17%) were supplied by Hetero Pharmaceuticals, located in Hyderabad, India. Plasma sourced from the Vivekananda Blood Bank in Hyderabad, India, is free from drugs and includes the anticoagulant K2-EDTA. The research utilized water from water purification system produced by MilliQ system. We obtained our premium ethyl acetate, ammonium acetate, formic acid, acetonitrile, and HPLC-grade methanol from Merck, Mumbai, India.
LC-MS/MS instrument
Plasma samples have undergone extraction of analytes using standard C-18 Sep-Pak tubes produced by Waters Corporation, MA, USA. The process of chromatographic elution was carried out using an LC-MSMS instrument featuring a Waters 2695 Alliance separating model for sample introduction and solvent delivery. This was coupled with a Micro mass Quattromicro API triple quadrupole mass spectrometric system linked to an electrospray ionization (ESI) (Z-spray) source for detection purposes. The determination of the drug and internal standard was performed using an RP-Zorbax ODS (50 mm × 2.1 mm x 3µ) column, paired with a Symmetry C18 (3.9 mm × 20 mm, 5µm) guard column. The Mass Lynx software (Version 4.0), operating on Microsoft Windows XP Professional, was utilized to manage the device, acquire data, assess the signal-to-noise ratio, and perform peak integration and smoothing.
LC and mass system conditions
An analysis was conducted utilizing a Zorbax ODS (50 mm × 2.1 mm x 3µ) column at ambient temperature with a variable solvent mixture of 0.1% HCOOH, methanol, and acetonitrile in a ratio of 15:35:50. The flow rate of the mobile phase was measured at 0.4 ml/min. The ESI source interface was utilized in the positive ionization modes during our investigation. During our research, we utilized the electro spray ionisation interface, employing the positive ionisation method for effective management. This study took into account the following parameters: a capillary voltage of 2.5 kV, a source temperature of 200 °C, and a desolvation temperature of 450 °C. At a flow rate of 700 l/h, nitrogen served as the desolvation gas, while at a flow rate of 50 l/h, nitrogen was employed as the cone gas. An argon flow rate of 0.17 ml/min was utilized as the collision gas within the collision cell. The optimal collision energies and cone voltages identified were 24V/18V and 30V/25V for Lurbinectedin and canagliflozin, respectively. In positive ionization mode using electrospray, the drug and internal standard were identified, yielding mass transitions of (m/z): Lurbinectedin, 785.30/711.20 and Canagliflozin (IS), 445.15/267.12.
Quality control and standard solutions
Stock solutions of Lurbinectedin and IS were prepared at a concentration of 1.0 mg/ml in the mobile phase. They performed additional dilution with plasma to achieve solutions that were 10 micrograms per millilitre. In human plasma, eight calibration standards were produced with concentrations ranging from 0.2 to 3200 ng/ml, alongside four quality control samples lower limit of quantification (LLOQ), lower (LQC), median MQC and high (HQC) at concentrations of 0.2, 0.6, 1600, and 2400 ng/ml. Following a 1 min vortexing process, 1.0 ml aliquots were transferred into borosilicate glass culture tubes measuring 13 x 100 mm. The calibration standards and quality control samples were stored at a temperature of-20 degrees Celsius until their use.
Sample preparation
It was determined that aliquots of one millilitre of blank plasma, calibration curve, or quality control samples should be allowed to reach room temperature. Following the addition of 5 ml of ethyl acetate to each tube, the final concentration was meticulously adjusted to 750 ng/ml by incorporating 100 microliters of the internal standard solution and subsequently vortexing the mixture for 1 min. Upon completion of the process, the resulting solution underwent centrifugation at 3500 rpm for a duration of fifteen minutes. Subsequently, the transparent solution that had developed at the surface was isolated, and it underwent evaporation to dryness using a controlled nitrogen flow within a heating block maintained at 45 °C. The residues were subsequently reconstituted in 100 µl of mobile phase, transferred into an auto-sampler vial, and 5 microliters were injected into the LC-MS/MS system.
Stability studies
Maintaining the processed quality control samples in an auto sampler at a temperature of 5±3 °C for a duration of 2 d, 20 h, and 27 min allowed for the evaluation of their stability within the auto sampler. By conducting a screening at-20 °C for a duration of two months, the long-term stabilities for both the analyte and the internal standard were evaluated at low-and high-quality control levels. By maintaining a temperature of 2-8 °C for a duration of 10 d, the stability of the stock solution for the analyte was evaluated at both low-and high-quality control levels. Three cycles of freeze and thaw stability processing were conducted at-20 °C and ambient temperature. The drug and internal standard were subjected to short-term stability assessment by being maintained at ambient conditions for a duration of 8 h. A storage duration of 17 h and 28 min at room temperature was employed to evaluate the bench-top condition of the quality control spiked sample solutions. The evaluation of quality control spiked samples for the stability of dry extract was conducted over a period of two days, with the samples maintained at a temperature of-28±5 °C.
Validation of the analytical method
The method was confirmed in line with the established protocols specified in the United States food Drug Administration (US FDA) guidelines regarding the validation of bioanalytical techniques. The validation criteria included specificity, accuracy, linearity, precision, stability, and recovery [9-14].
RESULTS AND DISCUSSION
Optimization of LCMSMS parameters
The precursor and product ions of Lurbinectedin and IS were quantified by introducing the standard solution (1.0µg/ml in acetonitrile) into a mass spectrometry instrument using a syringe pump at a flow rate of 20µl. The reference mixture was employed to identify the ions of both the product and precursor for the two pharmaceuticals. The mass spectrometry data collection utilized the MRM technique, focusing on the positive ion transitions at the specified m/z values: Lurbinectedin at 785.30/711.20 and the internal standard at 445.15/267.12, respectively. The source temperature was established at 200 °C, with the capillary voltage configured to 2.5 kV, and the desolvation temperature adjusted to 450 °C. At a flow rate of 700 l/h, nitrogen was employed as the desolvation gas, while a flow rate of 50 l/h was used for nitrogen as the cone gas. In the collision cell, a circulation rate of argon at 0.17 ml/min was utilized as the gas for collisions. The optimal collision energies and cone voltages were determined to be 24V/18V for Lurbinectedin and 30V/25V for canagliflozin. Electrospray ionization was employed to identify the eluent in the positive ion mode. The mass-to-charge transitions utilized were: Lurbinectedin, 785.30/711.20, and canagliflozin (IS), 445.15/267.12. Canagliflozin was selected as the internal standard owing to its comparable ionization efficiency in positive ESI mode, stable and reproducible fragmentation pattern, and retention time proximity to Lurbinectedin without co-elution or interference, ensuring reliable quantification
Specificity
Conducted tests on six distinct varieties of blank plasma, in addition to those containing Lurbinectedin or IS. No other pharmacological or endogenous component was identified as co-eluting with Lurbinectedin or the internal standard. The chromatogram depicted in fig. 2(A) serves as a representative example of a standard chromatogram derived from drug-free human plasma (blank), utilized in the formulation of standards and quality control samples. Fig. 2B illustrates blank plasma that has been supplemented with the internal standard at a concentration of 750 ng/ml [15-18].
Linearity
The study's linear characteristics were confirmed through an examination of a set of standard mixtures containing Lurbinectedin and IS in human plasma, assessed at eight distinct concentrations from 0.2 to 3200 ng/ml. A regression analysis was performed on the peak proportions related to the internal standard, along with the concentrations [15-20]. The mean equations identified for Lurbinected in were y = 0.0007x-0.0019, with a r2 value of 0.9998 (n = 6). The observed correlation coefficient (r² = 0.9998) exceeded the acceptance threshold (≥ 0.99) recommended by FDA and european medicines agency (EMA) bioanalytical method validation guidelines, confirming excellent linearity of the assay. Six-matrix specificity assessments demonstrated that no significant endogenous peaks or interferences at the retention times of Lurbinectedin or the internal standard were observed, further validating method selectivity. These findings confirm compliance with international regulatory expectations for linearity and specificity. Through a reverse calculation to ascertain the concentration of Lurbinectedin in human plasma using the calibration curves, it was concluded that the curves employed for calibration were suitable for application (table 1). All calculated concentrations were determined to be significantly lower than the allowable maximum limit. Fig. 3 illustrates the average calibration curve for Lurbinectedin. The lower limit of quantification for Lurbinectedin was determined to be 0.2 ng/ml, with a signal-to-noise ratio exceeding 10, which proved adequate for precise measurement of Lurbinectedin in plasma sample evaluations.
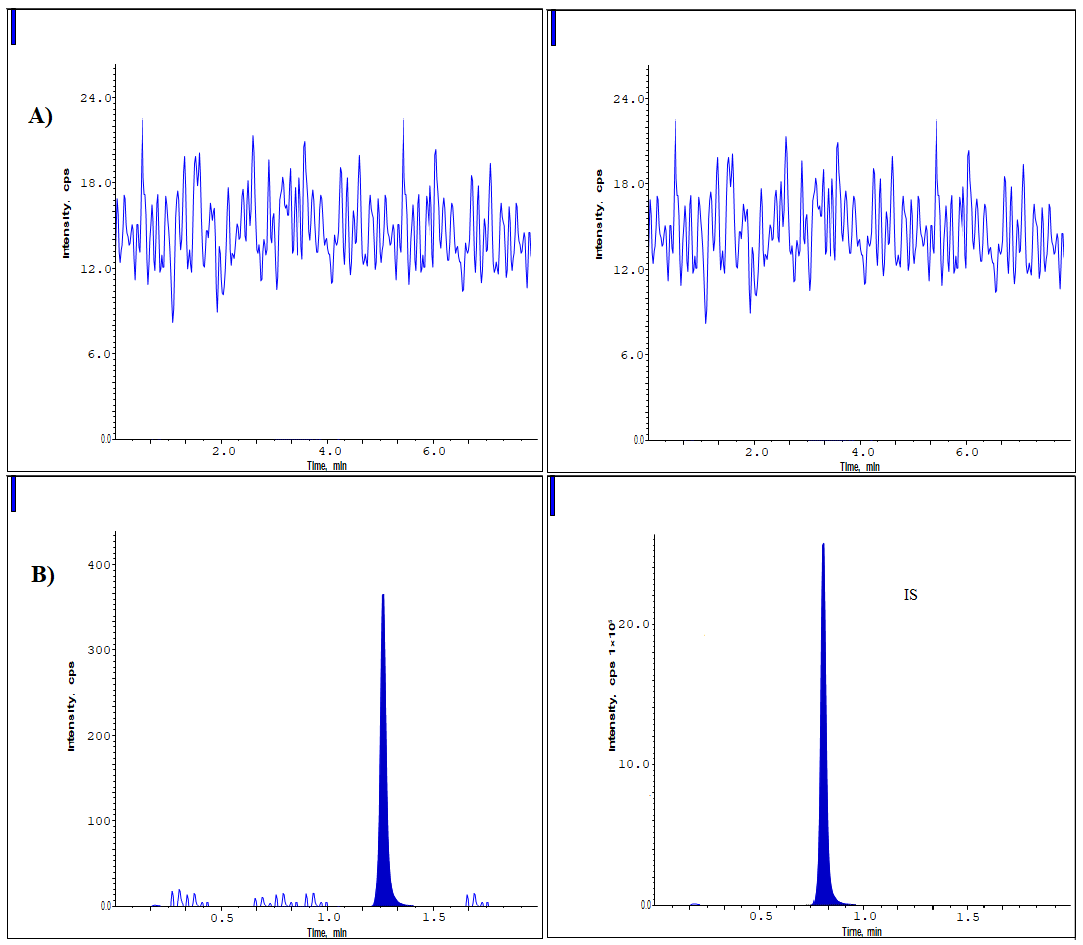
Fig. 2: Lurbinectedin chromatograms at A) Blank and B) LLOQ levels
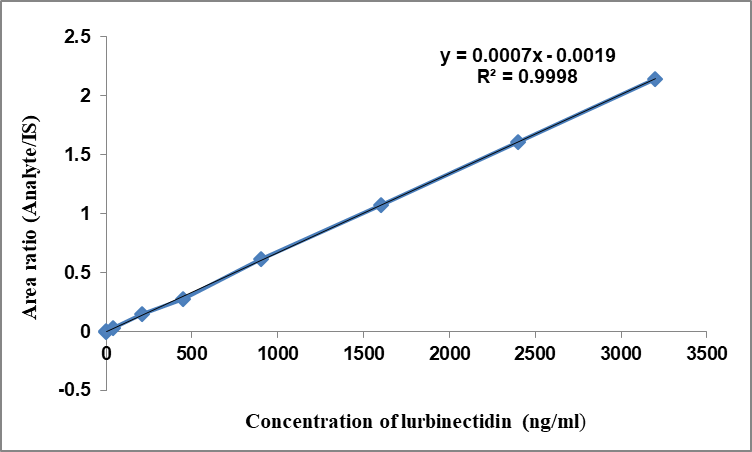
Fig. 3: Linearity of lurbinectedin
Table 1: Calibration standards for lurbinectedin
| L S-ID | Concentration (ng/ml) | Average responses | Analyte/IS responses | IS responses |
| LS01 | 0.2 | 394 | 0.000155 | 2545954 |
| LS02 | 40 | 70200 | 0.027583 | 2545003 |
| LS03 | 210 | 375050 | 0.147308 | 2546021 |
| LS04 | 450 | 695641 | 0.273266 | 2545657 |
| LS05 | 900 | 1565418 | 0.615107 | 2544952 |
| LS06 | 1600 | 2724235 | 1.070317 | 2545259 |
| LS07 | 2400 | 4096541 | 1.610239 | 2544058 |
| LS08 | 3200 | 5458456 | 2.144494 | 2545335 |
| LS: Calibration standards; IS: internal standard |
Precision and accuracy (Bias)
We evaluated the accuracy and systematic error for four distinct quality control concentrations (0.2, 0.6, 1600, and 2400 ng/ml). The intraday precision for Lurbinectedin, based on 10 measurements, was determined to be 5.18%. In contrast, the interday precision, calculated from 20 measurements over three consecutive days, was found to be 4.39%. The intraday bias fluctuated between a minimum of 3.50% and a maximum of 4.53 [21-23], whereas the interday bias exhibited a range from 4.17% to 3.95%. Table 2 presents a concise overview of the results achieved. Fig. 4 displays the LC-MS/MS chromatograms for LQC (0.6 ng/ml), MQC (1600 ng/ml), and HQC (2400 ng/ml), each spiked with IS (750 ng/ml).
Recovery
The evaluation of peak heights from samples spiked prior to extraction versus those spiked post-extraction (6 sets) facilitated the calculation of extraction recovery for Lurbinectedin at three distinct concentrations (0.6, 1600, and 2400 ng/ml), along with the internal standard at a single concentration (750 ng/ml) [24-29]. This was conducted to ascertain the internal standard at a specific concentration. The mean recovery rate of Lurbinectedin following extraction was determined to be 99.23% (fig. 4 and table 3). The recovery of the internal standard was found to be 98.31%.
Matrix effect
The impact of the matrix was assessed quantitatively by analyzing the peak heights of Lurbinectedin both with and without the presence of matrix components. The six sample solutions were infused and measured at both low and high quantification levels [20-25]. The coefficient of variation results at the low quality control and high quality control levels were 3.64 and 3.87, respectively (table 4).
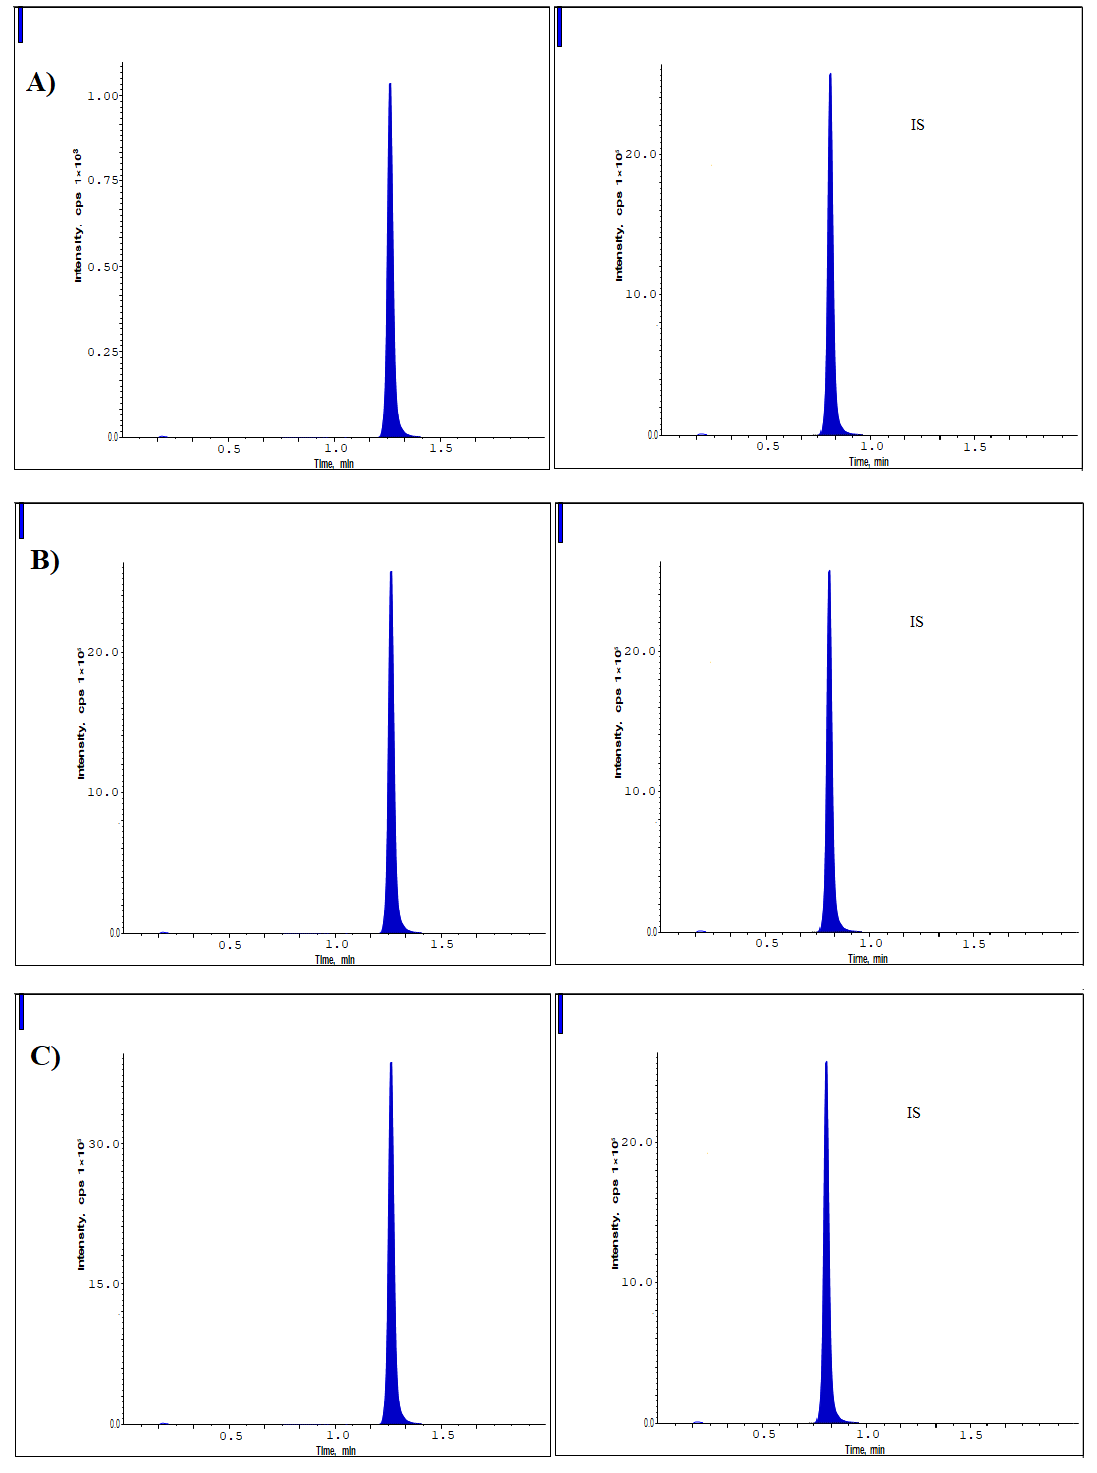
Fig. 4: Lurbinectedin chromatograms at A) Low-QC B) Medium-QC and C) High-QC levels
Table 2: Lurbinectedin precision and accuracy for inter-batch and intra-batch
| Concentrations levels |
Nominal concentrations (ng/ml) |
Inter-batch | Intra-batch | ||
| Meana(SD) | %CV | Meana(SD) | %CV | ||
| LLOQ | 0.2 | 0.207 (0.009) | 4.33 | 0.193 (± 0.01 | 5.18 |
| LQC | 0.6 | 0.619 (0.024 | 3.88 | 0.617 (± 0.022) | 3.56 |
| MQC | 1600 | 1533.25 (46.87) | 3.06 | 1672.56 (± 54.23) | 3.24 |
| HQC | 2400 | 2324.88 (102.08) | 4.39 | 2317.84 (± 94.41) | 4.07 |
Data represent the mean (± SD) from three replicates (n = 3).
Table 3: Recovery of lurbinectedin and IS
| Concentrations | A | B | %Recovery | % mean recovery | % RSD |
| HQC | 4092857 | 4013865 | 98.07 | 99.23 | 1.46 |
| MQC | 2728234 | 2763155 | 101.28 | ||
| LQC | 1023 | 1006 | 98.34 | ||
| IS | 2545698 | 2528133 | 99.31 | ||
| A, unextracted sample recoveries; B, extracted sample recoveries; n=6 replicates. |
Table 4: Matrix effect of lurbinectedin
| S. No. | HighQC | LowQC | ||||
| Peak areas with matrix |
Peak areas without matrix |
Matrix factor |
Peak areas with matrix |
Peak areas without matrix |
Matrix factor |
|
| 1 | 4214350 | 4092000 | 102.99 | 297 | 312 | 95.37 |
| 2 | 3897220 | 4092000 | 95.24 | 343 | 336 | 102.34 |
| 3 | 3817017 | 4092000 | 93.28 | 290 | 308 | 94.39 |
| 4 | 4170975 | 4092000 | 101.93 | 343 | 351 | 97.82 |
| 5 | 3963920 | 4092000 | 96.87 | 344 | 334 | 103.07 |
| 6 | 3980288 | 4092000 | 97.27 | 337 | 347 | 97.25 |
| Mean | 97.93 | 98.37 | ||||
| ± SD | 3.79 | 3.58 | ||||
| % CV | 3.87 | 3.64 | ||||
n=6 replicates
Table 5: Lurbinectedin carry-over effect
| Analyte | Lurbinectedin | |
| Sample ID | Peak areas | |
| Analyte | IS | |
| Unextracted samples | ||
| Mobile phase | 0 | 0 |
| Aqueous/ULOQ | 5456255 | 2545656 |
| Mobile phase | 0 | 0 |
| Aqueous/lLOQ | 364 | 2544953 |
| Extracted samples | ||
| STD/Blank | 0 | 0 |
| ULOQ | 5457017 | 2545338 |
| STD/Blank | 0 | 0 |
| LLOQ | 356 | 2545984 |
Table 6: Dilution integrity of lurbinectedin
| S. No. | Back calculated concentration (ng/ml) | |
| 1/5th Dilution (1920ng/ml) | 1/10th Dilution (960ng/ml) | |
| 1 | 1911.12 | 954.3279 |
| 2 | 1931.762 | 956.0041 |
| 3 | 1900.848 | 949.9021 |
| 4 | 1924.479 | 956.1513 |
| 5 | 1935.218 | 966.3853 |
| 6 | 1927.05 | 968.6088 |
| n | 6 | 6 |
| Mean | 1921.75 | 958.56 |
| SD | 12.02 | 6.68 |
| % CV | 0.63 | 0.69 |
| % mean Accuracy | 100.09 | 99.85 |
n=3 replicates.
Carryover effect
The influence of carryover from the auto sampler was examined through the injection of mobile phase, aqueous upper limit of quantification (ULOQ), LLOQ, and standard (STD) blank samples [21-27]. The results of this experiment indicated an absence of carryover. The findings are presented in table 5.
Dilution integrity
The integrity of the method's dilution was evaluated by introducing a dilution integrity (DI) QC concentration of 9600ng/ml into the plasma, utilizing a DI spiking solution that was three times the upper limit of quantification. The DIQC sample has been diluted to concentrations of 1920 ng/ml (1/5 dilution) and 960 ng/ml (1/10 dilution). Evaluating samples in relation to calibration curve benchmarks confirmed the precision and accuracy of the 1/5 and 1/10 dilution integrity standards. The findings are compiled in table 6.
Stability
The stability of Lurbinectedin and the internal standard in both unprocessed and processed plasma samples at low and high-quality control levels was assessed. Table 7 presents a summary of the findings from the stability investigations.
Table 7: Lurbinectedin stability findings
| Stability study | Concentration level | Comparison samples area mean | Stability samples area mean | % mean stability |
| Auto sampler stability | HQC | 4085191 | 4039762 | 98.88 |
| LQC | 355 | 337 | 94.93 | |
| Dry extract stability | HQC | 4085191 | 4030468 | 98.66 |
| LQC | 349 | 333 | 95.37 | |
| Freeze-thaw stability | HQC | 4085191 | 4097829 | 100.31 |
| LQC | 356 | 335 | 93.93 | |
| Stock solution stability | HQC | 4085191 | 4146175 | 101.49 |
| LQC | 357 | 338 | 94.78 | |
| Bench top stability | HQC | 4085191 | 4116893 | 100.78 |
| LQC | 355 | 337 | 94.93 | |
| Short-term stability | HQC | 4086959 | 4074689 | 99.69 |
| LQC | 349 | 337 | 96.47 | |
| Long-term stability | HQC | 4084862 | 4063080 | 99.47 |
| LQC | 351 | 335 | 95.41 |
CONCLUSION
A precise and systematic liquid chromatographic tandem mass spectrometric technique for the quantification of Lurbinectedin in plasma was established and underwent validation. Canagliflozin was utilized as an internal standard. The plasma was extracted using 5 ml of ethyl acetate as the solvent. Analysis was conducted using a Zorbax ODS (50 mm × 2.1 mm x 3µ) stationary phase under ambient conditions, with a mobile phase consisting of 0.1% HCOOH, acetonitrile, and methyl alcohol in a ratio of 15:50:35. The flow rate of the mobile phase was measured at 0.4 ml/min. In positive ionization mode using electrospray, the drug and internal standard were identified, yielding mass transitions of (m/z): Lurbinectedin, 785.30/711.20 and Canagliflozin (IS), 445.15/267.12. The relationship between Lurbinectedin concentrations and their corresponding peak proportions to canagliflozin was established as a linear function across the concentration range of 0.2-3200 ng/ml. The precision for lurbinectedin, both intra-day and inter-day, was found to be ≤5.18%. Inter and intra-day bias fell within the range of −4.17% to 4.53%. The average extraction recovery measured for Lurbinectedin was 99.23%. The recovery of the internal standard was measured at 98.31%. Lurbinectedin underwent stability testing across various conditions, such as long-term, bench top, freeze-thaw, short-term, auto sampler, dry extract, and stock solution stability at LowQC and HighQC levels, demonstrating stability in all these scenarios. The established technique can be applied for the regular assessment of Lurbinectedin in plasma samples across various sectors, including corporate entities, forensic labs, and clinical research institutions. This is feasible due to the validation of the method.
FUNDING
Nil
AUTHORS CONTRIBUTIONS
PK planned the study and developed the manuscript. CRB provided support for the study, while CK supervised the study design, conduct, and critically reviewed the manuscript.
CONFLICT OF INTERESTS
Declared none
REFERENCES
Wu YL, Smit EF, Bauer TM. Capmatinib for patients with non-small cell lung cancer with MET exon 14 skipping mutations: a review of preclinical and clinical studies. Cancer Treat Rev. 2021;95:102173. doi: 10.1016/j.ctrv.2021.102173, PMID 33740553.
Esaki T, Hirai F, Makiyama A, Seto T, Bando H, Naito Y. Phase I dose-escalation study of capmatinib (INC280) in Japanese patients with advanced solid tumors. Cancer Sci. 2019;110(4):1340-51. doi: 10.1111/cas.13956, PMID 30724423.
Bang YJ, Su WC, Schuler M, Nam DH, Lim WT, Bauer TM. Phase 1 study of capmatinib in MET-positive solid tumor patients: dose escalation and expansion of selected cohorts. Cancer Sci. 2020;111(2):536-47. doi: 10.1111/cas.14254, PMID 31778267.
Sabrina Baltschukat, Barbara Schacher Engstler, Alan Huang, Huai Xiang Hao, Angela Tam, Hui Qin Wang, Jinsheng Liang, Matthew T DiMare, Hyo Eun Carrie Bhang, Youzhen Wang, Pascal Furet, William R Sellers, Francesco Hofmann, Joseph Schoepfer, Ralph Tiedt. Lurbinectedin (INC280) is active against models of non-small cell lung cancer and other cancer types with defined mechanisms of MET activation. Clinical Cancer Research. 2019 May 15;25(10):3164–75. doi: 10.1158/1078-0432.CCR-18-2814.
Upadhya A, Yadav KS, Misra A. Targeted drug therapy in non-small cell lung cancer: clinical significance and possible solutions-part I. Expert Opin Drug Deliv. 2021;18(1):73-102. doi: 10.1080/17425247.2021.1825377, PMID 32954834.
Lolla S, Gubbiyappa KS. Development and validation of and LC-MS/MS method to quantify Capmatinib in human plasma: application to a pharmacokinetic study in rabbits. J Appl Pharm Sci. 2023;13:3. doi: 10.7324/JAPS.2023.131969.
Liu X, Wang Q, Yang G, Marando C, Koblish HK, Hall LM. A novel kinase inhibitor INCB28060, blocks c-MET-dependent signaling neoplastic activities and cross talk with EGFR and HER-3. Clin Cancer Res. 2011;17(22):7127-38. doi: 10.1158/1078-0432.CCR-11-1157, PMID 21918175.
Glaenzel U, Jin Y, Hansen R, Schroer K, Gholamreza Rahmanzadeh U Pfaar, Jan Jaap Van Lier, Hubert Borell, Axel Meissner, Gian Camenischand Sylvia Zhao. Absorption distribution metabolism and excretion of lurbinectedin (INC280) in healthy male volunteers and in vitro aldehyde oxidase phenotyping of the major metabolite. Drug Metabolism and Disposition. 2020;48(10):873-85. doi: 10.1124/dmd.119.090324.
U. S. Food and Drug Administration. Guidance for industry: bioanalytical method validation. Rockville (MD): U. S. Department of Health and Human Services Food and Drug Administration, Center for Drug Evaluation and Research (CDER), Center for Veterinary Medicine (CVM); 2001 May.
Dadhaniya T, Chaudhary K, Mehta P. Development of LC-MS/MS method for determination of iloperidone in rabbit plasma: application to a pharmacokinetic study. Int J Pharm Pharm Sci. 2013;7(4):294-7.
Ponnuri RN, Pragallapati P, NR, Mandava VB. A rapid and sensitive liquid chromatography mass spectrometry/mass spectrometry method for estimation of pioglitazone keto pioglitazone and hydroxy pioglitazone in human plasma. Asian J Pharm Clin Res. 2017;10(12)120-8. doi: 10.22159/ajpcr.2017.v10i12.20284.
Sura RS, CVS S, Rachamalla SS. Bioanalytical RP-HPLC method development and validation of clopidogrel bisulfate in Wistar rat plasma and its application to pharmacokinetic study. Int J App Pharm. 2022;14(1):106-11. doi: 10.22159/ijap.2022v14i1.43328.
European Medicines Agency. Guideline on bioanalytical method validation science and medicinal health. European Medicines Agency (EMEA), EMEA, CHMP, EWP/192217; 2009.
Kiran GS, Cheruku S, Cheruku S, Bhikshapathi D, Palanati M. An LC–MS/MS quantification method development and validation for the dabrafenib in biological matrices. J Appl Pharm Sci. 2023;13(1):180-6. doi: 10.7324/JAPS.2023.130117.
Kaza M, Karazniewicz Lada M, Kosicka K, Siemiątkowska A, Rudzki PJ. Bioanalytical method validation: new FDA guidance vs. EMA guideline. Better or worse? J Pharm Biomed Anal. 2019;165:381-5. doi: 10.1016/j.jpba.2018.12.030, PMID 30590335.
Smith G. European medicines agency guideline on bioanalytical method validation: what more is there to say? Bioanalysis. 2012;4(8):865-8. doi: 10.4155/bio.12.44, PMID 22533559.
Ponnuri RN, Pragallapati P, NR, Mandava VB. A rapid and sensitive liquid chromatography mass spectrometry/mass spectrometry method for estimation of pioglitazone keto pioglitazone and hydroxy pioglitazone in human plasma. Asian J Pharm Clin Res. 2017;10(12):120-8. doi: 10.22159/ajpcr.2017.v10i12.20284.
Sura RS, CVS S, Rachamalla SS. Bioanalytical RP-HPLC method development and validation of clopidogrel bisulfate in Wistar rat plasma and its application to pharmacokinetic study. Int J App Pharm. 2022;14(1):106-11. doi: 10.22159/ijap.2022v14i1.43328.
Lolla S, Gubbiyappa KS, Cheruku S, Bhikshapathi DV. Validation of an LC-MS/MS method for quantitation of fostemsavir in plasma. J Pharmacol Toxicol Methods. 2023;120:107254. doi: 10.1016/j.vascn.2023.107254, PMID 36863666.
Nuli MV, Rekulapally VK. Overall review on analytical method development and validation of Dasatinib. Int J Pharm Chem. 2023;14(1):27-34. doi: 10.46796/ijpc.v4i1.432.
Sellappan M, Devakumar D. Development and validation of RP-HPLC method for the estimation of escitalopram oxalate and flupentixoldihydrochloride in combined dosage form and plasma. Int J Pharm Pharm Sci. 2021 Feb 1;13(2):61-6. doi: 10.22159/ijpps.2021v13i2.30158.
Dadhaniya T, Chaudhary K, Mehta P. Development of LC-MS/MS method for determination of iloperidone in rabbit plasma: application to a pharmacokinetic study. Int J Pharm Pharm Sci. 2013;7(4):294-7.
Puttagunta SB, Shaik RP, Bannoth CK, Challa BS, Awen BZ. Bioanalytical method for quantification of solifenacin in rat plasma by LC-MS/MS and its application to pharmacokinetic study. J Anal Sci Technol. 2014;5(1):35. doi: 10.1186/s40543-014-0035-0.
Kumar BA, Ramesh B, Cheruku S, Bhikshapathi DV. Method development validation and application of liquid chromatography electrospray ionization-mass spectrometry/mass spectrometry method for the quantification of amprenavir in plasma samples. J Appl Pharm Sci. 2022;12(07):115-21. doi: 10.7324/JAPS.2022.120712.
Christian S, Rashmikant Patel S. A rapid and sensitive LC-MS/MS assay for the determination of clobazam in human plasma using electrospray ionization technology. Int J Pharm Sci Res. 2018 Jun;9(6):2369-77. doi: 10.13040/IJPSR.0975-8232.9(6).2369-77.
Sellappan M, Devakumar D. Development and validation of RP-HPLC method for the estimation of escitalopram oxalate and flupentixoldihydrochloride in combined dosage form and plasma. Int J Pharm Pharm Sci. 2021 Feb 1;13(2):61-6. doi: 10.22159/ijpps.2021v13i2.30158.
Sellappan M, Devakumar D. Development and validation of RP-HPLC method for the estimation of escitalopram oxalate and flupentixoldihydrochloride in combined dosage form and plasma. Int J Pharm Pharm Sci. 2021 Feb 1;13(2):61-6. doi: 10.22159/ijpps.2021v13i2.30158.
Gurav P, Damle M. Bioanalytical method for estimation of teriflunomidein human plasma. Int J Pharm Pharm Sci. 2022 Sep 1;14(9):19-23. doi: 10.22159/ijpps.2022v14i9.45151.
Krishnan VS, Bhikshapathi D, Cheruku S. Method development and validation for the quantification of abametapir in biological matrices by LC-ESI-MS/MS. Ind J Pharm Edu Res. 2024;58(3s):s1028-33. doi: 10.5530/ijper.58.3s.102.