
Int J App Pharm, Vol 17, Issue 3, 2025, 214-227Original Article
DESIGN AND COMPUTATIONAL ANALYSIS OF NEW ISATIN-IMINE HYBRIDS AS SELECTIVE HDAC6 INHIBITORS
KARRAR AL-GBURI1*, NOOR H. NASER2, MALINA JASMI3
1Department of Pharmaceutical Chemistry, Faculty of Pharmacy, University of Kufa, Najaf, Iraq. 2Department of Pharmaceutical Chemistry, Faculty of Pharmacy, Al-Zahraa University for Women, Holy Karbala, Iraq. 3Faculty of Pharmacy, Universiti Kebangsaan Malaysia, Kuala Lumpur, Malaysia
*Corresponding author: Karrar Al-Gburi; *Email: karrarm.alguburi@uokufa.edu.iq
Received: 11 Jan 2025, Revised and Accepted: 12 Mar 2025
ABSTRACT
Objective: Emerging evidence highlights the critical role of Histone Deacetylase (HDAC) 6 in various pathologies, including cancer and neurodegenerative diseases. Therefore, we sought to computationally study new isatin-imine hybrid compounds to predict their Absorption, Distribution, Metabolism, Excretion, and Toxicity (ADMET) profiles and binding mode with HDAC6 through docking and molecular dynamics simulations.
Methods: ADMET and drug-likeness properties of target compounds were predicted using ADMETlab 3.0. Molecular docking was conducted using Autodock4Zn imgded in Amdock v1.5.2 against HDAC6, HDAC8, and HDAC2. Utilizing Newton's equations of motion in conjunction with the Desmond package from the Schrödinger software suite, a molecular dynamics simulation of 100 nanoseconds was conducted to investigate protein-ligand interactions at the atomic level.
Results: All compounds exhibited favorable physicochemical characteristics and met drug-likeness criteria, showing good absorption profile, high protein binding (except Km73 and Km74), and Human Liver Microsomal enzyme stability. Three compounds (Km66, Km68, and Km74) had low plasma clearance, while Km69, Km72, and Km73 had moderate clearance. Compounds were predicted to have favorable toxicity profiles. In docking studies on HDAC6, all compounds showed higher binding affinities (-7.44 to-10.69 Kcal/mol) than the reference compounds SAHA and Nexturastat A. For HDAC2, all compounds had a lower binding affinity than for HDAC6, except Km68, which showed a higher affinity for HDAC2 (-10.61 vs.-9.23 Kcal/mol). Km68 and Km69 demonstrated stable binding modes in molecular dynamics simulations, while Km68 showed some deviations.
Conclusion: Our findings indicate that all compounds demonstrate favorable ADMET profiles, binding affinities, and selectivity towards HDAC6. Their predicted binding affinity has outperformed that of reference compounds, including SAHA and HDAC6-selective nexturastat A. This suggests that these compounds have the potential to be promising candidates for selective inhibition of HDAC6, thereby opening up new possibilities in drug development.
Keywords: HDAC6, Isatin, Molecular docking, Amdock, ADMET lab 3.0, Desmond, Molecular dynamic simulation
© 2025 The Authors. Published by Innovare Academic Sciences Pvt Ltd. This is an open access article under the CC BY license (https://creativecommons.org/licenses/by/4.0/)
DOI: https://dx.doi.org/10.22159/ijap.2025v17i3.53658 Journal homepage: https://innovareacademics.in/journals/index.php/ijap
INTRODUCTION
Of all histone Deacetylases (HDACs), HDAC6 is distinctive because it contains two active catalytic domains. It contains 1215 amino acids and deacetylates histone and non-histone proteins (e. g., HSP90, α-tubulin, and cortactin), thereby controlling various cellular processes [1-12]. Emerging evidence underscores the pivotal role of HDAC6 in various pathologies, including oncological disorders, neurodegenerative diseases, and inflammatory conditions [1, 13]. HDAC6 modulates cell proliferation, metastasis, invasion, and mitosis in tumor cells by regulating key proteins such as HSP90, cortactin, and α-tubulin [1, 11]. The ARID1A mutation in ovarian cancer disrupts the pro-apoptotic function of p53 by increasing the expression of HDAC6 [14]. HDAC6 knockout studies showed no lethal effect compared to HDAC1-3 genetic ablation [11, 15]. Thus, focusing on HDAC6 represents an innovative and compelling strategy for effectively addressing and modulating a variety of disease pathologies.
Despite the successful implementation of currently approved HDACIs (illustrated in fig. 1), they are associated with certain drawbacks, such as poor pharmacokinetics, hematological adverse effects, and cardiotoxicity, primarily due to their pan-HDAC inhibitory activity [1, 2]. Hence, developing isoform-selective HDACIs would be promising for mitigating these drawbacks. Different strategies have been applied to develop selective HDAC6 inhibitors. One successful strategy to develop selective HDAC6 inhibitors is to modify the surface recognition group (SRG), e.g., citarinostat and ricolinostat [2–4]. This is attributed to the structural differences between HDAC6 and other HDACs, where the HDAC6 binding site is more expansive (14 Å) and has two sub-pockets lined by the L1 and L2 loops [5–7].
Several groups have been used as SRGs seeking potent and selective HDAC6 inhibition. Studies have identified that isatin and isatin-3-oxime are effective SRG groups, leading to potent and selective HDAC6 inhibitors (fig. 1) [8, 9]. These compounds exhibited better inhibition than SAHA in cytotoxicity against five cancer cell lines [8, 9]. Furthermore, isatin Schiff bases (isatin-imine) have been identified to have various therapeutic applications, mainly their cytotoxic effect on various cell lines [10–13]. Here, we decided to implement the isatin-imine as an SRG. Because the enzyme's rim is predominantly solvent-exposed, we decided to investigate the entropic effect of imine substitution on compound affinity. To this end, either the methoxy or bromo group was introduced in the para position of the imine (fig. 1). Not only can the nature of the SRG drive isoform selectivity, but the position of the zinc-binding group (ZBG) in benzhydroxamic acid can also influence this selectivity [5]. Hence, we decided to study the effect of changing the position of ZBG in benzhydroxamic acid compounds from para to the meta position (Km68 and Km69, see fig. 1). Additionally, the linker can further influence the HDAC isoform selectivity depending on the cap group [5]. In this study, we strategically implemented aliphatic and aromatic linkers to explore their crucial impact on our findings.
As an integral part of the drug design process, computational studies have been shown to play a crucial role in finding newer drugs, especially HDACIs [14–16]. Hence, this study sought to conduct a computational analysis of the target compounds to predict their ADMET characteristics and to elucidate their binding mode to HDAC6 and other HDACs through docking studies and Molecular Dynamics Simulation (MDS).
| A |
B |
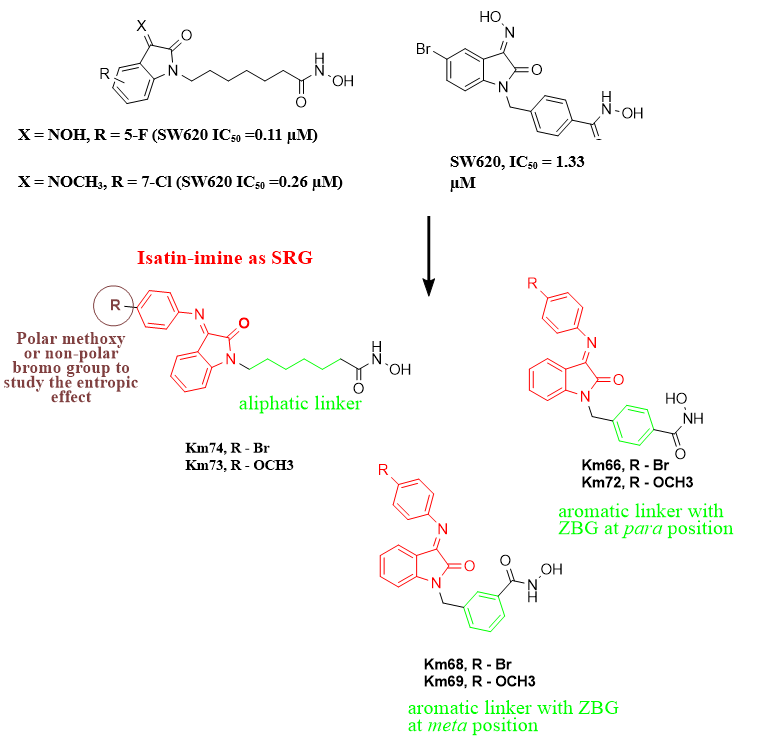
Fig. 1: (A) Chemical structures of currently approved HDACI and HDAC6 selective inhibitors (ricolinostat and nexturastat A). (B) Structure of previous isatin-based HDACI and the target isatin-imine hybrid compounds. This fig. shows the main structural features of HDACIs, ZBG (Black), Linker (Green), and SRG (Red)
MATERIALS AND METHODS
Methods
ADMET and drug-likeness properties
ADMET (Absorption, Distribution, Metabolism, Excretion, and Toxicity) and drug-likeness properties of target compounds were predicted using ADMETlab 3.0. ADMETlab 3.0 is a complimentary web-based platform (https://admetlab3.scbdd.com/) developed under the auspices of the CBDD group at Xiangya School of Pharmaceutical Sciences, Central South University. ADMETlab 3.0 is the second update of a free web-based platform for In Silico and a comprehensive assessment of ADMET characteristics of molecules [17]. ADMETlab 2.0 has been cited 1319 times, while this newer version (ADMETlab 3.0) has been cited 35 times since its release in April 2024 [17, 18]. In addition, this updated version has performed better than other available platforms (such as SwissADME, admetSAR2.0, FAF-Drugs4, pkCSM, vNN-ADMET, ADMET-boost, and Interpret-ADMET) in predicting ADMET properties, with a wide spectrum of drug-likeness, physicochemical, and ADMET characteristics [17]. The compounds were imported into the platform as smiles for ADMET predictions.
Molecular docking
To get insight into the possible binding mode of the target compounds, molecular docking was conducted using Amdock v1.5.2 [19]. Three isoforms of HDACs (HDAC6, HDAC8, and HDAC2) have been implemented to get insight into the possible selectivity of the designed compounds against class I and II HDACs. Autodock4zn, developed by Diogo Santos-Martins et al. and imgded in the Amdock, was employed to find the best poses of the compounds [20]. Crystal structures of HDAC6 (pdb: 5edu), HDAC8 (pdb: 1t67), and HDAC2 (pdb: 3max) were first downloaded from PDB and prepared in a client software package from Discovery Studio 2021 (DS) to remove heteroatoms and extract co-crystalized ligands. The missing amino acid residues were added using Autodocktool (ADT). The compounds' bidimensional (2D) structure was drawn in ChemSketch 2023.1.2 and converted into the 3D structures as PDB files using DS. Input files (HDAC enzymes and ligands) were then prepared using Prepare_receptor4. py and Prepare_ligand. py functions from ADT integrated into Amdock. The “center on hetero” option in the search space tab was used to determine the search space. To explore the binding site fully, an exhaustiveness of 16 was chosen while all other parameters were kept as a default setting. Simple docking was chosen with the default parameters (number of runs 10, maximum energy evaluation 2,500,000, number of poses 10,, and ligand protonation using OpenBabel). Post-docking analysis was performed using a Maestro Viewer 2023-3 from Schrödinger (Academic version). The outcomes of the docking procedure were represented by the binding affinity scores expressed as affinity ∆G (Kcal/mol). These scores were subsequently converted into estimated inhibition constants (Ki), a more helpful quality value than ∆G [21]. The following formula (1) was employed to calculate the Ki parameters from the binding affinity values associated with each docked conformation:

In this context, ΔG represents the binding affinity or the computed docking score value. The constant R denotes the Boltzmann gas constant (1.987 cal/mol/K), while T indicates the temperature set at 298 K.
Ligand efficiency (LE) is an essential parameter for evaluating lead compounds. LE values of the designed compounds were then calculated using the Ki values and the number of heteroatoms as per equation (2). This approach allows for a more nuanced assessment of compound potency relative to molecular complexity.
 …….. (2)
where HA represents the total number of heavy (non-hydrogen) atoms in the ligand. Potential lead compounds are identified as those exhibiting a score of LE ≥ 0.3, as noted by Schultes et al. [22]. The receptor-ligand binding conformations exhibiting the highest negative binding affinities were subjected to 100-nanosecond (ns) molecular dynamics simulations (MDS) for further analysis.
Molecular dynamic simulation
Using Newton's equations of motion and Desmond package, a 100 ns MD simulation was used to investigate protein-ligand interactions at the atomic level and conformational changes during the binding process [23, 24]. The protein preparation wizard module in Maestro was used to preprocess all three systems (A, B, and C complexes) using the default parameters, OPLS-2005 force field, and the "system builder tool" was used to set up the entire system [25]. Reduce the energy of both systems, then equilibrate in the TIP3P water model's orthorhombic box (10Å×10Å×10Å), neutralized by heating 300K at 1 atm pressure and adding 0.15M NaCl [26]. Initially, the system was configured to be less strict for each complex, and ultimately, 100 ps recording intervals and 1.2 J of energy were utilized in the final production cycle [27]. Using a simulated interaction diagram tool, receptor-ligand interactions were investigated.
RESULTS AND DISCUSSION
ADMET and drug-likeness properties
The way of developing drugs is a long, fraught with risk, expensive, and high attrition rate journey. Poor pharmacokinetic profile and toxicity are crucial aspects of drug development, and they are responsible for 40% and 35% of drug development failure, respectively [28, 29]. Hence, having excellent pharmacological activity is not enough, and most compounds must have an excellent pharmacokinetic profile (absorption, distribution, metabolism, elimination and toxicity, ADMET). i. e., they must have the ability to be administered and absorbed into the systemic circulation, be nontoxic, and be eliminated without any biological harm. Therefore, optimization and determination of these characteristics are critical during the early drug discovery process to avoid late attrition. In Silico, methods for determining these characteristics have proven to be a good way, as the traditional methods are expensive and time-consuming and raise animal welfare issues. The ADMETlab 3.0 platform reported important characteristics of the target compounds.
Physicochemical parameters
In terms of the physicochemical properties of the compounds, it was observed that most of the compounds satisfy the most widely used guideline for drug-likeness, i.e., Lipinski’s rule of five (RO5) and Verber’s rule [30, 31] (table 1). Only compound Km73 violates Verber’s rule in nRot (number of rotatable bonds), as it is pretty flexible and has 10 nRot (aliphatic linkers like SAHA and ricolinostat). LogS is the logarithm of aqueous solubility, which is a critical step in oral absorption. The proper range of LogS is-4 to 0.5 log mol/l. Table 1 shows that Km66, Km68, and Km74 have a lower solubility than the proper range, while the rest of the molecules have a LogS value in the proper range. LogD is the logarithm of the n-octanol/water distribution coefficients at pH 7.4. Candidate drugs must balance lipophilicity and hydrophilicity to dissolve in the body fluid and penetrate the biomembrane effectively. Hence, they must have proper logD7.4 (1 to 3 log mol/l) values for candidate compounds in the early stage of drug discovery [32, 33]. All the target compounds in this study were reported to have a logD7.4 value in the proper range (table 1). Based on that, most of the molecules have accepted physicochemical characteristics, making them good candidates for proper human intestinal absorption (HIA), which will be discussed later.
Table 1: Physicochemical characteristics of the target compounds
| Compound | Lipinski’s rule | Veber’s rule | LogS | logD7.4 | ||||
| M. Wt | nHD | nHA | LogP | TPSA | nRot | |||
| Km66 | 449 | 2 | 6 | 2.654 | 82 | 5 | -4.66 | 2.417 |
| Km68 | 449 | 2 | 6 | 2.654 | 82 | 5 | -4.66 | 2.417 |
| Km69 | 401 | 2 | 7 | 1.624 | 91.23 | 6 | -3.705 | 1.911 |
| Km72 | 401 | 2 | 7 | 1.624 | 91.23 | 6 | -3.77 | 1.933 |
| Km73 | 395 | 2 | 7 | 2.068 | 91.23 | 10 | -3.524 | 2.037 |
| Km74 | 443 | 2 | 6 | 3.037 | 82 | 9 | -4.275 | 2.644 |
| SAHA | 264 | 3 | 5 | 1.177 | 78.43 | 10 | -2.196 | 1.382 |
| Ricolinostat (ACY-1215) | 433 | 8 | 3 | 3.417 | 107 | 13 | -4.653 | 2.962 |
M. Wt, Molecular weight; nHA, no. of hydrogen bond acceptors; nHD, no. of hydrogen bond donors; nRot, no. of rotatable bonds; TPSA, total polar surface area; logS, aqueous solubility; logP, octanol-water partition coefficient; logD7.4, distribution coefficient.
Medicinal chemistry filters
The concept of drug-likeness has been introduced to provide a practical guideline for the early drug discovery process, increasing the chance of molecules passing into clinical trials. To be drug-like, a chemical must have a desired physicochemical property [34]. Since the introduction of well-known and documented Lipinski’s RO5 in 1997, a variety of drug-likeness rules have been developed, such as Verber’s, Ghose's, and Muegge's rules [30, 31, 34-36]. All these rules are based on molecular descriptors to assess whether the molecules fall within a particular range. If they are within the desired range, they would be ‘drug-like’. While these rules have rigid boundaries for drug-likeness, other quantitative methods have been developed, such as the Quantitative Estimate of Drug-Likeness (QED) [37].
QED is based on eight molecular descriptors, which are M. wt, ClogP, nHD, nHA, tPSA, nRot, the number of aromatic rings, and a number of structural alerts. QED ranges from 0-1 based on desirability. The QED range of the target compounds was from 0.246 to 0.506, with Km69 and Km72 having the highest scores (0.506) (table 2). Compounds Km 66, 68, 69, 72, and 73 have higher scores than SAHA (QED = 0.383), while Km74 has a lower QED than SAHA (table 2). Additionally, the target compounds violate neither Egan’s rule (clogP ≤ 5.88, TPSA ≤ 131.6 Å2), nor Muegge’s rule (200 ≤ molecular weight ≤ 600, −2 ≤ XLOGP3 (lipophilicity) ≤ 5, the TPSA ≤ 150Å2, the number of rings ≤ 7, the number of carbons>4, the number of heteroatoms>1, nRot ≤ 15, nHA ≤ 10, and nHD ≤ 5). In the Golden Triangle rule, Johnson et al. proposed that M. Wt and logD7.4 are the strong drivers and surrogates for drug clearance and permeability [38]. According to this rule, all compounds comply with the Golden Triangle criteria (table 2).
Other molecular filters based on structural features than molecular descriptors have been introduced to highlight drug-likeness. One of the most widely used structural filters is the Pan-Assay interference compounds (PAINS). These compounds (PAINS) have frequent hitter substructural features that frequently show false positive results in biological assays [39]. This filter is widely accepted among the scientific community and is requested by most journals, such as the Journal of Medicinal Chemistry. Based on the 480 substructures identified by Baell and Holloway in their original work on PIANS and imgded in ADMETlab 3.0, none of the target compounds showed any PAINS alerts (table 2).
Overall, these analyses indicate that the target compounds successfully meet all the quantitative and qualitative criteria for drug-likeness, confirming their potential classification as drug-like entities.
Predicted absorption parameters
Oral administration of medications is the favorite route due to its ease and safety. Water solubility and permeability via the biological membrane of intestinal cells (intestinal permeability) are the two cornerstone features of oral drugs. Hence, determining the intestinal permeability of new compounds is crucial during drug discovery campaigns to avoid late attrition. For assessing drug absorption parameters, ADMET lab 3.0 has a number of algorithms to predict drug permeability and other absorption parameters. For instance, because of their functional and structural similarity to human intestinal enterocytes, the human Caco-2 cell line is used to assess compound permeability in vitro. All compounds studied here showed excellent Caco-2 permeability and an excellent parallel artificial membrane permeability assay (PAMPA). In contrast, all the compounds showed poor Madin−Darby Canine Kidney Cells (MDCK) permeability, a gold standard method for assessing active uptake. All compounds are predicted not to be a Para Glycoprotein (P. gp) substrate but an inhibitor instead (table 3). This indicates that these compounds' probable absorption mechanism would be a passive diffusion rather than active uptake.
Furthermore, all compounds showed an excellent predicted value for human intestinal absorption (HIA), an important parameter for determining oral drug bioavailability (F). Similarly, target compounds showed a medium F50 (Molecules with a bioavailability ≥ 50%) (table 3). This complies with the excellent Caco2 cell permeability. In summary, all compounds exhibited highly favorable predicted absorption parameters, suggesting their potential viability as orally administrable agents.
Table 2: Drug likeness properties of the target compounds
| Compound | Medicinal chemistry filters | ||||||
| QED | Lipinski #violation | Egan #violation | Muegge #violation | Golden triangle | Ghose #violation | Pains | |
| Km66 | 0.461 | 0 | 0 | 0 | Accepted | 0 | 0 Alert |
| Km68 | 0.461 | 0 | 0 | 0 | Accepted | 0 | 0 Alert |
| Km69 | 0.506 | 0 | 0 | 0 | Accepted | 0 | 0 Alert |
| Km72 | 0.506 | 0 | 0 | 0 | Accepted | 0 | 0 Alert |
| Km73 | 0.385 | 0 | 0 | 0 | Accepted | 0 | 0 Alert |
| Km74 | 0.36 | 0 | 0 | 0 | Accepted | 0 | 0 Alert |
QED, Quantitative Estimate of Drug-Likeness; PAINS, Pan-Assay interference compounds
Table 3: Selected absorption parameters of the target compounds
| Compound | Absorption parameters | ||||||
| Caco-2 | PAMPA | MDCK | P. gp inhibition | P. gp substrate | HIA | F50 | |
| Km66 | Excellent | Excellent | Poor | Yes | No | Excellent | Medium |
| Km68 | Excellent | Excellent | Poor | Yes | No | Excellent | Medium |
| Km69 | Excellent | Excellent | Poor | Yes | No | Excellent | Medium |
| Km72 | Excellent | Excellent | Poor | Yes | No | Excellent | Medium |
| Km73 | Excellent | Excellent | Poor | Yes | No | Excellent | Medium |
| Km74 | Excellent | Excellent | Poor | Yes | No | Excellent | Medium |
Caco-2, Caucasian colon adenocarcinoma cell lines permeability; PMPA, Parallel artificial membrane permeability assay, MDCK, Madin–Darby canine kidney permeability; P. gp, para-glycoprotein; HIA, human intestinal absorption; F50, bioavailability ≥ 50%.
Predicted distribution parameters
Plasma Protein Binding (PPB), Volume of distribution at steady state (Vdss), blood-brain barrier (BBB) penetration, and particular transporter inhibition profile were envisaged to assess the distribution parameters of the target compounds. All the compounds had a predicted PPB>90%, which means they have a high PPB (table 4). An analysis of the drug database has revealed that a significant majority of small drug molecules exhibit a PPB percentage exceeding 90% [40]. Furthermore, compounds characterized by acidity and a logD7.4 value greater than 0 are likely to demonstrate elevated levels of PPB, a characteristic that applies to the compounds under consideration [40].
Vdss is one of the critical pharmacokinetic parameters of a drug since it measures the distribution in various body tissues and determines the half-life and dosing interval. Km66, 68, 69, and 72 have the proper predicted value of Vdss (0.04-20 l/Kg), while the rest have a low predicted Vdss value (<0.04 l/kg). For BBB permeability, crossing BBB might cause central nervous system toxicity for a drug or molecule intended to work peripherally [41]. All compounds under investigation were predicted not to cross the BBB (table 4).
Moreover, because of their contribution to drug absorption, disposition, and possible drug-drug interaction (DDI), some transporters (e.g., breast cancer resistance protein (BCRP), organic anion transporting polypeptide 1B1 (OATP1B1), 1B3 (OATP1B3), and multidrug resistance protein 1 (MRP1)) have been requested by the FDA for the evaluation of the DDI profile of the new drug [42]. None of the compounds studied here have been predicted to be BCRP or MRP1 inhibitors, and Km73 and 74 have not been predicted to be OATP1B1 and OATP1B3 inhibitors, respectively (table 4).
Table 4: Selected distribution parameters of the target compounds
| Compound | Distribution parameters | ||||||
| PPB % | Vdss L/kg | BBB | OATP1B1 inhibitor |
OATP1B3 inhibitor |
BCRP inhibitor | MRP1 inhibitor | |
| Km66 | 98.203 | 0.153 | No | Yes | Yes | No | No |
| Km68 | 98.203 | 0.153 | No | Yes | Yes | No | No |
| Km69 | 96.974 | 0.133 | No | Yes | Yes | No | No |
| Km72 | 97.411 | 0.135 | No | Yes | Yes | No | No |
| Km73 | 90.117 | -0.116 | No | No | Yes | No | No |
| Km74 | 94.267 | -0.194 | No | No | Yes | No | No |
Plasma Protein Binding (PPB), Volume of distribution at steady state (Vdss), blood-brain barrier (BBB) permeability, Breast cancer resistance protein (BCRP), organic anion transporting polypeptide 1B1 (OATP1B1), 1B3 (OATP1B3), Multidrug Resistance Protein 1 (MRP1).
Predicted metabolism parameters
The Cytochrome P450 (CYP450) enzyme superfamily is the main enzyme family responsible for drug metabolism in the liver. CYP3A4 and 2D6 are the main isoforms, accounting for 75% of drug metabolism. Other isozymes, such as CYP1A2, CYP2C9, and 2CYP19, account for the rest. Given the profound effect of metabolism on the drug's pharmacokinetic and DDI profile, it is crucial to determine the metabolic profile of the drug.
ADMETlab 3.0 contains algorithms to predict stability against human liver microsomal enzymes (HLM), which is commonly used to assess compound clearance via the liver and to assess whether a compound would be a substrate or inhibitor of CYP isozymes (CYP1A4, 2C9, 2C19, 2D6, and 3A4). All target compounds have been predicted to have HLM stability, and none were predicted to be substrates for the major metabolic enzymes panel. Hence, the liver may not be the primary organ for the clearance of the compounds. Compounds Km66, 68, 73, and 74 were predicted to inhibit CYP1A2, while Km69 was a moderate inhibitor of CYP1A2. All compounds were predicted to act as inhibitors of CYP3A4, except Km73. Km74 was identified as a moderate inhibitor, as detailed in table 5.
Table 5: Selected predicted metabolic profile of the synthesized compounds
| Compound | Metabolism parameters | ||||||||||
| HLM | CYP1A2 | CYP2C19 | CYP2C9 | CYP2D6 | CYP3A4 | ||||||
| I | S | I | S | I | S | I | S | I | S | ||
| Km66 | Stable | Yes | No | No | No | No | No | No | No | Yes | No |
| Km68 | Stable | Yes | No | No | No | Mod | No | No | No | Yes | No |
| Km69 | Stable | Mod | No | No | No | No | No | No | No | Yes | No |
| Km72 | Stable | No | No | No | No | No | No | No | No | Yes | No |
| Km73 | Stable | Yes | No | No | No | No | No | No | No | No | No |
| Km74 | Stable | Yes | No | No | No | No | No | No | No | Mod | No |
Human Liver Microsomal enzymes; HLM, Cytochrome P450, CYP; Moderate, Mod.
Predicted excretion and toxicity parameters
Table 6 shows the excretion and toxicity profile of the isatin-imine hybrid target compounds. Plasma clearance (Clplasma) measures the body's capacity to eliminate (via metabolism or renal elimination) a drug by scaling the drug elimination rate by the corresponding plasma concentration level. It is a crucial parameter of drugs, as it determines the required dosage to maintain a steady state of plasma concentration. The predicted Clplasma of Km66, Km68, and Km74 was less than 5 ml/min/kg, meaning they have a low Clplasma. While Km69, Km72, and Km73 Clplasma values were>5<15 ml/min/kg, meaning they would have a moderate Clplasma (table 6). HLM and logD7.4 values of the target compounds may interpret the Clplasma values. Given that all compounds were predicted to be HLM stable, it can be inferred that the primary pathway for excretion is most likely renal secretion. Renal clearance is negatively correlated with lipophilicity, LogP, and logD7.4, as it would increase the probability of compounds being reabsorbed after filtration [43]. Km69, Km72, and Km73 were predicted to have a lower logD7.4 and hence a higher Clplasma. Another excretion parameter is the time required for the plasma concentration to be half its original value (T1/2). It is a hybrid concept of both clearance and Vd. Target compounds were predicted to have a T1/2 of<1 hour (table 6).
Regarding toxicity, none of the compounds were predicted to inhibit the human ether-a-go-go-related gene at IC50<10 μM (hERG 10). This gene encodes a voltage-gated potassium channel, significantly regulating cardiac action and resting potential exchange. Blocking this channel may cause long QT syndrome, arrhythmia, and Torsade de Pointes. Similarly, none of the target compounds are predicted to cause acute rat oral toxicity (table 6). Like SAHA, all compounds were predicted to be AMES mutagenic, carcinogenic, and hepatotoxic (H-HT). In both target compounds and SAHA, hydroxamate and the aniline group were the main culprits. SAHA has demonstrated minimal mutagenic potential, as evidenced by the lack of chromosomal abnormalities observed in human lymphocyte assays [44].
Table 6: Selected predicted excretion and toxicity parameters
| Compound | Excretion profile | Selected toxicity profile | |||||
| Clplasma | T1/2 | hERG 10* | Carcinogenicity** | H-HT$ | AMES mutagenicity & | Rat oral acute toxicity@ | |
| Km66 | 4.954 | 0.583 | 0.289 | 0.918 | 0.975 | 0.989 | 0.171 |
| Km68 | 4.954 | 0.583 | 0.293 | 0.918 | 0.975 | 0.989 | 0.171 |
| Km69 | 6.314 | 0.476 | 0.24 | 0.936 | 0.968 | 0.998 | 0.113 |
| Km72 | 5.344 | 0.489 | 0.231 | 0.956 | 0.975 | 0.997 | 0.115 |
| Km73 | 5.593 | 0.619 | 0.182 | 0.95 | 0.972 | 0.989 | 0.059 |
| Km74 | 4.753 | 0.678 | 0.233 | 0.936 | 0.996 | 0.967 | 0.093 |
| SAHA | - | - | 0.098 | 0.682 | 0.893 | 0.969 | 0.062 |
Plasma clearance, Clplasma; T1/2, Half-life, human ether-a-go-go-related gene at IC50<10μM (hERG 10); human Hepatotoxic, H-HT. *Molecules with IC50 ≤10 μM are classified as hERG blockers+(Category 1), and molecules with IC50>10μM are classified as non-hERG blockers-(Category 0). **Category 1: carcinogens; Category 0: non-carcinogens. The output value represents the probability of carcinogenicity, ranging from 0 to 1. $Category 0: non-hepatotoxic; Category 1: hepatotoxic. The output value is the probability of being hepatotoxic, within the range of 0 to 1. &Category 0: Non-AMES Mutagenicity; Category 1: AMES Mutagenicity. The output value represents the probability of AMES Mutagenicity, ranging from 0 to 1, @Category 0: low-toxicity,>500 mg/kg; Category 1: high-toxicity;<500 mg/kg. The output value is the probability of being toxic, within the range of 0 to 1.
Molecular docking
Molecular docking simulation is a popular and successful in silico method in drug discovery today. It is part of structure-based drug discovery, which relies on the three-dimensional data of biological targets. Currently, more than 70 software programs are used to predict the binding of drugs to their biological targets. Each software program uses a different search algorithm to generate compound conformations and utilizes a unique scoring system [45]. Autodock4Zinc (AD4zn) is an updated version of Autodock4.2 specifically intended to perform ligand docking against zinc metalloenzymes [20, 46].
To get structural insight into the target compounds' possible binding mode and selectivity, molecular docking was run against HDAC6, HDAC2, and HDAC8. The AD4zn impeded in Amdock was used. The co-crystallized ligands (TSN, SAHA, and N-(4-aminobiphenyl-3-yl)benzamide) were redocked into their crystal structures to validate the docking procedure. Upon superimposing the redocked ligands onto their crystallized counterparts, the root mean square deviations (RMSD) were determined to be 2 Å, 0.92 Å, and 0.66 Å for HDAC6, HDAC8, and HDAC2, respectively. These values confirm the validity of the docking protocol, adhering to the established cutoff of ≤ 2 Å (fig. 2).
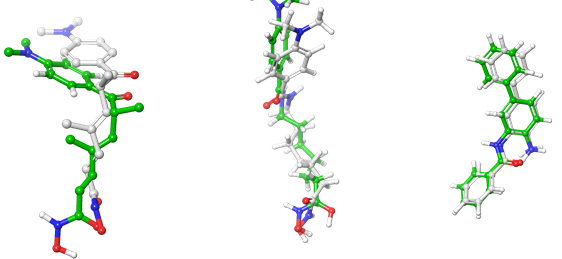
Fig. 4: Superimposition of re-docked Ligands (green carbon) onto co-crystallized ligands (white carbon) in the active site (RMSD = 2, 0.92, and 0.66 Å for TSN, SAHA, and N-(4-aminobiphenyl-3-yl)benzamide, respectively). A: superposition of redocked ligand on co-crystallized TSN in HDAC6 (pdb: 5edu chain A), B: superposition of redocked ligand on co-crystallized SAHA in HDAC8 (pdb: 1t76), C: superposition of redocked ligand on co-crystallized N-(4-aminobiphenyl-3-yl)benzamide) in HDAC2 (pdb: 3max)
Molecular docking on HDAC6
Regarding docking on HDAC6, all compounds have shown a higher estimated binding affinity (-7.44 to -10.69 Kcal/mol) than the reference compound SAHA (-6.9 Kcal/mol). All compounds, except Km73, showed increased binding affinity to HDAC6 compared to a highly specific HDAC6 inhibitor nexturastat A (-8.29 Kcal/mol) (table 7). Km69 was shown to have the highest binding affinity (-10.69 Kcal/mol), while Km73 has the lowest binding affinity (-8.21 Kcal/mol) (table 7). Compounds with aromatic linkers (Km66, Km68, Km69, Km72) were predicted to have a higher binding affinity than those with the aliphatic linkers (Km73 and Km74). This could be attributed to the bulkier linker (aromatic ring), which may perfectly fit the hydrophobic acetate binding tunnel of HDAC6. This has been shown in designing different compounds with an aromatic linker, showing an isoform selectivity toward HDAC6 and/or HDAC8, depending on the cap group [5] (table 7). In a similar context, compounds Km68 and Km69, with hydroxamic acid at the Meta position of benzohydroxamic acid, were demonstrated to have a higher binding affinity (-9.23 and-10.69 Kcal/mol, respectively) than those with a hydroxamic acid at the para position, Km66 and Km72 (-8.78 and-8.88 Kcal/mol, respectively).
Additionally, compounds Km72 and Km69, those with methoxy group attached at the para position of imine, were predicted to have a higher affinity for HDAC6 (-8.88,-10.69 Kcal/mol, respectively) than their pairs with a bromo group at the para position of imine, Km66 and Km68 (-8.78 and-9.23 Kcal/mol, respectively) (table 7). This is probably because the rim of the enzyme is a solvent-exposed environment, where a polar function group (like methoxy) would establish a more favorable entropic effect than a non-polar group (e. g., Br). The above-mentioned entropic effect was not shown in those with the aliphatic linker. The binding affinity of Km74 was predicted to be higher than Km73 (table 7).
All compounds were predicted to have a Ki value in the nanomolar range (table 7). Regarding LE, all the compounds were estimated to have an LE value>0.3, except Km72.
Table 7: Docking results of the target compounds against HDAC6 (Pdb: 5edu)
| Compound | Binding energy (Kcal/mol) | Ki (nM) | Ligand efficiency | Amino acids involved in interaction with ligands (Type of interaction) |
| Km66 | -8.78 | 366.63 | -0.3 | Zn901 (Monodentate), His611, Gly619 (H bond), Phe620 ( |
| Km68 | -9.23 | 171.54 | -0.32 | Zn601 (Bidentate), Phe620, Phe680, His651 ( |
| Km69 | -10.69 | 14.59 | -0.36 | Zn601 (Bidentate), Phe620, Phe680, His651 (, Tyr782 (H bond) |
| Km72 | -8.88 | 309.69 | -0.3 | Zn901 (Monodentate), His610, His611 (H bond), Phe620 ( |
| Km73 | -8.21 | 959.48 | -0.28 | Zn901(Monodentate), His610 (H bond), His500 ( |
| Km74 | -8.64 | 464.35 | -0.31 | Zn901 (Monodentate), Phe679 ( |
| SAHA | -6.9 | - | - | - |
| Nexturastat A | -8.29 | 838.29 | -0.32 | Zn901 (Monodentate), Gly619, Tyr782 (Hbond), Phe620, His651, Phe679 ( |
The 3D binding mode of the reference and target compounds was analyzed to reveal crucial insight into the difference in binding affinities. The target compounds were forecasted to demonstrate superior binding affinity to HDAC6 compared to SAHA. This enhancement is likely due to two key factors: first, the presence of an aromatic linker that complements the hydrophobic acetate tunnel of HDAC6, and second, an additional isatin-imine moiety may facilitate increased interactions with the enzyme's broad rim (see fig. 3 and table 8) [5].
Coordinating Zn2+ at the bottom of HDAC enzymes is crucial for the inhibitory activity. In this study, it has been shown that only compounds with the meta position of benzhydroxamate (Km68 and Km69) were predicted to coordinate Zn2+in a bidentate manner via carbonyl and hydroxyl oxygens of hydroxamic acid (HA) (table 8). In contrast, all others were predicted to form monodentate coordination via the carbonyl oxygen of the HA. Coordinating Zn2+in a monodentate geometry is not unusual behavior. Other HDAC6 selective inhibitors with bulky benzhydroxamate ZGB, such as nexturastat A, ricolinostat, and tubastatin A, have been previously identified to coordinate Zn2+ in monodentate geometry [47–49]. Capless HDAC inhibitors have been shown previously to form a five-membered canonical bidentate geometry with Zn2+[50]. This may be explained by the fact that the SRG attached to the linker tilts the hydroxamate hydroxyl oxygen away from Zn2+, leaving only hydroxamate carbonyl oxygen in a closer approach to Zn2+. Like other HDAC6 inhibitors, Zn2+coordination is stabilized by accepting H bond from nearby amino acids lining the bottom of the enzyme’s active site, e.g., His610, His611, and Tyr782 (table 8).
Likewise, the benzylic linker in Km68 and Km69 was predicted to be co-planar, allowing it to perfectly fit within the acetate binding tunnel and establish three Pi-Pi stacking interactions with the aromatic side chains of Phe620, Phe680, and His651. In contrast, while the benzylic linker of Km66 and Km72 was also predicted to be co-planar, it formed only one Pi-Pi stacking interaction with Phe620 (table 8). Thus, Km68 and Km69 were projected to exhibit a superior binding affinity compared to other compounds, including their counterparts (Km66 and Km72).
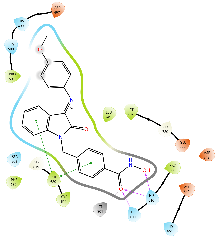
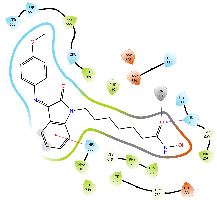
The cap group of the compounds and SAHA reveals a significant role of isatin-imine in the affinity. The isatin-imine capping group of the target compounds demonstrated a significant contribution to higher affinity via its interaction with amino acids at the rim of the enzyme. For instance, the cap group of the compound Km66 is strategically oriented towards the interface between the L2 loop, and a loop comprised of the amino acids Asp567-Tyr570. Notably, the 4-bromophenyl ring of Km66 demonstrates a significant Pi-Pi interaction with Phe680, contributing to the stability of the overall structure (table 8). Other studies have shown this binding mode of HDAC6 selective inhibitor where the cap group could be oriented not only to the L1 loop but also to the L2 loop [51]. In contrast, the cap group of Km72 is directed toward the L1 loop. Similarly, the cap group of the pairs Km68 and Km69 is pointed towards the L1 loop, where the bromophenyl ring of Km68 establishes a strong cation-Pi interaction with His500. Km73 cap group is directed toward the L1 loop, while Km74 is shifted toward the L2 loop. The phenyl ring of the nucleus isatin of both compounds (Km73 and Km74) established strong cationic-Pi and Pi-Pi interactions with His500 and Phe679, respectively (see 2D diagrams in table 8).
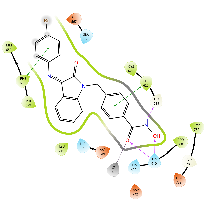
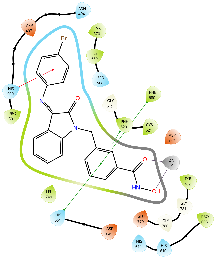
Table 8: 3D and 2D binding mode of the target compounds against HDAC6 (Pdb: 5edu)
| Compound | 3D binding mode of target compounds | 2D binding diagrams of target compounds |
| Km66 | 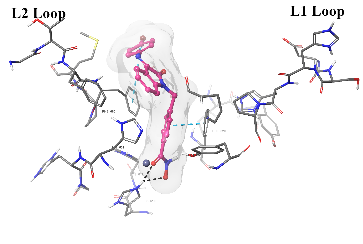 |
 |
| Km68 | 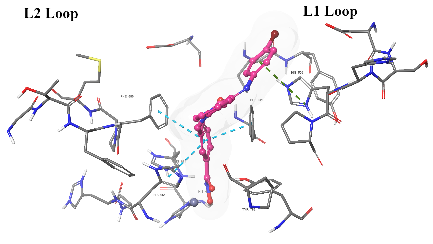 |
 |
| Km69 | 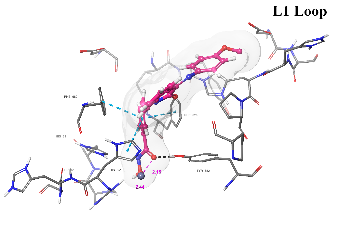 |
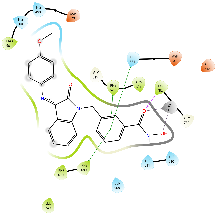 |
| Km72 | 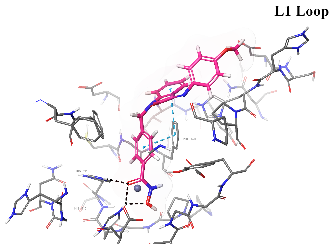 |
 |
| Km73 | 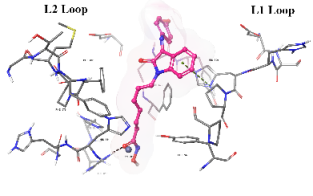 |
 |
| Km74 | 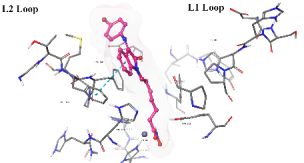 |
 |
| For 3D diagrams, protein is shown as sticks; ligand is shown as salmon pink sticks and balls. Hydrogen bond: black line, Pi-Pi interaction: cyan line, Cationic-Pi interaction: green line. For 2D diagrams: green, Pi-Pi interaction; gray, metal-coordination, magenta, Hbond; red, cationic-Pi interaction. |
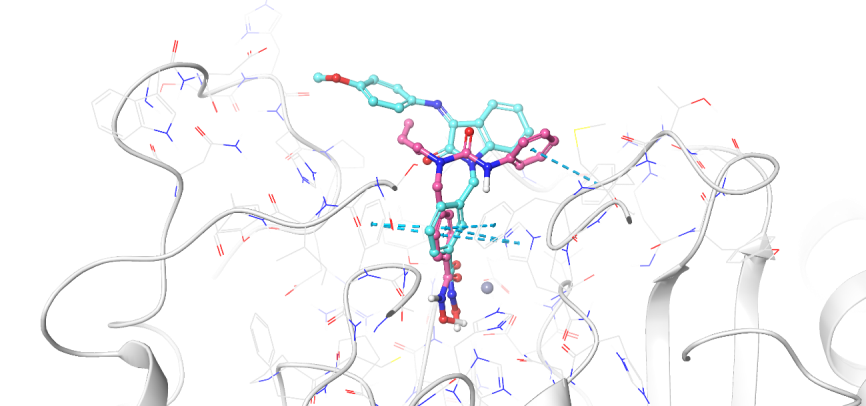
Fig. 3: Binding mode comparison view of Km69 (cyan) and nexturastat A (salmon pink) in the binding site of HDAC6, showing both ligands' binding mode and interaction pattern. This fig. shows how the isatin-imine SRG occupies the L1 loop of the binding pocket of HDAC6 (pdb: 5edu: chain A)
Molecular docking against HDAC2 and HDAC8
To gain insight into the selectivity of the target compounds for HDAC6 over class I HDAC, molecular docking against HDAC2 and HDAC8 was conducted. Table 9 shows the binding energies and 2D binding interaction diagrams of the compounds with HDAC2 and HDAC8. Coordinating Zn2+ at the bottom of the binding site is critical for inhibiting the enzyme [2].
For HDAC2, all the compounds were predicted to have a lower binding affinity than that for HDAC6, except Km68 (table 9). Km68 has shown a higher binding affinity toward HDAC2 than HDAC6 (-10.61 and-9.23 Kcal/mol, respectively) (table 7). Km68 coordinated Zn2+in a canonical bidentate geometry, while the other coordinated Zn2+in a monodentate fashion via either carbonyl oxygen (Km66 and Km72) or hydroxyl oxygen (Km73 and Km74) (fig. 4 and table 9). In contrast, Km69 was not predicted to coordinate Zn2+. Similarly, for HDAC8, a lower binding affinity was reported for all target compounds (table 9). None of the compounds were predicted to coordinate Zn2+in a bidentate fashion, while Km66, Km69, and Km72 coordinated Zn2+in a monodentate fashion via either carbonyl oxygen (Km66 and Km72) or hydroxyl oxygen (Km69) (table 9). The small binding site and a smaller space at the enzyme rim region, where the L1 loop faces inward, could be the reason behind the lower binding affinity for HDAC2 and HDAC8.
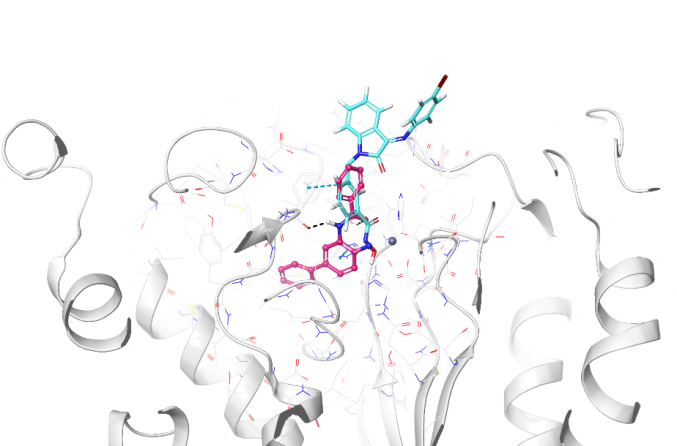
Fig. 4: Binding mode comparison view of Km68 (cyan) and N-(4-aminobiphenyl-3-yl)benzamide) (salmon pink) in the binding site of HDAC2 (pdb: 3max), showing both ligands' binding mode and interaction pattern
Molecular dynamic simulation
Although molecular docking can predict the binding mode of a compound in the binding pocket, it presents two primary limitations: it may not account for the influence of water on the binding affinity of compounds and does not fully represent the dynamic nature of binding. Due to these two issues, binding affinities may not correlate with experimental values. The limitations of molecular docking can be addressed through experimental studies or by utilizing MDS. Hence, following the docking process, the optimal ligand conformations within the target protein's binding pocket were identified based on their lowest binding energies. Subsequently, MDS was conducted on three docked complexes (complex A, Km68 with HDAC2; complex B, Km69 with HDAC6; and complex C, Km68 with HDAC6) to assess the stability of the resulting poses. These simulations aimed to explore further the solvent's effects on the interactions between the ligands and the target proteins.
RMSD analysis
The RMSD plots in MDS provide insights into the stability and structural fluctuations of the systems being monitored. In complex A, the HDAC2 showed a predictable structural behavior with RMSD values stabilizing around 1.5–2.0 Å, demonstrating minimal conformational changes throughout the simulation [52] (fig. 5). Despite the ligand (Km68) showing some fluctuation at the start (40 ns) of the simulation, it stabilized at RMSD<2Å for the rest of the 100 ns simulation period, indicating a robust and reliable binding mode within the protein's binding pocket. These results suggest a tight protein-ligand interaction and only a slight effect on the system’s performance. In complex B, the HDAC6 shows moderate conformational deviations, with RMSD values ranging from 1.5–3.0 Å, demonstrating some structural changes across the simulation, possibly due to flexibility or small changes near the binding site. Despite this, the protein stabilized at RMSD<3 Å after 60 ns and retained stability for the rest of the simulation. Similarly to Km68 in HDAC2, the ligand (Km69) showed some fluctuation; it remains relatively stable with<2 Å RMSD after approximately 60 ns, substantiating a reliable interaction with the protein, indicating a stable binding. Complexes A and B demonstrate stabilization within 40 to 60 seconds, indicating that the 100 ns integration period would be adequate for observation purposes. In contrast, complex C demonstrates the significant protein RMSD 2.0–4.0 Å, reflecting the highest structural deviations or flexibility, probably showing instability or significant changes in protein conformation during the simulation [53]. This complex's ligand (Km68) showed deviations with 3–4 Å RMSD, resulting in substantial movement or disassociation from the binding pocket, which points to relatively loose or transient interactions. Compound Km68 exhibited a predicted binding affinity of-9.23 Kcal/mol for HDAC6. However, MDS reveals a dissociation from the binding site. This underscores the need to carefully interpret docking results to prevent potential misinterpretations regarding compound binding behavior.
Table 9: Docking results of the target compounds against HDAC2 (pdb: 3max) and HDAC8 (pdb: 1t67)
| Compounds | Binding energy (kcal/mol) HDAC2 | 2D binding interactions HDAC2 (pdb: 3max) | Binding energy (Kcal/mol) HDAC8 | Amino acids involved in interaction with ligands (HDAC8) (pdb: 1t67) |
| Km66 | -7.21 | 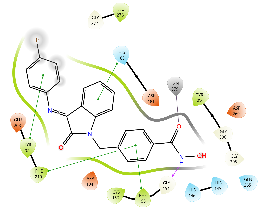 |
-7.39 | 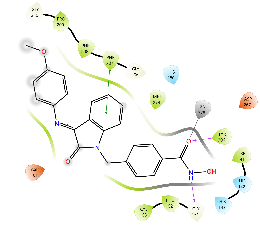 |
| Km68 | -10.61 | 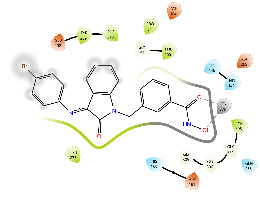 |
- | None of the poses bind to the binding cavity |
| Km69 | - | None of the poses coordinated Zn2+ | -7.06 | 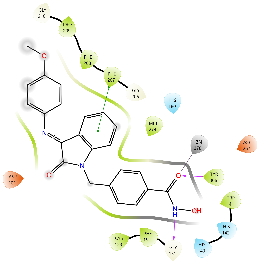 |
| Km72 | -7.44 | 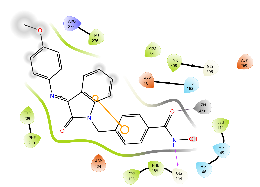 |
-7.74 | 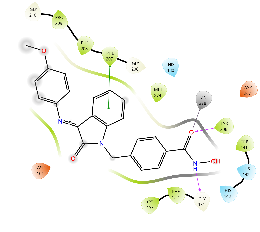 |
| Km73 | -5.2 | 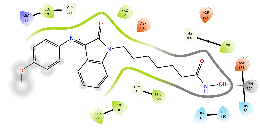 |
- | None of the poses bind to the binding cavity |
| Km74 | -6.62 | 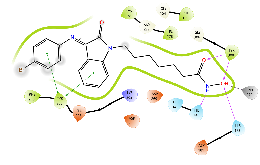 |
- | None of the poses coordinated Zn2+ |
Green, Pi-Pi interaction; gray, metal-coordination, Magenta, H bond; red, cationic-Pi interaction.
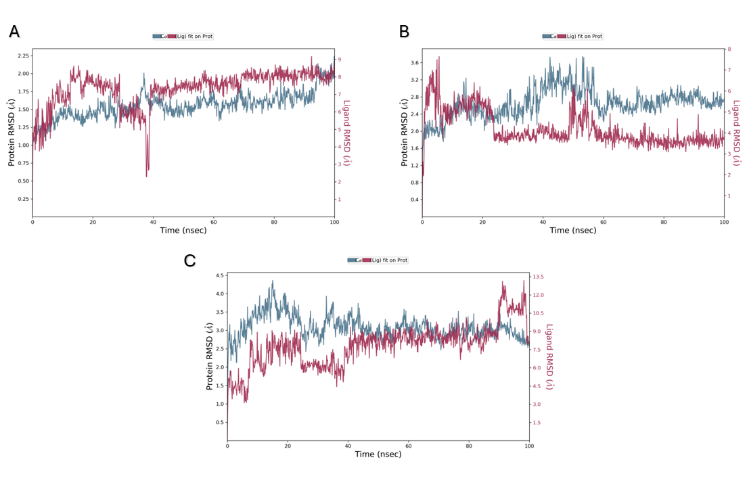
Fig. 5: RMSD of the ligands and protein's Cα atoms. (A) Complex A (B) Complex B (C) Complex C. In Complex A, HDAC2 displayed stable RMSD values of 1.5–2.0 Å, indicating minimal conformational changes during the simulation. In complex B, HDAC6 exhibits moderate conformational deviations, with RMSD values of 1.5–3.0 Å, indicating structural changes during the simulation, likely due to flexibility or minor alterations near the binding site. Complex C shows significant protein RMSD of 2.0–4.0 Å, indicating high structural deviations and potential instability during the simulation. The right Y-axis displays ligand variation (red lines), while the left Y-axis displays variation of protein RMSD (blue line)
Root mean square fluctuation (RMSF) analysis
The Root mean Square Fluctuation (RMSF) plots demonstrate the flexibility of individual residues in the protein across the MDS [54]. In complex A, most residues showed limited flexibility, suggesting a primarily stable protein conformation during the simulation. The deviations are below 2.0 Å for most residues, except for a few regions, such as the residues around index ~200, indicating slightly increased RMSF values (~2.5–3.0 Å) (fig. 6). This peak shows limited movement or flexibility in this region, which could be associated with terminal regions or flexible protein loops that naturally show higher dynamics. Overall, the plot demonstrates that complex A has a strong protein-ligand interaction. The RMSF profile for complex B shows relatively more considerable changes than complex A, featuring multiple peaks that surpass 2.5–3.5 Å, most pronounced within the residue segment near ~200, ~400, and ~600 (fig. 6). These elevated RMSF values show that the protein undergoes more significant fluctuations or structural changes throughout the simulation. The higher flexibility in these regions may be related to the protein’s dynamic domains, or they belong to loop regions, which are more flexible than α-helices or β-sheet. The green bars indicate residues probably play a role in interacting with ligands. Despite the overall protein mobility, these stable domains suggest that the protein establishes selective contacts with the ligand. In complex C, the RMSF plot highlights a mixed profile, with low and high fluctuations domains. Most residues show RMSF values below 2.5 Å. However, several significant peaks surpass 3.0–4.0 Å around residue indices ~400, ~500, and ~600 (fig. 6). These peaks indicate regions of heightened conformational freedom, which may be looped, dynamic domains of the protein. The green bars highlight residues with stable interactions, likely indicating the ligand-binding site [55]. However, elevated RMSF peaks show significant protein instability in certain parts of the conformation. Compared to complexes A and B, this complex demonstrates higher conformational flexibility during the simulation.
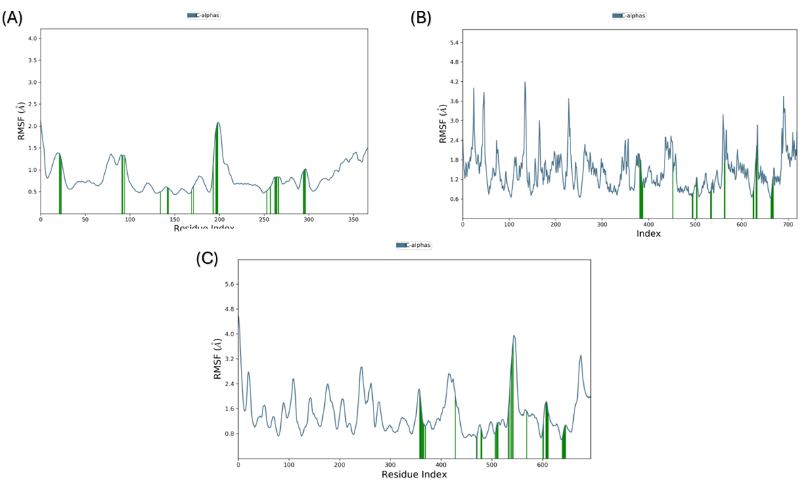
Fig. 6: RMSF of the protein's Cα atoms. (A) Complex A (B) Complex C (C) Complex C
Protein's secondary structure elements (SSE)
The protein's secondary structure elements (SSE) were observed across the simulation to check for changes in helices or strands. In complex A, the secondary structure profile demonstrates a well-conserved structural feature throughout the protein, with many regions indicating a high proportion of α-helices and β-sheets during the simulation. Most residues consistently adhered to their assigned secondary conformations, with only minor disruptions observed [56] (fig. 7). The results showed that the protein’s structure remained remarkably stable throughout the simulation. Such stability suggests the presence of robust protein-ligand interactions. The secondary structure profile for complex B showed higher flexibility than complex a (fig. 7). While many domains sustain their α-helical and β-sheet conformations, several regions indicate disruptions, demonstrating partial instability of secondary structure elements in specific regions [55]. This greater diversity implies moderate flexibility and structural changes within the protein, possibly modulated by protein-ligand interactions. In complex C, the secondary structure profile reveals marked deviations and transitions in α-helices and β-sheets, with several domains showing reduced secondary structure conservation [57] (fig. 7). This implies a more flexible protein conformation across the simulation. The frequent disruptions between secondary structural arrangements could potentially compromise structural integrity. This indicates that the less stable ligand binding in the complex may affect the structural coherence of the protein's secondary structure, reflecting greater conformational flexibility. The total secondary structure elements of complexes A, B, and C were 40.50%, 41.95%, and 40.79%, respectively.
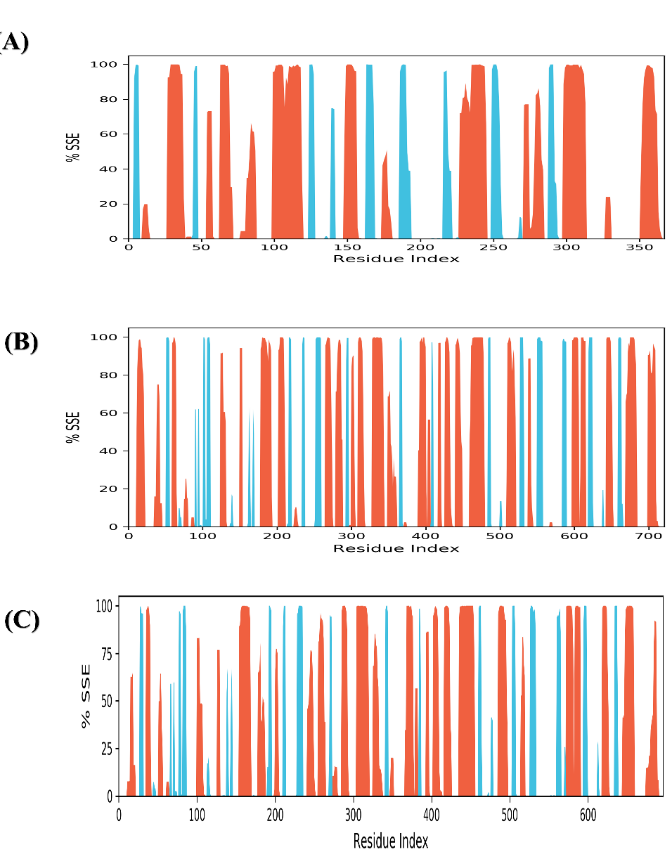
Fig. 7: Distribution of Protein Secondary Structure elements across the protein structure by residue index. α-helices are shown in red columns, whereas β-strands are in blue columns. This fig. shows that the secondary structure profiles are well-conserved in complex A and B, with structural elements such as α-helices and β-sheets maintained throughout the simulation. (A) Complex A (B) Complex B (C) Complex C
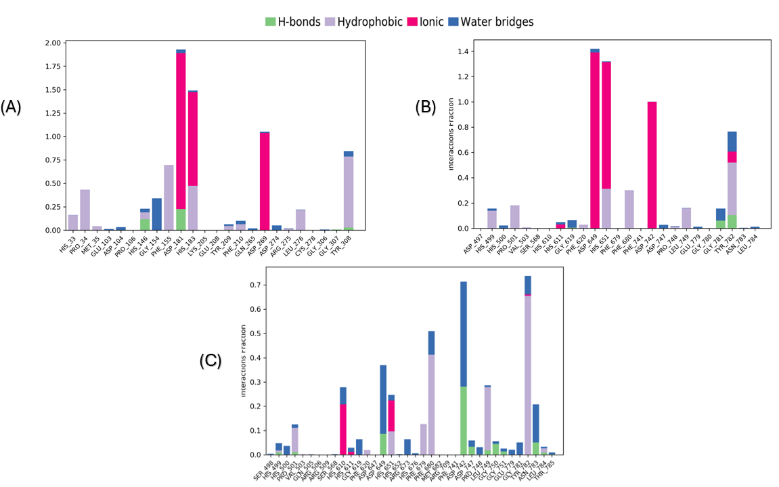
Fig. 8: Show the protein and ligand interactions over the simulation period. Interactions that sustained over 30.0% of the simulation duration within the selected trajectory (ranging from 0.00 to 100.00 ns) are highlighted. The normalized stacked bar charts display the interactions throughout the simulation trajectory. For instance, a value of 0.7 indicates that the specific interaction is sustained for 70% of the simulation duration. It is important to note that values exceeding 1.0 are achievable, as specific protein residues may establish multiple contacts of the same subtype with the ligand. (A) Complex A (B) Complex B (C) Complex C
Protein-ligand interactions
During the molecular dynamic simulation, four significant interactions (hydrogen bond, hydrophobic contacts, ionic interaction (metal coordination), and water bridges) were observed between the protein and the ligand, significantly contributing to maintaining the complex (fig. 8 and 9). In both complexes (A and B), the coordination of Zn²⁺ has been maintained throughout the entire simulation, playing a crucial role in the overall stability of the structures (fig. 9 and 10). This is similar to what has been shown in the molecular docking of Km68 with HDAC2 and Km69 with HDAC6. The plot for complexes A and B demonstrates other interaction strengths for a particular group of residues. In complex A, His183 coordinated with Zn2+ throughout the entirety of the simulation and was observed to form an aromatic stacking interaction with the benzylic linker of Km68 for 32% of the simulation duration (fig. 9). Tyr308 and Gly154 played a further significant role in the stability of complex A through aromatic stacking, which accounted for 30% of the simulation duration, and via the formation of water bridges, which constituted 32% of the simulation time, respectively. In complex B, the residue His651 of HDAC6 remained coordinated with Zn2+ throughout the simulation while participating in aromatic stacking interactions for 31% of the duration (fig. 9 and 10). The graph for complex C depicts a more distributed and low-intensity interaction signature (fig. 9 and 10). The variety of peaks, albeit with reduced amplitude, suggests a more scattered pattern of hydrogen bond formation.
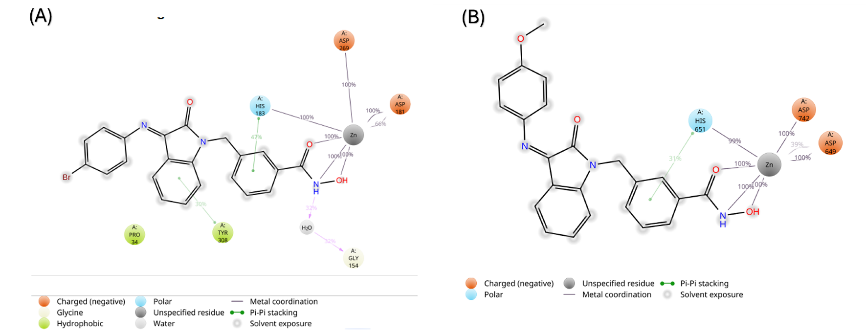
Fig. 9: A representation illustrating the intricate interactions between ligand atoms and protein residues. Interactions that sustained over 30.0% of the simulation duration within the selected trajectory (ranging from 0.00 to 100.00 ns) are highlighted. (A) Complex A, showing coordination to Zn2+is sustained through the whole simulation time with some contribution from His183 (47 %) and Tyr (30%), (B) Complex B, showing coordination to Zn2+is sustained through the whole simulation time with some contribution from His651 (31 %)
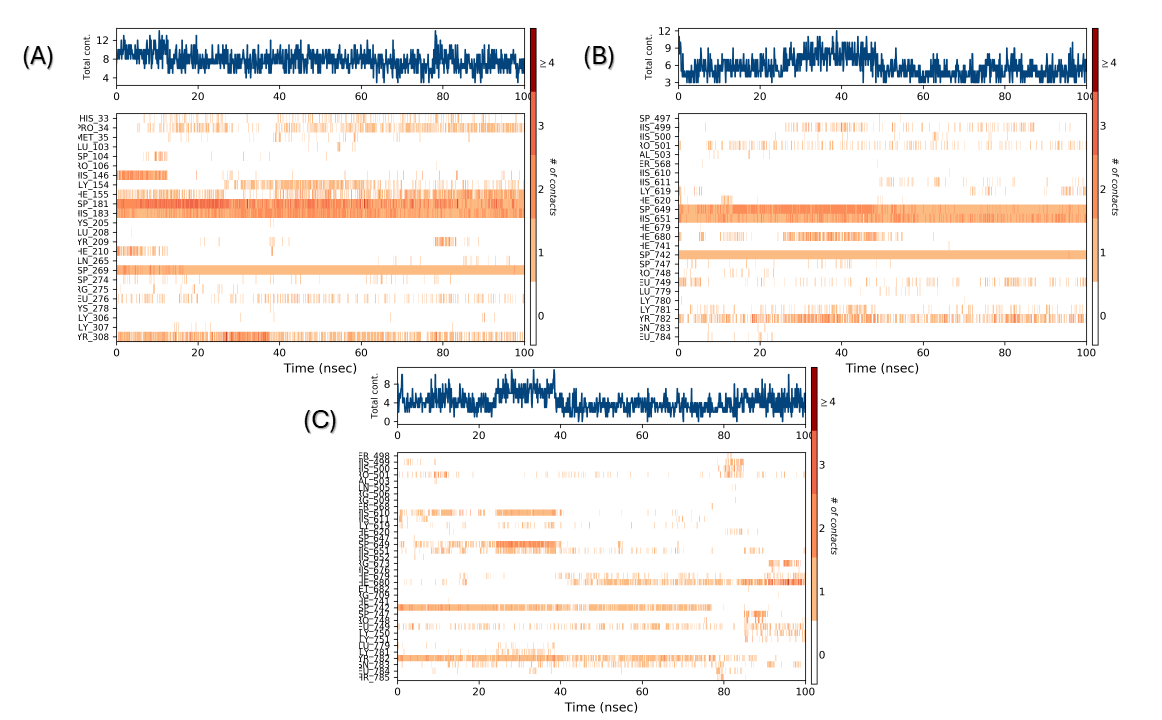
Fig. 10: Timeline illustrates the interactions and contacts, including hydrogen bonds, hydrophobic interactions, ionic interactions, and water bridges. The top panel presents the total number of specific contacts formed between the protein and the ligand throughout the trajectory. The bottom panel details the specific residues that interact with the ligand in each trajectory frame. The output delineates the residues that interact with the ligand across each trajectory frame. Certain residues engage in multiple specific contacts with the ligand, indicated by a deeper shade of orange. (A) Complex A, (B) Complex B, (C) Complex C
CONCLUSION
In this study, we endeavored to examine new isatin-imine hybrid compounds through computational methods, including ADMET analysis, molecular docking, and molecular dynamics simulation, to evaluate their potential as isoform-selective inhibitors of histone deacetylase 6 (HDAC6). Our findings revealed several significant insights regarding these compounds. Firstly, all compounds exhibited favorable ADMET profiles, indicating they are viable candidates for further investigation. Furthermore, the binding affinity of these compounds for HDAC6 surpassed that of SAHA and nexturastat A, with all compounds (except Km68) demonstrating greater binding affinity for HDAC6 compared to HDAC2 and HDAC8. In the molecular dynamics simulation conducted over a 100 ns period, two complexes-Km69 with HDAC6 and Km68 with HDAC2-exhibited stability throughout the simulation. Conversely, Km68 in a complex with HDAC6 displayed instability during the simulation period. Investigating the efficacy of these novel isatin imines through comprehensive experimental studies would be insightful, particularly in both in vitro assays and in vivo models. A targeted examination of the inhibitory effects of these compounds through enzymatic assays would provide robust validation of the computational analysis pertaining to their efficacy.
FUNDING
Nil
AUTHORS CONTRIBUTIONS
Karrar Al-Gburi: Conceptualizing the idea, conducting In silico studies, interpreting data, preparing and reviewing drafts, and finalizing manuscripts. Noor H. Nasser and Malina Jasmi: Supervision, discussion, reviewing draft preparation, and approved the final draft.
CONFLICT OF INTERESTS
Declared none
REFERENCES
Bondarev AD, Attwood MM, Jonsson J, Chubarev VN, Tarasov VV, Schioth HB. Recent developments of HDAC inhibitors: emerging indications and novel molecules. Br J Clin Pharmacol. 2021;87(12):4577-97. doi: 10.1111/bcp.14889, PMID 33971031.
Wang XX, Wan RZ, Liu ZP. Recent advances in the discovery of potent and selective HDAC6 inhibitors. Eur J Med Chem. 2018 Jan 1;143:1406-18. doi: 10.1016/j.ejmech.2017.10.040, PMID 29133060.
Yang F, Zhao N, GE D, Chen Y. Next generation of selective histone deacetylase inhibitors. RSC Adv. 2019 Jun 19;9(34):19571-83. doi: 10.1039/c9ra02985k, PMID 35519364.
Olaoye OO, Watson PR, Nawar N, Geletu M, Sedighi A, Bukhari S. Unique molecular interaction with the histone deacetylase 6 catalytic tunnel: crystallographic and biological characterization of a model chemotype. J Med Chem. 2021 Mar 11;64(5):2691-704. doi: 10.1021/acs.jmedchem.0c01922, PMID 33576627.
Melesina J, Simoben CV, Praetorius L, Bulbul EF, Robaa D, Sippl W. Strategies to design selective histone deacetylase inhibitors. Chem Med Chem. 2021 Jan 11;16(9):1336-59. doi: 10.1002/cmdc.202000934, PMID 33428327.
Miyake Y, Keusch JJ, Wang L, Saito M, Hess D, Wang X. Structural insights into HDAC6 tubulin deacetylation and its selective inhibition. Nat Chem Biol. 2016 Sep;12(9):748-54. doi: 10.1038/nchembio.2140, PMID 27454931.
Osko JD, Christianson DW. Structural determinants of affinity and selectivity in the binding of inhibitors to histone deacetylase 6. Bioorg Med Chem Lett. 2020 Apr 15;30(8):127023. doi: 10.1016/j.bmcl.2020.127023, PMID 32067866.
Nam NH, Huong TL, Dung DT, Dung PT, Oanh DT, Quyen D. Novel isatin-based hydroxamic acids as histone deacetylase inhibitors and antitumor agents. Eur J Med Chem. 2013 Dec 1;70:477-86. doi: 10.1016/j.ejmech.2013.10.045, PMID 24185378.
Anh DT, Hai PT, Dung DT, Dung PT, Huong LT, Park EJ. Design synthesis and evaluation of novel indirubin-based N-hydroxybenzamides N-hydroxypropenamides and N-hydroxyheptanamides as histone deacetylase inhibitors and antitumor agents. Bioorg Med Chem Lett. 2020 Nov 15;30(22):127537. doi: 10.1016/j.bmcl.2020.127537, PMID 32916298.
Ammar YA, Belal A, El Sharief MA, Mohamed YA, Mehany AB, Elhag Ali GA. Design synthesis molecular docking and biological activity evaluation of some novel indole derivatives as potent anticancer active agents and apoptosis inducers. Bioorg Chem. 2019 Apr 1;85:399-412. doi: 10.1016/j.bioorg.2019.01.016.
Ammar YA, Sh El Sharief AM, Belal A, Abbas SY, Mohamed YA, Mehany AB. Design synthesis antiproliferative activity molecular docking and cell cycle analysis of some novel (morpholinosulfonyl) isatins with potential EGFR inhibitory activity. Eur J Med Chem. 2018 Aug 5;156:918-32. doi: 10.1016/j.ejmech.2018.06.061, PMID 30096580.
Evdokimov NM, Magedov IV, McBrayer D, Kornienko A. Isatin derivatives with activity against apoptosis-resistant cancer cells. Bioorg Med Chem Lett. 2016 Mar 15;26(6):1558-60. doi: 10.1016/j.bmcl.2016.02.015, PMID 26883150.
Varun S, Sonam R, Kakkar R. Isatin and its derivatives: a survey of recent syntheses reactions and applications. Med Chem Comm. 2019 Mar 20;10(3):351-68. doi: 10.1039/c8md00585k, PMID 30996856.
Agarwal R, Pattarawat P, Duff MR, Wang HR, Baudry J, Smith JC. Structure-based identification of novel histone deacetylase 4 (HDAC4) inhibitors. Pharmaceuticals (Basel). 2024 Jul;17(7):867. doi: 10.3390/ph17070867, PMID 39065718.
A Majed A, Al Duhaidahawi D, A Omran H, Abbas S, S Abid D, Y Hmood A. Synthesis molecular docking of new amide thiazolidine derived from isoniazid and studying their biological activity against cancer cells. J Biomol Struct Dyn. 2024 Dec 20;42(24):13485-96. doi: 10.1080/07391102.2023.2276313, PMID 37922154.
Singh A, Rajak H. Structural exploration and pharmacophoric investigation of pyrazole based analogs as novel histone deacetylase 1 inhibitor using combinatorial studies. Int J Pharm Pharm Sci. 2018 Mar 1;10(3):90-6. doi: 10.22159/ijpps.2018v10i3.22735.
FU L, Shi S, YI J, Wang N, HE Y, WU Z. ADMET lab 3.0: an updated comprehensive online ADMET prediction platform enhanced with broader coverage improved performance API functionality and decision support. Nucleic Acids Res. 2024 Jul 5;52(W1):W422-31. doi: 10.1093/nar/gkae236, PMID 38572755.
Xiong G, WU Z, YI J, FU L, Yang Z, Hsieh C. ADMET lab 2.0: an integrated online platform for accurate and comprehensive predictions of ADMET properties. Nucleic Acids Res. 2021 Jul 2;49(W1):W5-W14. doi: 10.1093/nar/gkab255, PMID 33893803.
Valdes Tresanco MS, Valdes Tresanco ME, Valiente PA, Moreno E. AMDock: a versatile graphical tool for assisting molecular docking with autodock vina and autodock4. Biol Direct. 2020 Sep 16;15(1):12. doi: 10.1186/s13062-020-00267-2, PMID 32938494.
Santos Martins D, Forli S, Ramos MJ, Olson AJ. Auto dock4 (Zn): an improved auto dock force field for small molecule docking to zinc metalloproteins. J Chem Inf Model. 2014 Aug 25;54(8):2371-9. doi: 10.1021/ci500209e, PMID 24931227.
Edache EI, Uzairu A, Mamza PA, Shallangwa GA, Yagin FH, Abdel Samee N. Combining docking molecular dynamics simulations AD-MET pharmacokinetics properties and MMGBSA calculations to create specialized protocols for running effective virtual screening campaigns on the autoimmune disorder and SARS-CoV-2 main protease. Front Mol Biosci. 2023 Sep 1;10:1254230. doi: 10.3389/fmolb.2023.1254230, PMID 37771457.
Schultes S, DE Graaf C, Haaksma EE, DE Esch IJ, Leurs R, Kramer O. Ligand efficiency as a guide in fragment hit selection and optimization. Drug Discov Today Technol. 2010 Sep 1;7(3):e157-62. doi: 10.1016/j.ddtec.2010.11.003.
Bowers KJ, Chow DE, XU H, Dror RO, Eastwood MP, Gregersen BA. Scalable algorithms for molecular dynamics simulations on commodity clusters. In: SC ‘06: proceedings of the 2006 ACM/IEEE conference on supercomputing. New York: IEEE; 2006. p. 43. doi: 10.1109/SC.2006.54.
Varghese SS, Mathews SM. A simulation approach for NOVEL 1,3,4 thiadiazole acetamide moieties as potent antimycobacterial agents. Int J Pharm Pharm Sci. 2024 Jul 1:16(7):40-7. doi: 10.22159/ijpps.2024v16i7.51356.
Ullah S, Zheng Z, Rahman W, Ullah F, Ullah A, Iqbal MN. A computational approach to fighting type 1 diabetes by targeting 2C coxsackie B virus protein with flavonoids. Plos One. 2023 Aug 30;18(8):e0290576. doi: 10.1371/journal.pone.0290576, PMID 37647325.
Oluwafemi KA, Jimoh RB, Omoboyowa DA, Olonisakin A, Adeforiti AF, Iqbal N. Investigating the effect of 1,2-dibenzoylhydrazine on staphylococcus aureus using integrated computational approaches. In Silico Pharmacol. 2024 Nov 9;12(2):102. doi: 10.1007/s40203-024-00278-1, PMID 39524456.
Siddiquee NH, Hossain MI, Talukder ME, Nirob SA, Shourav M, Jahan I. In silico identification of novel natural drug leads against the ebola virus VP40 protein: a promising approach for developing new antiviral therapeutics. Inform Med Unlocked. 2024 Jan 1;45:101458.
Dowden H, Munro J. Trends in clinical success rates and therapeutic focus. Nat Rev Drug Discov. 2019 May 8;18(7):495-6. doi: 10.1038/d41573-019-00074-z, PMID 31267067.
Harrison RK. Phase II and phase III failures: 2013-2015. Nat Rev Drug Discov. 2016 Dec 1;15(12):817-8. doi: 10.1038/nrd.2016.184, PMID 27811931.
Lipinski CA, Lombardo F, Dominy BW, Feeney PJ. Experimental and computational approaches to estimate solubility and permeability in drug discovery and development settings. Adv Drug Deliv Rev. 2001;46(1-3):3-26. doi: 10.1016/s0169-409x(00)00129-0, PMID 11259830.
Veber DF, Johnson SR, Cheng HY, Smith BR, Ward KW, Kopple KD. Molecular properties that influence the oral bioavailability of drug candidates. J Med Chem. 2002 Jun 1;45(12):2615-23. doi: 10.1021/jm020017n, PMID 12036371.
Waring MJ. Lipophilicity in drug discovery. Expert Opin Drug Discov. 2010 Mar 1;5(3):235-48. doi: 10.1517/17460441003605098, PMID 22823020.
Landry ML, Crawford JJ. Log D contributions of substituents commonly used in medicinal chemistry. ACS Med Chem Lett. 2020;11(1):72-6. doi: 10.1021/acsmedchemlett.9b00489, PMID 31938466.
Jia CY, LI JY, Hao GF, Yang GF. A drug-likeness toolbox facilitates ADMET study in drug discovery. Drug Discov Today. 2020 Jan 1;25(1):248-58. doi: 10.1016/j.drudis.2019.10.014, PMID 31705979.
Ghose AK, Viswanadhan VN, Wendoloski JJ. A knowledge-based approach in designing combinatorial or medicinal chemistry libraries for drug discovery. 1. A qualitative and quantitative characterization of known drug databases. J Comb Chem. 1999 Jan 12;1(1):55-68. doi: 10.1021/cc9800071, PMID 10746014.
IM, SL H, DB. Simple selection criteria for drug like chemical matter. J Med Chem. 2001;44(12);1841-6. Available from: https://pubmed.ncbi.nlm.nih.gov/11384230. [Last accessed on 10 Oct 2024].
Bickerton GR, Paolini GV, Besnard J, Muresan S, Hopkins AL. Quantifying the chemical beauty of drugs. Nat Chem. 2012 Jan 24;4(2):90-8. doi: 10.1038/nchem.1243, PMID 22270643.
Johnson TW, Dress KR, Edwards M. Using the golden triangle to optimize clearance and oral absorption. Bioorg Med Chem Lett. 2009 Oct;19(19):5560-4. doi: 10.1016/j.bmcl.2009.08.045, PMID 19720530.
Baell JB, Holloway GA. New substructure filters for removal of pan assay interference compounds (PAINS) from screening libraries and for their exclusion in bioassays. J Med Chem. 2010 Apr 8;53(7):2719-40. doi: 10.1021/jm901137j, PMID 20131845.
Swain C. Distribution and plasma protein binding; 2019. Cambridge Medchem Consulting. Available from: https://www.cambridgemedchemconsulting.com//resources//resources/ADME//resources/ADME/distribution.html. [Last accessed on 11 Oct 2024].
Han Y, Zhang J, HU CQ, Zhang X, MA B, Zhang P. In silico ADME and toxicity prediction of ceftazidime and its impurities. Front Pharmacol. 2019 Apr 24;10:434. doi: 10.3389/fphar.2019.00434, PMID 31068821.
Gessner A, Konig J, Fromm MF. Clinical aspects of transporter mediated drug-drug interactions. Clin Pharmacol Ther. 2019;105(6):1386-94. doi: 10.1002/cpt.1360, PMID 30648735.
Varma MV, Feng B, Obach RS, Troutman MD, Chupka J, Miller HR. Physicochemical determinants of human renal clearance. J Med Chem. 2009 Aug 13;52(15):4844-52. doi: 10.1021/jm900403j, PMID 19445515.
Citarella A, Moi D, Pinzi L, Bonanni D, Rastelli G. Hydroxamic acid derivatives: from synthetic strategies to medicinal chemistry applications. ACS Omega. 2021 Aug 31;6(34):21843-9. doi: 10.1021/acsomega.1c03628, PMID 34497879.
Pinzi L, Rastelli G. Molecular docking: shifting paradigms in drug discovery. Int J Mol Sci. 2019 Jan;20(18):4331. doi: 10.3390/ijms20184331, PMID 31487867.
Bui HT, Nguyen PH, Pham QM, Tran HP, Tran Q, Jung H. Target design of novel histone deacetylase 6 selective inhibitors with 2-mercaptoquinazolinone as the cap moiety. Molecules. 2022 Jan;27(7):2204. doi: 10.3390/molecules27072204, PMID 35408604.
Porter NJ, Mahendran A, Breslow R, Christianson DW. Unusual zinc binding mode of HDAC6-selective hydroxamate inhibitors. Proc Natl Acad Sci USA. 2017 Dec 19;114(51):13459-64. doi: 10.1073/pnas.1718823114, PMID 29203661.
Shen S, Svoboda M, Zhang G, Cavasin MA, Motlova L, McKinsey TA. Structural and in vivo characterization of Tubastatin A, a widely used histone deacetylase 6 inhibitor. ACS Med Chem Lett. 2020 May 14;11(5):706-12. doi: 10.1021/acsmedchemlett.9b00560, PMID 32435374.
Noonepalle S, Shen S, Ptacek J, Tavares MT, Zhang G, Stransky J. Rational design of suprastat: a novel selective histone deacetylase 6 inhibitor with the ability to potentiate immunotherapy in melanoma models. J Med Chem. 2020 Sep 24;63(18):10246-62. doi: 10.1021/acs.jmedchem.0c00567, PMID 32815366.
Porter NJ, Wagner FF, Christianson DW. Entropy as a driver of selectivity for inhibitor binding to histone deacetylase 6. Biochemistry. 2018 Jul 3;57(26):3916-24. doi: 10.1021/acs.biochem.8b00367, PMID 29775292.
Saraswati AP, Relitti N, Brindisi M, Osko JD, Chemi G, Federico S. Spiroindoline capped selective HDAC6 inhibitors: design synthesis structural analysis and biological evaluation. ACS Med Chem Lett. 2020 Sep 29;11(11):2268-76. doi: 10.1021/acsmedchemlett.0c00395, PMID 33214839.
Arnittali M, Rissanou AN, Harmandaris V. Structure of biomolecules through molecular dynamics simulations. Procedia Comput Sci. 2019 Jan 1;156:69-78.
Zhao H, Caflisch A. Molecular dynamics in drug design. Eur J Med Chem. 2015 Feb 16;91:4-14. doi: 10.1016/j.ejmech.2014.08.004, PMID 25108504.
Salo Ahen OM, Alanko I, Bhadane R, Bonvin AM, Honorato RV, Hossain S. Molecular dynamics simulations in drug discovery and pharmaceutical development. Processes. 2021 Jan;9(1):71.
Kumar S, Sharma PP, Shankar U, Kumar D, Joshi SK, Pena L. Discovery of new hydroxyethylamine analogs against 3CLpro protein target of SARS-CoV-2: molecular docking molecular dynamics simulation and structure-activity relationship studies. J Chem Inf Model. 2020 Dec 28;60(12):5754-70. doi: 10.1021/acs.jcim.0c00326, PMID 32551639.
Iqbal D, Rehman MT, Bin Dukhyil A, Rizvi SM, Al Ajmi MF, Alshehri BM. High-throughput screening and molecular dynamics simulation of natural product-like compounds against alzheimers disease through multitarget approach. Pharmaceuticals (Basel). 2021 Sep;14(9):937. doi: 10.3390/ph14090937, PMID 34577637.
Yang X, Xing X, Liu Y, Zheng Y. Screening of potential inhibitors targeting the main protease structure of SARS-CoV-2 via molecular docking. Front Pharmacol. 2022 Oct 5;13:962863. doi: 10.3389/fphar.2022.962863, PMID 36278156.