
Int J App Pharm, Vol 17, Issue 6, 2025, 219-231Original Article
BOX-BEHNKEN DESIGN-BASED DEVELOPMENT OF ECO-FRIENDLY RP-HPLC ANALYTICAL METHOD FOR THE QUANTIFICATION OF ERASTIN FROM THE MESOPOROUS SILICA NANOPARTICLES
ASHUTOSH GUPTA1, RACHANA S. P.2, SUDHEER MOORKOTH1, NAMDEV DHAS2*
1Department of Pharmaceutical Quality Assurance, Manipal College of Pharmaceutical Sciences, Manipal Academy of Higher Education, Manipal-576104, Karnataka, India. 2Department of Pharmaceutics, Manipal College of Pharmaceutical Sciences, Manipal Academy of Higher Education, Manipal-576104, Karnataka, India
*Corresponding author: Namdev Dhas; *Email: namdevdhas89@gmail.com
Received: 22 Jan 2025, Revised and Accepted: 15 Sep 2025
ABSTRACT
Objective: Globally, cancer remains a major source of illness and mortality. Approximately 30% of initial glioblastomas and 80% of all malignant ones are gliomas. Erastin (ERT) is a small molecule that kills cancer cells through ferroptosis and treats brain cancer. The current work aims to optimize, establish, and validate a High-Performance Liquid Chromatography (HPLC) method with sufficient sensitivity and specificity to measure ERT in Mesoporous Silica Nanoparticles (MSNs). The HPLC method was optimized using the Design of Experiments (DoE) technique. The novelty of this project is the development of the DoE-based HPLC method for quantifying ERT from the MSNs.
Methods: The Box-Behnken Design (BBD) was used for the method optimization, and buffer ratio, injection volume, buffer pH, and flow rate were used as the independent factors. The dependent variables were retention time (RT) of ERT, peak area of ERT, and tailing factor (TF) of ERT. The optimized chromatographic conditions were: buffer ratio of 80%, buffer pH 3.8, flow rate 0.9 ml/min, and injection volume 8 µl**. The established HPLC method was validated as per International Council for Harmonisation (ICH) Q2 (R1) recommendations.
Results: The optimization of the HPLC method was done using BBD, and the desirability value was found to be 0.992. The established method showed good linearity (R2 = 0.9991) with a 12-500 ng/ml range, and LOD and LOQ were 2.71 ng and 6.25 ng, respectively. The Mesoporous Silica Nanoparticle (MSNs) matrix did not affect the specificity of our validated HPLC method for the analysis of ERT. Analysing the formulation's surface morphology helped confirm the synthesized MSNs. The proposed HPLC method was effectively used to calculate the medication loaded in the MSNs and to measure the amount of ERT entrapped. The % entrapment efficiency (EE) for ERT in MSNs was found to be 76.07±2.56%, and the % drug loading (DL) for ERT in MSNs was found to be 14±1.87%. The established HPLC method for estimating ERT was found to be environmentally friendly with an overall analytical greenness (AGREE) score of 0.6.
Conclusion: The established HPLC method was developed, optimized, and validated as per ICH Q2 R1 guidelines. The HPLC method was found to be eco-friendly as per the AGREE analysis.
Keywords: Box-behnken design, Mesoporous silica nanoparticles, HPLC, Design of expert, Nanoformulation, Greenness
© 2025 The Authors. Published by Innovare Academic Sciences Pvt Ltd. This is an open access article under the CC BY license (https://creativecommons.org/licenses/by/4.0/)
DOI: https://dx.doi.org/10.22159/ijap.2025v17i6.53771 Journal homepage: https://innovareacademics.in/journals/index.php/ijap
INTRODUCTION
Globally, cancer remains a major source of illness and mortality. Approximately 30% of initial glioblastomas and 80% of all malignant ones are gliomas. The World Health Organization (WHO) has historically categorized gliomas into four groups based on their histological characteristics: grade I and II (low-grade gliomas), grade III (anaplastic gliomas), and grade IV (glioblastoma) [1], which represent varying levels of cancer. In recent years, significant progress has been made in developing new ideas for glioma classification and treatment, particularly with the emergence of genomic, transcriptome, and epigenetic profiling. These concepts will supplement the classification system based only on morphology. GBM accounts for up to 50% of all gliomas and is the most prevalent and malignant kind of primary glioblastoma. The result for patients remains nearly always fatal despite advancements in the current standard of care, which includes surgery, radiation, and medication [2]. More recently, erastin (ERT) has been reported to treat brain cancer through ferroptosis [3, 4]. ERT was described as a small molecule chemical that effectively kills human cancer cells while avoiding their isogenic regular cell counterparts [5]. Further research by Dixon and colleagues revealed that ERT induces ferroptosis, an iron-dependent kind of controlled necrotic cell death [6].
ERT is a cell-permeable ferroptosis activator and an anticancer drug with a molecular weight of 547 g/mol, and its chemical formula is C30H31ClN4O4. The IUPAC name of ERT is 2-[1-[4-[2-(4-chlorophenoxy)acetyl]piperazin-1-yl]ethyl]-3-(2-ethoxyphenyl)quinazolin-4-one, with the chemical structure shown in fig. 1. It has a log P value of 4.8 and is related to the biopharmaceutics classification system (BCS) II class [7]. ERT exerts its action by ferroptosis via promoting cystine-glutamate transport receptor (system XC−), the voltage-dependent anion channel, and p53 receptors [3].
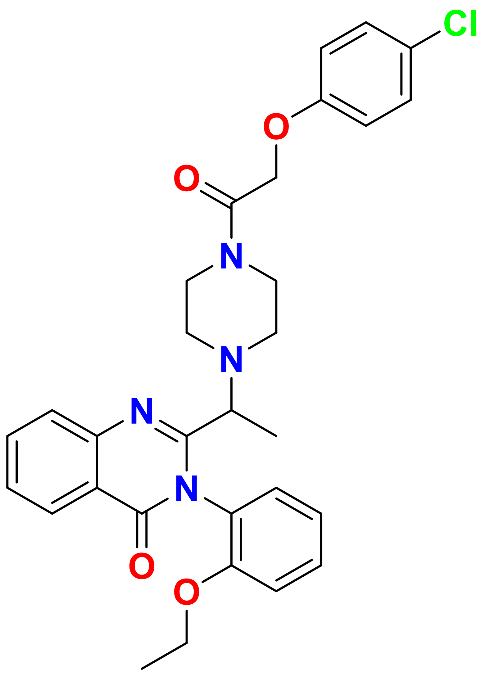
Fig. 1: Pictorial representation of erastin
Nanopharmaceuticals are now widely recognized as a novel and effective therapeutic strategy. Nanoformulation improves drug penetration and retention at the target site to provide a more desirable drug release profile. The improved targetability and greater bioavailability of nano-formulated anti-cancer medications have been shown in scientific literature to contribute to their increased efficacy [8–10]. Mesoporous Silica Nanoparticles (MSNs) bear a structural similarity to honeycomb cells due to their silica (SiO2) framework [11]. Their intrinsic porosity, along with their form and size flexibility, biocompatibility, and increased surface area, provides a number of benefits. The large surface area that results from their porous nature is particularly noteworthy because it makes it easier for functional groups to adhere to MSNs. Several viable methods, such as electrostatic adsorption, hydrophobic interactions, and covalent binding, can be used to load drugs into the core or on the surface of MSNs. ERT was loaded in the MSNs using a sol-gel-based method [12].
This work aimed to establish and verify a user-friendly, fast, sensitive, selective, and precise HPLC method for quantifying ERT, which has been incorporated in MSNs. Developing a method takes a lot of effort and often requires the "One-Factor-at-a-Time" (OFAT) method, which modifies one factor at a time until a workable solution is found [13]. The OFAT approach might suggest the appropriate methodology, yet it provides a superficial understanding of the method's repeatability and potential. On the other hand, using the Analytical Quality-by-Design (AQbD) methodology offers a systematic method to establish a screening procedure. Owing to the many benefits that AQbD provides, a number of pharmaceutical companies have indicated interest in using this approach to create analytical techniques for different active ingredients. Since the establishment of AQbD and the incorporation of its principles into the advancement of analytical methods, the intended level of pharmaceutical quality has been attained. Method development is a better time to employ the AQbD approach than method validation, as the latter is a process that verifies the analytical method is adequate for its intended application. The use of AQbD principles facilitates the scientific and risk-based identification of primary sources of variation, hence augmenting the efficacy and fortifying analytical methodologies. Furthermore, when exposed to severe conditions or long-term storage, the formation of deteriorated peaks significantly affects a method's ability to signal stability, which jeopardizes the selectivity gained on a nondegraded specimen. In order to address these issues, force degradation experiments with specific accelerated stress-induced conditions such as hydrolytic, oxidative, photo, and thermal degradation, were prepared.
The objective of this work was to finish the required steps, which included developing an HPLC technique for the quantifiable estimation of the ERT and AQBD tool optimization process. Following the guidelines in ICH Q2 (R1), the established HPLC technique was validated. The HPLC technique was then refined and validated for the measurement of ERT in the fabricated MSNs. The novelty of this work is that the quantification of the ERT HPLC method is not reported.
MATERIALS AND METHODS
Materials
ERT (off-white powder; purity>98%) was procured from Apicore Pharmaceutical Ltd (Vadodara, Gujarat). sodium hydroxide pellets (NaOH) (purity ≥98%), orthophosphoric acid (88%), and potassium dihydrogen phosphate (purity>98%) were supplied by Merck Ltd., Mumbai, India. HPLC mark organic solvent (methanol and acetonitrile) and 35% AR hydrochloric acid supplied by Finar (Ahmedabad, India). The Milli-Q (Type 1 water) was produced in a laboratory. Finar Ltd. Membrane filter of 0.45 μm purchased from Riviera Glass Pvt. Ltd (Mumbai, India). 120 Å, 250 mm × 4.6 mm, 5 µm particle size Spherisorb octadecylsilyl ODS C18 column. Cetyltrimethylammonium Bromide (CTAB) was procured from TCI Pharmaceuticals, Tokyo Chemical Industry (India) Pvt. Ltd (Japan), tetra ethyl ortho silicate (TEOS) was acquired from Sisco Research Laboratories Pvt. Ltd. (SRL) (Mumbai, India).
Method
Instrumentation
LabSolution software wa utilized for the analysis, and the Shimadzu HPLC system LC20-AD was connected to photodiode array (PDA) detectors (SPD-20A and SPD-M10A). The calibrated weighing balance (Sartorius Mechatronics CP225D, India) was utilized to weigh each chemical involved in the analysis accurately. A 0.45 µm membrane filter was employed in the glass vacuum filtration assembly unit to filter the buffer solution that had been prepared. The solvents were degassed for ten minutes using an ultrasonicator (Servewell Instruments, India). The pH of the mobile phase was measured using a pH meter that was calibrated by Systronics India Ltd., located in Ahmedabad, India.
Analytical methods for the estimation of erastin
To find out the wavelength of ERT for the analysis. The working solution of ERT with a concentration of 10 µg/ml was prepared. The final solution was prepared, and its absorption maxima (λmax) were determined utilizing a double-beam UV-Vis spectrophotometer (UV-1800) operating in the 190–800 nm range. Water was used as a blank.
Screening of the mobile phase and the stationary phase
The buffer solution selected was ammonium acetate, which ranged from 3.8 to 5.8 because of the chemical structure of ERT. ERT has the carboxylic group in the structure and will ionize in the ammonium acetate buffer range. After the ionization, carboxylic acid breaks into carboxylate ions [14]. ERT is a small molecule with hydrophobic properties, it contains multiple aromatic and aliphatic ring chains. Spherisorb ODS C18 was selected as a stationary phase because octadecylsilane bonded to silica and provided the hydrophobic interaction. This will help to retain the drug in the column.
Preparation of standard solution for the drug
The concentration of the primary stock solutions was 1 mg/ml (1,000 µg/ml) after adding 1 mg of ERT in 100 µl** of dimethyl sulfoxide (DMSO), and adding methanol and volume to make up to 1 ml. After that, the drug solution was mixed for two minutes. In an additional step, we diluted the primary stock solutions with the appropriate diluent to get working stock solutions of ERT at concentrations ranging from 12 to 100ng/ml.
Selection of critical independent variables
According to the literature review, the independent variables affecting the peak properties are ERT's peak area, ERT's retention time (RT), and tailing factor (TF). The independent variables include buffer ratio, injection volume, flow rate, and pH [15–17]. Additionally, OFAT analysis was conducted to identify the independent factors that substantially affected the technique outcomes once a working range for each variable was defined [18, 19].
Chromatographic conditions optimized with the help of BBD
The critical factors leading to ERT's efficient elution must be identified and examined to design the optimal chromatographic method for analyte estimation. Numerous expensive, time-consuming tests might be carried out without an experimental design. As part of an improved procedure, the identified essential variables must be refined to get accurate experimental values. A thorough understanding of the chemistry of each component and how they relate to one another is necessary to optimize values for these crucial HPLC parameters. DoE is a mathematical technique that might assist you in understanding these different degrees of complexity. To assist in locating the sweet spot in parameter space where a dependable response could be produced, DoE employs a variation of response surface types. Central Composite Design (CCD) and Box Behnken Design (BBD) are two possible approaches [20, 21]. A quadratic design assessed the impact of both independent and interaction factors. This approach generates a more accurate image since it does not take into account the variable's outlier values. For this reason, the BBD model method was adjusted using the DoE program. The BBD has the advantage of requiring fewer runs than the CCD. The BBD is frequently chosen over the CCD because of its efficiency and practicality. BBD usually necessitates fewer experimental runs, saving money while yielding reliable data for optimization. All experimental circumstances are safe and feasible since BBD stays away from extreme combinations of factor levels present in CCD. Better quadratic impact estimation is made possible by this design emphasis on mid-level parameters, which eliminates the potential complexities that come with extreme values. Furthermore, BBD is especially helpful for well-informed procedures where the center of the design space is anticipated to be the optimal. Regarding experimental design, BBD is useful since it provides a simplified method that strikes a compromise between thoroughness and resource efficiency. In this optimization method, the injection volume (X4), pH (X2), flow rate (X3), and phase ratio (X1) of the buffer (chromatographic parameters) were utilized as independent variables. Simultaneous measurements were made of the RT of ERT (Y1), peak area of ERT (Y2), and TF of ERT (X3).
Method validation
The established and optimized method for quantifying ERT was validated as per ICH Q2 (R1) reformations [22, 23].
System suitability
This is helpful in determining the system's suitability for the development of the method. Six ERT samples were injected at a concentration of 1 µg/ml in this validation parameter. The Tf, theoretical plate (TP), and RT were computed for a standard ERT solution.
Specificity and selectivity
Specificity and selectivity investigations establish the chromatographic conditions' ability to assess a drug unambiguously in the presence of different excipients. The parameter impacts assay, purity assessments, and drug quantification.
Linearity
Linearity is a measure of the capability of a sample to give observations that are precisely proportional to the analyte concentration. Standard solutions of ERT have been prepared using serial dilutions from the working standard solution in concentration ranges (12–100 ng/ml), and the results were analyzed six times for each concentration. Plotting concentrations vs average peak area was used to evaluate the specimen data.
Accuracy
The degree of similarity between the results observed and the results expected to be a conventional true value characterizes the accuracy of an analytical HPLC technique that has been designed. The recovery samples' results, in which a known concentration of ERT at 3 different concentrations (80%, 100%, and 120%), were used to assess the accuracy of the suggested approach. All the samples are injected in triplicate. The % accuracy was calculated using equation (1).
 ……. Equation (1)
Precision
The precision is demonstrated by determining the closeness in responses of the samples under the specified conditions. This test is used to verify whether, when method development is finished, comparable samples will yield the same results when the technique is applied. Repeatability, also known as intra-day precision, was conducted by repeatedly analyzing a sample of ERT over the course of a day. To achieve inter-day precision, ERT was frequently evaluated over the course of two continuous days. The proposed method's precision is expressed in terms of %CV for peak area at individually quality control (QC) samples.
LOD and LOQ
Under specified experimental circumstances, the established technique's lowest detectable or differentiable concentration of ERT in the sample, which is not always approximated as an ideal value, is known as the Limit of Detection (LOD). The lowest amount of drug in a sample can be calculated is known as the Limit of Quantification (LOQ). The subsequent equations were used to determine the LOD and LOQ of the technique developed for the measurement of ERT.
 …… Equation (2)
 ……. Equation (3)
Robustness
The sensitivity of the current technique was observed by gradually adjusting the chromatographic settings, and it has been demonstrated to be dependable in common scenarios. The chromatographic parameters are pH 3.75 and 3.85, temperature 24 and 26, flow rate 0.8 and 1, injection volume 7 and 9, Change in the wavelength+1 and -1.
Stability studies
Stability studies of the ERT were checked in different conditions.
Bench-top stability
To check the benchtop stability of ERT, the sample with a concentration of 1 µg/ml was stored at ambient temperature and analyzed after 24 h. The observations were compared with freshly prepared samples [24]. The similarity index was calculated using Equation 4.
 …. Eq. (4)
Stress-induced force degradation studies
The performance of the established analytical method, which shows stability, was evaluated by applying various stress conditions, in compliance with ICH guidelines, to a standard of solution containing 1 µg/ml of ERT. The degradation investigations under stress were carried out under the following conditions: oxidative hydrolysis (3% H2O2) [25, 26], photolytic degradation [27], thermal degradation at 40 °C, acidic degradation (0.1 N HCl and 1 N HCl) [24], and basic degradation (0.1 N NaOH and 1 N NaOH) [28, 29]. A 1 ml standard stock solution of ERT at a concentration of 1 µg/ml was used in each degradation investigation. The medication solution was heated to 60 °C for around 24 h after adding 1 ml of each stressor [30]. After neutralizing and diluting the resultant solution, the samples were added to the HPLC for the stability analysis [31].
Application of the developed HPLC analytical method
The established HPLC method was applied to check the ERT concentration from the Prepared MSNs.
Fabrication of MSNs
MSNs were developed via the sol-gel method. In this process, deionized water was combined with CTAB, NaOH, and TEOS was progressively added. The resultant was stirred for two hours at 78 °C at 800 rpm. The formulation underwent three rounds of washing, a 10 min centrifugation at 10,000 rpm, and a 24 h hot air oven drying process at 60 °C. The formulation was then stored for calcination for three hours at 550 °C in a muffle furnace. The placebo MSNs were created using dependent variables such as polydispersity index, zeta potential, and particle size.
Preparation of erastin-loaded MSNs
The incubation approach was used to load the ERT into MSNs. In a nutshell, 1 ml of ethanol was mixed with 3 mg of ERT. Additionally, this solution was incubated in an ethanol solution containing 2 mg of MSNs. Subsequently, the MSNs were subjected to 5 min of sonication, and their dispersion was stirred at 500 rpm for 24 h at ambient temperature. Afterward, the dispersion was centrifuged for 10 min at 15,000 rpm. Washing the precipitate three times with ethanol was the next step. Lastly, dependent factors such as particle size, zeta potential, and PDI were used to describe and improve the synthetically produced ERT-loaded MSNs (ERT@MSNs) [32–34].
Determination of % entrapment efficiency (% EE) and % drug loading (% DL)
The dispersion was centrifuged at 15,000 rpm for 10 min following the loading process, and the established HPLC method was applied to estimate the ERT that remained in the supernatant (unentrapped ERT). Equation 5 and Equation 6 were used to determine the percentages of %EE and %DL of ERT in MSNs [35, 36].
 …. Equation (5)
 … Equation (6)
Scanning electron microscopy (SEM)
The surface properties of the synthesized MSNs were assessed using SEM. The MSN was prepared for SEM analysis on an aluminium counterfoil. After a thin coating of gold was coated using a gold sputtering coater, the sample was inspected using a SEM (EVO MA18, Zeiss) [37, 38].
Greenness of the developed method
The greenness of the analytical technique was evaluated utilizing the AGREE software [39]. This technique is designed to check the effect of the analytical method on the environment. This technique considers twelve factors, each given a score between 0 and 1, with higher numbers denoting a greener method. The AGREE score, which is frequently used for assessing clinical practice guidelines, may be adjusted to evaluate how well research adheres to the principles of Green Analytical Chemistry (GAC). GAC puts an enormous value on employing eco-friendly chemicals, cutting down on energy use, and lowering waste. An AGREE score customized for GAC would evaluate things like waste reduction tactics, the application of renewable resources, and the environmental effect of analytical techniques. To contribute to a more environmentally friendly future for analytical chemistry, researchers may ensure their techniques are technically sound and ecologically sustainable by adhering to GAC principles. This integration enhances scientific research’s ecological impact.
RESULTS AND DISCUSSION
Method development
The UV-Vis spectrophotometer was used to determine the ERT absorbance maximum, which was found to be 219 nm.
Selection of mobile and stationary phase
We investigated several other alternate mobile phases when developing the method of analysis for ERT. In the initial trials, acetonitrile/methanol was mixed in varied ratios with a phosphate buffer; however, this led to ERT eluting in the dead volume with a significant TF. The phosphate buffer was used in different ratios with water, methanol, and acetonitrile. The observations have been shown that the ERT was eluting early, and the peak was coming with the solvent peak. The TF of the ERT was more than 2, and the TP count of less than 2000 did not meet the acceptance criteria. We then experimented with a different strategy, employing acetonitrile/methanol as the mobile phase and an ammonium acetate buffer. Unfortunately, this mixture led to poor symmetry and a plate count of less than 2000 as the buffer and acetonitrile eluted ERT in the dead volume. In the last trial, we varied the proportions of methanol and ammonium acetate in the mobile phase. This method effectively produced ERT elution in after 3 min, achieving the approval requirements with a TF of less than 2 and a Tp count more than 2000. At first, we utilized a generally used C18 stationary phase (250 mm × 4.6 mm, 5 μm particle size, Waters), which resulted in peak ERT parameters that satisfied the requirements. DoE approach was used to further improve and optimize the chromatographic conditions.
Box-Behnken design guided method optimization
The independent factors that affected the chromatographical outcomes are directly impacted by the optimization methodology used in this method development. The absence of full knowledge of these crucial approach factors reduces the method's robustness and increases the possibility that it will not work as designed in many situations. Consequently, in order to develop an effective and accurate method for accurate ERT calculation, it is essential to recognize and carefully examine these impactful factors.
In the current work, we optimized the following independent variables using a three-level BBD: Buffer ratio (X1), buffer pH (X2), flow rate (X3), and Injection volume (X4). The findings of pilot OFAT experiments were used to establish the upper and lower bound values for these crucial parameters. For the buffer ratio in the mobile phase, we set a lower limit of 60% and an upper limit of 80%. The pH of the buffer varied between 3.8 (the lower limit) and 5.8 (the upper limit), while the flow rate was between 0.8 ml/min (the lower limit) and 1 ml/min (the upper limit). 5 µl (lowest limit) to 10 µl (highest limit) of injection volume were covered. On the other hand, using only OFAT-based methods might be difficult and time-consuming. As a result, using BBD and other response surface designs speeds up the optimization process and improves the creation of a reliable analytical method.
A total of 46 trial runs were performed using a single center point. The details of these trial runs and their corresponding outcomes are revealed in table 1. The outcomes of the analysis of variance (ANOVA) analysis indicate significant interactions between the independent variables, which are displayed in table 2. Each ANOVA result in our study represents the relative contribution of each component and how those components contribute to the response variables' overall variability. For instance, a factor with a high F-value and a low p-value greatly impacts the result; if it has a high p-value, it does not significantly affect the findings. By analyzing these numbers, we may determine which variables are essential to improving our circumstances and which are less important. 3D plots and perturbation plots were generated using the DoE software between the individual responses and the four variables significantly influencing the response. The influence of each independent variable on the chromatographic reactions are described in the following section.
Impact of independent factors on Rt of erastin (Y1)
The independent variables buffer ratio (X1) and flow rate (X3) were shown to have an impact on the RT of ERT by means of the quadratic equation (Equation 7) and ANOVA analysis. In contrast, the injection volume (X4) and buffer pH (X2) had less of an effect on RT. The increase in the buffer ratio and the decrease in the flow rate lead to an increase in the Rt of ERT. The buffer range was 60% to 80% and the flow rate range was 0.8 to 1 ml/min, which elute the ERT from 3.63 to 4.95 min. The 3D and perturbation plots are shown in fig. 2a and 3a.
Y1 =+4.17+0.5383 × A – 0.0115 × B – 0.4588 × C+0.0075 × D – 0.0504 × AB – 0.0545 × AC+0.0235 × AD+0.0192 × BC – 0.0041 × BD+0.0086 × CD ……… Equation (7)
Impact of independent factors on the peak area of erastin (Y2)
ANOVA analysis created the quadratic equation (Equation 8), which revealed that X4 and X3 significantly impacted the peak area of ERT. The X1 and X2 had less effect on the peak area of ERT. The increase in X4 and decrease in X3 increase the peak area of ERT. The X4 5 to 10 µl** and X3 0.8 to 1 ml/min give the peak area from 327119 to 997666. The 3D and perturbation plots are shown in fig. 2b and 3b.
Y2 =+8.344E+05 – 45740.44× A+93270.25 × B – 23502.56 × C+2.075E+05 × D+83908.25 × AB+23579.50 × AC – 13087.25 × AD+22034.13 × BC – 42586 × BD – 52536.75 × CD …… Equation (8)
Impact of independent factors on the theoretical plates (Y3)
ANOVA analysis created the quadratic equation (Equation 9), which revealed that the X2 and X4 significantly influenced the TF of ERT. The independent factors X1 and X3 did not significantly affect the TF. The increase in buffer pH and decrease in injection volume lead to a decrease in TF of ERT. The 5 to 10 µl** injection volume and buffer pH of 3.8 to 5.8 give the tailing from 1.71 to 2.32. The 3D and perturbation plots are shown in Figs. 2c and 3c.
Y3 = 2.18 – 0.0298 × A – 0.0126 × B+0.0101 × C+0.0424 × D+0.0588 × AB+0.0709 × AC – 0.0794 × AD – 0.0214 × BC+0.2804 × BD – 0.0303 × CD – 0.0194 A2 – 0.2297 B2…. Equation (9)
Table 1: The experimental design suggested by the DoE and their responses
| Std | Run | Buffer ratio (%) | Buffer pH | Flow rate (mL/min) | Injection volume (µl) | RT of ERT | Area of ERT | TF of ERT |
| 43 | 1 | 70 | 4.8 | 0.9 | 7.5 | 4.1795 | 767581 | 1.9815 |
| 9 | 2 | 70 | 3.8 | 0.9 | 7.5 | 4.1425 | 729698 | 1.906 |
| 32 | 3 | 70 | 4.8 | 1 | 7.5 | 3.6925 | 733325 | 1.934 |
| 38 | 4 | 70 | 5.8 | 0.9 | 5 | 4.2085 | 698922 | 1.675 |
| 4 | 5 | 80 | 5.8 | 0.9 | 7.5 | 4.7535 | 990028 | 1.9755 |
| 28 | 6 | 80 | 4.8 | 0.9 | 10 | 4.786 | 876576 | 2.0235 |
| 42 | 7 | 70 | 4.8 | 0.9 | 7.5 | 4.126 | 829911 | 2.147 |
| 33 | 8 | 60 | 4.8 | 0.9 | 7.5 | 3.7355 | 983133 | 2.1815 |
| 40 | 9 | 70 | 5.8 | 0.9 | 10 | 4.2025 | 983896 | 2.708 |
| 7 | 10 | 70 | 4.8 | 0.8 | 10 | 4.624 | 989625 | 2.018 |
| 46 | 11 | 70 | 4.8 | 0.9 | 7.5 | 4.117 | 799857 | 2.0995 |
| 25 | 12 | 60 | 4.8 | 0.9 | 5 | 3.7205 | 614911 | 2.1 |
| 14 | 13 | 80 | 4.8 | 0.8 | 7.5 | 5.313 | 757701 | 1.948 |
| 34 | 14 | 80 | 4.8 | 0.9 | 7.5 | 4.874 | 909979 | 2.184 |
| 39 | 15 | 70 | 3.8 | 0.9 | 10 | 4.159 | 931176 | 1.89 |
| 20 | 16 | 70 | 4.8 | 0.9 | 10 | 4.0565 | 984217 | 2.154 |
| 36 | 17 | 80 | 4.8 | 0.9 | 7.5 | 4.711 | 911383 | 2.1885 |
| 2 | 18 | 80 | 3.8 | 0.9 | 7.5 | 4.955 | 609353 | 1.9105 |
| 8 | 19 | 70 | 4.8 | 1 | 10 | 3.6655 | 996545 | 2.205 |
| 16 | 20 | 80 | 4.8 | 1 | 7.5 | 4.276 | 826880 | 2.2075 |
| 5 | 21 | 70 | 4.8 | 0.8 | 5 | 4.596 | 327119 | 2.154 |
| 15 | 22 | 60 | 4.8 | 1 | 7.5 | 3.34 | 884676 | 2.191 |
| 6 | 23 | 70 | 4.8 | 1 | 5 | 3.672 | 544186 | 2.22 |
| 12 | 24 | 70 | 5.8 | 0.9 | 7.5 | 4.129 | 990585 | 1.717 |
| 24 | 25 | 70 | 5.8 | 1 | 7.5 | 3.6835 | 900868 | 1.817 |
| 26 | 26 | 80 | 4.8 | 0.9 | 5 | 4.7175 | 546170 | 2.1665 |
| 1 | 27 | 60 | 3.8 | 0.9 | 7.5 | 3.727 | 871580 | 2.0375 |
| 3 | 28 | 60 | 5.8 | 0.9 | 7.5 | 3.727 | 916622 | 1.8675 |
| 10 | 29 | 70 | 5.8 | 0.9 | 7.5 | 4.107 | 905640 | 1.8445 |
| 31 | 30 | 70 | 4.8 | 0.8 | 7.5 | 4.5265 | 989402 | 2.2225 |
| 35 | 31 | 60 | 4.8 | 0.9 | 7.5 | 3.6685 | 981514 | 2.213 |
| 19 | 32 | 70 | 4.8 | 0.9 | 5 | 4.0085 | 613281 | 2.2785 |
| 30 | 33 | 70 | 4.8 | 1 | 7.5 | 3.639 | 863995 | 2.243 |
| 22 | 34 | 70 | 5.8 | 0.8 | 7.5 | 4.567 | 994664 | 1.8745 |
| 13 | 35 | 60 | 4.8 | 0.8 | 7.5 | 4.159 | 909815 | 2.215 |
| 23 | 36 | 70 | 3.8 | 1 | 7.5 | 3.6945 | 674449 | 2.0245 |
| 41 | 37 | 70 | 4.8 | 0.9 | 7.5 | 4.0435 | 968430 | 2.242 |
| 44 | 38 | 70 | 4.8 | 0.9 | 7.5 | 4.0425 | 959395 | 2.266 |
| 27 | 39 | 60 | 4.8 | 0.9 | 10 | 3.695 | 997666 | 2.2745 |
| 21 | 40 | 70 | 3.8 | 0.8 | 7.5 | 4.655 | 856381 | 1.9965 |
| 37 | 41 | 70 | 3.8 | 0.9 | 5 | 4.1485 | 475858 | 1.9785 |
| 17 | 42 | 70 | 4.8 | 0.9 | 5 | 4.047 | 608877 | 2.3235 |
| 18 | 43 | 70 | 4.8 | 0.9 | 10 | 4.0505 | 989578 | 2.302 |
| 29 | 44 | 70 | 4.8 | 0.8 | 7.5 | 4.5635 | 976258 | 2.2525 |
| 11 | 45 | 70 | 3.8 | 0.9 | 7.5 | 4.08 | 740407 | 1.9375 |
| 45 | 46 | 70 | 4.8 | 0.9 | 7.5 | 4.0315 | 970324 | 2.294 |
RT: retention time, TF: tailing factor, ERT: erastin.
Table 2: ANOVA results of BBD
| Response | RT of ERT (Y1) | Peak area of ERT (Y2) | TF (Y3) | |||
| F-value | 83.66 | 9.90 | 4.07 | |||
| p-value | Model | <0.0001 | Model | <0.0001 | Model | 0.0007 |
| A | <0.0001 | A | 0.0662 | A | 0.4039 | |
| B | 0.6426 | B | 0.0005 | B | 0.7220 | |
| C | <0.0001 | C | 0.3366 | C | 0.7767 | |
| D | 0.7604 | D | <0.0001 | D | 0.2364 | |
| AB | 0.3110 | AB | 0.0908 | AB | 0.4098 | |
| AC | 0.2736 | AC | 0.6281 | AC | 0.3212 | |
| AD | 0.6345 | AD | 0.7878 | AD | 0.2675 | |
| BC | 0.6968 | BC | 0.6507 | BC | 0.7632 | |
| BD | 0.9334 | BD | 0.3834 | BD | 0.0004 | |
| CD | 0.8613 | CD | 0.2836 | CD | 0.6701 | |
| A2 | 0.6624 | |||||
| B2 | <0.0001 | |||||
| R2 | 0.959 | 0.738 | 0.596 | |||
| Adjusted R2 | 0.948 | 0.664 | 0.450 |
Note: −The symbols A, B, C, and D stand for buffer ratio, pH, flow rate, and injection volume; AB, AC, AD, BC, BD, and CD denote combinations of these variables.
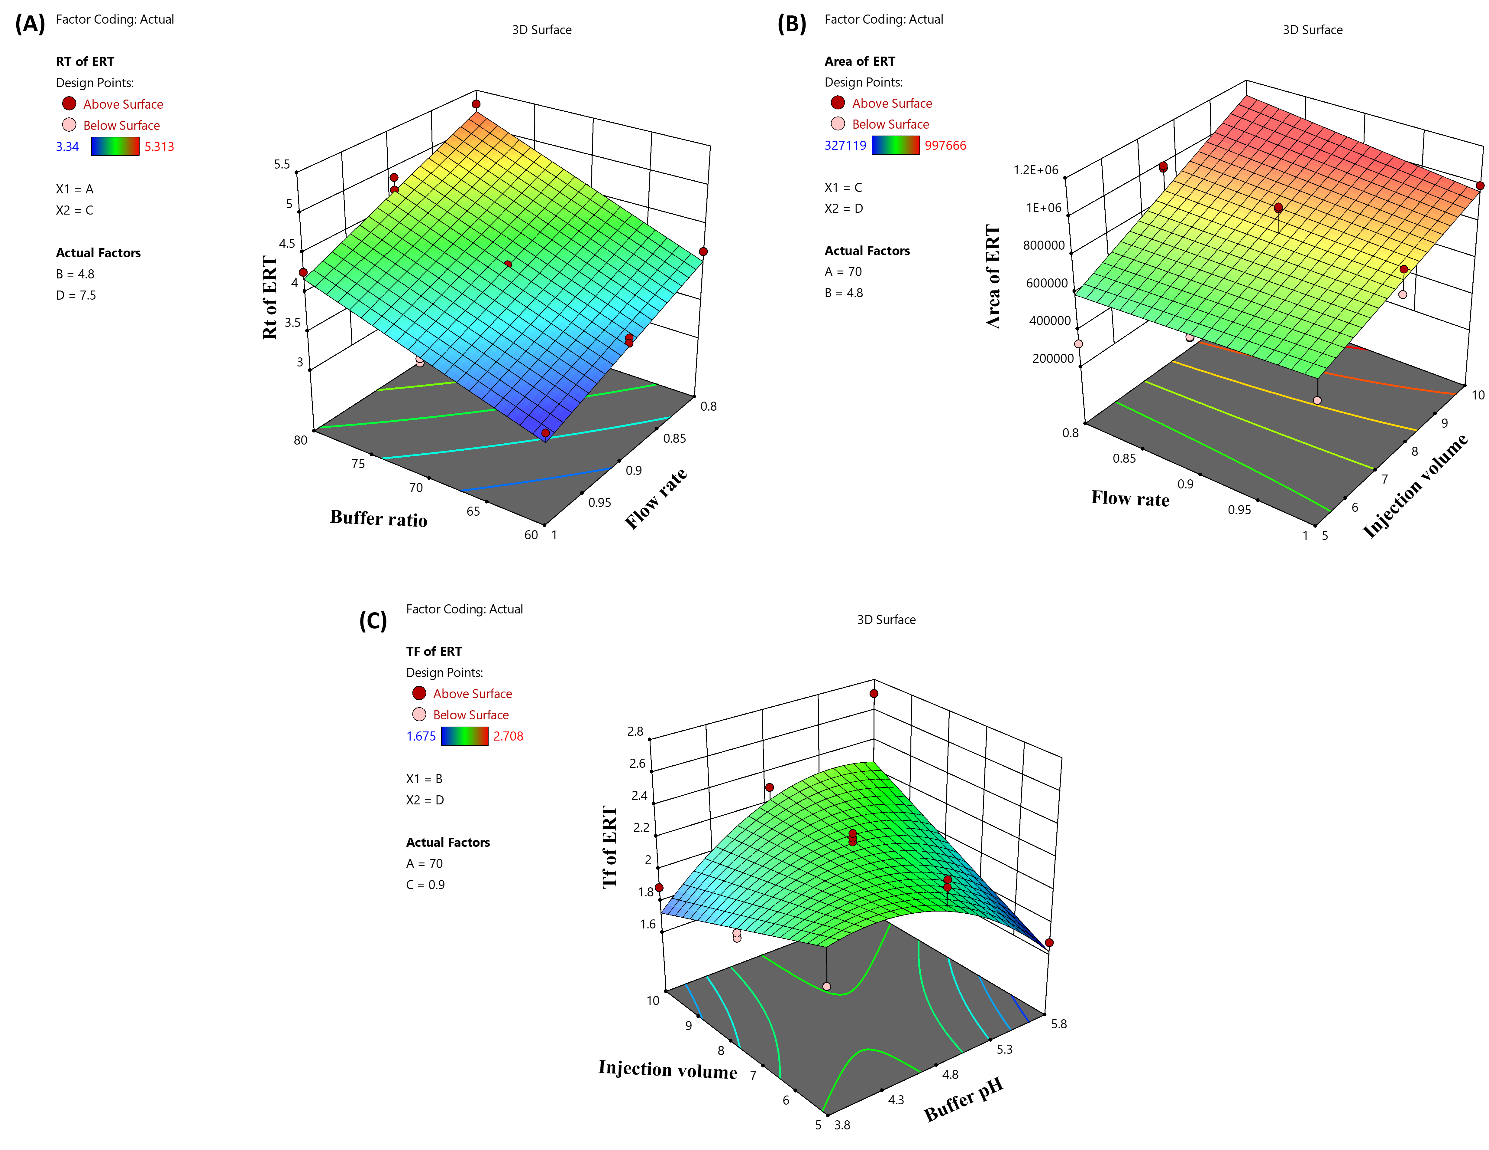
Fig. 2: The 3D surface response graphic illustrating how independent factors have an impact: (2a) on the retention time of ERT, (2b) on the peak area of ERT, (2c) on the tailing of ERT
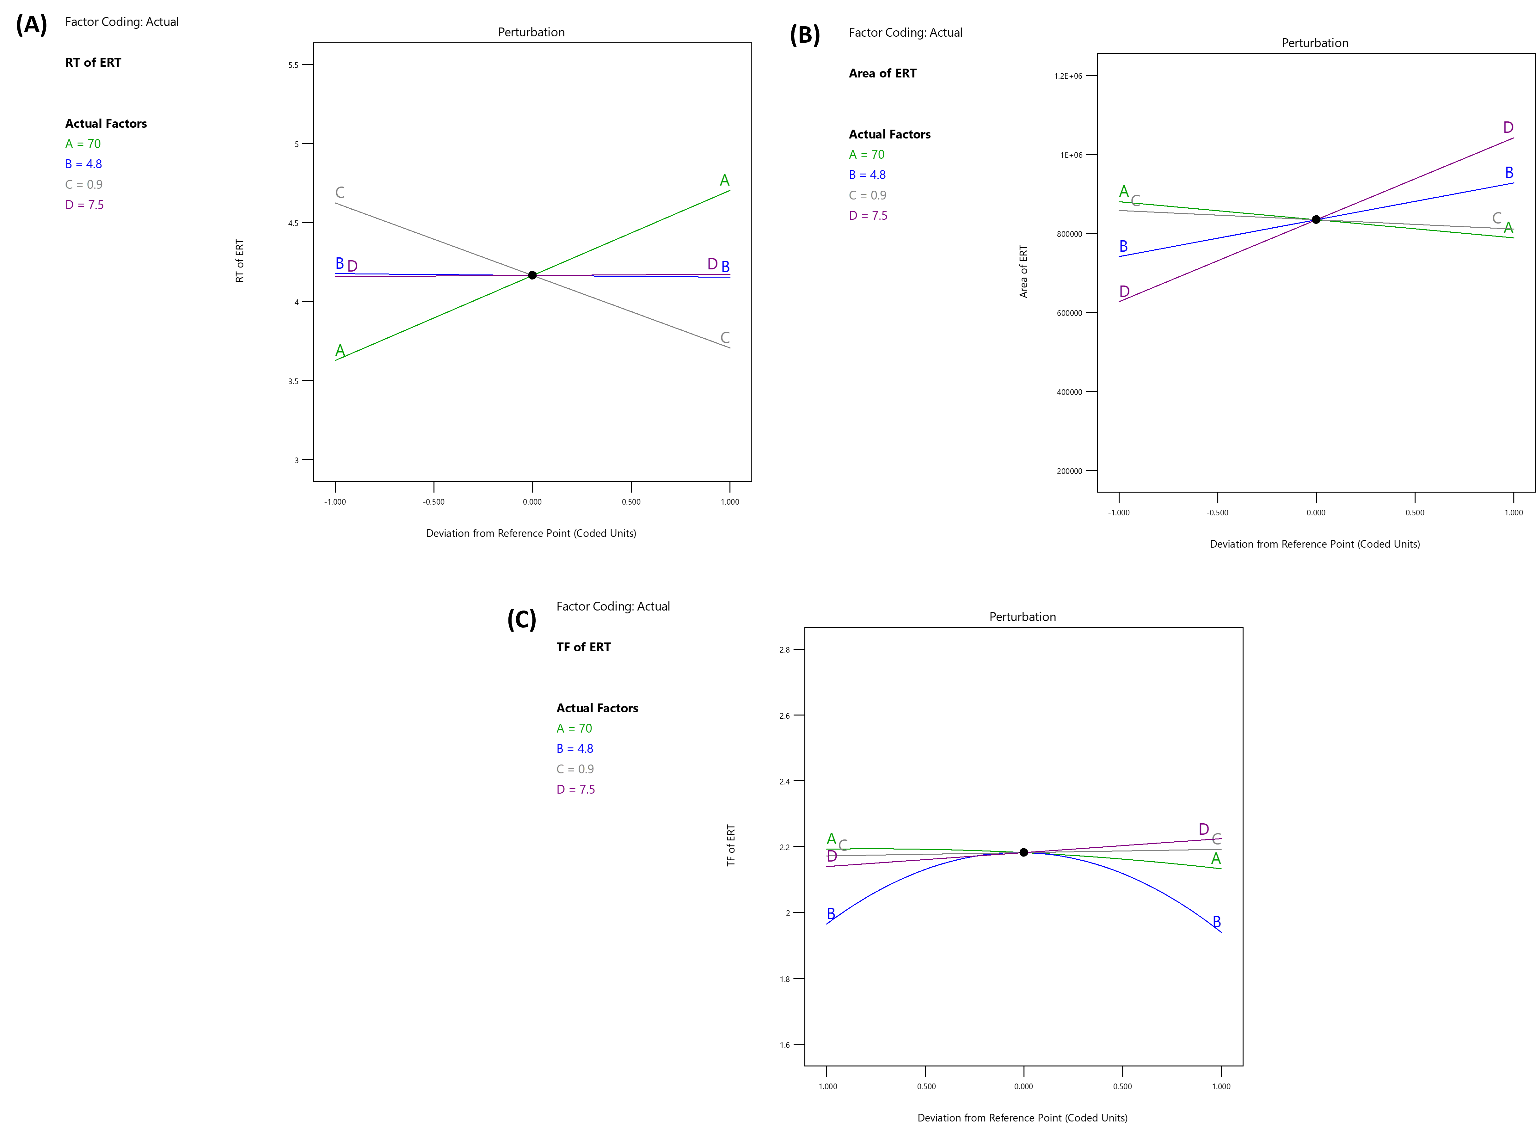
Fig. 3: A perturbation diagram that illustrates how independent variables interact (3A) on the retention time of ERT, (3B) on the peak area of ERT, (3C) on the tailing factor of ERT
Desirability
The desirability is important to finalize the HPLC chromatographic parameters. The reported desirability of the analytical method for different studies were 0.995 [19] and 0.981 [40]. The previous analysis produced an optimized HPLC method with a desirability value of 0.992. The final method suggested an injection volume of 8 µl, a buffer pH of 3.8, and a buffer ratio of 80%. Six repetitions of the suggested method were run to validate it, and the results for every response were compared to the values provided by the program. This comparison showed that the replies' percentage relative inaccuracy stayed below 10%. The recommended technique was then subjected to further validation in compliance with ICH Q2 (R1) requirements. The chromatogram that was obtained under ideal conditions is shown in fig. 4.
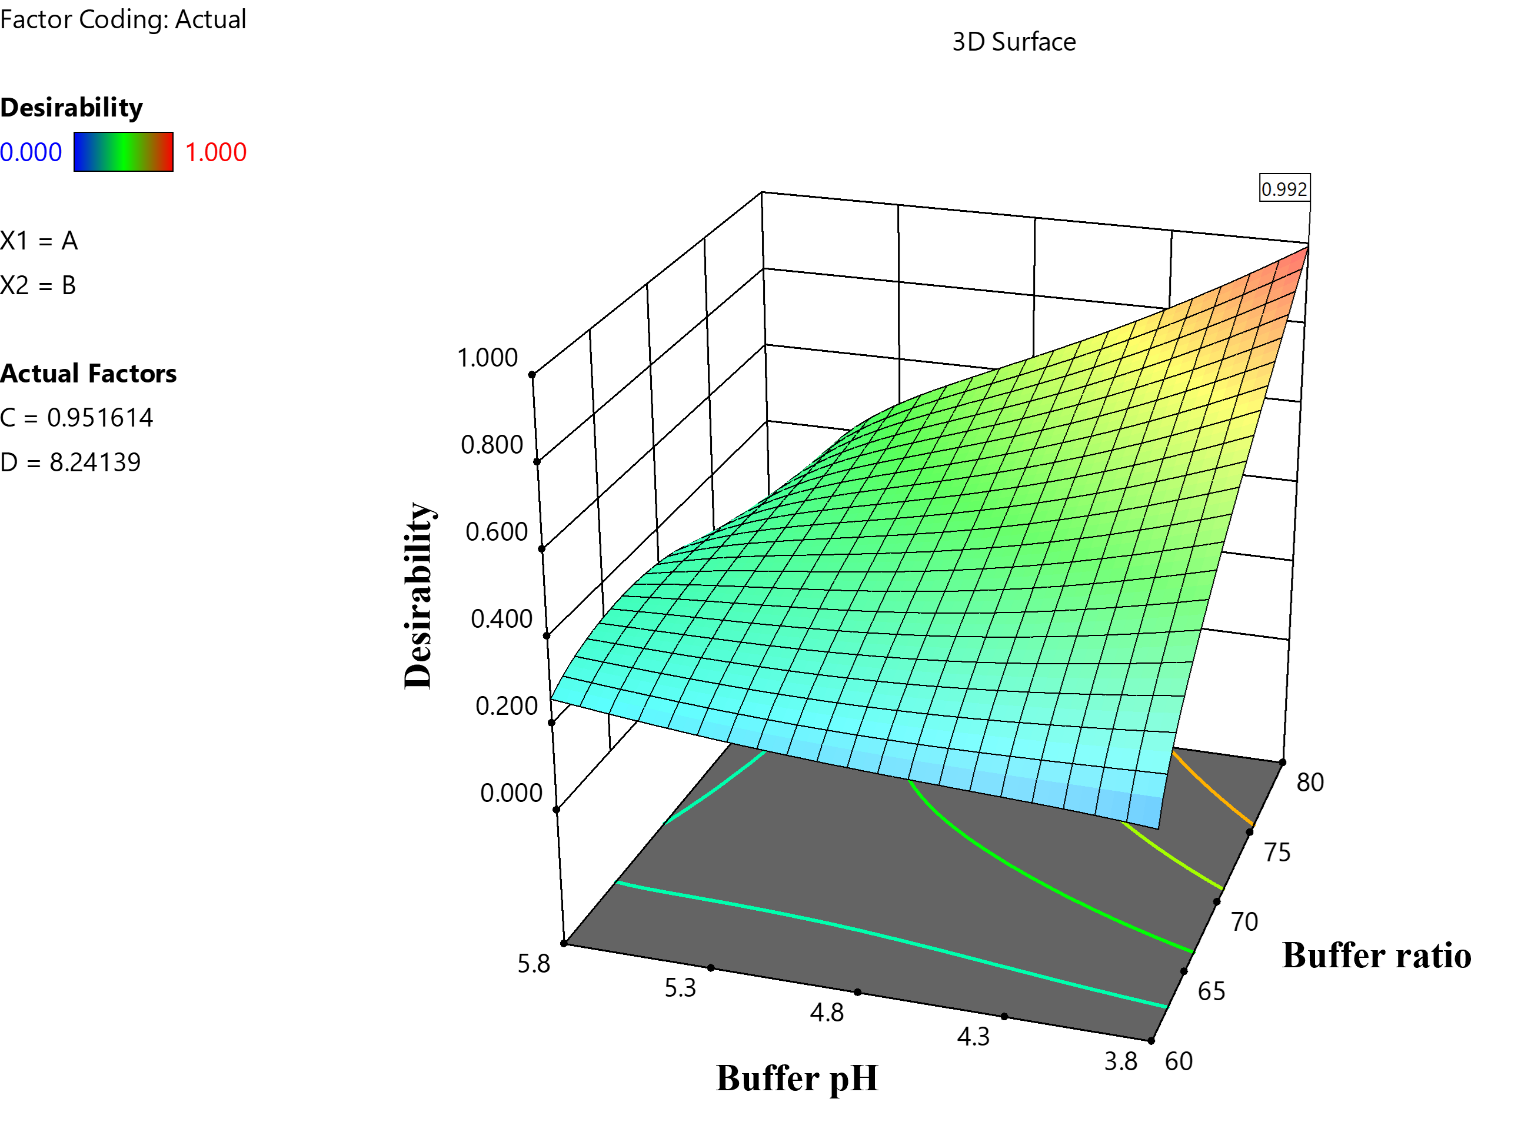
Fig. 4: Desirability plot from the ANOVA analysis

Fig. 5: Chromatogram got at optimized conditions (A) Chromatogram of blank MSNs, (C) Chromatogram of ERT-loaded MSNs
Method validation
The validation parameters in including RT, TF, TP were calculated to check the system suitability (table 3). The HPLC method was validated as per the ICH Q2 (R1) guidelines. The reported literature for different studies reveals that the developed method for the quantification ERT form the MSNs met the acceptance criteria [41]. ERT detection using an enhanced HPLC approach was created to assess system appropriateness and guarantee the method dependability for regular analysis. Important chromatographic characteristics were evaluated, such as TP, RT, and TF. A strong and effective separation was shown by the fact that all measured values come under the acceptance requirements. Accurate quantification was ensured by the TF was<1.5, and TP was>2000, which indicating strong separation capability and great column efficiency [42]. The linearity of the developed HPLC method was performed for the ERT in the concentration range of 12-100ng/ml. The R2 value for ERT determined from the linearity curve was 0.999, respectively and indicating the strong correlation between the concentration of response. The linearity equation for the ERT was y= 6742.5x-27463. The calibration curve depicted in fig. S1. The previously performed studies for the analytical methods confirming accuracy and reliability. The R2 value of linearity should be>0.99. The reported value of our analytical method adheres to the required standards and suitable for the quantification of ERT from the MSNs [43]. The LOD and LOQ were determined via Equation 1 and Equation 2. The LOD and LOQ of analytical method doe the quantification of ERT were found to be 2.71 ng/ml and 6.25 ng/ml, respectively. The accuracy of the established method, 3 separate evaluations were carried out: 80%, 100%, and 120%. The reported accuracy studies showed the acceptance range was (90-110%) [20]. The percentage of ERT recovery was determined between 99% to 101%, which is an acceptable range as per ICH guidelines. The method that was developed was exact and reliable. The intraday and inter-day precision of the established HPLC analytical technique for the ERT was evaluated. Previously performed studies of the analytical method showed the %CD should be<2% for inter-day and intra-day [44]. The % CV for developed analytical method for the intraday and inter-day was less than 2%. For the evaluation of robustness for the developed analytical method minor changes to the buffer's pH, wavelength, injection volume, flow rate, and temperature. As per the reported methods and studies the peak paraments such as TP, peak area, RT, and TF should not show any significant changes [45]. The developed analytical method was robust and did not show any significant difference with minor modification in the method table S1.
Table 3: Validation data of the optimized analytical method for the ERT
| RT | 4.957±0.002 |
| TP | 2990.487±1.010 |
| TF | 1.428±0.008 |
| Linearity range (ng/ml) | 12-500 |
| HETP | 50.159±0.016 |
| TF10% | 1.343±0.005 |
| R2 | 0.9991 |
| Linearity equation | Y=6742.5x-27463 |
| LOD (ng/ml) | 2.71 |
| LOQ (ng/ml) | 6.25 |
| Accuracy (% Recovery) | |
| 80% | 99.981±1.35 |
| 100% | 99.931±1.02 |
| 120% | 100.374±1.28 |
| Precision (% CV) | |
| Repeatability | 0.180±0.25 |
| Inter-day | 0.420±0.62 |
Data represent as mean±SD n =3, RT: retention time, TP: theoretical plate, TF: tailing factor, HETP: Height Equivalent to a Theoretical Plate, ERT: Erastin, LOD: Limit of Detection, LOQ: Limit of Quantification

Fig. 6: Chromatogram of (A) 0.1N HCl, (B) 1N HCl, (C) 0.1N NaOH, (D) 1N NaOH, (E) H2O2, (F) photothermal, (G) Temperature 40℃, (H) Bench-top stability
Bench-top stability
For the evaluation of bench-top stability of the prepares ERT sample developed method used. The previously performed studies showed that the previously developed was stable and there was no significant difference between the Rt of test sample and standard solution. The recovery of the sample and %CV should within the acceptance criteria [46]. The recovery of the working solution was found to be 100–105% and the % CV was less than 2%.
Stress-induced degradation studies
In order to evaluate ERT's stability across a range of stress conditions, including those experienced during formulation development, a forced degradation study was carried out. As seen in fig. 6 and 7, ERT showed signs of sensitivity to specific stressors. In particular, it showed notable degradation in stress conditions. Degradation was more than 37% in a 0.1M HCl solution and over 61% in a 1M HCl solution. In environments that are acidic ERT may hydrolyze, particularly when it has functional groups that are highly susceptible to acid-catalyzed reactions. The amide or ester group, for instance, may be impacted. Degradation was significant at alkaline circumstances; in a 0.1M NaOH solution, it was over 49%, and in a 1M NaOH solution, it was over 79%. ERT can experience nucleophilic substitution, depending on its functional groups. Aldehydes and ketones are examples of groups that may react with nucleophiles that inhibit an alkaline environment. In addition, more than 67% deterioration was seen upon exposure to an H2O2 solution. ERT showed less degradation than acidic, alkaline, and H2O2 in other stress conditions. Degradation products may come through reactive oxygen species, damaging ERT unsaturated bonds or other areas of vulnerability as a result of oxidative stress. ERT showed more than 57% degradation in exposure to sunlight (UV) and at elevated temperature 47%. ERT stability and any issues encountered during formulation or storage can be clarified by appreciating the degradation mechanism. That knowledge can direct the development of stabilizing methods to stabilize ERT, such as the use of antioxidants or improvements to storage conditions.

Fig. 7: Column chart represented the stress-induced forced degradation study of erastin (ERT) showing the % degradation under each condition
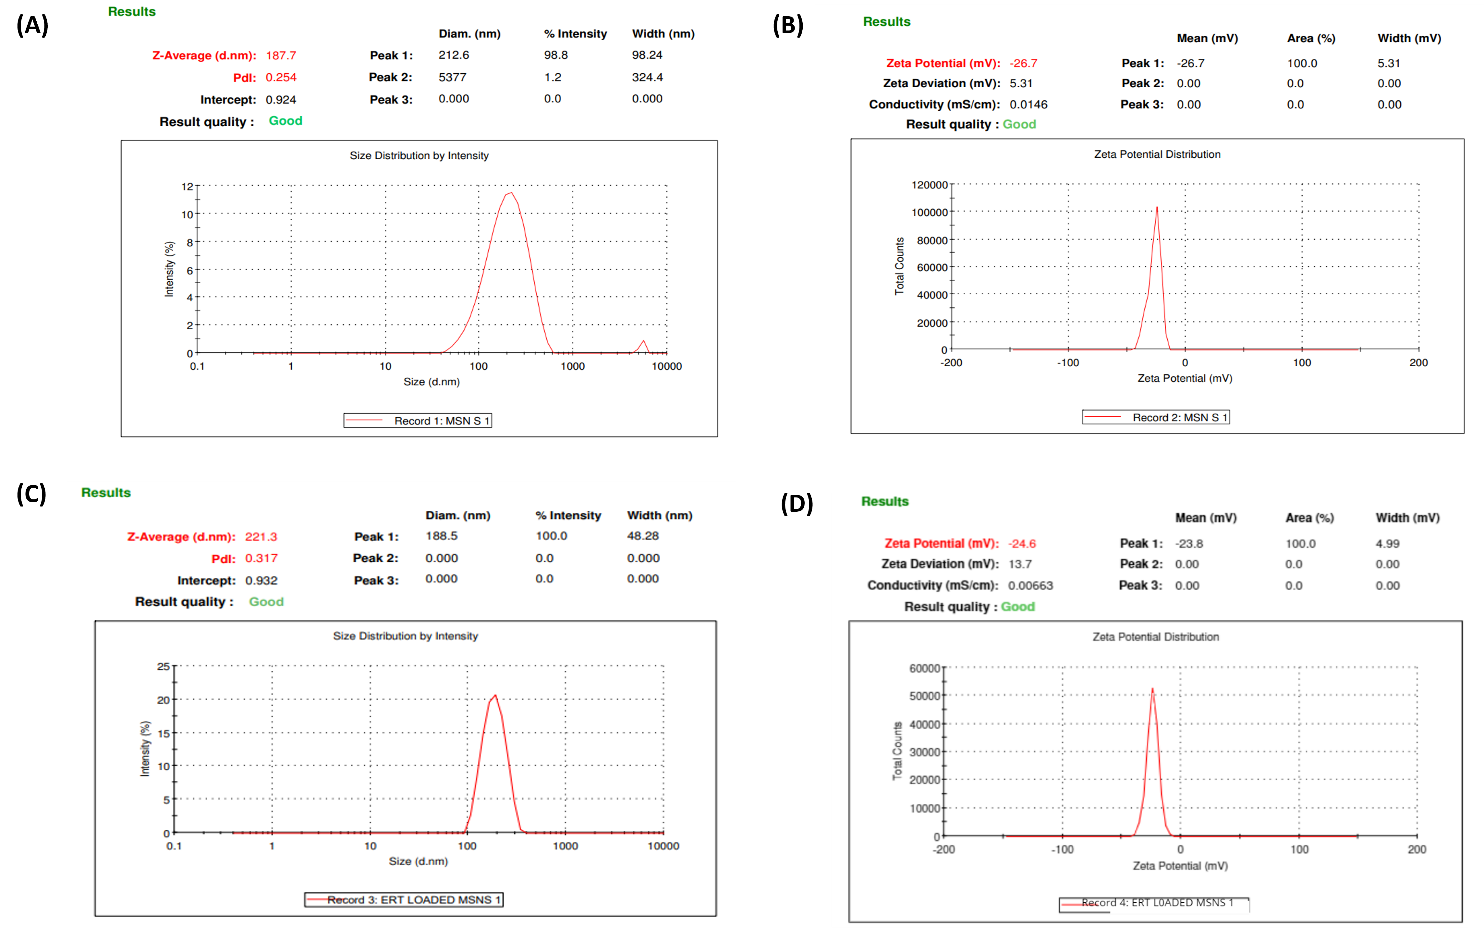
Fig. 8: Characterization of fabricated formulation: (A) Particle size of placebo MSNs, (B) Zeta potential of placebo MSNs, (C) Particle size of ERT@MSNs, (D) Zeta potential of ERT@MSNs
Application of the developed RP-HPLC analytical method
Evaluation of fabricated placebo MSNs and ERT@MSNs
The average particle sizes of ERT@MSNs and placebo MSNs were determined to be 221.3 nm and 187.7 nm, respectively. This indicates that the size of the particles increased significantly when the drug was loaded. This rise is in line with previous research, demonstrating that drug encapsulation usually causes particle size development because drug molecules deposit within the mesoporous structure. In line with previously reported MSN formulations, which normally view a polydispersity index (PDI) below 0.3 as acceptable for monodispersity and formulation stability, the PDI of 0.254 for placebo MSNs and 0.317 for ERT@MSNs demonstrates a narrow and uniform size distribution. The zeta potential values of –26.7 mV for placebo MSNs and –24.6 mV for ERT@MSNs demonstrate strong colloidal stability since particles with zeta potentials greater than ±20 mV generally resist aggregation because of electrostatic repulsion instead. These fig. agree with previous research on silica-based nanoparticles, where the existence of silanol groups on the particle surface often results in a surface charge of-20 to-30 mV. The slight reduction in zeta potential following drug loading might indicate that the drug was successfully adsorbed onto or inside the nanoparticles, concealing surface charge without sacrificing stability.
The specificity of the validated method
It is confirmed that the excipients do not interfere with the RT of ERT. The developed analytical method can quantify the ERT from the ERT-loaded MSNs. Fig. 5 displays the chromatogram of ERT-loaded and placebo MSNs.
% Entrapment efficiency and % drug loading
The previously synthesize drug-loaded MSNs was shown the % DL of drug was 5.29 [47]. Shoaib et al. Prepared the imatinib-loaded mesoporous nanoparticles and the reported loading efficiency was 73.52% [48]. The % EE for ERT in MSNs was 76.07±2.56%, and the % DL for ERT in MSNs was 14±1.87%, respectively. Comparing these findings to earlier research on MSNs, they are positive. For hydrophobic drugs encapsulated in MSNs, published %EE values typically fall between 60% and 80%, based on the drug's solubility, loading technique, and carrier surface characteristics. Our %EE falls nicely within this region, suggesting that ERT is efficiently encapsulated. In addition, compared to many prior formulations that show drug loading values between 8% and 12% for comparable drugs, the % DL in our research is rather high. Optimized synthesis parameters, such as the MSNs' surface area and pore shape, may have contributed to this increased loading by improving drug adsorption. Overall, our formulation outperforms or performs similarly to current methods, indicating its potential for improved ERT therapeutic delivery.
Scanning electron microscopy
The studies on drug-loaded MSNs reported that the surface of MSNs should be rough and particle size should be between 200-250 nm. The more pore may give the high drug loading efficiency [49]. The ERT@MSNs SEM envision (fig. 9) showed spherical and aggregated particles with an average size of 224.6 nm, clearly showing the formulation shape and individual particle nanostructure. Our formulation falls within a somewhat higher range than previously reported MSNs, which usually have a size range between 100 and 200 nm, depending on synthesis situations. The exact TEOS and CTAB concentrations utilized during synthesis, which are known to have a significant effect on particle shape and aggregation behavior, may be the cause of this size increase. According to published studies, increased CTAB concentrations could promote particle aggregation while generating more distinct spherical shapes. In a similar vein, higher TEOS levels may lead to bigger particle diameters through enhancing silica shell thickness. Our data demonstrate a regulated balance between size and structure, indicating effective ERT entrapment while maintaining the morphological integrity of MSNs. They also concur with these findings. The tuning of precursor concentration illustrates the tunability of MSNs properties and provides an adapted approach to specific drug delivery applications.

Fig. 9: SEM result of loaded ERT loaded MSNs showing average particle size
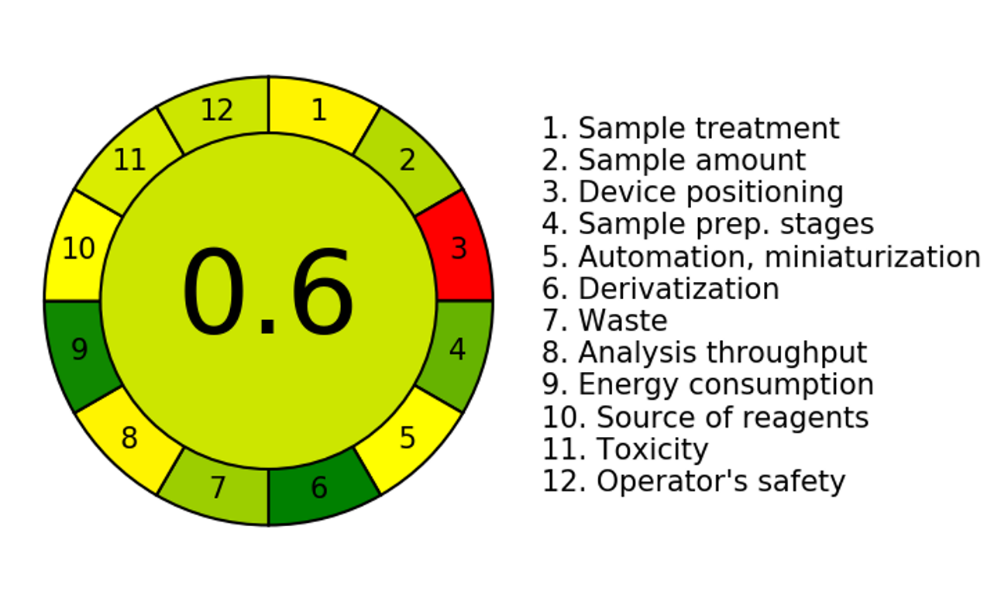
Fig. 10: Pictorial representation for greenness profile assessment of RP-HPLC method
Greenness evaluation of developed HPLC method
GAC aims to assess how analytical techniques affect the environment, operator safety, and health, mainly when those techniques entail using organic solvents in the mobile phase. The excitement around GAC has grown significantly in recent years, making it possible to use various green evaluation tools to score the greenness of different analytical techniques. We produced an image (fig. 9) that shows the approach's environmental friendliness Using the AGREE software. The reported studies for the evaluation of greenness of the developed HPLC method showed that the AGREE score of developed method was 0.67 [50]. The established HPLC method for estimating ERT was environmentally friendly, with an overall AGREE score of 0.6.
CONCLUSION
The establishment of an environmentally friendly HPLC method for ERT quantification was successful. The method of analysis was optimized using the three-level BBD. The DoE analysis revealed a desirability of 0.992. The optimized HPLC method was validated as per ICH Q2 (R1) recommendation, and all the parameters met the acceptance criteria. As of yet, no HPLC method has been established that optimizes the utilization of the DoE tool to determine ERT from MSNs. No interference was seen between the MSN excipients and the RT of ERT. This method might be used to calculate the ERT for the developed MSNs. There is a lot of promise for the developed HPLC approach outside of this study. It may be utilized in pharmacokinetics research to track the concentration of ERT in biological samples, offering significant data on how it is absorbed, distributed, metabolized, and released. The quality control and batch-to-batch consistency of ERT-loaded MSNs in large-scale manufacturing environments can also be facilitated by scaling up this technique for industrial applications. It is the perfect instrument for verifying the quality of pharmaceutical formulations containing ERT because of its precision and dependability.
ACKNOWLEDGMENT
The authors are thankful to the Science and Engineering Research Board (SERB), Government of India, New Delhi, for providing the funding in the form of a Start-Up Research Grant (SRG) (SRG/2022/001870) for the research project to Dr. Namdev Dhas. The authors thank the Indian Council of Medical Research (ICMR) for the funding provided under the ICMR-SRF fellowship program (File no. 3/2/2/16/2022-NCD-III). The authors also thank Manipal Academy of Higher Education, Karnataka, for providing the facilities. The authors are thankful for Biorender.com, a figure-making tool.
FUNDING
The work is funded by the Science and Engineering Research Board (SERB), Government of India, New Delhi, for providing the funding in the form of Start-Up Research Grant (SRG) (SRG/2022/001870).
AUTHORS CONTRIBUTIONS
All authors contributed to the study conception and design. Ashutosh Gupta conducted the experimental work, data analysis, and paper drafting. Rachana S P was involved in the experimental work on HPLC method optimization, DoE analysis, and data interpretation. Namdev Dhas and Sudheer Moorkoth supervised the experimental work, data analysis, resources, and paper review. All authors have contributed significantly to the research in the manuscript, approved its claims, and agreed to be an author.
CONFLICT OF INTERESTS
The authors state that the manuscript does not include any conflicts of interest.
REFERENCES
Rong L, Li N, Zhang Z. Emerging therapies for glioblastoma: current state and future directions. J Exp Clin Cancer Res. 2022 Apr 15;41(1):142. doi: 10.1186/s13046-022-02349-7, PMID 35428347.
Weller M, Wick W, Aldape K, Brada M, Berger M, Pfister SM. Glioma. Nat Rev Dis Primers. 2015 Jul 16;1(1):15017. doi: 10.1038/nrdp.2015.17, PMID 27188790.
Zhao Y, Li Y, Zhang R, Wang F, Wang T, Jiao Y. The role of erastin in ferroptosis and its prospects in cancer therapy. Onco Targets Ther. 2020 Jun 11;13:5429-41. doi: 10.2147/OTT.S254995, PMID 32606760.
Yao Y, Ji P, Chen H, Ge J, Xu Y, Wang P. Ferroptosis-based drug delivery system as a new therapeutic opportunity for brain tumors. Front Oncol. 2023 Feb 23;13:1084289. doi: 10.3389/fonc.2023.1084289, PMID 36910646.
Sato M, Kusumi R, Hamashima S, Kobayashi S, Sasaki S, Komiyama Y. The ferroptosis inducer erastin irreversibly inhibits system xc- and synergizes with cisplatin to increase cisplatin’s cytotoxicity in cancer cells. Sci Rep. 2018 Jan 17;8(1):968. doi: 10.1038/s41598-018-19213-4, PMID 29343855.
Dixon SJ, Lemberg KM, Lamprecht MR, Skouta R, Zaitsev EM, Gleason CE. Ferroptosis: an iron dependent form of nonapoptotic cell death. Cell. 2012 May 25;149(5):1060-72. doi: 10.1016/j.cell.2012.03.042, PMID 22632970.
Barve AR, Kapileshwari GR, D Cruz CE, Kumar L, Bhide PJ, Mahajan AA. Solubility enhancement of ebastine by formulating microemulsion using D-optimal mixture design: optimization and characterization. Assay Drug Dev Technol. 2022;20(6):258-73. doi: 10.1089/adt.2022.049, PMID 36070596.
Beg S, Malik AK, Ansari MJ, Malik AA, Ali AM, Theyab A. Systematic development of solid lipid nanoparticles of abiraterone acetate with improved oral bioavailability and anticancer activity for prostate carcinoma treatment. ACS Omega. 2022 May 24;7(20):16968-79. doi: 10.1021/acsomega.1c07254, PMID 35647451.
Gupta A, Shetty S, Mutalik S, Chandrashekar HR, KN, Mathew EM. Treatment of H. pylori infection and gastric ulcer: need for novel pharmaceutical formulation. Heliyon. 2023;9(10):e20406. doi: 10.1016/j.heliyon.2023.e20406, PMID 37810864.
Gupta A, Nishchaya K, Saha M, Naik GA, Yadav S, Srivastava S. Recent advancements in nanoconstructs for the theranostics applications for triple-negative breast cancer. J Drug Deliv Sci Technol. 2024 Jan 25;93:105401. doi: 10.1016/j.jddst.2024.105401.
Bharti C, Nagaich U, Pal AK, Gulati N. Mesoporous silica nanoparticles in target drug delivery system: a review. Int J Pharm Investig. 2015;5(3):124-33. doi: 10.4103/2230-973X.160844, PMID 26258053.
Narayan R, Nayak UY, Raichur AM, Garg S. Mesoporous silica nanoparticles: a comprehensive review on synthesis and recent advances. Pharmaceutics. 2018 Aug 6;10(3):118. doi: 10.3390/pharmaceutics10030118, PMID 30082647.
Salwa KL, Kumar L. Quality-by-design driven analytical method (AQbD) development and validation of HPLC–UV technique to quantify rivastigmine hydrogen tartrate in lipidic nanocarriers: forced degradation and assessment of drug content and in vitro release studies. Microchem J. 2023 Oct 1;193:108944. doi: 10.1016/j.microc.2023.108944.
Zhang Y, Tan H, Daniels JD, Zandkarimi F, Liu H, Brown LM. Imidazole ketone erastin induces ferroptosis and slows tumor growth in a mouse lymphoma model. Cell Chem Biol. 2019 May 16;26(5):623-633.e9. doi: 10.1016/j.chembiol.2019.01.008, PMID 30799221.
Sun L, Jin HY, Tian RT, Wang MJ, Liu LN, Ye LP. A simple method for HPLC retention time prediction: linear calibration using two reference substances. Chin Med. 2017 Jun 19;12(1):16. doi: 10.1186/s13020-017-0137-x, PMID 28642805.
Alzoman NZ. A validated stability-indicating and stereoselective HPLC method for the determination of lenalidomide enantiomers in bulk form and capsules. J Chromatogr Sci. 2016 May;54(5):730-5. doi: 10.1093/chromsci/bmv247, PMID 26850732.
Saravanan G, Rao BM, Ravikumar M, Suryanarayana MV, Someswararao N, Acharyulu PV. Development of an HPLC assay method for lenalidomide. Chroma. 2007 Aug 1;66(3-4):287-90. doi: 10.1365/s10337-007-0290-y.
Sarısaltık Yasın D, Arslanturk Bingul A, Karakucuk A, Teksin ZS. Development and validation of an HPLC method using an experimental design for analysis of amlodipine besylate and enalapril maleate in a fixed dose combination. Turk J Pharm Sci. 2021 Jun 18;18(3):306-18. doi: 10.4274/tjps.galenos.2020.89725, PMID 34157820.
Gupta A, Navti PD, Mutalik S, Saha M, Moorkoth S. DoE guided development of an HPLC method for evaluation of amoxicillin and metronidazole co-loaded mucoadhesive GRDDS formulation for H. pylori eradication. Chromatographia. 2023 Dec 1;86(11-12):729-42. doi: 10.1007/s10337-023-04290-z.
Mutalik SP, Mullick P, Pandey A, Kulkarni SS, Mutalik S. Box–behnken design aided optimization and validation of developed reverse phase HPLC analytical method for simultaneous quantification of dolutegravir sodium and lamivudine co-loaded in nano-liposomes. J Sep Sci. 2021 Aug;44(15):2917-31. doi: 10.1002/jssc.202100152, PMID 34076952.
Naik S, Mullick P, Mutalik SP, Hegde AR, Lewis SA, Bhat K. Full factorial design for development and validation of a stability indicating RP-HPLC method for the estimation of timolol maleate in surfactant based elastic nano-vesicular systems. J Chromatogr Sci. 2022 Jul 12;60(6):584-94. doi: 10.1093/chromsci/bmab101, PMID 34435614.
Gupta A, Kossambe RV, Moorkoth S. Box-behnken design assisted eco-friendly RP-HPLC-PDA method for the quantification of paclitaxel: application to evaluate the solubility of paclitaxel cyclodextrin complex. Int J Appl Pharm. 2024 Nov 7;16(6):305-15. doi: 10.22159/ijap.2024v16i6.51690.
Lantsova A, Sanarova E, Dmitrieva M, Orlova O, Oborotova N, Glembotskaya G. Validation of the qualitative determination of HPLC metods for sucrose and peg-2000-dspe in a liposomal form of the photosensitizer lipophthalocyan. Int J Appl Pharm. 2020 Nov 7;12(6):241-4. doi: 10.22159/ijap.2020v12i6.38374.
Hamid MH, Elsaman T. A stability indicating RP-HPLC-UV method for determination and chemical hydrolysis study of a novel naproxen prodrug. J Chem. 2017 Oct 25;2017:1-10. doi: 10.1155/2017/5285671.
Zuromska Witek B, Zmudzki P, Szlosarczyk M, Maslanka A, Hubicka U. Development and validation of stability indicating HPLC methods for the estimation of lomefloxacin and Balofloxacin oxidation process under ACVA, H2O2, or KMnO4 treatment. Kinetic evaluation and identification of degradation products by mass spectrometry. Molecules. 2020 Nov 11;25(22):5251. doi: 10.3390/molecules25225251, PMID 33187198.
Goyal PK, Jaimini M. Development and validation of stability indicating RP-HPLC method for quantitative estimation of metoprolol succinate and azelnidipine from synthetic mixture. J Pharm Neg Results. 2023 Feb 6:772-9. doi: 10.47750/pnr.2023.14.03.101.
Emanuelli J, Eva Scherman Schapoval E. Stability indicating HPLC method for estimation of omarigliptin in tablets oxidative and photolytic kinetics and degradation products formed under oxidative conditions. Microchem J. 2020 Sep 1;157:105084. doi: 10.1016/j.microc.2020.105084.
Pathan MA, Kshirsagar A. Stability indicating HPLC method development and validation for simultaneous estimation of metformin and empagliflozin in bulk and pharmaceutical dosage form. Res J Pharm Technol. 2022 Feb 26;15(2):830-6. doi: 10.52711/0974-360X.2022.00138.
Zaman B, Hassan W, Khan A, Mushtaq A, Ali N, Bilal M. Forced degradation studies and development and validation of HPLC-UV method for the analysis of velpatasvir copovidone solid dispersion. Antibiotics (Basel). 2022 Jul 5;11(7):897. doi: 10.3390/antibiotics11070897, PMID 35884151.
Peraman R, Lalitha KV, Raja NM, Routhu HB. Identification of degradation products and a stability indicating RP-HPLC method for the determination of flupirtine maleate in pharmaceutical dosage forms. Sci Pharm. 2014;82(2):281-93. doi: 10.3797/scipharm.1310-01, PMID 24959399.
Saha M, Gupta A, Shetty S, Mutalik S, Nandakumar K, Raghu Chandrashekar H. DoE-aided optimization of RP-HPLC method for simultaneous estimation of amoxicillin and tinidazole loaded mucoadhesive GRDDS formulation for the treatment of H. pylori. Chromatographia. 2024 Sep 1;87(9):533-48. doi: 10.1007/s10337-024-04346-8.
Qiao ZA, Zhang L, Guo M, Liu Y, Huo Q. Synthesis of mesoporous silica nanoparticles via controlled hydrolysis and condensation of silicon alkoxide. Chem Mater. 2009 Aug 25;21(16):3823-9. doi: 10.1021/cm901335k.
Ashour MM, Mabrouk M, Soliman IE, Beherei HH, Tohamy KM. Mesoporous silica nanoparticles prepared by different methods for biomedical applications: comparative study. IET Nanobiotechnol. 2021 Feb 22;15(3):291-300. doi: 10.1049/nbt2.12023, PMID 34694665.
Farazin A, Mohammadimehr M, Naeimi H, Bargozini F. Design fabrication and evaluation of green mesoporous hollow magnetic spheres with antibacterial activity. Mater Sci Eng B. 2024 Jan 1;299:116973. doi: 10.1016/j.mseb.2023.116973.
Shafiei MR, Nezafati N, Karbasi S, Kharazi AZ. Rifampin-loaded mesoporous silica nanoparticles improved physical and mechanical properties and biological response of acrylic bone cement. J Med Signals Sens. 2025 Mar 13;15:9. doi: 10.4103/jmss.jmss_52_24, PMID 40191687.
MS S, GT, S AM, A NA, MK, VR. Preparation and evaluation of mesoporous silica nanoparticles loaded quercetin against bacterial infections in Oreochromis niloticus. Aquacult Rep. 2021 Nov;21:100808. doi: 10.1016/j.aqrep.2021.100808.
Sharma M, Mittapelly N, Banala VT, Urandur S, Gautam S, Marwaha D. Amalgamated microneedle array bearing ribociclib loaded transfersomes eradicates breast cancer via CD44 targeting. Biomacromolecules. 2022 Mar 14;23(3):661-75. doi: 10.1021/acs.biomac.1c01076, PMID 34978424.
Jagadish Shetty S, Shilpa MP, Shirish Bhat S, Pavithra KS, Moorkoth S, Gupta A. Surface functionalized multi-wall carbon nanotubes for degradation of organic dyes. Mater Chem Phys. 2024 Jan 1;311:128566. doi: 10.1016/j.matchemphys.2023.128566.
Pena Pereira F, Wojnowski W, Tobiszewski M. AGREE-analytical GREEnness metric approach and software. Anal Chem. 2020;92(14):10076-82. doi: 10.1021/acs.analchem.0c01887, PMID 32538619.
Saha M, Gupta A, Shetty S, Mutalik S, Nandakumar K, Raghu Chandrashekar H. DoE-aided optimization of RP-HPLC method for simultaneous estimation of amoxicillin and tinidazole loaded mucoadhesive GRDDS formulation for the treatment of H. pylori. Chromatographia. 2024 Sep 1;87(9):533-48. doi: 10.1007/s10337-024-04346-8.
Trivedi R, Suhagia B. Development and validation of deferasirox related substance method in solid dosage forms using HPLC. Int J Appl Pharm. 2025 Mar 7;17(2):281-92. doi: 10.22159/ijap.2025v17i2.53465.
Mullick P, Mutalik SP, Hegde AR, Pandey A, Jagadish PC, Kini SG. Simultaneous estimation of apremilast and betamethasone dipropionate in microsponge-based topical formulation using a stability-indicating RP-HPLC method: a quality-by-design approach. J Chromatogr Sci. 2021 Nov 1;59(10):928-40. doi: 10.1093/chromsci/bmab016, PMID 33618363.
Sharma S, Gupta P, Gupta A, Kawish SM, Iqbal Z, Vohora D. Rapid analytical method development and validation of RP-HPLC method for the simultaneous estimation of exemestane and genistein with specific application in lipid-based nanoformulations. ACS Omega. 2023 Jul 5;8(28):25101-13. doi: 10.1021/acsomega.3c01791, PMID 37483215.
Kumar G, Mullick P, Nandakumar K, Mutalik S, Chamallamudi MR. Box–behnken design aided validation and optimization of a stability indicating reverse phase-HPLC method for the estimation of tamoxifen citrate in lipidic nano-vesicles. J Chromatogr Sci. 2023 Oct 1;61(9):827-37. doi: 10.1093/chromsci/bmad059, PMID 37554069.
Gupta A, Rachana SP, Moorkoth S, Dhas N. Quality by design-based ecofriendly HPLC analytical method for simultaneous quantification of erastin and lenalidomide in mesoporous silica nanoparticles. Sci Rep. 2025 Mar 14;15(1):8873. doi: 10.1038/s41598-025-93331-8, PMID 40087405.
Velagacherla V, Nayak Y, Bhaskar KV, Nayak UY. A stability indicating method development and validation of a rapid and sensitive RP-HPLC method for nintedanib and its application in quantification of nanostructured lipid carriers. F1000Res. 2023;12:1389. doi: 10.12688/f1000research.138786.2, PMID 38948504.
Liu M, Fu M, Yang X, Jia G, Shi X, Ji J. Paclitaxel and quercetin co-loaded functional mesoporous silica nanoparticles overcoming multidrug resistance in breast cancer. Colloids Surf B Biointerfaces. 2020 Dec 1;196:111284. doi: 10.1016/j.colsurfb.2020.111284, PMID 32771817.
Shoaib M, Saeed A, Rahman MS, Naseer MM. Mesoporous nano-bioglass designed for the release of imatinib and in vitro inhibitory effects on cancer cells. Mater Sci Eng C Mater Biol Appl. 2017;77:725-30. doi: 10.1016/j.msec.2017.03.288, PMID 28532085.
Jia L, Shen J, Li Z, Zhang D, Zhang Q, Liu G. In vitro and in vivo evaluation of paclitaxel-loaded mesoporous silica nanoparticles with three pore sizes. Int J Pharm. 2013 Mar 10;445(1-2):12-9. doi: 10.1016/j.ijpharm.2013.01.058, PMID 23384728.
Marques SM, Salwa KL, Kumar L. Quality-by-design-based development of an eco-friendly HPLC method for the estimation of nisoldipine in nanoformulations: forced degradation studies and in vitro release studies. Sustain Chem Pharm. 2023 Dec 1;36:101254. doi: 10.1016/j.scp.2023.101254.