
Int J App Pharm, Vol 17, Issue 4, 2025, 231-240Original Article
QUALITY BY DESIGN DRIVEN FORMULATION DEVELOPMENT AND OPTIMIZATION OF POOR SOLUBLE ANTI-HYPERTENSIVE DRUG FOR IMPROVED SOLUBILITY
DEEPTI AGGARWAL1*, RAM DAYAL GUPTA2, VIJAY SHARMA3
1,3Faculty of Pharmacy, IFTM University, Moradabad, India. 2Department of Pharmacy, Sunderdeep Pharmacy College, Ghaziabad, India
*Corresponding author: Deepti Aggarwal; *Email: deeptia95@gmail.com
Received: 31 Jan 2025, Revised and Accepted: 07 May 2025
ABSTRACT
Objective: The objective of this study was to develop a polymeric composite of the poorly soluble antidepressant drug felodipine with help of PVP K-30 and PEG 6000, using a Quality by Design (QbD) approach to enhance its solubility and, consequently, its bioavailability.
Methods: In this work, the quality target product profile (QTTP) was defined and Critical Quality Attributes (CQAs) were identified. Additionally, risk assessment analyses were carried out using the Ishikawa fishbone diagram to identify the Critical Material Attributes (CMAs) and/or Critical Process Parameters (CPPs) associated with the development of polymeric composite that could influence the Critical Quality Attributes (CQAs) of the drug product. The solubility of felodipine hydrochloride was improved by creating various polymeric composites with various concentrations of Poly Vinyl Pyrrolidone K30 (PVP-K 30) and Poly Ethylene Glycol 600 (PEG 600) by solvent evaporation method as Critical material attribute (CMA) as identified by risk assessment study and the and CQAs viz drug solubility, drug content and drug release. These composites were designed using a 32 Face Central composite Design (FCCD) with a face-centered approach implemented in Design Expert software.
Results: After defining QTTP and CQA, risk assessment analysis was successfully used to identify CMA as well as CPPs. A total of thirteen PVP-PEG polymeric composites were developed and evaluated for FTIR spectra, Differential Scanning Colorimetry (DSC), X-Ray diffraction (XRD), and Scanning electron Microscopy (SEM). Data optimization was performed using response surface methodology, including contour and overlay plots. Solubility, drug content, and drug release of the optimized batch were found to be 21.55 mg/ml, 100%, and 78.314%, respectively. Three Validation Check batches (VC1-VC3) were developed and validated. Percent error for solubility ranges between-0.0019 to 0.0061, drug content ranges between 0.0005 to 0.0031 and solubility ranges between 0.0005 to 0.0011 that were very close to the predicted value, hence verifying the optimized data. Thus, by carefully using the QbD technique, the solubility of felodipine was enhanced by the effective development of a PVP-PEG polymeric composite.
Conclusion: The QbD approach was to be an effective tool to develop an optimized polymeric composite of PVP 30K and PEG 6000 of felodipine with improved solubility without exhaustive research.
Keywords: Central composite design, Characterization, Felodipine, PEG 6000, polymeric composite, PVP-K30
© 2025 The Authors. Published by Innovare Academic Sciences Pvt Ltd. This is an open access article under the CC BY license (https://creativecommons.org/licenses/by/4.0/)
DOI: https://dx.doi.org/10.22159/ijap.2025v17i4.53836 Journal homepage: https://innovareacademics.in/journals/index.php/ijap
INTRODUCTION
Improving the solubility of drugs and oral bioavailability is one of the critical challenges for drug development research, especially concerning oral drug delivery systems. Multiple strategies have been devised that can be classified broadly into physical and chemical modification of drug substances and alternative approaches. Physical modification techniques include the following: micronization, nanosuspension, polymorphism, amorphous forms, and co-crystallization along with dispersion within carriers like cryogenic processes, solid dispersions, eutectic mixtures as well as solid solutions [1].
A scientifically validated, Quality by Design (QbD) strategy helps to understand and manage the relationship between Critical Quality Attributes (CQAs) and Critical Process Parameters (CPPs), which are important for the Quality Target Product Profile (QTPP) [2]. CQAs, which include solubility, drug loading, and drug release of the developed polymeric composite, are caused by critical material parameters (CMPs) and critical process parameters (CPPs), such as the physicochemical properties of the felodipine, the type and concentration of the polymer used, stirring speed, temperature, and preparation method [3]. However, a single design is insufficient to choose the appropriate CPPs and CMAs because various CPPs and CMAs are engaged in the preparation process. The face-centered central composite design (CCD) was used to select CQAs, or solubility, drug loading, and drug release, as dependent variables [4]. In order to provide a comprehensive understanding of formulation development, the research activity detailed in the current studies includes the systematic development of polymeric composites using the principles of QbD.
FH is a calcium channel blocker frequently used in the treatment of hypertension and angina pectoris. Felodipine (BCS Class II) has low water solubility that limits its dissolution and hence lowers its bioavailability when administered orally. In addition, it undergoes significant first-pass metabolism that lowers its bioavailability to about 15%. Improving the solubility of FH is essential for enhancing its dissolution rate and bioavailability, thereby ensuring that an adequate concentration of the drug enters systemic circulation. Techniques like solid dispersion can provide improvement in solubility and, hence, it is an important element that ensures optimum therapeutic effect with reliable and effective treatments from the administration of FH [5]. Hence aim of the present work is to improve the solubility of poor soluble felodipine by solvent evaporation technique using PVP K30 and PEG 6000 employing the quality-by-design approach. PVP K30 was selected as it has the ability to improve solubility through hydrophilic interaction while PEG 6000 was used due to its ability to reduce crystallinity and improve wettability.
MATERIALS AND METHODS
Felodipine hydrochloride (FH) was obtained from Geneka Healthcare, Sidcul, Haridwar. PVP K30 (Merck, Germany) and PEG 6000 (SD Fine, India) K30 were purchased. Other chemicals used in the study were of analytical grade. The present study was done by using double-distilled.
Defining the QTPP and identification of CQAs
The Quality Target Product Profile (QTPP) was developed following the Quality by Design (QbD)-based approach for drug product development to construct the PVP-PEG polymeric composite with improved patient compliance and to obtain the desired therapeutic response. Critical quality attributes (CQA), including solubility, drug loading, and amount of drug release (table 1), were determined to achieve QTPP (table I). The created polymeric composite displayed significant drug absorption all along the GI tract through the solubility, drug loading, and amount of drug release.
Table 1: QTTP for developing solid dispersion polymeric composite
| QTTP components | Target | Justification(s) |
| Dosage form type | Powder | Provide flexibility to develop various dosage forms |
| Drug delivery type | Drug delivery type | To attain the desired therapeutic effect by immediate release of drug. |
| Route of administration | Oral | Improved patient adherence. |
| Packaging | Novel drug delivery system | Solid dispersion can be used to develop novel drug delivery system(s). |
| Drug product quality attributes | Appearance, Solubility, Drug content, Drug release | Quality parameters. |
Preparation of drug polymeric composites using experimental design
Polymeric composites of Felodipine Hydrochloride (FH)-loaded PVP-PEG polymeric composite were developed using the process of solvent evaporation. The FH along with excipients, were entirely solubilized in ethanol to get a transparent solution, ensuring a homogeneous mixture at the molecular level. The prepared solution was then subjected to drying to yield a solid product so that the polymeric matrix contained evenly dispersed drug molecules. For each batch, precise amounts of FH and polymers (PVP-K30 and PEG 6000) were added to ethyl alcohol to form a clear solution. The resulting solution was spread across a tray and subjected to drying in a tray dryer set at 40 °C. Once completely dried, the entire mass was subjected to trituration using a pestle and mortar for 15 min, then passed through the sieved (Sieve No. 60) sieve and stored. Experimental designs for drug-loaded PVP-PEG solid dispersion polymeric complex formation are detailed in table 2 [6].
Table 2: Experimental design for drug-loaded PVP-PEG solid dispersion polymeric complex formation
| S. No. | PVP-K30 (g) | PEG 6000 | ||
| Actual (g) | Coded | Actual (g) | Coded | |
| 1 | 3 | +1 | 3 | +1 |
| 2 | 2 | 0 | 3 | +1 |
| 3 | 3 | +1 | 1 | -1 |
| 4 | 2 | 0 | 2 | 0 |
| 5 | 2 | 0 | 2 | 0 |
| 6 | 2 | 0 | 2 | 0 |
| 7 | 1 | -1 | 3 | +1 |
| 8 | 2 | 0 | 2 | 0 |
| 9 | 2 | 0 | 2 | 0 |
| 10 | 2 | 0 | 1 | -1 |
| 11 | 1 | -1 | 2 | 0 |
| 12 | 3 | +1 | 2 | 0 |
| 13 | 1 | -1 | 1 | -1 |
*center intwastaken a squint up late.
Risk assessment studies
The QTPP was outlined to comprehensively define the desired specifications and quality characteristics of the PVP-PEG polymeric composite of felodipine. For this purpose, preliminary risk estimation studies were conducted to delineate the high-risk critical material and process variables affecting the chosen CQAs. An Ishikawa fishbone was initially constructed to unearth the ostensible cause-effect relationship(s) between all the possible formulation or process parameters and chosen CQAs. Subsequently, each factor affecting the CQAs (mean solubility, drug loading, and drug release) was assigned to different levels of risk, i. e., low, medium, and high, as a part of the risk estimation matrix (REM) exercise (fig. 1 and table 3) [7, 8].
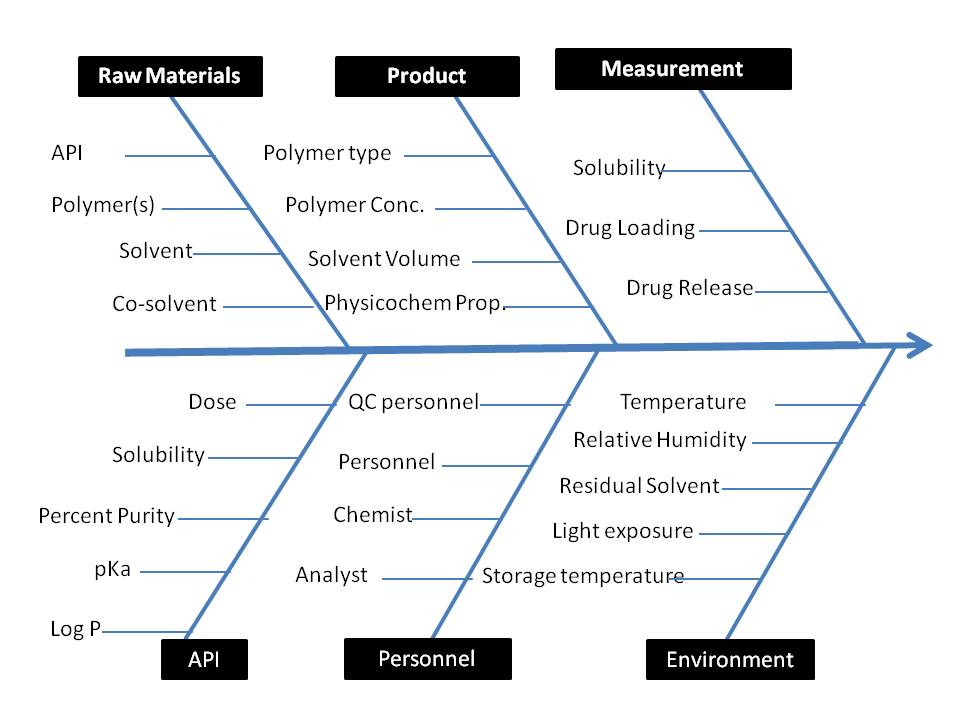
Fig. 3: Ishikawa fishbone diagram depicting critical quality attributes for alginate beads formulation
Table 3: REM for initial risk assessment
| Drug product CQA | Melting point | Lipophilicity | Hygroscopicity | Glass forming ability | Polymorphism | Excipients choice | Drug polymer miscibility |
| Solubility | Low | Medium | Low | Low | High | High | High |
| Drug Loading | Low | Medium | Low | Low | High | High | High |
| Drug Release | Low | Medium | Low | Low | High | High | High |
Systematic optimization by face centered 32 central composite design (CCD)
For the optimization study, a face-centered 32 CCD was employed. The concentrations of functional Excipients (PVP K30 (X) and PEG 6000 (Y)) were considered as CMA. The impact of the concentration of CMA on CQA i. e. dependent responses, including solubility, drug content, and drug release, was investigated. The design includes the experimental points, as presented in table 3. Polynomial equations were developed to describe the relationship between the independent variables and the responses. The effect of an independent variable can be assessed using the following polynomial equation:
Y1 = b0+b1 X1+b2 X2+b3 X1 X22+b4 X12+b5 X22+b6 X1 X22+b7 X12X2, eq. (1)
In this equation 1, Y1 is the dependent response (e. g., solubility, drug content, drug release), X and Y are the independent variables (concentrations of PVP K30 and PEG 6000, respectively), b0 is the arithmetic mean of the 13 experimental runs, and b1, b2, b3, b4, and b5 are the coefficients that represent the linear, quadratic, and interaction effects of the independent variables [9].
The experiments' data were, after that confirmed with a series of statistical parameters to see which model would suit best with experimental data. To see the linkage or association between chosen CMAs and CQAs, response surface methodology was utilized.
Aqueous solubility of FH
Each polymeric composite was prepared by adding an excess amount of powder to 1 ml of distilled water in a 2 ml micro tube, followed by vortexing for sixty seconds. Following this, the microtubes were placed on a mechanical shaker in a water bath (25 °C, 100 rpm) and shaken for 5 days. After shaking, the samples were centrifuged at 5000 g, and 500 µl** of the supernatant was carefully pipetted. The supernatant was then diluted with ethyl alcohol, and the resulting solution was analyzed using a double-beam UV-visible spectrophotometer (UV1800, Shimadzu, Japan) at a wavelength of 363 nm to determine the FH concentration [10].
Drug content (DC) in prepared polymeric composites
For each polymeric composite, a sample equivalent to 5 mg of the drug was weighed and solubilized in a volumetric flask containing ethyl alcohol (100 ml) to prepare a solution of concentration 500 µg/ml. The resulting solution was then filtered through a filter (0.45 µm), and the filtrate was diluted to the appropriate concentration using ethyl alcohol. Analysis of the diluted solution was carried out using a double-beam UV-visible spectrophotometer. (UV1800, Shimadzu, Japan) at a wavelength of 363 nm to determine the concentration of FH. The test was conducted in triplicate for each formulation. The drug content was calculated using the following formula:
Xs = Xa/Xt × 100.
Where Xs represents the FH, Xa is the actual titer quantified by the UV–visible spectrophotometer, and Xt is the theoretical concentration [11].
In vitro dissolution (Q)
The dissolution study was conducted using a USP I apparatus (Paddle type, Electrolab dissolution test apparatus, India). A sample equivalent to 5 mg of FH was enclosed within a dialysis membrane, secured in a sinker, and kept in 2% (w/v) aqueous Tween 80 solution (900 ml) for dissolution. The system was maintained at 37±0.5 °C with a water bath surrounding the apparatus. Tweeb 80 was used for improved dissolution of the drug because of its poor solubility [12]. The speed of the dissolution test apparatus was set to rotate at 100 rpm [13], and the process was done in sink conditions throughout the experiment. Sample (1 ml) was withdrawn at specified time intervals, 1 ml of the dissolution medium was withdrawn, filtered, and diluted and concentration was analyzed using a UV-visible spectrophotometer (UV1800, Shimadzu, Japan) at 363 nm [14].
Optimization and data validation
Different formulations (table 1) were prepared as per experimental design using the Quality by Design approach employing Design expert Software trial version. A total of 13 batches were prepared among which center point was developed four times to compute the mean for further analysis. The response surface curves (RSM) were plotted using Design Expert® 8.0.7.1 (trial version). The statistical significance of the model was found significant for CQA. After plotting the RSM curve, the optimized batch was selected based on the desired values of the CQA.
The validity of data predicted for the optimized batch was checked by developing four validation check batches (VCB1 to VCB3) as well as the optimized batch was developed and validated. A comparison between observed and predicted values of dependent responses was compared critically. Linear correlation graphs were plotted for the selected validation check batches and residual graphs between predicted and observed responses. The % bias, or percent prediction error, was calculated in relation to the observed responses. Validation of the optimized batch was carried out by selecting four formulations as checkpoints [15].
Powder X-ray diffraction (XRD) analysis
The crystalline characteristics of the FH and optimized polymeric composite were determined using XRD equipment (Philips PW 1729 X-ray diffractometer Le group interconnection, Scient Jurie, Cadlada). XRD study was performed by generating radiation from the monochromatic copper source at 50 kV Voltage and 100 mA current. The PXRD pattern was obtained within a range of 10–70° using a 2θ scan mode, with a scanning speed of 5° per minute and a step size of 0.02° per second [16].
DSC analysis
The crystallinity of the drug and formulation was identified by a Differential Scanning Calorimeter (DSC-60, Shimadzu, Japan). The drug was heated at a rate of 10 °C per minute in the temperature range of 3–400 degrees Celsius under an inert nitrogen atmosphere with a flow rate of 40 ml per minute. A sample weight of 2-3 mg was placed in a sampling pan of aluminum, with an empty pan of aluminum used as the reference. The DSC curves were plotted and analyzed for further study [17].
Scanning electron microscopy
The surface topography of FH plain powder and the optimized polymeric composite was observed using a Scanning Electron Microscope (Zeiss, Supra 40, India). The sample was fixed on a brass disc support using thin carbon tape. In order to render the samples electrically conductive for imaging, they were coated with platinum using an EMI Teck Ion Sputter (K575K) for three minutes at a vacuum of 8×10⁻³ mbar, with a current of 20 mA and 90% turbo speed [18].
RESULTS AND DISCUSSION
Even though FH is poorly soluble in aqueous gastrointestinal fluids, its own absorption is restricted. Solid dispersion techniques are known to increase the water solubility, rate of drug dissolution, and absorption of rugs having poor solubility [19]. Both PVP and PEG were incorporated into all batches to improve the water solubility of FH [20]. In this study, to prepare a hydrophilic polymeric composite, PVP K-30 and PEG 6000 were used as hydrophilic polymers and polymeric surfactants, respectively.
Risk estimation matrix
An Ishikawa fishbone diagram, illustrated in fig. 3, schematically represents all possible connections between the different input variables and the intended CQAs of polymeric composites. By taking previously published findings and brainstorming sessions into consideration, the criticality of some input variables was reviewed; every one of these variables harbored a varying degree of risk. All other input variables were kept constant in the experiment except CMA which includes PVP-K30 concentration, PEG 6000, stirring speed, solvent volume, and stirring time were considered to be risk factors; thus, tests of factor screening were taken into consideration [21].
Factor screening studies
Factor screening studies are known to follow the sparsity effect, i. e., “only a vital few” out of so many possible variables tend to explain the leading cause of the variation during the experimentation.
Below mentioned equations 1. 2 and 3 define the coefficients of different quadratic model terms involved during the analysis of individual CQAs.
Solubility=+23.03+4.46A+3.98B-0.59A B+0.44 A2+0.20B2+0.18A2 B+0.40AB2-0.13 A2 B2 …. Eq (1)
Drug content =+97.36+0.41A-1.94B+0.070AB+0.12A2+0.19B2+0.095A2B+0.06 AB2-0.085A2B2 … Eq (2)
Drug Release=+80.41+4.40A+2.90B-0.31AB+0.12A2+0.90B2-0.55A2B-0.55AB2-0.27A2 B2 ……… Eq (3)
Where A indicates the concentration of gelatin and B represents the concentration of the linear was found highly significant (p<0.0001) for all three dependent variables and provides the best fit. The calculated R2 value in the present models for all four responses was close to 1 indicating a good model. In all cases, the adjusted R2 values are in reasonable agreement with the predicted R2 values (0.0.9877 and 0.9748 for solubility, 0.9800 and 0.9764 for drug content, and 0.9701 and 0.9521 for drug release. "Adeq Precision" measures the signal-to-noise ratio and a ratio greater than 4 was desirable. In all the cases precision values for four responses were found to be 17.264, 24.474, and 48.163 indicating an adequate signal and that the model can be used to navigate within the design space.
The solvent-evaporation method was chosen for the preparation of the solid dispersions, as it is considered one of the most effective techniques. In this approach, before drying, each component is thoroughly dissolved in a solvent to ensure uniform molecular mixing. Consequently, the dried product's drug molecules are evenly dispersed or trapped within the polymeric matrix, enhancing content homogeneity and encouraging improved drug-hydrophilic polymeric matrix interaction. This leads to enhanced solubility and dissolution proliferation of the drug, as the hydrophilic polymers aid in better wetting of the drug. Drying was carried out at 40 °C until the sample weight stayed constant in order to ensure that the solvent was completely removed [22].
Table 4: Characterization of developed solid dispersion complex
| S. No. | PVP-K30 (g) | PEG 6000 (g) | Solubility (mg/ml) (n=3, Mean±SD) | Drug content (%) (n=3, Mean±SD) |
Drug release (%) (n=3, Mean±SD)) |
| SD1 | 1 | 1 | 31.98±0.19 | 96.28±1.02 | 87.05±0.88 |
| SD2 | 0 | 1 | 27.21±1.71 | 95.61±0.91 | 84.21±0.43 |
| SD3 | 1 | -1 | 24.83±0.64 | 99.82±1.33 | 82.97±0.45 |
| SD4 | 0 | 0 | 23.01±0.41 | 97.47±.75 | 80.83±1.06 |
| SD5 | 0 | 0 | 22.91±0.09 | 97.52±0.19 | 80.56±1.08 |
| SD6 | 0 | 0 | 23.23±0.37 | 97.43±0.73 | 80.72±0.79 |
| SD7 | -1 | 1 | 23.44±0.38 | 95.19±1.05 | 79.97±0.52 |
| SD8 | 0 | 0 | 22.89±0.82 | 97.74±1.27 | 80.00±0.93 |
| SD9 | 0 | 0 | 23.07±0.55 | 97.00±0.79 | 80.18±1.01 |
| SD10 | 0 | -1 | 19.25±0.71 | 99.48±0.37 | 78.41±0.49 |
| SD11 | -1 | 0 | 19.02±0.63 | 97.06±1.05 | 76.13±0.84 |
| SD12 | 1 | 0 | 27.93±0.39 | 97.89±1.17 | 84.93±0.39 |
| SD13 | -1 | -1 | 13.93±0.44 | 99.01±0.98 | 74.66±1.09 |
*n=3f rallex periments, indicating the number freplicates,*Data are presented as mean±SD(Standard Deviation).

Fig. 2: Solubility study of various PVP-PEG solid dispersion polymeric composites (Data are expressed as mean±standard deviation (SD), with error bars representing SD, n = 3)
Solubility study
All of the prepared polymeric composites show a positive impact over solubility (table 4 and fig. 2). In solid dispersion systems, PVP K30 acts as a hydrophilic polymer that facilitates the solubilization of poorly soluble drugs by increasing their wettability and dispersibility in aqueous media. PEG 6000, on the other hand, is a hydrophilic polymeric surfactant that enhances the dissolution rate by reducing the crystalline structure of the drug and promoting its amorphization [23].
When PVP K30 and PEG 6000 were combined in a polymeric composite solid dispersion formulation, a synergistic effect is observed, leading to a significant improvement in the solubility of the drug. PVP K30 helps in maintaining the drug in a molecularly dispersed form, preventing recrystallization, while PEG 6000 contributes to further enhancing the solubility through its surfactant properties. This combination increases the available surface area for dissolution and improves the interaction between the drug molecules and the solvent, resulting in faster dissolution and higher solubility [24].
The t-test analysis demonstrated that both PVP K30 and PEG 6000 significantly influence solubility, drug content, and drug release. PVP K30 showed a strong impact on solubility (p = 0.0367) and drug release (p = 0.0119), likely due to its ability to form hydrogen bonds and improve drug dispersion in an amorphous state, enhancing dissolution. Similarly, PEG 6000 exhibited a significant effect on drug content (p = 0.0001) and also contributed to solubility and drug release, possibly by reducing drug crystallinity and enhancing wettability. The combined effects of PVP K30 and PEG 6000 suggest a synergistic role in improving solubility, maintaining uniform drug content, and facilitating better drug release. Optimizing the concentrations of both polymers is crucial for enhancing the overall performance of solid dispersions.
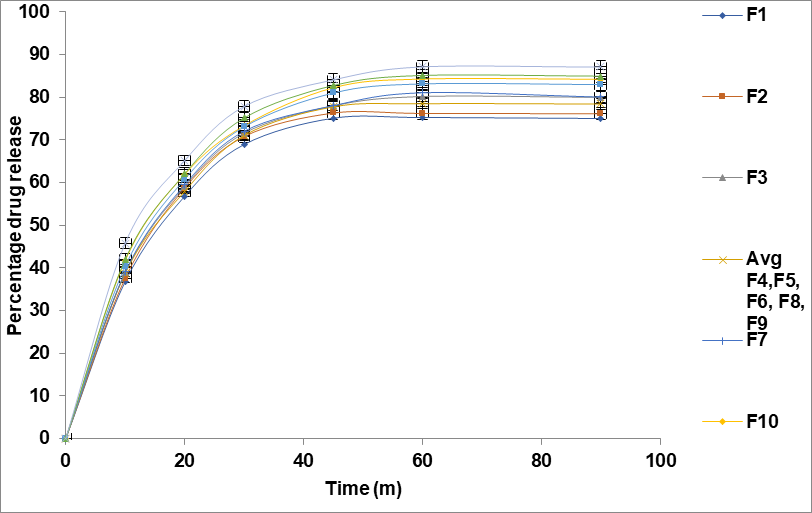
Fig. 3: Drug release profile of formulations F1–F13 over time. (Data are expressed as mean±standard deviation (SD), with error bars representing SD, n = 3)
Drug content determination
Before conducting the drug dissolution study, the drug content was assessed all batches. Table 4 displays the drug content for all formulations, indicating that the drug remained steady throughout the formulation development and procedures for drying. The combination of PVP K30 and PEG 6000 in solid dispersions enhances drug content uniformity and solubility. PVP K30 increases drug wettability and dispersion, while PEG 6000 reduces crystallinity, promoting amorphization and faster dissolution. Together, they improve drug stability, ensure better distribution, and enhance bioavailability, making the formulation more effective [25].
In vitro drug release study
The drug release study developed a solid dispersion polymeric composite shown in table 4 and fig. 3. All prepared polymeric composites were evaluated for their drug release over a period of 8 h. The Study reveals that the increased drug release rate of the formulations due to differences in the concentrations of the dependent variables. Specifically, as the amount of PVP K30 increased from 1g to 3 g, the drug release rate increased. This enhances the wettability and drug dissolution in aqueous media, thus improving its release rate [26].
Data analysis
Data obtained from the study clearly indicate that the solubility, drug content, and drug release values are strongly dependent upon the selected independent variables (equations 2-4) The ANOVA results for the different dependent variables are as follows:
SOL=23.03+4.46A+3.98B-0.59AB+0.44A2+0.20B2+0.18A2B+0.40AB2-0.13A2B2 eqn 2
DC=97.36+0.41A-1.94B+0.070AB+0.12A2+0.19B2+0.095A2B+0.06AB2-0.085A2B2 eqn 3
Q =+80.41+4.40A+2.90B-0.31AB+0.12A2+0.90B2-0.55A2B-0.55AB2-0.27A2B2eqn 4
Where A indicates the concentration of PVP K30 and B represents the concentration of PEG.
Drug release kinetics
The dissolution kinetic study revealed that the Korsmeyer-Peppas model best described the drug release behavior for all formulations, indicating a non-Fickian diffusion mechanism governed by both diffusion and erosion processes. The release rate constant (k value) ranged from 25.05 to 29.95, while the diffusional exponent (n value) between 0.25 and 0.28 confirmed anomalous transport. Higher drug release was observed in F10 to F13, suggesting that polymer composition and excipient selection significantly influence the release profile. These findings emphasize the need for optimized formulation strategies to achieve desired drug release characteristics.
Response surface analysis
To examine response properties, response surface plots and contour plots were prepared as displayed in fig. 4 (a) for solubility, (b) for drug content, and (c) for drug release.
The concentration of independent variables was established (see table 4). Thirteen formulations were created by selecting various combinations, with the center point replicated five times to determine a mean value for further analysis. The effects of these independent variables were evaluated using statistical software (Design Expert, trial version DX10). A model was developed and tested for significance to optimize the batch using response surface methodology. Data optimization was further confirmed by generating an overlay plot with Design Expert software. Validation of the optimized batch involved creating four validation check batches (VC1-VC3), and the dependent responses (solubility, drug content, and drug release) were measured. These observed values were then compared to the predicted responses, and the percent error was calculated.

Fig. 4: Response surface and contour plots for (a) Solubility (b) Drug content and (c) Drug release
Response surface curve (fig. 4a) clearly indicates the impact of PVP K30 over solubility of developed solid dispersion complex that as the concentration of PVP K30 increases solubility increases by altering its crystalline structure to a more amorphous form, which dissolves more readily in the water while as the concentration of PEG 6000 increases solubility also get increases by increasing the overall surface area available for dissolution.
Response surface curve (fig. 4b) shows that as the amount of PVP K30 increases drug content also improves as PVP K30 can help to amorphized drugs that are typically crystalline and poorly soluble in water while by increasing the concentration of PEG 6000 drug content increases.
The response surface curve (fig. 4c) of the drug release study shows that as the concentration of PVP K30 increases drug release increases while as the increase in concentration of PEG 6000 also result into improved drug release from the solid dispersion.
Overlay plot
The overlay plot in fig. 5 reveals significant interactions between PVP K30 and PEG 6000 in affecting the responses. For example, the highest solubility and drug release are typically observed in regions where both polymers are present in higher concentrations, indicating synergistic effects. However, at higher concentrations of PEG 6000, the drug content starts to plateau or decrease, suggesting that there is an optimal balance between the two polymers.
As seen in the plot, there are some trade-offs. For instance, drug release and solubility are maximized with higher levels of both PVP K30 and PEG 6000, but this comes at the cost of drug content, which may decrease when the polymer levels become too high. The overlay plot helps in identifying the regions where an optimal balance can be achieved to maximize solubility and release, while still maintaining a sufficient drug content.
Validation of the statistical model
The predicted responses for all the formulated batches and their corresponding experimentally observed values were found to be in close agreement, as shown in table 5 and fig. 6. This indicates that the models developed to predict the responses were not only statistically significant but also valid, as they yielded values that closely matched the experimentally observed results. The overlay plot shows the trade-offs between drug release, solubility, and drug content based on PVP K30 and PEG 6000 concentrations. The yellow region represents the optimized formulation where all parameters meet the desired limits. Higher PVP K30 enhances solubility but may affect drug release, while PEG 6000 improves drug release but may impact solubility. Balancing these factors is crucial for an optimal formulation.
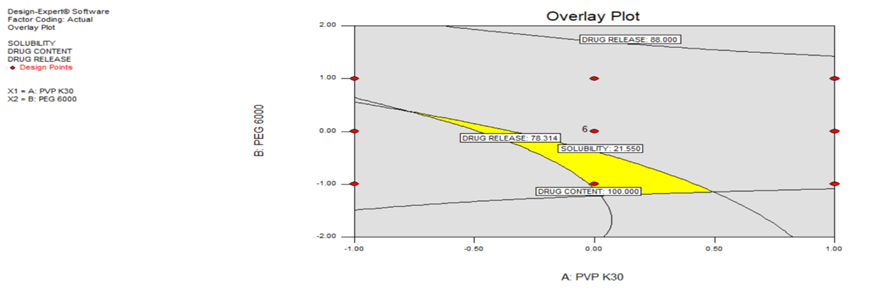
Fig. 5: Overlay plot indicating interactions between independent variables
Table 5: Validation checkpoint compositions and their results
| Formulation code | X1 | X2 | Response | Predicted value (n=3, mean±SD) | Actual value (n=3, mean±SD) | % Error |
| Optimized batch | 0.02 | -1.16 | Solubility | 18.8±0.36 | 18.75±0.13 | 0.0027 |
| Drug Content | 99.87±1.19 | 99.79±0.88 | 0.0008 | |||
| Drug release | 78.34±1.47 | 78.28±0.73 | 0.0008 | |||
| VC1 | -0.68 | 0.29 | Solubility | 21.49±.09 | 21.53±0.17 | -0.0019 |
| Drug Content | 96.57±1.31 | 96.52±1.11 | 0.0005 | |||
| Drug release | 78.4±1.20 | 78.33±1.06 | 0.0009 | |||
| VC2 | 0.44 | -1.09 | Solubility | 21.43±0.37 | 21.19±0.21 | 0.0112 |
| Drug Content | 99.84±1.06 | 99.58±0.83 | 0.0026 | |||
| Drug release | 80.21±1.28 | 80.17±0.98 | 0.0005 | |||
| VC3 | 0.03 | -0.48 | Solubility | 21.33±0.33 | 21.2±0.61 | 0.0061 |
| Drug Content | 98.34±0.97 | 98.04±1.31 | 0.0031 | |||
| Drug release | 79.38±0.61 | 79.29±1.19 | 0.0011 |
*n=3f rallex periments, indicating the number freplicates, *Data are presented as mean±SD).

Fig. 6: Regression coefficient between predicted and experimental response(a) Solubility (b) Drug content (c) Drug release
The Fourier Transform Infrared (FTIR) analysis of the developed solid dispersion complex was conducted to observe the potential interactions between the drug and the polymer used in their formulation. FTIR spectra of pure drug FH (fig. 8) show characteristic absorption peaks at (3335.02 cm-1 is due to N-H stretching, 3026.95 cm-1 is due to stretching of the C-H bond, the peaks at 1651.09 cm-1 is due to C=O bonds (carbonyl group), peak at 1591.09, 1490.38 and 1467.67 cm-1 are due to C=C bond of benzene ring, 1382.81 cm-1 is due to C-N stretching, 1035.32 cm-1 is due to C-O-C stretching of ester, 824.05, 761.20 cm-1 are due to substituted benzene ring and 592.35 cm-1 is due to Cl stretching). The analysis revealed that the infrared spectra of the pure drug and the developed solid dispersion exhibit similar peak patterns (as shown in table 4 and fig. 7). This observation suggests that there is a lack of significant interaction between the drug and the polymer during the formulation process. The consistent peak alignment indicates that the drug's molecular integrity is maintained within the microspheres, reinforcing the compatibility of the selected polymer with the active ingredient. Observations indicated that there is no change in the fundamental properties of the drug.
Table 6: IR interpretation of solid dispersion
| IR frequencies (cm-1) | Assignments |
| 3335.02 | N-H stretching |
| 3026.95 | C-H bond |
| 1651.09 | C=O bonds (carbonyl group) |
| 1591.98, 1499.38 and 1467.67 | C=C bond |
| 1382.81 | C-N stretching |
| 1035.32 | C-O-C stretching of ester, |
| 824.05, 761.20 | substituted benzene ring |
| 592.35 | Cl stretching |

Fig. 7: FTIR spectra of (a) Pure drug and (b) optimized solid dispersion
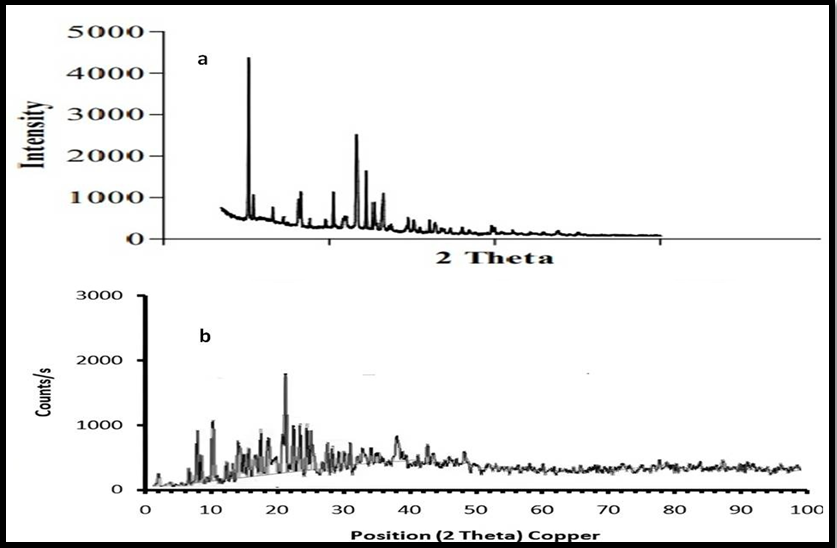
Fig. 8: XRD pattern of (a) pure drug and (b) Optimized batch of FH
Crystalline property
XRD and DSC were used to examine the sample's crystalline characteristics. Results are shown in fig. 9. The XRD analysis of the powdered drug showed sharp, intense peaks. This indicates it has some crystalline characteristics. However, the drug-loaded PVP-PEG solid dispersion complex (fig. 9) showed no peaks. This indicates a transition to an amorphous state. The loss of crystallinity in the solid dispersion of felodipine enhances its solubility and dissolution rate by reducing lattice energy and increasing molecular mobility. The polymer matrix further improves wettability and prevents recrystallization, leading to better drug release and bioavailability [27].
Surface morphology
The surface topography of pure drug and drug-loaded solid dispersion formulation are shown in fig. 9. The SEM of pure drug shows irregular shape as well as external surface structure while the drug-loaded particles were prepared by solid dispersion polymeric composites were found of irregular shape and surface [28].
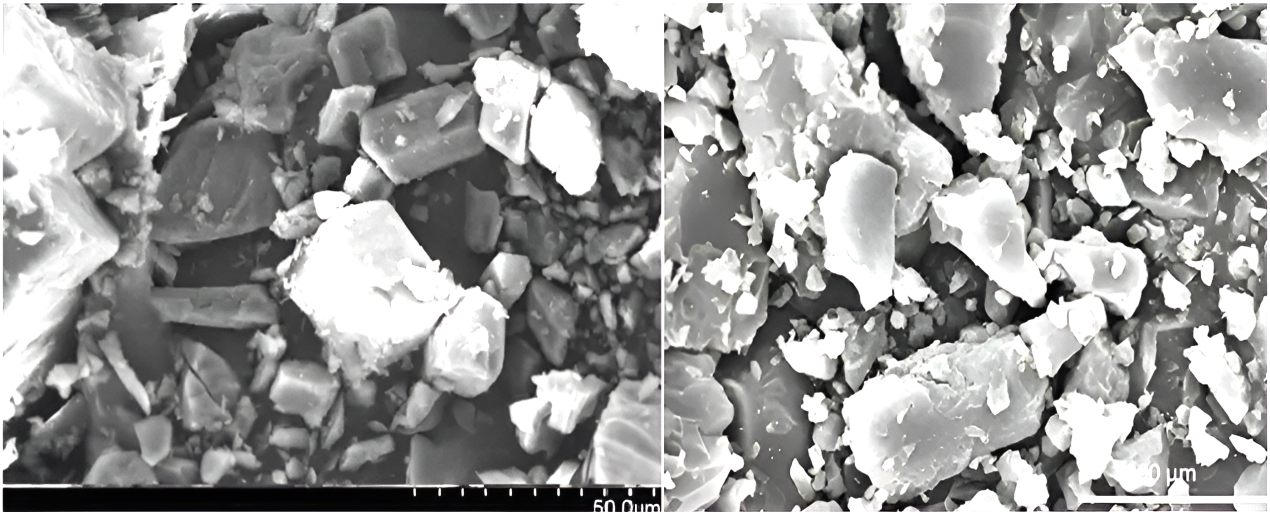
Fig. 9: Scanning electron microscope for (a) FH pure drug and (b) optimized solid dispersion complex
Stability study of the optimized formulation
A stability study of optimized formulation was conducted for three months in the stability study chamber under accelerated conditions as per ICH guidelines (temp. 40±2 °C and RH 75±5%). It was observed that over this period of time, dependent responses like solubility, drug content, and drug release were found within permissible limits [29].
Table 7: Stability study of the optimized formulation
| Formulation code | Response | After 15 d (60 °C) | After 3 mo (40 °C and RH 75) |
| Optimized batch | Solubility (mg/ml) (n=3, Mean±SD) | 18.8±0.36 | 18.35±0.13 |
| Drug Content (%)(n=3, Mean±SD) | 99.87±1.19 | 99.08±0.88 | |
| Drug release (%)(n=3, Mean±SD) | 78.34±1.47 | 77.73±0.73 |
*n=3f rallex periments, indicating the number freplicates, *Data are presented as mean±SD
CONCLUSION
In conclusion, the study successfully developed a polymeric composite of felodipine using a Quality by Design (QbD) approach to enhance its solubility and bioavailability. The QTTP was achieved by identifying key CQAs, including drug solubility, drug content, and drug release. Additionally, risk assessment studies were conducted to determine the critical material attributes (CMAs) and critical process parameters (CPPs) that could influence the CQAs of the formulated beads. The use of PVP-K 30 and PEG 600 as CMA in varying concentrations effectively improved the CQAs as the drug's solubility, drug content, and drug release. The optimization process, guided by response surface methodology, demonstrated accurate predictions and successful validation of the composite formulation. The findings confirm the potential of this approach in improving the solubility of poorly soluble drugs, offering a promising strategy for enhancing their bioavailability in therapeutic applications.
ACKNOWLEDGMENT
The author would like to thank to Director, HRIT University, Ghaziabad, and IFTM University, Moradabad for encouraging research work. The author is also profoundly grateful to my supervisor and co-supervisor for their kind support and guidance.
FUNDING
The author(s) received no financial support for the research, authorship, and/or publication of this article.
AUTHORS CONTRIBUTIONS
Deepti Agarwal carried out experiments in this research. Dr. Vijay Sharma and Dr. R. D. Gupta contributed to writing, experimentation, data analysis, result reporting, and original draft preparation.
CONFLICT OF INTERESTS
The authors do not have any conflict of interest.
REFERENCES
Schittny A, Huwyler J, Puchkov M. Mechanisms of increased bioavailability through amorphous solid dispersions: a review. Drug Deliv. 2020;27(1):110-27. doi: 10.1080/10717544.2019.1704940, PMID 31885288.
Amasya G, Aksu B, Badilli U, Onay Besikci A, Tarimci N. QbD guided early pharmaceutical development study: production of lipid nanoparticles by high pressure homogenization for skin cancer treatment. Int J Pharm. 2019;563:110-21. doi: 10.1016/j.ijpharm.2019.03.056, PMID 30935913.
Nabi Meibodi M, Vatanara A, Najafabadi AR, Rouini MR, Ramezani V, Gilani K. The effective encapsulation of a hydrophobic lipid-insoluble drug in solid lipid nanoparticles using a modified double emulsion solvent evaporation method. Colloids Surf B Biointerfaces. 2013;112:408-14. doi: 10.1016/j.colsurfb.2013.06.013, PMID 24036624.
Ravi PR, Aditya N, Kathuria H, Malekar S, Vats R. Lipid nanoparticles for oral delivery of raloxifene: optimization, stability, in vivo evaluation and uptake mechanism. Eur J Pharm Biopharm. 2014;87(1):114-24. doi: 10.1016/j.ejpb.2013.12.015, PMID 24378615.
Cohn JN, Ziesche S, Smith R, Anand I, Dunkman WB, Loeb H. Effect of the calcium antagonist felodipine as supplementary vasodilator therapy in patients with chronic heart failure treated with enalapril: V-HeFT III. Vasodilator-heart failure trial (V-HeFT) study group. Circulation. 1997;96(3):856-63. doi: 10.1161/01.cir.96.3.856, PMID 9264493.
Elsayed EW, Emam MF. Application of response surface methodology using face-centered central composite design for studying long-term stability of gliclazide-loaded multiparticulate systems. J Pharm Sci. 2024;113(8):2274-85. doi: 10.1016/j.xphs.2024.03.012, PMID 38513892.
Singh B, Kaisar R, Beg S. Developing, “optimized” drug products employing “designed” experiments. In: Chem Ind digest India; 2013. p. 70-6. doi: 10.1016/j.xphs.2024.03.012.
Singh B, Saini S, Lohan S, Beg S. Systematic development of nanocarriers employing quality by design paradigms. In: Mishra V, Kesharwani P, Amin KC, Iyer A, editors. Nanotechnology-based approaches for targeting and delivery of drugs and genes. Elsevier; 2017. p. 110-48. doi: 10.1016/B978-0-12-809717-5.00003-8.
Yousaf AM, Kim DW, Oh YK, Yong CS, Kim JO, Choi HG. Enhanced oral bioavailability of fenofibrate using polymeric nanoparticulated systems: physicochemical characterization and in vivo investigation. Int J Nanomedicine. 2015;10:1819-30. doi: 10.2147/IJN.S78895, PMID 25784807.
Tarique J, Sapuan SM, Khalina A. Effect of glycerol plasticizer loading on the physical, mechanical, thermal, and barrier properties of arrowroot (Maranta arundinacea) starch biopolymers. Sci Rep. 2021;11(1):13900. doi: 10.1038/s41598-021-93094-y, PMID 34230523.
Mehta R, Chawla A, Sharma P, Pawar P. Formulation and in vitro evaluation of Eudragit S-100 coated naproxen matrix tablets for colon-targeted drug delivery system. J Adv Pharm Technol Res. 2013;4(1):31-41. doi: 10.4103/2231-4040.107498, PMID 23662280.
Kim KS, Jin SG, Mustapha O, Yousaf AM, Kim DW, Kim YH. Novel fenofibric acid-loaded controlled release pellet bioequivalent to choline fenofibrate-loaded commercial product in beagle dogs. Int J Pharm. 2015;490(1-2):273-80. doi: 10.1016/j.ijpharm.2015.05.059, PMID 26024820.
Srinarong P, Faber JH, Visser MR, Hinrichs WL, Frijlink HW. Strongly enhanced dissolution rate of fenofibrate solid dispersion tablets by incorporation of superdisintegrants. Eur J Pharm Biopharm. 2009;73(1):154-61. doi: 10.1016/j.ejpb.2009.05.006, PMID 19465121.
Solis Cruz B, Hernandez Patlan D, Morales Hipolito EA, Tellez Isaias G, Alcantara Pineda A, Lopez Arellano R. Discriminative dissolution method using the open-loop configuration of the USP IV apparatus to compare dissolution profiles of metoprolol tartrate immediate-release tablets: use of kinetic parameters. Pharmaceutics. 2023;15(9):2191. doi: 10.3390/pharmaceutics15092191, PMID 37765161.
Nadendla RR, Priyanka PV. Optimizing transdermal patch formulation for enhanced delivery of rivaroxaban: a comprehensive design of experiments approach. Int J Pharm Pharm Sci. 2024;16(12):8-20. doi: 10.22159/ijpps.2024v16i12.51075.
Sandhan S, Sapra K, Mor J. Formulation and evaluation of sustained release matrix tablets of glipizide. IJPBR. 2013;1(4):89-94. doi: 10.30750/ijpbr.1.4.16.
Chiou WL, Riegelman S. Pharmaceutical applications of solid dispersion systems. J Pharm Sci. 1971;60(9):1281-302. doi: 10.1002/jps.2600600902, PMID 4935981.
Li FQ, Hu JH. Improvement of the dissolution rate of silymarin by means of solid dispersions. Chem Pharm Bull (Tokyo). 2004;52(8):972-3. doi: 10.1248/cpb.52.972, PMID 15304992.
Qiu MF, Jia W, Li SS, Xu ZH, Sun X, Wang XR. A new silymarin preparation based on solid dispersion technique. Adv Ther. 2005;22(6):595-600. doi: 10.1007/BF02849953, PMID 16510376.
Sun N, Wei X, Wu B, Chen J, Lu Y, Wu W. Enhanced dissolution of silymarin/polyvinylpyrrolidone solid dispersion pellets prepared by a one-step fluid-bed coating technique. Powder Technol. 2008;182(1):72-80. doi: 10.1016/j.powtec.2007.05.029.
Chan SY, Chung YY, Cheah XZ, Tan EY, Quah J. The characterization and dissolution performances of spray dried solid dispersion of ketoprofen in hydrophilic carriers. Asian J Pharm Sci. 2015;10(5):372-85. doi: 10.1016/j.ajps.2015.04.003.
Patel K, Shah S, Patel J. Solid dispersion technology as a formulation strategy for the fabrication of modified release dosage forms: a comprehensive review. Daru. 2022;30(1):165-89. doi: 10.1007/s40199-022-00440-0, PMID 35437630.
Purohit HS, Zhang GG, Gao Y. Detecting crystallinity in amorphous solid dispersions using dissolution testing: considerations on properties of drug substance, drug product, and selection of dissolution media. J Pharm Sci. 2023;112(1):290-303. doi: 10.1016/j.xphs.2022.10.020, PMID 36306864.
Bhakta HC, Lin JM, Grover WH. Measuring dissolution profiles of single controlled-release drug pellets. Sci Rep. 2020;10(1):19734. doi: 10.1038/s41598-020-76089-z, PMID 33184351.
Sharma V, Singh L, Verma N. QbD enabled process variable study to develop sustained release chitosan-alginate imgded delivery system for improved patient compliance. Braz J Pharm Sci. 2022;58:1-18. doi: 10.1590/s2175-97902021000319803.
Wu Z. Drug stability testing and formulation strategies. Pharm Dev Technol. 2018;23(10):941. doi: 10.1080/10837450.2018.1548742, PMID 31284808.
Sharma V, Singh L, Verma N. Establishment and escalation of an amino acid stacked repressible release imgded system using quality by design. Turk J Pharm Sci. 2019;16(1):20-6. doi: 10.4274/tjps.44154, PMID 32454690.
Sharma V, Singh L, Verma N. QbD enabled process variable study to develop sustained release chitosan-alginate imgded delivery system for improved patient compliance. Braz J Pharm Sci. 2022;58:1-18. doi: 10.1590/s2175-97902021000319803.
Wu Z. Drug stability testing and formulation strategies. Pharm Dev Technol. 2018;23(10):941. doi: 10.1080/10837450.2018.1548742, PMID 31284808.