
Int J App Pharm, Vol 17, Issue 4, 2025, 541-548Original Article
INNOVATIVE UPLC METHOD FOR CONCURRENT QUANTIFICATION AND PHARMACOKINETIC ANALYSIS OF NIRMATRELVIR AND RITONAVIR IN RAT PLASMA
GOPE EDWARD RAJU1*, SRIKANTH POTTENDLA2, SUNEETHA YAPARTHI3
1Department of Pharmaceutical Analysis, Dr. Samuel George Institute of Pharmaceutical Sciences, Markapur, Andhra Pradesh-523316, India. University college of Pharmaceutical Sciences, Acharya Nagarjuna University, Nagarjuna Nagar, Guntur, Andhra Pradesh-522510, India.. 2Department of Pharmacology, Dr. Samuel George Institute of Pharmaceutical Sciences, Markapur-523316, Andhra Pradesh, India. 3Department of Pharmaceutical Chemistry, Dr. Samuel George Institute of Pharmaceutical Sciences, Markapur-523316, Andhra Pradesh, India
*Corresponding author: Gope Edward Raju; *Email: edward.phd.2022@gmail.com
Received: 16 Apr 2024, Revised and Accepted: 23 Apr 2025
ABSTRACT
Objective: The primary goal of this study was to develop a rapid, robust, and sensitive UPLC method for the simultaneous estimation of Nirmatrelvir and Ritonavir in rat plasma using Lopinavir as an internal standard. This method aimed to improve upon existing approaches by offering faster run times, superior sensitivity, and thorough linearity, matrix effect, accuracy and precision, recovery and stability in accordance with USFDA guidelines.
Methods: The UPLC analysis was carried out using a Waters Acquity UPLC system equipped with a PDA detector. An Acquity UPLC BEH Phenyl column (100 mm x 2.1 mm, 1.7 µm) was used for the separation process, with an isocratic mobile phase of buffer (Ammonium formate of pH-2.5 adjusted with 0.1% formic acid), flow rate 0.2 ml/min. Detection occurred at 236 nm, and the injection volume was 5 µl.
Results: Analysis was performed within 3 min, with a linear concentration range of 300-12000 ng/ml (r² = 0.99994±0.018) for Nirmatrelvir and 200-8000 ng/ml (r² = 0.99985±0.006) for Ritonavir. The extraction recovery results of Nirmatrelvir and Ritonavir were 97.17, 97.34, 97.34% and 96.80, 97.31, 96.95%, respectively and for matrix effect results were 97.18, 97.01 and 97.50, 97.58 at different QC concentration levels. Precision and recovery study results were determined within the acceptable limit.
Conclusion: This UPLC method provides a substantial improvement in terms of speed, sensitivity, and robustness, making it well-suited for high-throughput pharmacokinetic studies of Nirmatrelvir and Ritonavir.
Keywords: Nirmatrelvir, Ritonavir, UPLC, Validation, Bioanalytical method development, USFDA guidelines
© 2025 The Authors. Published by Innovare Academic Sciences Pvt Ltd. This is an open access article under the CC BY license (https://creativecommons.org/licenses/by/4.0/)
DOI: https://dx.doi.org/10.22159/ijap.2025v17i4.53877 Journal homepage: https://innovareacademics.in/journals/index.php/ijap
INTRODUCTION
Nirmatrelvir and Ritonavir are pivotal components in the treatment of COVID-19, particularly in the combination therapy known as Paxlovid. Nirmatrelvir is a protease inhibitor designed to target the main protease of SARS-CoV-2, essential for viral replication [1]. Ritonavir, initially developed as an HIV protease inhibitor, is used in this combination to inhibit the metabolism of Nirmatrelvir, increasing its plasma concentration and efficacy [2].
Given the critical role of these drugs during the ongoing pandemic, there is a substantial need for reliable analytical methods to quantify these drugs in biological matrices. Existing methods for estimating Nirmatrelvir and Ritonavir often involve complex procedures, longer run times, or inadequate sensitivity [3]. Traditional HPLC methods, while widely used, do not offer the speed and sensitivity required for high-throughput pharmacokinetic studies [4].
UPLC has gained prominence in bioanalytical [5] chemistry, excelling over HPLC with its enhanced speed, resolution, and sensitivity. The enhanced performance of UPLC is attributed to its ability to operate at higher pressures, allowing for the use of smaller particle-size columns, leading to better separation and faster analysis times [6]. Fig. 1 shows the chemical structures of Nirmatrelvir and Ritonavir.
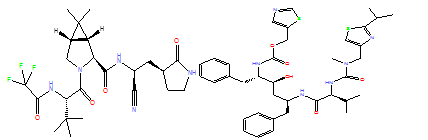
(A) Nirmatrelvir (B) Ritonavir
Fig. 1: Structural representations of (A) Nirmatrelvir and (B) Ritonavir
According to USFDA guidelines, the current study describes a straightforward UPLC method for determining Nirmatrelvir and Ritonavir in parenteral dosage form.
Novelty and Contribution to the Analytical Field of this research introduces an innovative, rapid, and sensitive UPLC method for the concurrent estimation of Nirmatrelvir and Ritonavir in rat plasma. Compared to previously reported methods, this UPLC method significantly reduces the analysis time to under 3 min while maintaining high sensitivity and accuracy. Lopinavir, serving as an internal standard, further enhances the reliability of the quantification process.
A literature survey identified five HPLC assay method studies [7-11], one UPLC [12], one LCMS [13] and one Bioanalytical method using HPLC [14] were available for the determination of Nirmatrelvir and Ritonavir. No bio-analytical articles were reported for determining the Nirmatrelivir and Ritonavir by using UPLC in any matrix. The developed UPLC (Ultra Performance Liquid Chromatography) method was utilized for the estimation of the combined drugs by in vitro method.
MATERIALS AND METHODS
Materials
Nirmatrelvir and Ritonavir were obtained from Glenmark Pharmaceuticals Ltd., Hyderabad. UPLC-grade acetonitrile, methanol, and formic acid were purchased from Merck Chemicals, Mumbai. A Milli-Q system was used to purify the water.
Equipment
The UPLC analysis was carried out using a Waters Acquity UPLC system equipped with a PDA detector. Data were processed using Empower-2 software [15, 16].
Pharmacokinetic study
Selection of animals
In order to conduct this research, 6 healthy white New Zealand rats (app. 250 g weight) were procured from Bioneeds India pvt. Ltd. in Bangalore. Six rats were used in this study Animal ethics committee (Reg. No. 1250/PO/RcBi/S/20/CPCSEA) at the institute approved the experiment protocol. The circumstances resemble those of a laboratory, and the animals have access to fresh endive, carrots, and maize. Feed for animals should be kept between 20 and 26° Celsius, with humidity between 50 and 60 %. All animals fasted for an entire day and drank water at will before being used in an experiment.
Preparation of standard solutions
Methanol was used to prepare stock solutions containing 24000 ng/ml Nirmatrelvir and 16000 ng/ml Ritonavir. These stock solutions were diluted with the mobile phase to make working solutions. The calibration standards varied from 300 to 12000 ng/ml for Nirmatrelvir and from 200 to 8000 ng/ml for Ritonavir.
Sample preparation
Rat plasma samples (200 µl) were spiked with 500 µl of internal standard (Lopinavir, 12000 ng/ml), 300 µl of acetonitrile, and vortexed for 15 min. The mixture underwent centrifugation at 5000 rpm for 15 min, followed by filtration of the supernatant through a 0.22 µm nylon filter before UPLC analysis.
Chromatographic conditions
An Acquity UPLC BEH phenyl column (100 mm x 2.1 mm, 1.7 µm) was used for the separation process, with an isocratic mobile phase of buffer (Ammonium formate of pH-2.5 adjusted with 0.1% formic acid) and acetonitrile (60:40) flowing at a rate of 0.2 ml/min. Detection occurred at 236 nm, and the injection volume was 5 µl**. Active pharmaceutical ingredients internal standards were well separated in optimized chromatographic conditions. All of the findings were within the limits. On using these optimized conditions, we get plate count and tailing values of Lopinavir, Nirmatrelvir, Ritonavir were 12485, 17362, 10150 and 1.09, 1.05, 1.12. The resolution values were 10.62, 6.37 and retention times were 1.135 min (Lopinavir), 1.973 min (Nirmatrelvir), 2.520 min (Ritonavir).
Method development
Several trials were conducted to establish a good resolution between Nirmatrelvir, Ritonavir and internal standard (Lopinavir). Phosphate and acetate buffers were used to develop the approach. But, these buffers in mobile phase has no capable of effectively separating the active ingredients and internal standard. Following that, the selected mobile phases (acetonirile and ammonium phosphate) improved the resolving power and provided better resolving power between selected drugs. To improve the separation between the peaks, acetonitrile was added to mobile phase B in varying concentrations. The RP-18 and phenyl columns were used in the development trials (table 1), but the phenyl column, 100x2.1 mm, 1.7 column coupled to the PDA detector was used to separate Nirmatrelvir, Ritonavir and internal standard. Active pharmaceutical ingredients internal standards were well separated in optimized chromatographic conditions. All of the findings were within the limits. On using these optimized conditions, we get plate count and tailing values of Lopinavir, Nirmatrelvir, Ritonavir shown in table 2. Tabulated in table 1 are the conditions of trials. Fig. 2 shows Optimized chromatogram.
Table 1: Trial conditions
| Trial No. | Buffer | Mobile phase | Column | Flow rate | Observation |
| 1 | Ammonium formate of pH-2.5 with formic acid | Acetonitrile+Buffer (40+60) | Shield RP-18 100 mmx2.1 mm, 1.7µ | 0.2 ml/min | Second and Third peaks were broad |
| 2 | Ammonium formate of pH-2.5 with formic acid | Acetonitrile+Buffer (50+50) | Shield RP-18 100 mmx2.1 mm, 1.7µ | 0.2 ml/min | First peak plate count was not within the limit |
| 3 | Ammonium formate of pH-2.5 with formic acid | Acetonitrile+Buffer (50+50) | Phenyl column 100 mmx2.1 mm, 1.7µ | 0.2 ml/min | Un known peak was formed |
| 4 | Ammonium formate of pH-2.5 with formic acid | Acetonitrile+Buffer (55+45) | Phenyl column 100 mmx2.1 mm, 1.7µ | 0.2 ml/min | Less resolution between first and second peaks |
| 5 | Ammonium formate of pH-2.5 with formic acid | Acetonitrile+Buffer (60+40) | Phenyl column 100 mmx2.1 mm, 1.7µ | 0.2 ml/min | This method is suitable for validation |
| 6 | Ammonium formate of pH-2.5 with formic acid | Acetonitrile+Buffer (60+40) | Phenyl column 100 mmx2.1 mm, 1.7µ | 0.2 ml/min | In this method, USP tailing was less than 2, USP plate count was greater than 2000 and USP resolution was found to be greater than 2 min for all three peaks. |
Table 2: Optimized chromatogram results
| S. No. | Name | Mean area | Mean USP tailing | Mean USP plate count | Mean USP resolution |
| 1 | Lopinavir | 46383 | 1.09 | 12485 | |
| 2 | Nirmatrelvir | 75133 | 1.05 | 17362 | 10.62 |
| 3 | Ritonavir | 28425 | 1.12 | 10150 | 6.37 |
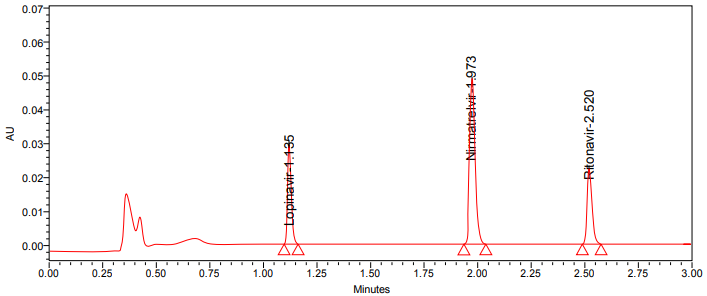
Fig. 2: Optimized chromatogram
Method validation
In line with USFDA guidelines [17, 18], the method was validated for selectivity [19, 20], matrix effect, recovery, precision, accuracy, and stability.
Selectivity
No significant interference from endogenous plasma components was observed at the retention times of the analytes and internal standard.
Matrix effect and recovery
Matrix effect was evaluated by comparing the peak areas of post-extraction spiked samples with neat standards. Recovery was calculated by comparing the peak areas of extracted samples with those of unextracted standards at equivalent concentrations.
Precision and accuracy
Intra-day and inter-day precision and accuracy were evaluated at four QC levels (LLQC, LQC, MQC, HQC). Precision (%CV) was within 15%, and accuracy was within 85-115%.
Stability
Stability was evaluated across multiple conditions, including bench-top, auto-sampler, freeze-thaw cycles, and prolonged storage.
RESULTS
Linearity
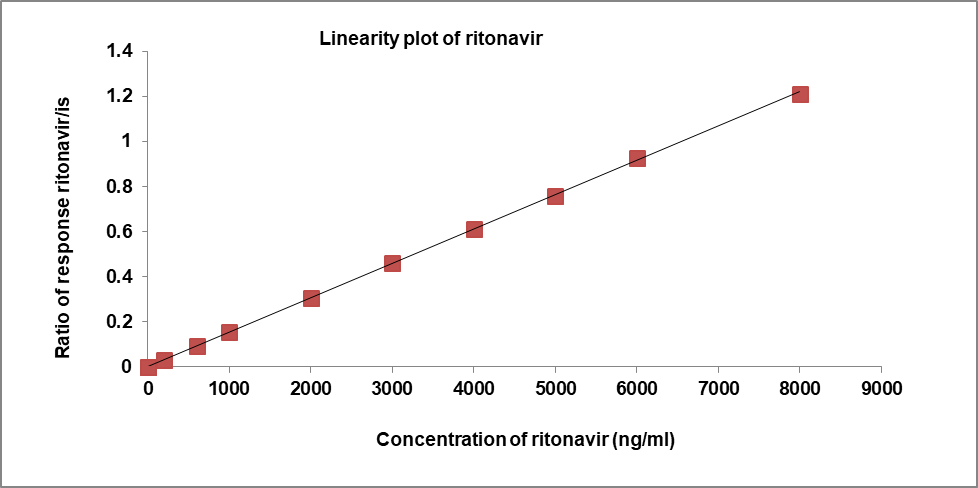
The peak area ratio of calibration standards [21, 22] was proportional to the concentration. The concentration range of Nirmatrelvir is 300-12000 ng/ml and Ritonavir is 200-8000 ng/ml. Linearity results of Nirmatrelvir and Ritonavir were shown in following table 3 and their calibration plots [23, 24] were shown in fig. 3. The calibration curves of Niramtrelvir and Ritonavir were appeared linear and Slope, intercept, coefficient of correlation were found to be 0.000269, 0.000692, 0.99994 and 0.000152, 0.001423, 0.99985.
Matrix effect
The matrix effects [25, 26] were investigated for six lots of different samples of plasma at the LQC and HQC levels were prepared from different lots of plasma (i. e., a total of 36 QC samples). Percent RSD (Relative Standard Deviation) for within the signal, ion suppression/enhancement was observed as 1.0 percent for Nirmatrelvir and Ritonavir in UPLC, suggesting that under these circumstances, the matrix effect on analyte ionization is within an acceptable range of ionization. In matrix effect, LQC and HQC of Nirmatrelvir were 97.18, 97.01 and Ritonavir were 97.50, 97.58%. % CV of the both drugs at LQC level were 1.03, 2.28 and HQC level is 0.52, 0.56 respectively. It indicates that the matrix effect on the ionization of the analytes were within the suitable limit. Table 4 gives the recovery results.
Recovery
The recoveries [27, 28] for Nirmatrelvir and Ritonavir at LQC, MQC and HQC levels the results demonstrated that the bioanalytical method had good extraction efficiency. This also showed that the recovery wasn’t hooked into concentration. Table 4 gives the recovery results.
Table 3: Linearity findings for nirmatrelvir and ritonavir
| Linearity | Nirmatrelvir | Ritonavir | ||
| Conc. (ng/ml) | Area response ratio | Conc. (ng/ml) | Area response ratio | |
| 1 | 0 | 0.0 | 0 | 0.0 |
| 2 | 300.00 | 0.081 | 200.00 | 0.032 |
| 3 | 900.00 | 0.246 | 600.00 | 0.093 |
| 4 | 1500.00 | 0.402 | 1000.00 | 0.153 |
| 5 | 3000.00 | 0.806 | 2000.00 | 0.303 |
| 6 | 4500.00 | 1.209 | 3000.00 | 0.462 |
| 7 | 6000.00 | 1.620 | 4000.00 | 0.611 |
| 8 | 7500.00 | 2.022 | 5000.00 | 0.759 |
| 9 | 9000.00 | 2.396 | 6000.00 | 0.926 |
| 10 | 12000.00 | 3.212 | 8000.00 | 1.212 |
| Slope | 0.000269 | 0.000152 | ||
| Intercept | 0.000692 | 0.001423 | ||
| CC | 0.99994 | 0.99985 |

A
B
Fig. 3: Calibration plots of (A) Nirmatrelvir and (B) Ritonavir
Table 4: Recovery results for nirmatrelvir and ritonavir
| Analyte | Concentration (ng/ml) | Recovery (%) | |||
| Extracted | Un extracted | ||||
| Mean | STD Dev | Mean | STD Dev | ||
| Nirmatrelvir | HQC (9000 ng/ml) | 97.34% | 0.00524 | 98.81% | 0.02535 |
| MQC (6000 ng/ml) | 97.34% | 0.04528 | 97.62% | 0.01985 | |
| LQC (900 ng/ml) | 97.17% | 0.00632 | 97.75% | 0.00847 | |
| Ritonavir | HQC (6000 ng/ml) | 96.95% | 0.00784 | 97.13% | 0.06394 |
| MQC (4000 ng/ml) | 97.31% | 0.00569 | 97.80% | 0.00089 | |
| LQC (600 ng/ml) | 96.80% | 0.00125 | 97.73% | 0.00421 | |
(n=6)
Table 5: Precision and accuracy results
| Parameter | HQC | MQC | LQC | LLQC |
| Nirmatrelvir | ||||
| N | 6 | 6 | 6 | 6 |
| Mean | 111282 | 74260 | 10993 | 3623 |
| SD | 961.02 | 121.16 | 226.474 | 43.592 |
| % CV | 0.86 | 0.16 | 2.06 | 1.20 |
| % mean Accuracy | 98.60% | 98.70% | 97.40% | 96.31% |
| Ritonavir | ||||
| N | 6 | 6 | 6 | 6 |
| Mean | 41824 | 27694 | 4172 | 1374 |
| SD | 154.37 | 261.176 | 51.783 | 49.701 |
| % CV | 0.37 | 0.94 | 1.24 | 3.62 |
| % mean Accuracy | 97.91% | 97.24% | 97.66% | 96.49% |
Precision and accuracy
By pooling all individual assay results of different internal control samples, the accuracy and precision [29, 30] were calculated. It was obvious, based on the data provided, that the strategy was precise and effective. Nirmatrelvir accuracy results in quality control samples 96.31-98.70 and Ritonavir accuracy results in quality control samples 96.49-97.91. Nirmatrelvir and Ritonavir CV is<5% of total internal control samples. Table 5 shows the precision and accuracy results.
Ruggedness
The percent recoveries and percent CV of Nirmatrelvir and Ritonavir determined with two different analysts and on two different columns were within acceptable criteria in HQC, LQC and MQC samples. The percent recoveries ranged from 96.88 – 97.60% for Nirmatrelvir and 96.52%-97.44% for Ritonavir. The %CV values ranged from 0.42-1.28 for Nirmatrelvir and 0.30 – 2.19 for Ritonavir. The results proved method is rugged [31, 32].
Stability
The benchtop stability of Nirmatrelvir and Ritonavir was investigated by a stock solution prepared and stored at room temperature for 18 h. In the case of autosampler stability, the stock solution was stored for 24h in autosampler at room temperature and gave reliable stability behavior under these conditions. In order to assess freeze freeze-thaw stability, the stock arrangement was stored for 24 h at (-28±5) °C. For wet extract stability, the stock solution was stored for 18h at (2-8) °C and for dry extract stability, the stock was stored for 18h at (-20±3) °C. The short-term stability shows that the stability of drugs was stored for 7 days at (5±3) °C, and in long-term stability, the stock was stored for 28 days at (-20±3) °C and inject into the UPLC. Compare the stability results of freshly arranged stock solution with a stock solution made before 24h. % change of Nirmatrelvir and Ritonavir was 1.35% and 0.92%, respectively, which indicates that solutions are stable up to 24h. At room temperature, Nirmatrelvir and Ritonavir were stable in plasma for different conditions. It was evaluated that LQC, MQC, and HQC levels continued freezing, and defrosting of plasma specimens spiked with Nirmatrelvir and Ritonavir didn’t influence its stability. It was clear from long term stability that Nirmatrelvir and Ritonavir were stable at a capability temperature of-30 °C up to 24h. The overall stability results [33, 34] of Nirmatrelvir and Ritonavir are shown in table 6.
Both drugs were stable under all tested conditions with %CV values within the acceptable range.
Table 6: Stability results
| Stability | Storage condition | Conc. level | Nirmatrelvir | Ritonavir | ||
| Recovery (%) | Mean area±SD | Recovery (%) | Mean area±SD | |||
| Bench top stability | 18 h at room temperature | LQC | 97.42 | 10995±162.710 | 97.29 | 4156±32.221 |
| MQC | 97.05 | 73022±167.355 | 97.07 | 27645±194.394 | ||
| HQC | 97.87 | 110451±1128.98 | 97.82 | 41789±185.729 | ||
| Auto sampler stability | 24 h in auto sampler | LQC | 96.89 | 10935±130.203 | 96.84 | 4137±43.709 |
| MQC | 97.01 | 72989±559.579 | 97.82 | 278.59±500.50 | ||
| HQC | 97.87 | 110451±1578.910 | 97.06 | 41464±284.91 | ||
| Long term stability | 28 days at (-20±3) °C | LQC | 84.68 | 9557±24.493 | 84.72 | 3619±43.660 |
| MQC | 85.23 | 64127±222.49 | 85.28 | 24288±188.504 | ||
| HQC | 86.11 | 97179±182.45 | 86.59 | 36992±246.596 | ||
| Freeze thaw stability | 24h at (-28±5) °C |
LQC | 96.69 | 10912±42.838 | 96.68 | 4130±48.201 |
| MQC | 97.85 | 73622±228.64 | 97.20 | 27682±148.307 | ||
| HQC | 97.33 | 109851±1390.661 | 97.82 | 41789±169.78 | ||
| Wet extract stability | 18h at 2-8 °C |
LQC | 96.44 | 10884±54.851 | 95.51 | 4080±53.452 |
| MQC | 97.46 | 73327±231.68 | 97.20 | 27683±205.90 | ||
| HQC | 97.21 | 109715±205.79 | 96.93 | 41409±166.94 | ||
| Dry extract stability | 18h at (-20±3) °C |
LQC | 96.36 | 10875±34.679 | 95.63 | 4085±52.006 |
| MQC | 97.65 | 73470±164.976 | 96.85 | 27583±286.19 | ||
| HQC | 97.54 | 110050±629.63 | 97.05 | 41459±365.13 | ||
| Short term stability | 7 days at (5±3) °C | LQC | 92.69 | 10461±57.032 | 92.75 | 3962±82.638 |
| MQC | 94.97 | 71452±243.32 | 93.98 | 26764±166.02 | ||
| HQC | 93.73 | 105784±2934.89 | 94.95 | 40562±274.01 | ||
(n=6)
Pharmacokinetics
For investigating pharmacokinetic parameters of Nirmatrelvir and Ritonavir, market formulation dosage of 2.5 mg/1 kg Nirmatrelvir and 1.67 mg/1 kg Ritonavir was given into rat body as oral administration and to obtain mean plasma concentration-time profiles (fig. 4). Nirmatrelvir and Ritonavir demonstrate significant differences in pharmacokinetic studies after oral administration. We collected the samples from the rat body in different time periods, like 0.5, 1, 2, 3, 4, 5, 6, and 7 h from the administered time of the drugs into the rat body. After that test sample was prepared and injected into the chromatographic system to record the values. The calculated accurate bioavailability of dosage of oral administration, Cmax after oral administration of Nirmatrelvir and Ritonavir (5597.35 and 1938.71), Tmax (3 h and 3 h), the pharmacokinetic parameters Cmax, Tmax, T1/2, AUC0-t, AUC0-∞, were calculated and the data is shown in table 7. The t½ values were 6 h and 6 h, respectively for Nirmatrelvir and Ritonavir. The AUC0-t for Nirmatrelvir and Ritonavir were found to be 413.7 and 13959 ng-h/ml, respectively.
Table 7: Pharmacokinetic parameters of nirmatrelvir and ritonavir
| Pharmacokinetic parameters | Nirmatrelvir | Ritonavir |
| AUC0-t | 413.77 ng-h/ml | 13959 ng-h/ml |
| Cmax | 5597.354 ng/ml | 1938.714 ng/ml |
| AUC0-∞ | 413.77 ng-h/ml | 13959 ng-h/ml |
| tmax | 3 H | 3 H |
| T1/2 | 6 H | 6 H |
AUC0−∞: Area under the curve extrapolated to infinity, AUC0−𝑡: Area under the curve up to the last sampling time, Cmax: The maximum plasma concentration, Tmax: The time to reach peak concentration, T1/2: Time the drug concentration

A

B
Fig. 4: Graph depicting the time course of mean plasma concentrations of (A) Nirmatrelvir and (B) Ritonavir
DISCUSSION
The UPLC method developed for the simultaneous quantification of Nirmatrelvir and Ritonavir in rat plasma was rigorously validated and proved to be both efficient and reliable. The system suitability tests [35] demonstrated that the retention times and area ratios for both Nirmatrelvir and Ritonavir were consistent, with %CV values well within acceptable limits. Specifically, for Nirmatrelvir, the %CV for retention time was 0.97%, and for area ratio, it was 0.34%. Similarly, for Ritonavir, the %CV for retention time was 0.56%, and for area ratio, it was 0.46%.
The auto-sampler carryover effect was negligible, with carryover responses in subsequent injections being less than 15%, ensuring no significant contamination between samples. Specificity tests revealed no interfering peaks at the retention times of the analytes and the internal standard, confirming the method's ability to accurately quantify Nirmatrelvir and Ritonavir in the presence of other plasma components.
Sensitivity tests demonstrated that the method could reliably detect and quantify Nirmatrelvir and Ritonavir at their respective lower limits of quantification (LLOQ), with %CV values of 0.52% and 1.42%, respectively, and mean accuracies close to 96%. This high sensitivity is critical for pharmacokinetic studies, where low drug concentrations need to be accurately measured.
Matrix effect evaluations indicated minimal influence of plasma constituents on the analytes' ionization, with matrix factor biases within acceptable ranges and %CV values below 5% for both analytes. This ensures that the method is reliable across different plasma samples [36, 37].
Linearity tests showed excellent correlation coefficients (r²) of 0.99994 for Nirmatrelvir and 0.99985 for Ritonavir over the concentration ranges tested, indicating that the method provides accurate and proportional responses across a wide range of concentrations. The precision and accuracy tests confirmed that the method consistently produces reliable results, with intra-day and inter-day %CV values within 15% for all quality control levels.
Nirmatrelvir and Ritonavir showed high and consistent recoveries from plasma, with mean recoveries of 97.34% and 97.31%, respectively, ensuring that the extraction procedure effectively isolates the analytes without significant loss.
Stability studies showed that both Nirmatrelvir and Ritonavir were stable across diverse conditions, including bench-top, auto-sampler, freeze-thaw, wet extract, dry extract, and long-term storage. %CV values for stability tests were within acceptable limits, confirming that the analytes remain stable throughout the sample handling and analysis process.
Pharmacokinetic studies in rats revealed that both drugs are rapidly absorbed, with peak plasma concentrations occurring around 3 h post-administration. The calculated pharmacokinetic parameters, including AUC0-t, Cmax, and t1/2, were consistent with expected values, demonstrating the method's applicability for detailed pharmacokinetic profiling.
CONCLUSION
For the primary time new UPLC method was developed and validated for the determination of Nirmatrelvir and Ritonavir in rat plasma. Here, the described method is rugged, fast, reproducible bio analytical method. This method was validated according to USFDA guidelines. Simple and efficient method was developed and may be utilized in pharmacokinetic studies and to see the investigated analyte in body fluids.
ACKNOWLEDGEMENT
The authors express their heartfelt appreciation to the administration of Dr. Samuel George Institute of Pharmaceutical Sciences, ANU University, Guntur, for granting them access to the facilities that greatly supported their research efforts.
FUNDING
There is no funding to report
LIST OF ABBREVIATIONS
UPLC: Ultra Performance Liquid Chromatography, USFDA: U. S. Food and Drug Administration, HPLC: High-Performance Liquid Chromatography, LCMS: Liquid Chromatography-Mass Spectrometry, LLQC: Lower Limit of Quality Control, LQC: Lower Quality Control, MQC: Middle-Quality Control, HQC: High-Quality Control, CV: Coefficient Variance, RSD: Relative Standard Deviation
AUTHORS CONTRIBUTIONS
Gope Edward Raju collected the literature and information about the drug and carried out the research samples and prepared the manuscript. Suneetha Yaparthi supported solution preparation in analysis. Srikanth Pottendla check the data and reviewed the article.
CONFLICTS OF INTERESTS
The authors report no financial or any other conflicts of interest in this work.
REFERENCES
Phungpis B, Hahnvajanawong V. 1-Butyl-3-methylimidazolium bromide as a solvent and precatalyst for stetter reaction. Asian J Chem. 2020;32(8):2028-32. doi: 10.14233/ajchem.2020.22711.
Singh B, Lal C, Kumar N. Utilization of mixed naphthol green b and janus green b dyes as photosensitier in photogalvanic cell for solar energy conversion and storage. Asian J Chem. 2020;32(8):1914-20. doi: 10.14233/ajchem.2020.22712.
Kausar R, Nayak P, Desai M. Comparative analysis of HPLC and UPLC for the estimation of antiviral drugs in biological matrices. J Appl Pharm Sci. 2021;34:456-62. doi: 10.14233/ajchem.2021.22713.
Yin L, Chen S, HU Q. Advancements in bioanalytical methods: UPLC versus HPLC. J Appl Pharm Sci. 2021;32:299-306. doi: 10.14233/ajchem.2021.22714.
Booth BP. Welcome to bioanalysis. Bioanalysis. 2009;1(1):1-2. doi: 10.4155/bio.09.4.
Fadlelmula AA, Al Ghamdi AY, Abdalla MO. In vitro antioxidant activity total phenolic content and antimicrobial activity of coleus forskohlii grown in albaha Saudi Arabia. Asian J Chem. 2020;32(8):2033-7. doi: 10.14233/ajchem.2020.22716.
Satpute BS, Kale SS, Jadhav Aishwarya AA, Ubale A, Mane YM. Analytical method development and validation of RP-HPLC for nirmatrelvir and ritonavir in combined tablet dosage form by using simultaneous estimation method. IJNRD. 2024;9(6):753-74.
Rani J DB, C AD. Development of a simple, accurate method validation and its degradation studies of nirmatrelvir ritonavir in bulk and marketed formulation by RP-HPLC. IJPQA. 2023;14(3):740-4. doi: 10.25258/ijpqa.14.3.47.
Imam MS, Batubara AS, Gamal M, Abdelazim AH, Almrasy AA, Ramzy S. Adjusted green HPLC determination of nirmatrelvir and ritonavir in the new FDA-approved co-packaged pharmaceutical dosage using supported computational calculations. Sci Rep. 2023;13(1):137. doi: 10.1038/s41598-022-26944-y, PMID 36599900.
Quazi Saifuddin, Saleem Khan. Drug discovery and its applications. Asian J Pharm Res Dev. 2024;12(5):8-10. doi: 10.22270/ajprd.v12i5.1479.
Sindhu M, Farana M, Bhavani M, Dandamudi SP, Dk SP, Bakshi V. Stability indicating RP-HPLC method for simultaneous estimation of Nirmatrelvir and ritonavir in bulk and tablets. Res J Pharm Technol. 2025;18(2):594-8. doi: 10.52711/0974-360X.2025.00088.
Pallavi S, Sowjanya G. Development and validation of a new RP-UPLC method for the simultaneous estimation of nirmatrelvir and ritonavir in bulk and co-packed tablet dosage forms. Res J Pharm Technol. 2023;16(9):4370-6. doi: 10.52711/0974-360X.2023.00715.
Martens Lobenhoffer J, Boger CR, Kielstein J, Bode Boger SM. Simultaneous quantification of nirmatrelvir and ritonavir by LC-MS/MS in patients treated for COVID-19. J Chromatogr B Analyt Technol Biomed Life Sci. 2022 Dec 1;1212:123510. doi: 10.1016/j.jchromb.2022.123510, PMID 36274268.
Veerareddy V, Gandla KS. Development and validation of a new RP-HPLC method for the simultaneous estimation of nirmatrelvir ritonavir and molnupiravir in formulated nanosponges plasma samples and its pharmacokinetic study. Ind J Pharm Educ Res. 2024;58(4):1299-310. doi: 10.5530/ijper.58.4.142.
Ramadevi P, Rambabu K. Bio analytical method development and validation for ezetimibe and pitavastain and its applications to pharmacokinetic studies in rat plasma by using LCMS/MS. Int J Res Pharm Sci. 2020;11(4):7854-62. doi: 10.26452/ijrps.v11i4.4670.
Eluru A, Surendra Babu K. Bioanalytical method development and validation for aplidine in rat plasma and their pharmacokinetic studies by LCMS. WJPPS. 2019;8:1201-9. doi: 10.20959/wjpps201911-15023.
Ramchandran D, Kethipalli A, Krishnamurthy M. Bio-analytical method development and validation of daunorubicin and cytrarabine in rat plasma by LC-MS/MS and its application in pharmacokinetic studies. J Pharm Sci Res. 2020;12(20):381-6.
Naykode MD, Bhagwat DA, Jadhav SD, More HN. Analytical and bio analytical method for quantification of pure azilsartan not its salts by RP-HPLC. Res J Pharm Technol. 2017;10(4):708-14. doi: 10.5958/0974-360X.2017.00204.9.
Singh M, Charde M, Shukla R, Rita MC. Determination of calcipotriene in calcipotriene cream 0.05% w/w by RP-HPLC method development and validation. Res J Pharm Technol. 2011;4(8):1219-23.
Sellappan M, Natarajan A. Development and validation of stability indicating simultaneous estimation of metformin and alogliptin in tablets by high-performance thin layer chromatography. Int J Pharm Pharm Sci. 2020;12(12):68-73. doi: 10.22159/ijpps.2020v12i12.33871.
D SR, GM, Shivkumar K, Thangavel G. Development and validation of HPLC method for simultaneous quantification of vasicine glycyrrhizin and piperine in polyherbal cough syrup. Int J Curr Pharm Sci. 2020;12(2):15-9. doi: 10.22159/ijcpr.2020v12i2.37480.
Shanmugasundaram P, Kamarapu SK. RP-HPLC method for the simultaneous estimation and validation of amlodipine besylate and atenolol in bulk and tablet dosage form in biorelevant dissolution medium (Fassif). Res J Pharm Technol. 2017;10(10):3379-85. doi: 10.5958/0974-360X.2017.00601.1.
Gomathy S, Narenderan S, T Meyyanathan S, N Gowramma B. Development and validation of HPLC method for the simultaneous estimation of apigenin and luteolin in commercial formulation. J Crit Rev. 2020;7:4785-90. doi: 10.31838/jcr.07.19.560.
Kumar SA, Debnath A, Rao JV, Sankar DG. Development and validation of a sensitive RP-HPLC method for simultaneous estimation of rosuvastatin and fenofibrate in tablet dosage form by using PDA detector in gradient mode. Res J Pharm Technol. 2016;9(5):549-54. doi: 10.5958/0974-360X.2016.00104.9.
Rao KP, babu NL, Koganti K, Palakeeti B, Srinivas KS. Related substances method development and validation of an LCMS/MS method for quantification of selexipag and its related impurities in rat plasma and its application to pharmacokinetic studies. SN Appl Sci. 2021;3(3). doi: 10.1007/s42452-021-04219-x.
Gadhvi MP, Bhandari A, Suhagia BN, Desai UH. Development and validation of RP-HPLC method for simultaneous estimation of atazanavir and ritonavir in their combined tablet dosage form. Res J Pharm Technol. 2013;6(2):200-3.
Al bathish MY, Gazy AA, El Jamal MK. RP-HPLC and chemometric methods for the determination of two anti-diabetic mixtures; metformin hydrochloride canagliflozin and metformin hydrochloride gliclazide in their pharmaceutical formulation. Int J Pharm Pharm Sci. 2019;12(2):83-94. doi: 10.22159/ijpps.2020v12i2.35415.
Kumar AK, Sudha V, Vijayakumar A, Padmapriyadarsini C. Simultaneous method for the estimation of bidaquiline and delamanid in human plasma using high-performance liquid chromatography. Int J Pharm Pharm Sci. 2021;13(6):36-40. doi: 10.22159/ijpps.2021v13i6.40853.
Harahap Y, Steven S, Suryadi H. Development and validation of a UPLC-MS/MS method with volumetric absorptive microsampling to quantitate cyclophosphamide and 4-hydroxycyclophosphamide. Front Pharmacol. 2022 Aug 11;13:928721. doi: 10.3389/fphar.2022.928721, PMID 36034779.
Sura RS, CVS S, Rachamalla SS. Bioanalytical RP-HPLC method development and validation of clopidogrel bisulfate in wistar rat plasma and its application to pharmacokinetic study. Int J App Pharm. 2022;14(1):106-11. doi: 10.22159/ijap.2022v14i1.43328.
Thomas A, Varkey J. Development and validation of a new RP HPLC analytical method for the determination of etodolac succinic acid co-crystals in spiked rabbit plasma. Int J Curr Pharm Sci. 2023;15(2):59-63. doi: 10.22159/ijcpr.2023v15i2.2098.
Halder D, Das S, Ghosh B, Biswas E, Roy S, Bose A. An LC-MA/MS based bioanalytical approach to resolve a pharmacokinetic investigation of acotiamide hydrochloride and its application to a bioequivalence study. Int J Pharm Pharm Sci. 2020;12(10):76-84. doi: 10.22159/ijpps.2020v12i10.38410.
Korake S, Pawar A, Surywanshi S, Bothiraja C, Pawar A. High-performance liquid chromatography for the simultaneous estimation of cefoperazone and sulbactam in rat plasma and its importance in therapeutic drug monitoring. Int J Pharm Pharm Sci. 2020;12(10):92-7. doi: 10.22159/ijpps.2020v12i10.38638.
Kantipudi R, Pavuluri SK. Bioanalytical method development and validation for the simultaneous estimation of olanzapine and samidorphan in rabbit plasma by using HPLC–MS/MS and application to pharmacokinetic study. Futur J Pharm Sci. 2024;10(1). doi: 10.1186/s43094-023-00570-5.
Talari S, Vejendla A, Shetty RK. Development and validation of a UPLC-MS/MS method for the simultaneous determination of verapamil and trandolapril in rat plasma: application to a pharmacokinetic study. Curr Pharm Anal. 2022;18(3):291-304. doi: 10.2174/1573412917666210302145711.
Talari S, Vejendla A, Boddapati SN, Kalidindi J. LC-MS/MS method development and validation of lenvatinib and its related impurities in rat plasma: application to a pharmacokinetic study. Curr Pharm Anal. 2022;18(6):614-28. doi: 10.2174/1573412918666220330004440.
Baje Syed I, Nannapaneni M. Bio analytical validation method for capmatinib and spartalizumab in rabbit plasma by using highly effective mass spectrophotometric method. Rasayan J Chem. 2022;15(4):2748-55. doi: 10.31788/RJC.2022.1547098.