
Int J App Pharm, Vol 17, Issue 4, 2025, 254-267Original Article
SCREENING AND CHARACTERIZATION OF FAVIPIRAVIR-LOADED NANOSTRUCTURED LIPID CARRIER FORMULATIONS BY USING A 26-2 FRACTIONAL FACTORIAL DESIGN
MAXIUS GUNAWAN1, DAVID G. FERNIG2, VEERAKIET BOONKANOKWONG3*
1Graduate Program of Industrial Pharmacy, Faculty of Pharmaceutical Sciences, Chulalongkorn University, Bangkok 10330, Thailand. 2Department of Biochemistry, Systems and Cell Biology, Institute of Systems, Molecular and Integrated Biology, University of Liverpool, Liverpool L69 7ZB, United Kingdom. 3Department of Pharmaceutics and Industrial Pharmacy, Faculty of Pharmaceutical Sciences, Chulalongkorn University, Bangkok 10330, Thailand
*Corresponding author: Veerakiet Boonkanokwong; *Email: veerakiet.b@pharm.chula.ac.th
Received: 06 Feb 2025, Revised and Accepted: 09 May 2025
ABSTRACT
Objective: Favipiravir (FVP), an RNA-dependent RNA polymerase inhibitor with low solubility and bioavailability, was encapsulated and optimized into Nanostructured Lipid Carriers (NLC) to improve solubility and control its release profile.
Methods: The FVP-NLC formulation was screened using a 26-2 fractional factorial design with 6 critical parameters at 2 levels, which were solid lipid combination (Glyceryl Monostearate (GMS) and combination with Cetyl Alcohol (CA) (1:1)), liquid lipid combination (Medium-Chain Triglycerides (MCT) oils and combination with Ethyl Oleate (EO) (1:1)), solid to liquid lipid ratio (70:30 to 90:10), concentrations of total lipid (2-5% w/v), surfactant (Tween® 80, 2-5% w/v), and co-surfactant (Labrasol®, 1-2% w/v). Sixteen formulas were obtained. FVP-NLC was fabricated using high-shear homogenization (12,000 rpm for 10 min), tandem ultrasonication (amplitude 40% for 5 min), followed by characterization of particle size, polydispersity index, zeta potential, and entrapment efficiency. The optimum formula was further evaluated for in vitro release and kinetics study, as well as short-term stability study under refrigerator (5±3 °C), room temperature (25±2 °C, 60±5% RH), and climatic chamber (40±2 °C, 75±5% RH) for 15 d.
Results: The major contributions of parameters were total lipid (32%), co-surfactant concentration (30%), and solid lipid combination (15%). The best formulation was F3 with total lipid 2% w/v, co-surfactant 2% w/v, and GMS showing small particle size (124.1±1.8 nm), polydispersity index (0.1387±0.0043), and zeta potential (-39.06±2.00 mV), with high entrapment efficiency (85.97±0.06% w/v). In vitro release from F3 demonstrated controlled release with diffusion mechanisms for up to 24 h at pH 7.4, following Korsmeyer-Peppas kinetics (R² = 0.9171, n = 0.231). In addition, the short-term stability study revealed that F3 has consistent physicochemical properties for 15 d in all conditions.
Conclusion: The 26-2 fractional factorial design has been successfully utilized in screening FVP-NLC formulation to incorporate FVP into the NLC matrix system.
Keywords: Favipiravir, Nanostructured lipid carriers, Quality by design, Screening formulation
© 2025 The Authors. Published by Innovare Academic Sciences Pvt Ltd. This is an open access article under the CC BY license (https://creativecommons.org/licenses/by/4.0/)
DOI: https://dx.doi.org/10.22159/ijap.2025v17i4.53891 Journal homepage: https://innovareacademics.in/journals/index.php/ijap
INTRODUCTION
Favipiravir (FVP) is an RNA-dependent RNA polymerase inhibitor that can be utilized in the treatment of viral infections such as those caused by influenza, Ebola, and SARS-CoV-2 [1, 2]. FVP is classified under the Biopharmaceutical Classification System (BCS) as a Class II compound characterized by limited aqueous solubility, measured at 0.822 mg/ml [3]. Despite its poor solubility, it exhibits high permeability across Caco-2 cell monolayers, with permeability values ranging from 1.09 × 10⁻⁵ to 1.35 × 10⁻⁵ cm/s, both in the presence and absence of a P-gp inhibitor [4]. Nevertheless, the poor water-soluble property of FVP hinders its effectiveness of FVP, which can lead to low bioavailability of FVP [5].
Nanostructured Lipid Carriers (NLC) are a refined system derived from Solid Lipid Nanoparticles (SLN), consisting of a mixture of solid and liquid lipids in the matrix core, surrounded by surfactants and co-surfactants in the outer layer of the system. NLC can encapsulate hydrophobic drugs with low solubility inside the core due to the similarity of hydrophobicity between poorly soluble drugs and lipids [6]. In addition, the nanosized scale of NLC can also enhance the dissolution rate of drugs due to the high surface area in contact with body fluids [7]. Therefore, FVP, as a hydrophobic drug, could be loaded into the NLC matrix system (FVP-NLC) to improve the FVP solubility, which is directly linked to its bioavailability enhancement. To the best of the author's knowledge, to date, such FVP-NLC formulations have yet to be developed.
To develop FVP-NLC, the present study investigated and screened various FVP-NLC formulation parameters by using a 26-2 fractional factorial design. The fractional factorial design has the ability to efficiently screen multiple formulation variables while reducing the number of experimental runs compared to a full factorial design. This design can also provide an evaluation of the main effects and primary interactions with robust statistical analysis [8]. This approach thus identifies the most influential parameters affecting FVP-NLC physicochemical characteristics, which could then be further refined using various response surface methodologies, such as Box Behnken design or central composite design in subsequent optimization studies [9].
In this present study, we utilized Glyceryl Monostearate (GMS) only and in combination with Cetyl Alcohol (CA) as solid lipids in the NLC matrix system. The glycerol ester of stearic acid (GMS) and fatty alcohol (CA) have been widely used in NLC to provide a sustained release profile and enhanced drug stability. Most recent studies have focused on using a single type of solid lipid in NLC formulations, with limited exploration into binary lipid combinations. Moreover, the effect of a combination of GMS and CA as dual solid lipids in the NLC matrix system has not been explored. Here, we specifically investigated the combination of these two solid lipids to evaluate potential synergistic effects on the physicochemical properties of NLC. For liquid lipids, Medium-Chain Triglycerides (MCT) and Ethyl Oleate (EO) as mono-esterified oils were used in the NLC formulations due to their ability to prevent crystallization as well as improve drug solubility. The combination of these two types of liquid lipids was considered to have the potential to improve the physicochemical properties of the NLC matrix system due to the different structures of the lipids, which could create more imperfections in the crystal lattice. Similarly to solid lipids, the effect of combining liquid lipids, which in this instance are MCT oils and EO, has not been reported. The common ratio for solid-to-liquid ratios in NLC formulation is 70:30 to 99.9:0.1 [10]. Although higher solid lipids may have more sustained release properties, drug repulsion will occur due to the high crystallinity of solid lipids. Therefore, in this study, we aimed to combine solid and liquid lipids at 70:30 to 90:10 because higher liquid lipids may enhance drug encapsulation efficiency [11]. In addition, higher lipid concentration will enhance sustained release properties but also increase the particle size of the NLC matrix system. Therefore, optimization is needed to obtain a stable NLC formulation with good release properties.
Another critical parameter in the NLC matrix system is the high interfacial tension between aqueous and lipid phases, which can hinder efficient droplet formation and lead to particle aggregation. To address this, surfactants and co-surfactants are added to reduce the surface tension of lipids and water [7, 11]. Tween® 80 and Labrasol® were chosen as surfactants and co-surfactants in the NLC formulation. Tween® 80 is a non-ionic surfactant widely used for stabilizing dispersions. The incorporation of surfactants within the range of 1% w/v to 5% w/v is commonly utilized in NLC matrix systems to enhance emulsion stability [12]. In a previous study, Tween® 80 at a concentration of 2% w/w was utilized to formulate a stable NLC matrix, demonstrating its efficacy in maintaining system homogeneity and preventing phase separation [13]. Therefore, in this study, we investigated the effect of Tween® 80 concentration from 2% w/v to 5% w/v to screen its influence on the physicochemical properties of the NLC system. The cosurfactant further lowers interfacial tension and enhances the flexibility of the interface. Labrasol® (capryl caproyl polyoxyl-8 glycerides), the cosurfactant used in the NLC formulation, is a non-ionic PEGylated co-surfactant with strong solubilizing and penetration-enhancing properties across the intestinal membrane [14]. Previous studies have demonstrated that Labrasol® at concentrations ranging from 0.1% w/v to 4% w/v could enhance intestinal permeability and facilitate drug absorption in rat models [15, 16]. However, elevated concentrations have been associated with histopathological alterations, including erosion at the villi. Accordingly, in the present study, Labrasol® was employed at concentrations of 1% w/v- 2% w/v to optimize the permeation-enhancing effect while minimizing the risk of mucosal damage.
Thus, the present work aimed to explore the potential development of FVP-NLC, focusing on screening critical parameters, including solid lipid combination, liquid lipid combination, solid lipid and liquid lipid ratios, total lipid concentration, surfactant concentration, and co-surfactant concentration that influence its physicochemical properties, such as particle size, polydispersity index (PDI), zeta potential, and entrapment efficiency. Furthermore, the best formulation of FVP-NLC in the screening study was further evaluated for in vitro dissolution to evaluate the release and kinetics analysis of FVP from the NLC matrix system, as well as its short-term stability in various conditions to establish this important parameter.
MATERIALS AND METHODS
Materials
FVP manufactured by Aurore Pharmaceuticals, India, with an assay of 100.19 %w/w on an anhydrous basis, and FAVIR® (GPO) tablets containing FVP 200 mg in each tablet, were kindly donated by the Government Pharmaceutical Organization of Thailand (Thai GPO). GMS was procured from S. Tong Chemicals (Thailand), while CA was obtained from Phitsanuchemicals (Thailand). MCT oils were sourced from Mead Johnson and Company (USA), and EO was supplied by Sigma-Aldrich (USA). Tween® 80 was acquired from S. Tong Chemicals (Thailand), and Labrasol® was imported from Gattefossé (France). All other chemicals and solvents used in the study were of analytical grade. Ultrapure water (Millipore, USA) was utilized for all sample preparations.
Screening formulation design
Formulations of FVP-NLC were designed and screened using the 26-2 fractional factorial design by varying 6 critical parameters, solid lipid combination, liquid lipid combination, solid lipid and liquid lipid ratios, total lipid concentration, surfactant concentration, and co-surfactant concentration at 2 levels, and 16 formulas were obtained. The formulation of NLC contains GMS and/or CA as solid lipids, MCT oils and/or EO as liquid lipids, Tween® 80 as surfactants, and Labrasol® as co-surfactants. Table 1 shows the independent variables utilized in the screening formulation design of experiments of a 26-2 fractional factorial design with 6 parameters and 2 levels. In this study, the 'low level' and 'high level' for each independent variable are specified as 0 and 1, respectively.
Table 1: Independent variables of the 26-2 fractional factorial design for favipiravir-loaded nanostructured lipid carriers screening formulation. 'Low level' is defined as 0, whereas ‘High level’ is described as 1
| Independent variable | Low level (0) | High level (1) |
| Solid lipid combination (A) | No combination (Glyceryl monostearate only) | Combination 1:1 (Glyceryl monostearate: Cetyl alcohol 1:1) |
| Liquid lipid combination (B) | No combination (MCT oils only) | Combination 1:1 (MCT oils: Ethyl oleate 1:1) |
| Solid: liquid lipid ratio (C) | 70:30 | 90:10 |
| Total lipid (D) | 2% w/v | 5% w/v |
| Surfactant concentration Tween® 80 (E) | 2% w/v | 5% w/v |
| Co-surfactant concentration Labrasol® (F) | 1% w/v | 2% w/v |
The formulation based on the 26-2 fractional factorial design model of experiments with 6 independent variables, including solid lipid combination, liquid lipid combination, solid lipid and liquid lipid ratio, total lipid concentration, surfactant concentration, and co-surfactant concentration at 2 levels is detailed in table 2.
Preparation of favipiravir-loaded nanostructured-lipid carriers
FVP-NLC was prepared utilizing a combination of high-shear homogenization and ultrasonication techniques. Initially, a precise amount of GMS, CA (if included), MCT oils, and EO (if applicable) were heated to 70±0.5 °C to melt the lipid components. FVP was incorporated into the molten lipid while Tween® 80 and Labrasol® were separately dissolved in purified water and maintained at the same temperature as the lipid phase. Subsequently, the aqueous solution was gradually added to the lipid mixture. The resulting emulsion was processed using an ULTRA-TURRAX® homogenizer (IKA T-25®, USA) at 12,000 rpm for 10 min, followed by ultrasonication at an amplitude of 40 (Sonics Vibra-Cell®, USA) for 5 min. The NLC formulation was then allowed to cool to room temperature [17, 18].
Particle size, polydispersity index, and zeta potential
The FVP-NLC dispersion was diluted at a ratio of 1:1,000 and analyzed for particle size, PDI, and zeta potential using photon correlation spectroscopy with a particle size analyzer (Zetasizer Pro® Malvern, UK) at 25 °C with a 90° scattering angle to determine the required parameters [19, 20].
Entrapment efficiency
To analyze the entrapment efficiency, the FVP-NLC dispersion was subjected to centrifugation at 12,000 rpm for 1 h at room temperature. After centrifugation, the supernatant was gently collected and quantified using reverse-phase HPLC (RP-HPLC) at a maximum wavelength (λ) of 323 nm [21]. The entrapment efficiency percentage was determined by applying the following equations [22, 23].
Entrapment efficiency =  × 100%
In vitro dissolution and release kinetics study
The in vitro release evaluation of FVP raw material and FVP-NLC was carried out using a dialysis bag with a molecular weight cutoff of 12,000–14,000 Da. Prior to the experiment, the dialysis bag was pre-soaked overnight in the release medium. The release study utilized 0.1 M HCl and 0.1 M KCl, pH 1.2 solution to simulate gastric conditions and phosphate-buffered saline (PBS, containing 137 mmol sodium chloride, 2.7 mmol potassium chloride, 8 mmol sodium phosphate dibasic, and 2 mmol potassium phosphate monobasic) at pH 7.4 to simulate intestinal conditions. A dialysis bag containing FVP-NLC, equivalent to 10 mg of FVP, was immersed in 200 ml of dissolution medium maintained at 37±0.5 °C with continuous stirring at 100 rpm. At times specified, 1.0 ml was withdrawn from the dissolution medium for analysis, and the same volume of fresh dissolution medium was added to ensure sink conditions throughout the study [24, 25]. The withdrawn samples were filtered using a 0.45-µm syringe filter and analyzed using RP-HPLC at λ = 323 nm. In comparison with commercial tablets, FAVIR (GPO)® containing 200 mg of FVP was also evaluated in both solutions (pH 1.2 and pH 7.4) using a USP dissolution apparatus type II (paddle) at 100 rpm for 24 h with a volume of 900 ml. To interpret the release data in both solutions, the profiles were tested against various kinetic models, including zero-order, first-order, Higuchi, and Korsmeyer–Peppas. The model with the highest correlation coefficient was selected as the most appropriate fit for the release behavior of the drug [26-28].
Short-term stability study
To investigate the stability of FVP-NLC, the sample was stored under three different conditions, which are a refrigerator (5±3 °C), room temperature (25±2 °C, 60±5% RH), and a climatic chamber (40±2 °C, 75±5% RH) for 15 d. The physicochemical properties of FVP-NLC, including particle size, PDI, zeta potential, and entrapment efficiency, were evaluated [29].
Statistical analysis
The screening process of FVP-NLC formulations utilized Design-Expert™ software version 13 with a 26-2 fractional factorial design. The F-value, p-value, R2, and total contribution of each parameter were determined using the software, followed by the analysis of variance (ANOVA). DDSolver Add-ins were used in the evaluation of in vitro drug release and kinetic studies. Each characterization test was performed in triplicate (n = 3), with the findings reported as the mean±standard deviation (SD). The stability studies were analyzed by using two-way ANOVA, followed by Tukey’s honestly significant difference (HSD) between the initial and end of the study period. A p-value of less than 0.05 was categorized as statistically significant, indicating differences between the groups.
RESULTS AND DISCUSSION
Characterization of favipiravir-loaded nanostructured-lipid carriers
All formulations of FVP-NLC were visually homogenous and exhibited no phase separation. The dispersions were visually white-opaque and odorless (fig. 1). The formulation of FVP-NLC was characterized to determine the major contribution of each independent variable that could affect the characterization parameters: particle size, PDI, zeta potential, entrapment efficiency, and drug loading. The results of the characterization are summarized in table 2.
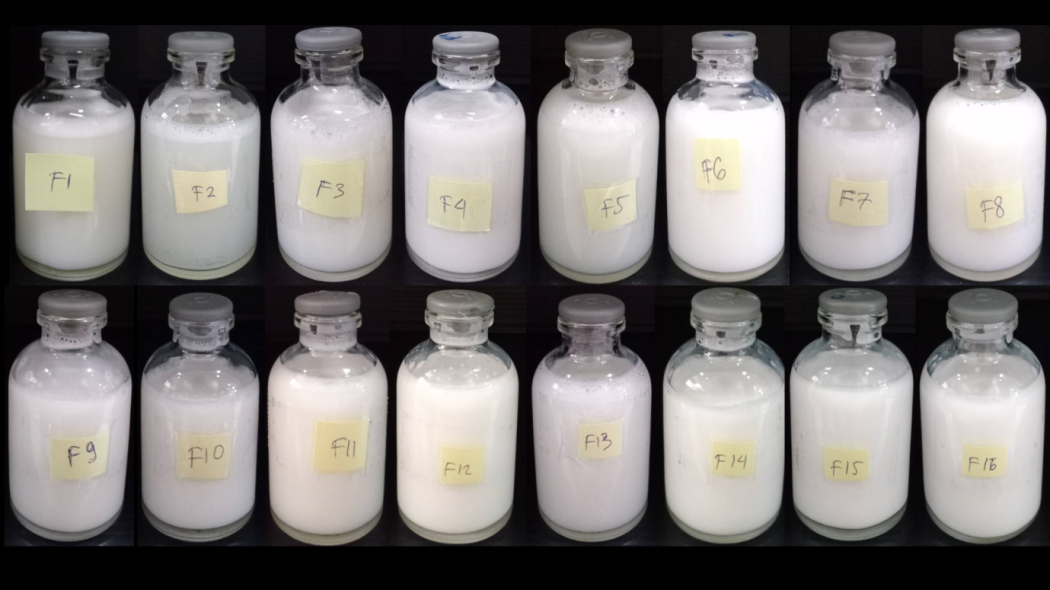
Fig. 1: Physical appearance of favipiravir nanostructured lipid carrier formulations labelled F1 to F16
Table 2: Favipiravir-loaded nanostructured lipid carriers screening formulations and characterization parameters
| Formula | Solid lipid combinationa) | Liquid lipid combinationb) | Solid: liquid lipid ratio | Total lipid (% w/v) |
Surfactant concentration (% w/v) |
Co-surfactant concentration (% w/v) |
Particle size (nm) | Polydispersity index | Zeta potential (mV) | Entrapment efficiency (% w/v) |
| 1 | 0 | 0 | 70:30 | 2 | 2 | 1 | 160.5±4.5 | 0.2749±0.0070 | -34.10±3.30 | 80.28%±2.38 |
| 2 | 1 | 0 | 70:30 | 2 | 5 | 1 | 218.1±17.8 | 0.3845±0.0424 | -34.22±3.80 | 54.15%±12.35 |
| 3 | 0 | 1 | 70:30 | 2 | 5 | 2 | 124.1±1.8 | 0.1387±0.0043 | -39.06±2.00 | 85.97%±0.06 |
| 4 | 1 | 1 | 70:30 | 2 | 2 | 2 | 219.1±2.9 | 0.2591±0.0076 | -43.84±7.72 | 88.55%±0.09 |
| 5 | 0 | 0 | 90:10 | 2 | 5 | 2 | 159.5±6.0 | 0.2042±0.0018 | -41.51±2.47 | 84.34%±0.02 |
| 6 | 1 | 0 | 90:10 | 2 | 2 | 2 | 125.7±14.6 | 0.2508±0.0272 | -48.39±2.80 | 84.25%±0.03 |
| 7 | 0 | 1 | 90:10 | 2 | 2 | 1 | 165.2±4.1 | 0.1968±0.0424 | -45.38±1.51 | 88.51%±0.00 |
| 8 | 1 | 1 | 90:10 | 2 | 5 | 1 | 140.7±2.4 | 0.1882±0.0225 | -36.92±1.52 | 52.50%±1.99 |
| 9 | 0 | 0 | 70:30 | 5 | 2 | 2 | 224.8±11.1 | 0.2161±0.1237 | -37.97±1.59 | 82.91%±0.43 |
| 10 | 1 | 0 | 70:30 | 5 | 5 | 2 | 428.9±17.0 | 0.4789±0.0109 | -38.96±3.83 | 82.00%±0.34 |
| 11 | 0 | 1 | 70:30 | 5 | 5 | 1 | 345.1±43.4 | 0.1495±0.0208 | -38.97±2.08 | 63.49%±0.33 |
| 12 | 1 | 1 | 70:30 | 5 | 2 | 1 | 390.7±34.5 | 0.1389±0.0862 | -37.03±3.06 | 42.14%±0.05 |
| 13 | 0 | 0 | 90:10 | 5 | 5 | 1 | 388.4±11.7 | 0.1583±0.1178 | -33.42±1.75 | 88.63%±0.03 |
| 14 | 1 | 0 | 90:10 | 5 | 2 | 1 | 338.6±19.4 | 0.1618±0.1091 | -37.19±2.12 | 55.31%±0.03 |
| 15 | 0 | 1 | 90:10 | 5 | 2 | 2 | 433.9±5.9 | 0.2629±0.0995 | -42.76±4.30 | 85.78%±0.01 |
| 16 | 1 | 1 | 90:10 | 5 | 5 | 2 | 391.1±10.4 | 0.2875±0.0347 | -46.07±4.59 | 83.81%±0.18 |
a)0 indicates no solid lipid combination, representing GMS alone, while 1 represents a 1:1 combination of GMS and CA. (Defined in table 1), b)0 indicates no liquid lipid combination, representing MCT oils alone, while 1 represents a 1:1 combination of MCT oils and EO. (Defined in table 1), Data presented as mean±SD (n = 3)
The relationship between independent variables and physicochemical characterization, including particle size (A), PDI (B), zeta potential (C), and entrapment efficiency (D), was determined. The plotted data points for each variable, classified as positive effects (orange) and negative effects (blue), revealed strong linear trends, suggesting significant correlations between the variables (fig. 2). All models for each variable had significant values (p<0.05) and a high coefficient of determination (R²) (close to 1), which indicated a significant correlation with the model (table 3). Additionally, the normality of residuals was confirmed through the Shapiro-Wilk test, and p-values were greater than 0.05, indicating that the residuals followed a normal distribution and validating the robustness of the model.
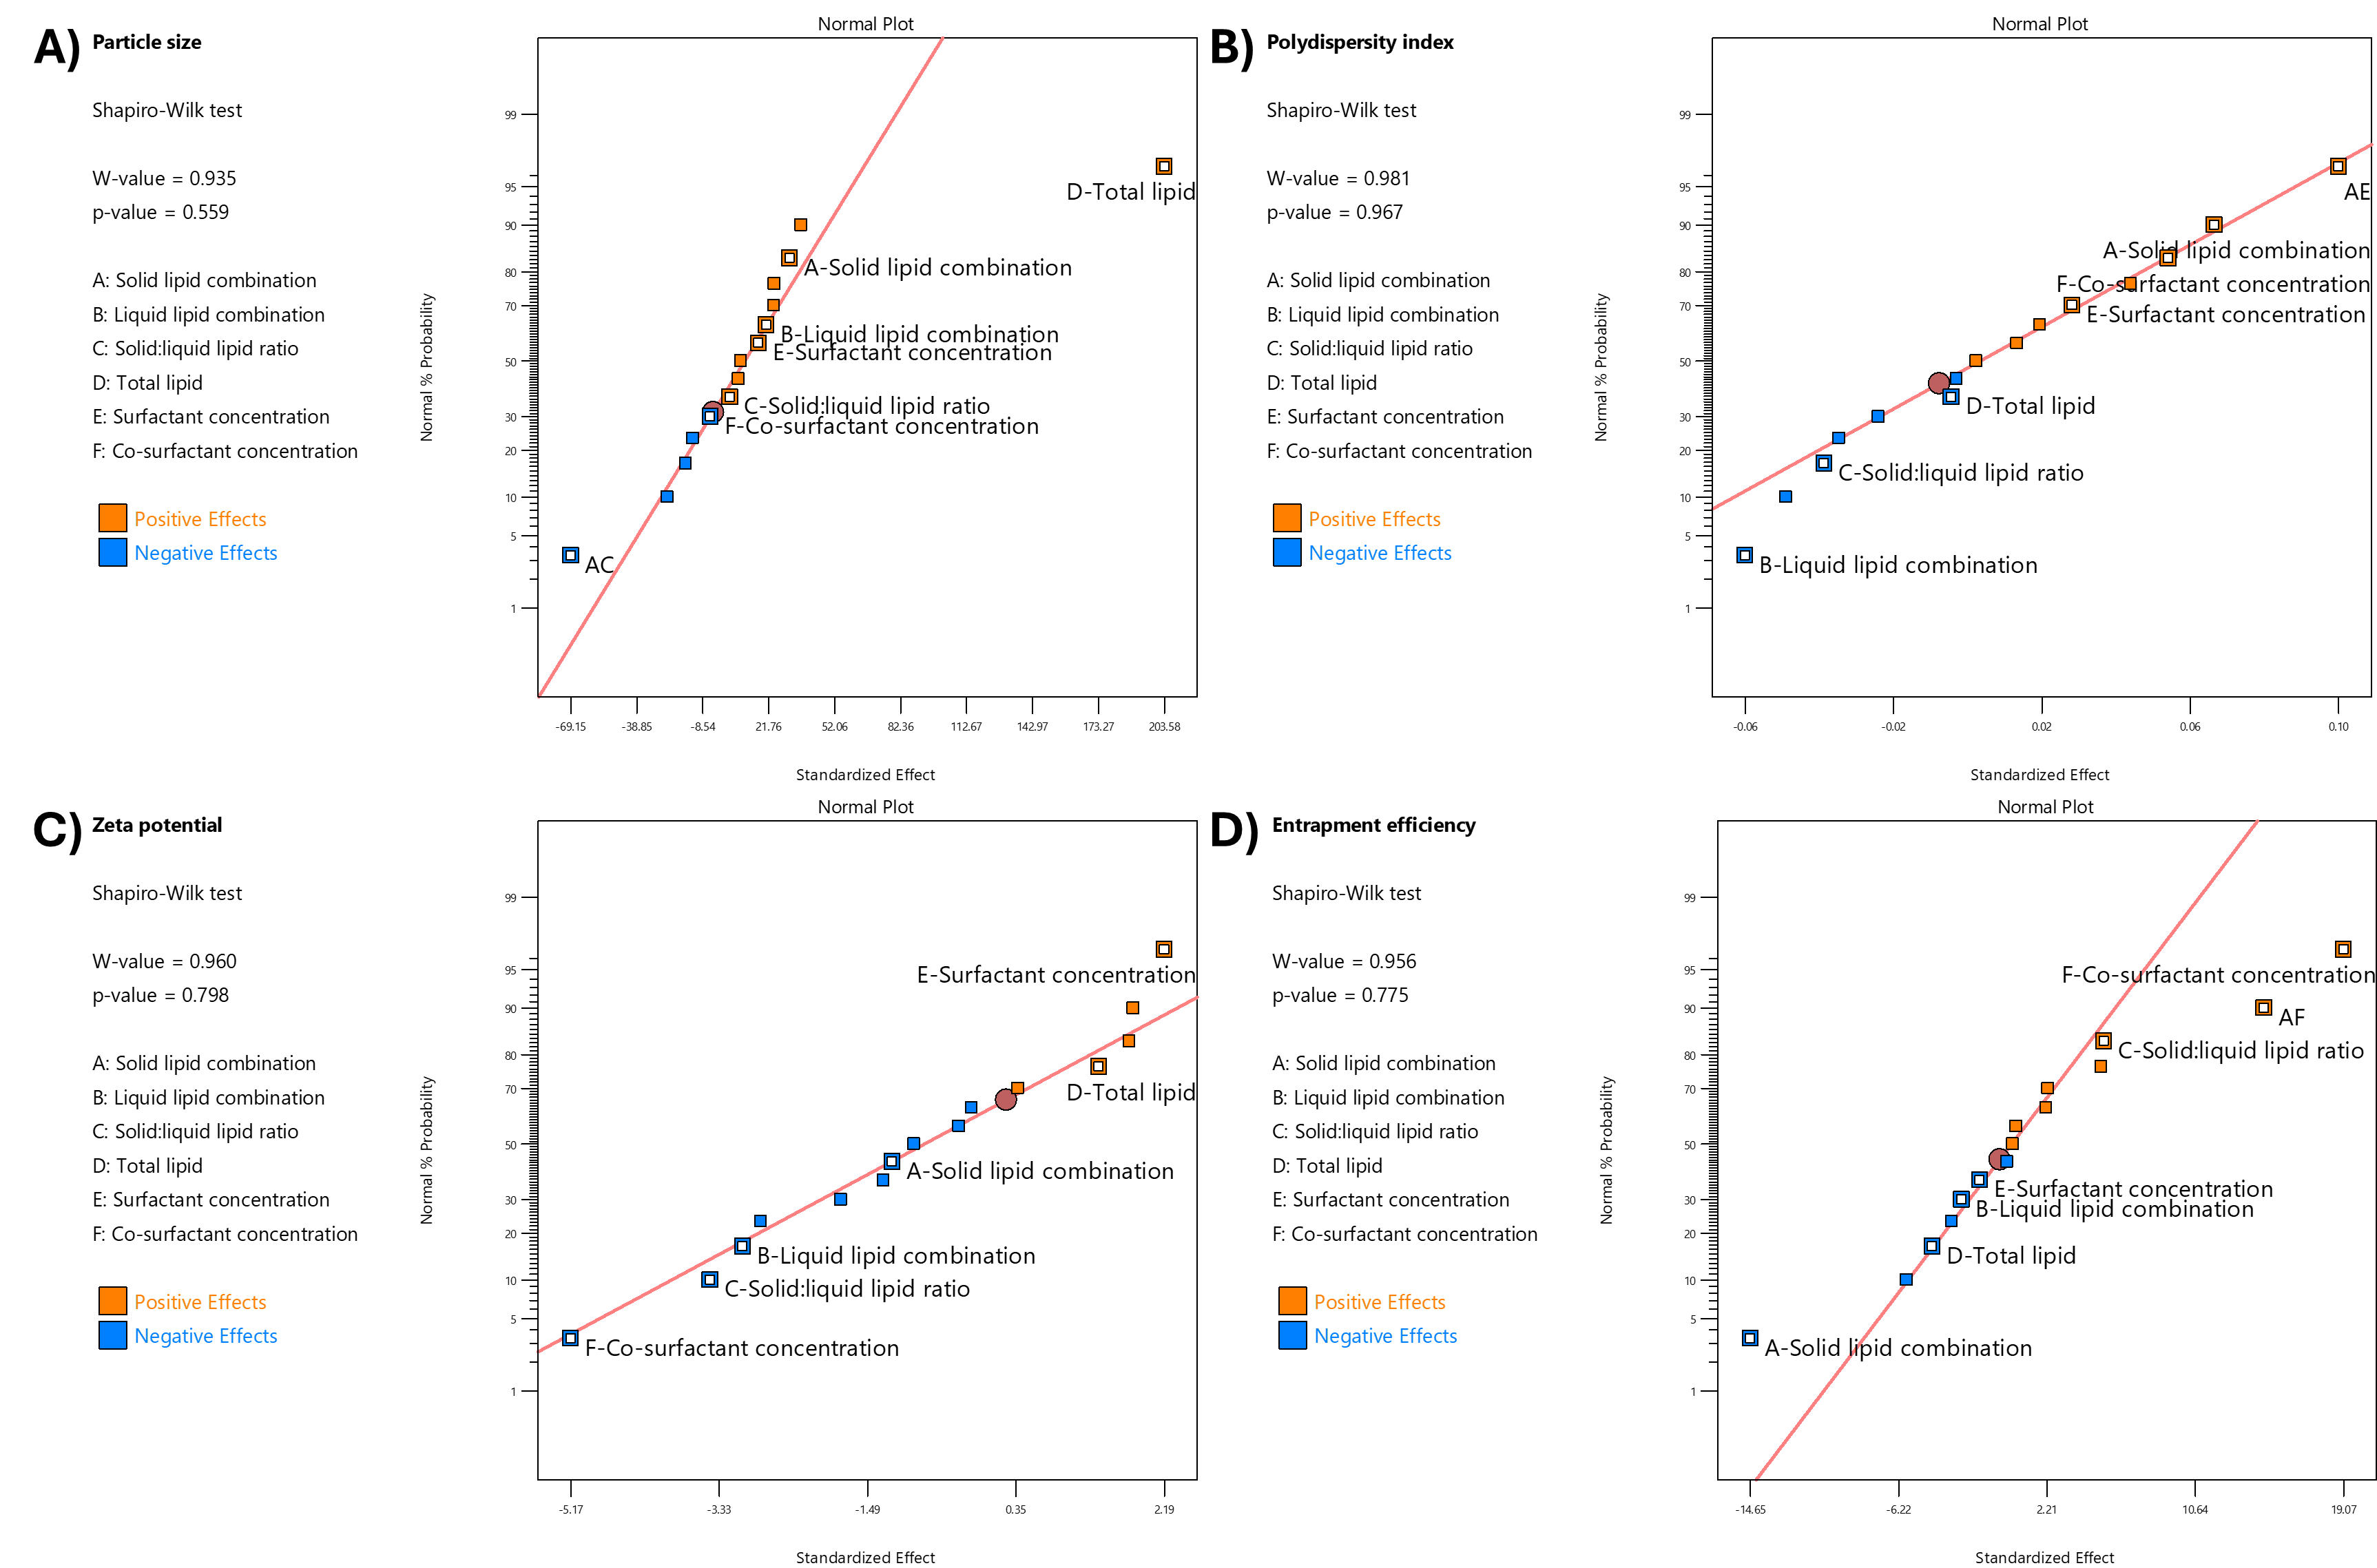
Fig. 2: Relationships between independent variables and nanoparticle characterization parameters: (A) particle size, (B) polydispersity index, (C) zeta potential, and (D) entrapment efficiency. Data points represent positive effects (orange) and negative effects (blue). The residuals were evaluated using the Shapiro-Wilk test, indicating a normal distribution with p-values>0.05
The statistical analysis of the effect of formulation variables on the physicochemical properties of FVP-NLC is detailed in table 3, which presents the response variable and the corresponding statistical parameters, including the variables, degrees of freedom (df), F-value, p-value, and coefficient of determination (R²). The only significant interaction between each variable was also included. In addition, the total contribution represented the cumulative effect of an independent variable on FVP-NLC characterization parameters (fig. 3A). The higher total contribution indicated a more significant influence of that variable on key parameters (fig. 3B). The analysis of critical parameters affecting FVP-NLC characteristics showed that total lipid concentration (D) had the highest total contribution of 32%. Co-surfactant concentration (F) closely followed with a total contribution of 31%. Solid lipid combination (A) contributed notably to entrapment efficiency and PDI, resulting in an overall contribution of 15%. Liquid lipid combination (B) had a moderate influence, contributing 10% with noticeable effects on zeta potential and PDI. Other factors, including surfactant concentration (E) and the solid-to-liquid lipid ratio (C), showed lower contributions at 3% and 9%, respectively, highlighting their lesser but still relevant roles in determining the properties of FVP-NLC.
Particle size
The particle size of all formulations ranged from 124.1±1.8 (F3) to 433.9±5.9 nm (F15) (table 2). The particle size was influenced by various variables (fig. 2A and table 3), with the most important of which was total lipid concentration. The addition of lipid content significantly increased particle size (p<0.05). Thus, higher lipid concentrations (F16 with 5% w/v total lipids) were associated with larger particle sizes (391.1±10.4 nm) due to increased viscosity of the lipid matrix, which reduced homogenization efficiency, compared to the lower lipid concentrations (F8 with 2% w/v total lipids, 140.7±2.4 nm). Furthermore, higher lipid concentrations might increase particle aggregation, thus increasing the measured particle size. The combination of solid lipids (GMS and CA) increased the particle size compared to the formulation, which contained GMS only. For example, F2 (containing both GMS and CA) had a particle size of 218.1±17.8, whereas F1 (with only GMS) had a smaller size of 160.5±4.5 nm (table 2). This could be caused by the different melting points and molecular weights between GMS and CA, which increased the size of NLC [30]. The interaction between solid lipid combination (Factor A) and solid-to-liquid lipid ratio (Factor C) significantly influenced particle size (p<0.05) (fig. 3B). When only GMS was utilized as the solid lipid (A = 0), increasing the solid-to-liquid lipid ratio from 70 to 90 increased the particle size. However, when the solid lipid was combined with CA (A = 1), the trend was reversed, with particle size decreasing as the solid-to-liquid lipid ratio increased. This suggests that the presence of a solid lipid combination alters the effect of the solid-to-liquid lipid ratio on particle size, potentially due to differences in the crystallinity of GMS and CA and the interaction between the two solid lipids disrupting the ordered crystalline structure.
The combination of liquid lipids slightly increased the particle size of NLC, as seen in F7 (165.2±4.1 nm), compared to F5 without liquid lipids (159.5±6.0 nm) (table 2). The higher solid lipid concentration led to a larger particle size. For instance, F15 with higher solid lipid concentrations (90:10 solid-to-liquid lipid ratio) exhibited larger particle sizes (433.9±5.9 nm) compared to F9 with lower solid lipid concentrations (70:30 solid-to-liquid lipid ratio), which had a particle size of 224.8±11.1 nm (table 2). This could be caused by the solid lipid matrix in NLC forming more crystalline structures, leading to more rigid and dense particle structures, which would result in larger particle sizes. Conversely, the addition of liquid oil to the NLC would prevent solid lipid crystallization and lead to smaller sizes because the presence of liquid oil could disrupt the crystalline structure of the solid lipid matrix, leading to a more disordered lipid structure [31]. Higher surfactant and co-surfactant concentrations decreased particle size. An elevated concentration of surfactants would reduce interfacial surface tension and stabilize newly formed surfaces during homogenization, which ultimately would lead to the production of smaller particles. For example, F8, with 5% w/v surfactant concentration, had a particle size of 140.7±2.4 nm, whereas F7, with only 2% w/v surfactant, exhibited a larger size of 165.2±4.1 nm (table 2). This might be due to the lower surfactant concentration could not fully cover the surfaces fully, which might lead to particle aggregation, contributing to the observed increase in size [32].
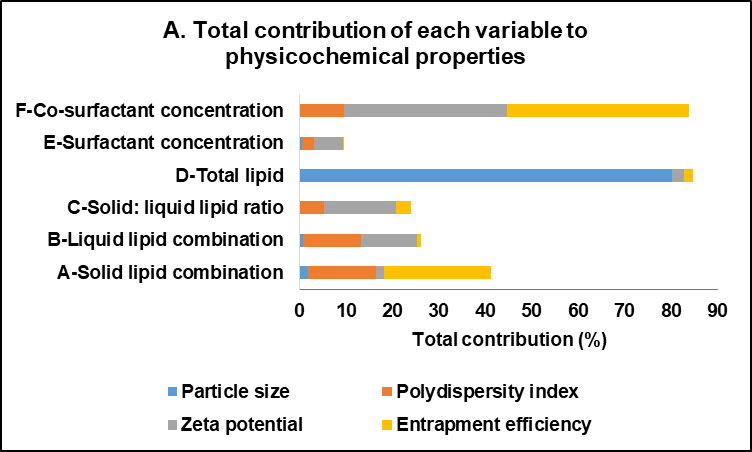
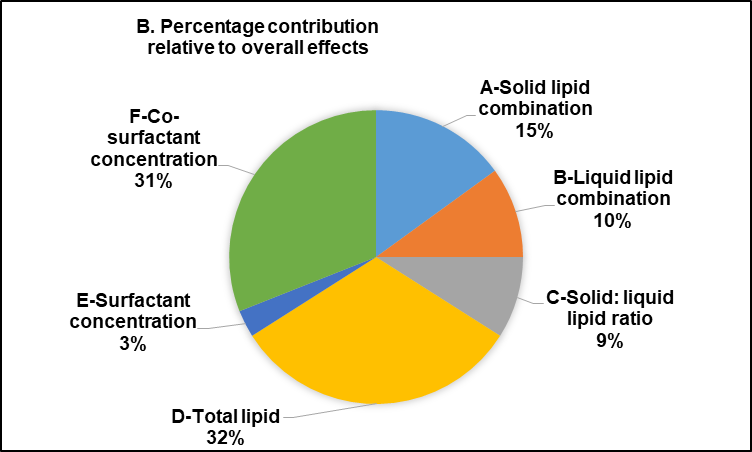
Fig. 3: Total contribution of each variable to physicochemical characteristics of favipiravir-loaded nanostructured lipid carriers: (A) The total contribution column represents the cumulative impact of each variable across all nanoparticle parameters, and (B) The percentage contribution demonstrates the proportional significance of each variable in relation to the overall effects
Table 3: Statistical analysis of the effect of formulation variables on physicochemical properties of favipiravir-loaded nanostructured lipid carriers
| Response | Source | df | F-value | p-value | R2 |
| Particle size | Model | 7 | 14.75 | 0.0005*) | 0.9281 |
| A-Solid lipid combination | 1 | 2.13 | 0.1826 | ||
| B-Liquid lipid combination | 1 | 0.9206 | 0.3654 | ||
| C-Solid: liquid lipid ratio | 1 | 0.0343 | 0.8577 | ||
| D-Total lipid | 1 | 89.18 | <0.0001*) | ||
| E-Surfactant concentration | 1 | 0.6342 | 0.4488 | ||
| F-Co-surfactant concentration | 1 | 0.0542 | 0.8218 | ||
| Significant Interaction-AC | 1 | 10.29 | 0.0125*) | ||
| Polydispersity index | Model | 7 | 3.90 | 0.0376*) | 0.7735 |
| A-Solid lipid combination | 1 | 5.11 | 0.0536 | ||
| B-Liquid lipid combination | 1 | 4.38 | 0.0696 | ||
| C-Solid: liquid lipid ratio | 1 | 1.85 | 0.2107 | ||
| D-Total lipid | 1 | 0.0322 | 0.8620 | ||
| E-Surfactant concentration | 1 | 0.8884 | 0.3735 | ||
| F-Co-surfactant concentration | 1 | 3.37 | 0.1037 | ||
| Significant Interaction-AE | 1 | 11.67 | 0.0091*) | ||
| Zeta potential | Model | 6 | 4.11 | 0.0288*) | 0.7328 |
| A-Solid lipid combination | 1 | 0.6163 | 0.4526 | ||
| B-Liquid lipid combination | 1 | 4.07 | 0.0744 | ||
| C-Solid: liquid lipid ratio | 1 | 5.22 | 0.0481*) | ||
| D-Total lipid | 1 | 0.8448 | 0.3820 | ||
| E-Surfactant concentration | 1 | 2.13 | 0.1786 | ||
| F-Co-surfactant concentration | 1 | 11.80 | 0.0074*) | ||
| Entrapment Efficiency | Model | 7 | 11.88 | 0.0012*) | 0.9122 |
| A-Solid lipid combination | 1 | 21.05 | 0.0018*) | ||
| B-Liquid lipid combination | 1 | 0.6835 | 0.4323 | ||
| C-Solid: liquid lipid ratio | 1 | 2.92 | 0.1261 | ||
| D-Total lipid | 1 | 1.82 | 0.2138 | ||
| E-Surfactant concentration | 1 | 0.2521 | 0.6291 | ||
| F-Co-surfactant concentration | 1 | 35.67 | 0.0003*) | ||
| Significant Interaction-AF | 1 | 20.77 | 0.0019*) |
*The significance level is indicated by p<0.05
Polydispersity index
The PDI ranged from 0.1387±0.0043 (F3) to 0.4789±0.0109 (F10), indicative of a uniform particle size distribution (less than 0.3) (table 2). F3 had a low PDI of 0.1387±0.0043, likely due to its higher proportion of liquid lipid and adequate surfactant concentration, which provided flexibility in the lipid matrix and prevented the formation of a crystalline structure. In contrast, F10, with a higher total lipid concentration, exhibited the highest PDI (0.4789±0.0109) due to increased dispersion viscosity, leading to particle aggregation. The combination of solid and liquid lipids decreased the PDI due to the disordered lipid structure in the NLC core, and the addition of liquid oil to the solid lipid matrix in NLC led to more flexibility. This could prevent the solid lipid from forming a completely crystalline structure and so result in a more uniform and homogeneous particle size distribution, which decreased the PDI value [33]. In addition, higher total lipid concentration would increase the viscosity of the dispersion, which would in turn lead to interactions between particles and particle aggregation [34]. The higher total lipid concentrations, as seen in F16 (total lipid 5% w/v), showed a higher PDI value of 0.2875±0.0347 compared to F8 with total lipid 2% w/v (PDI: 0.1882±0.0225) (table 2). Moreover, the addition of a co-surfactant increased the homogeneity of particles and decreased the PDI by reducing the interfacial tension between the lipid and aqueous phases, which would lead to more uniform droplet formation and prevent particle aggregation [35]. For instance, F4 (PDI: 0.2591±0.0076) with higher co-surfactant levels (2% w/v) had greater particle homogeneity and lower PDI compared to F2 (PDI: 0.3845±0.0424) with lower co-surfactant levels (1% w/v), due to reduced interfacial tension (table 2).
The interaction between solid lipid combination (Factor A) and surfactant concentration (Factor E) affected PDI values (p<0.05). At a low surfactant concentration (E = 2%), the PDI remained low regardless of the solid lipid combination. However, at a higher surfactant concentration (E = 5%), the PDI increased significantly when the solid lipid combination was present (A = 1). This indicates that the presence of a solid lipid combination may lead to increased variability in particle size distribution due to the differences in solid lipid structure in the NLC matrix system.
Zeta potential
FVP-NLC had a negative charge, ranging from -48.39±2.80 (F6) to-33.42±1.75 mV (F13) (table 2), due to the interaction between nanoparticles and the surrounding aqueous environment, including the adsorption of hydroxyl (OH⁻) ions from water onto the lipid particles, as well as the presence of hydroxyl (OH⁻) groups in both the lipids and surfactants. The major effect on zeta potential was the higher concentration of cosurfactant (p<0.05), which increased the absolute zeta potential due to the reduction in the net charge at the particle surface, indicating more stable dispersion (fig. 3A). For instance, F10 with 2% w/v cosurfactant had a zeta potential value of-38.96±3.83 mV, and so was a more stable dispersion as the surfactants effectively reduced the interfacial tension and ensured nanoparticle surface coverage, preventing particle aggregation. In contrast, F1 with 1% w/v surfactant exhibited lower absolute zeta potential (-34.10±3.30 mV), suggestive of insufficient surfactant concentrations to stabilize the dispersion. Thus, at a sufficient concentration of surfactant, the surfaces of the nanoparticles would be well covered, which could prevent particle aggregation [32].
The combination of solid lipid and liquid lipid led to a higher absolute zeta potential, which indicates a more stable formulation. Moreover, the higher concentrations of solid lipids could increase the absolute zeta potential [36]. Thus, the negative charge of NLC may also be influenced by the presence of a free hydroxyl group in the solid lipids. For example, F6, with a higher concentration of solid lipid and co-surfactant, exhibited the highest absolute zeta potential (-48.39±2.80 mV), demonstrating the stabilizing effect of solid lipids. Conversely, Formula 13, which had a higher total lipid concentration but a lower co-surfactant concentration, exhibited the lowest absolute zeta potential (-33.42±1.75 mV), indicating reduced stability due to particle interactions (table 2).
Entrapment efficiency
The entrapment efficiency, ranging from 42.14%±0.05% w/v (F12) to 88.63%±0.03% w/v (F13) (table 2), measured the capability of the NLC to effectively encapsulate FVP into the lipid matrix system. The higher concentration of solid lipids decreased the entrapment efficiency of FVP-NLC due to the different structures of lipids in the NLC core (p<0.05). This occurs because an excessive amount of solid lipids can lead to the formation of a more ordered crystalline structure within the NLC matrix, which can reduce the available space for drug incorporation. Additionally, the increased lipid crystallinity may cause drug expulsion from the NLC core. Thus, F4 (solid: liquid lipid ratio 70:30) showed a high entrapment efficiency of 88.55%±0.09% w/v, whereas F8 (solid: liquid lipid ratio 90:10) exhibited a much lower entrapment efficiency of 52.50%±1.99% w/v (table 2). Furthermore, the higher concentration of surfactants and co-surfactants could increase the entrapment efficiency of FVP in the NLC core. The co-surfactant increased the emulsification efficiency and so improved the efficiency of entrapment of the drug in the core of the NLC [37]. Thus, F3 (surfactant 5% w/v, co-surfactant 2% w/v) achieved an entrapment efficiency of 85.97%±0.06% w/v, demonstrating the importance of sufficient surfactant and co-surfactant levels in reducing interfacial tension and enhancing emulsification. On the other hand, F8 (surfactant 5% w/v, co-surfactant 1% w/v) had a significantly lower entrapment efficiency of 52.50%±1.99% w/v, indicating the need for balanced co-surfactant concentrations. Higher total lipid concentrations generally decreased entrapment efficiency. For example, F12 (total lipid 5% w/v) had the lowest entrapment efficiency (42.14%±0.05% w/v), likely due to saturation of the lipid matrix, which limited drug loading. In contrast, F4 (total lipid 2% w/v) exhibited a much higher entrapment efficiency of 88.55%±0.09% w/v (table 2), indicating that lower lipid concentrations facilitated better encapsulation [38].
The interaction between solid lipid combination (Factor A) and co-surfactant concentration (Factor F) also played a role in entrapment efficiency (p<0.05) (see fig. 4). There was no significant difference between the entrapment efficiency of GMS only (A = 0) and the combination with CA (A = 1) when the cosurfactant concentration was 1% w/v. However, when the cosurfactant concentration was 0.5%, the entrapment efficiency of the combination of GMS and CA was significantly decreased. For instance, F1 with GMS only showed an entrapment efficiency of 80.28%±2.38% w/v, whereas F2 with CA combination was only 54.15%±12.35% w/v (table 2). This might be due to the insufficient stabilization of the lipid matrix at lower co-surfactant concentrations, which can lead to reduced FVP encapsulation. The presence of CA in combination with GMS could have altered the lipid crystallinity, which would increase drug leakage.
Further characterization of optimum favipiravir-loaded nanostructured-lipid carriers
Based on the evaluation parameters (table 2), Formula 3 (F3) demonstrated the most optimal characteristics among all formulations. F3 exhibited the smallest particle size (124.1±1.8 nm) with the lowest PDI (0.1387±0.0043) and high entrapment efficiency (85.97±0.06% w/v), indicating superior uniformity, encapsulation capability, and stability. The zeta potential of F3 was-39.06±2.00 mV, which indicated excellent colloidal stability. Particles with zeta potentials more negative than -30 mV are considered stable due to strong electrostatic repulsion, which prevents aggregation and maintains stable dispersion [39]. Therefore, F3 of the FVP-NLC formulation was chosen for further characterization, including the in vitro dissolution and short-term stability study.
In vitro dissolution and release kinetics study
The in vitro dissolution profiles demonstrated that the F3 formulation had a minimal release at simulated gastric pH, 1.2 (fig. 5A). In this acidic medium, F3 showed only 3.80%±0.02% w/v release at 24 h. This might be due to the low solubility of FVP in acidic environments (0.526 mg/ml) compared to a neutral pH medium (0.822 mg/ml) [3]. Another study also showed that lipid matrix degradation in the gastric phase is minimal due to limited enzymatic activity and low lipid solubility, which can limit drug release in this acidic environment [40]. In comparison to the raw materials, FVP itself had rapid-release profiles with a maximum cumulative concentration of 64.84%±1.62% w/v at 2 h. However, after 4 h, the dissolution profile of FVP further declined over time, reaching 28.10%±6.15% w/v at 24 h. Similarly, the FAVIR® tablet exhibited a rapid release of 99.42%±0.98% w/v after 5 min, and this measured level of FVP remained constant up to 2 h. However, the amount of detectable FVP then decreased between 4 and 24 h, from 97.61%±0.10% w/v to 79.54%±0.61% w/v, respectively. The decline in the amount of FVP might be attributed to the degradation of FVP in an acidic pH medium due to the breakdown of the amide group under acidic conditions [41].
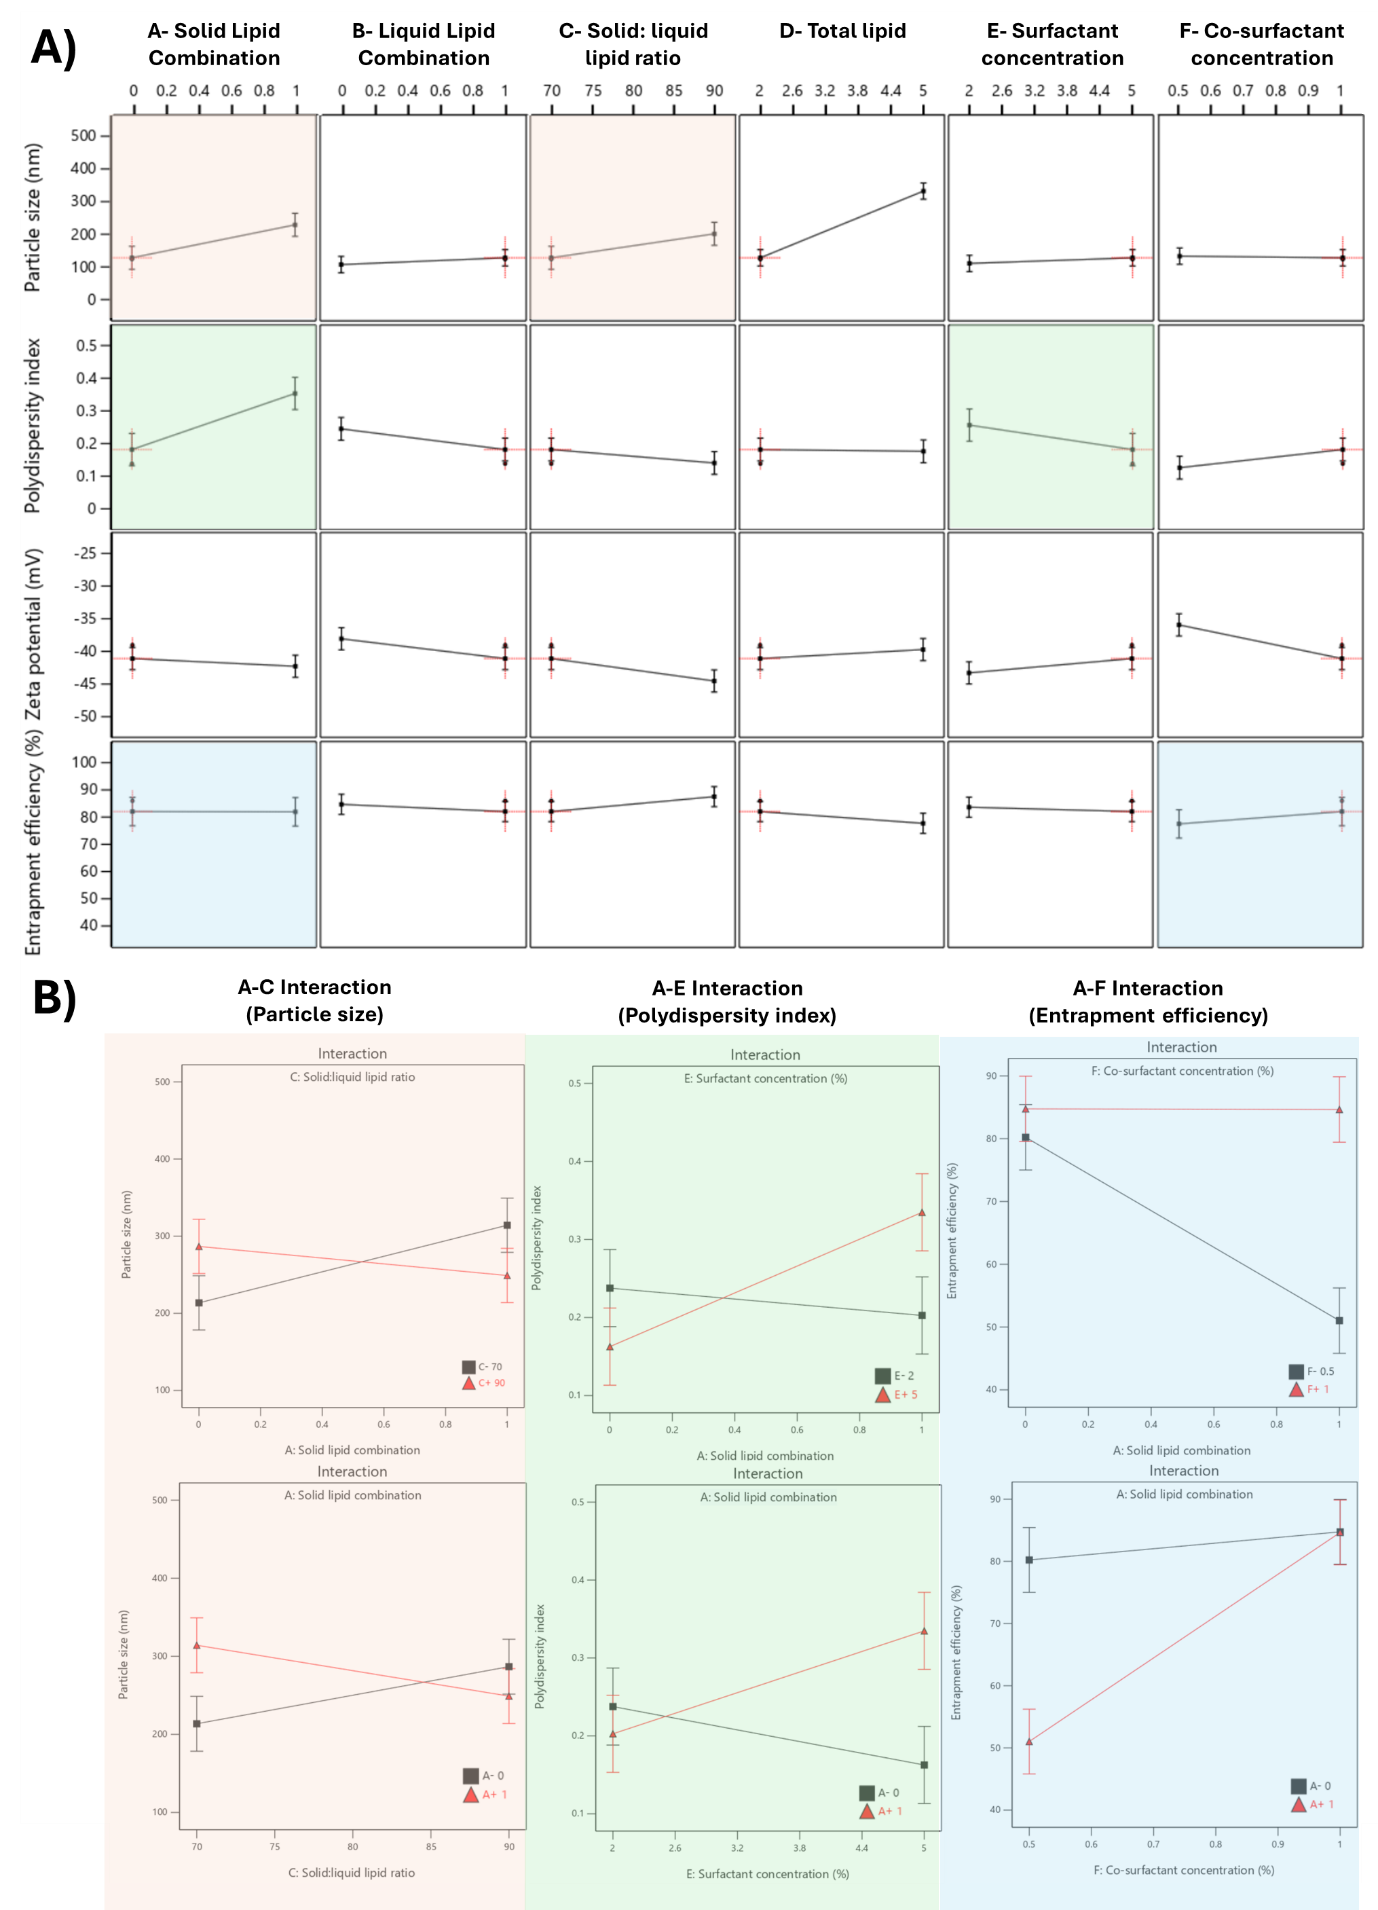
Fig. 4: Effect of formulation variables on physicochemical characteristics of favipiravir-loaded nanostructured lipid carriers. (A) The influence of various formulation variables on physicochemical properties: particle size (nm), polydispersity index, zeta potential (mV), and entrapment efficiency (%). (B) Interaction plots for significant formulation variables on particle size (left), polydispersity index (middle), and entrapment efficiency (right)
The F3 formulation exhibited a sustained and controlled release profile at pH 7.4 (fig. 5B). Within the first few hours, a slow burst release was observed with F3, which reached approximately 40% w/v cumulative release, whereas FVP exhibited a much more rapid release profile, achieving nearly 60% w/v at the same time point. The initial burst release occurring with F3 might be caused by unentrapped drugs or the drugs in the outer layer of the NLC matrix system [42]. Over 24 h, F3 continued to show sustained release properties with 78.75±4.90% w/v of the drug released, whereas raw FVP exhibited a nearly complete release of the drug within the first 8 h. Conversely, the FAVIR® tablet exhibited a rapid complete release of 108.74%±2.16% w/v within 5 min. This indicated that F3 provided a more efficient and controlled drug release mechanism, likely due to its lipid-based nanostructure [23]. This controlled release profile of F3 suggested it could provide prolonged therapeutic effects, reducing the need for frequent dosing [43]. Overall, F3 showed promise as a controlled drug delivery system for achieving gradual and sustained drug release compared to the immediate release of FVP raw material.
The drug release kinetics at pH 1.2 and pH 7.4 were evaluated using multiple models (fig. 4C and 4D, respectively): zero-order (1), first-order (2), Higuchi (3), and Korsmeyer-Peppas (4) models [44]. In the acidic medium (pH 7.4), both FVP itself and the F3 formulation showed a poor correlation in all models. The highest correlation for the former was the Korsmeyer-Peppas model (R² = 0.4083) with an n value of 0.224, while F3 correlated to the Higuchi model with R² = 0.2762. This strongly indicated that the release of FVP and F3 formulation was influenced by Fick diffusion, though the very low release from F3 means that the analysis of these data is compromised by the low signal. In comparison, the release from the FAVIR® tablet exhibited a strong correlation with the first-order model (R² = 0.9478) with a negative slope, which indicated that the concentration of FVP decreased over time due to the instability of FVP in the acidic medium.
At pH 7.4, the release from FVP was poorly described by all models, with the highest correlation coefficient found with the Korsmeyer Peppas model (R² = 0.6817), indicating a less controlled release mechanism. However, the n value of the FVP raw material was 0.1304, indicating a Fickian diffusion mechanism for drug release. Similarly, the FAVIR® tablet showed a low correlation in all models, with the highest correlation with first-order release kinetics (R² = 0.4864). This indicated that drug release from tablets was influenced by the initial concentration of FVP. In contrast, the F3 formulation showed the highest R² value (0.9171) with the Korsmeyer-Peppas model, indicating a Fickian diffusion mechanism with swelling or erosion of the carrier matrix as indicated by the n value of 0.231 [45]. The Higuchi model also showed a high correlation for F3 (R² = 0.8639), further supporting that diffusion-driven release was occurring [46, 47]. Therefore, the release kinetics of F3 at pH 7.4 highlighted its potential as a controlled and sustained release system of FVP-NLC [13]. In addition, degradation of the lipid matrix under intestinal conditions would be likely to play a crucial role in enhancing drug release. The formation of mixed micelles and free fatty acids facilitated by bile salts and pancreatic enzymes could lead to matrix breakdown and rapid drug diffusion [40].
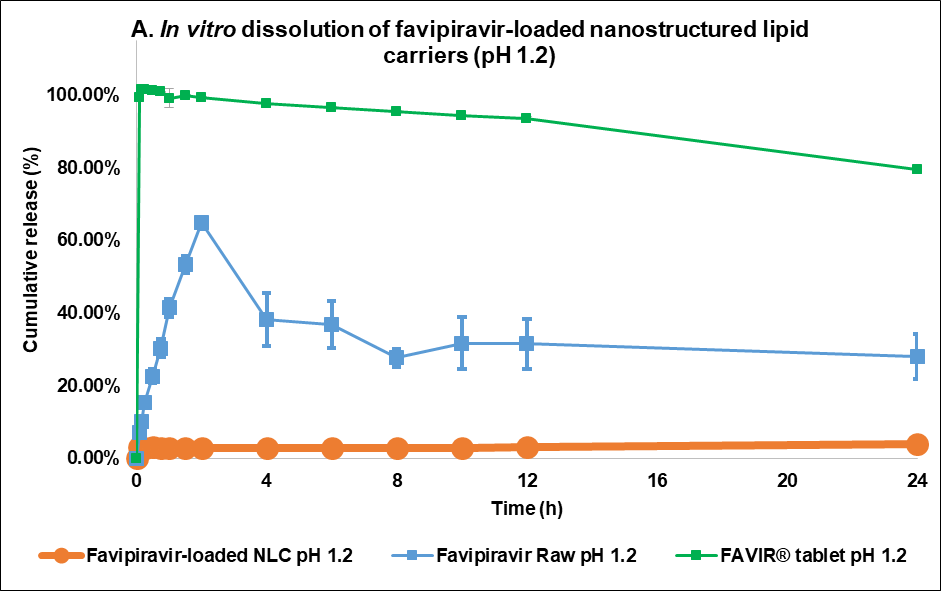
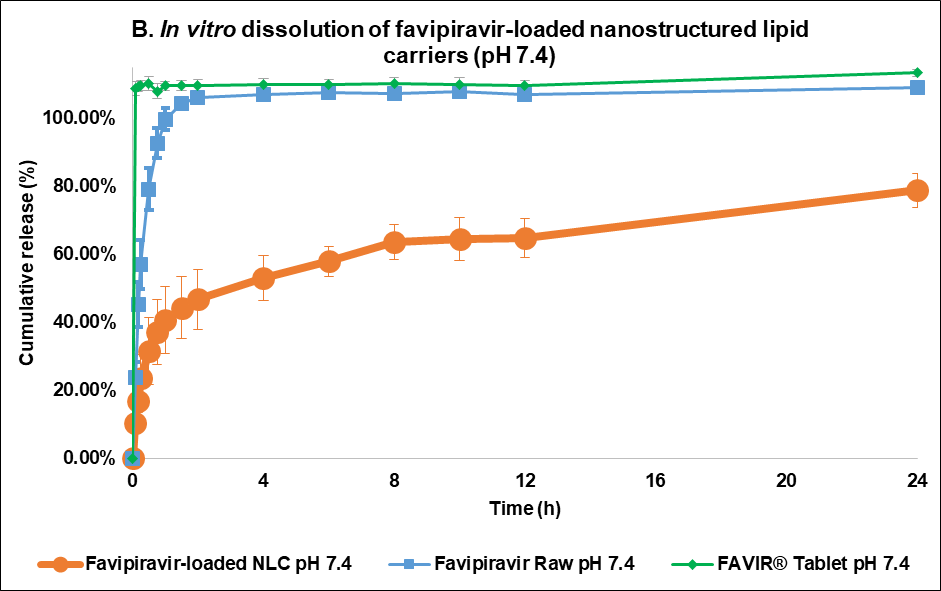
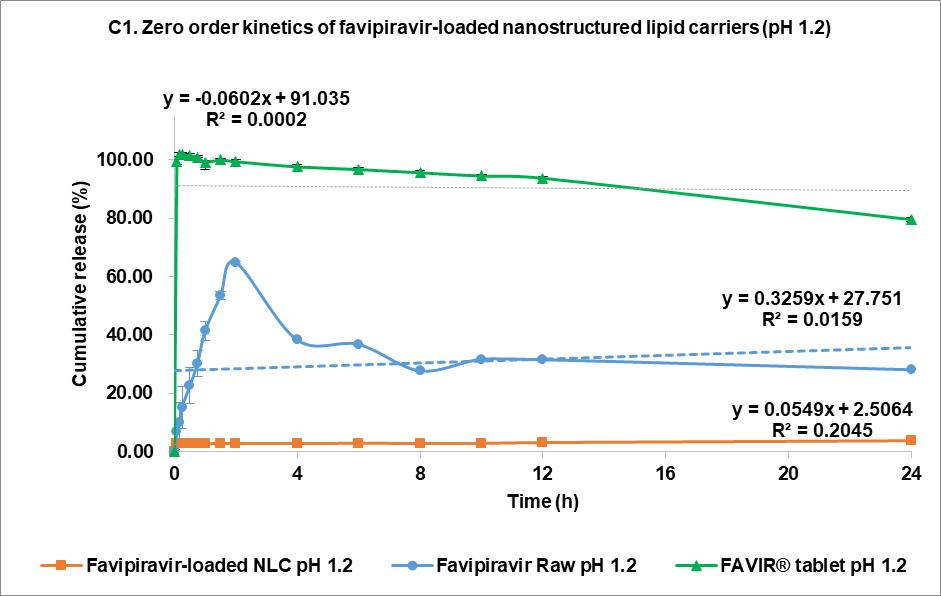
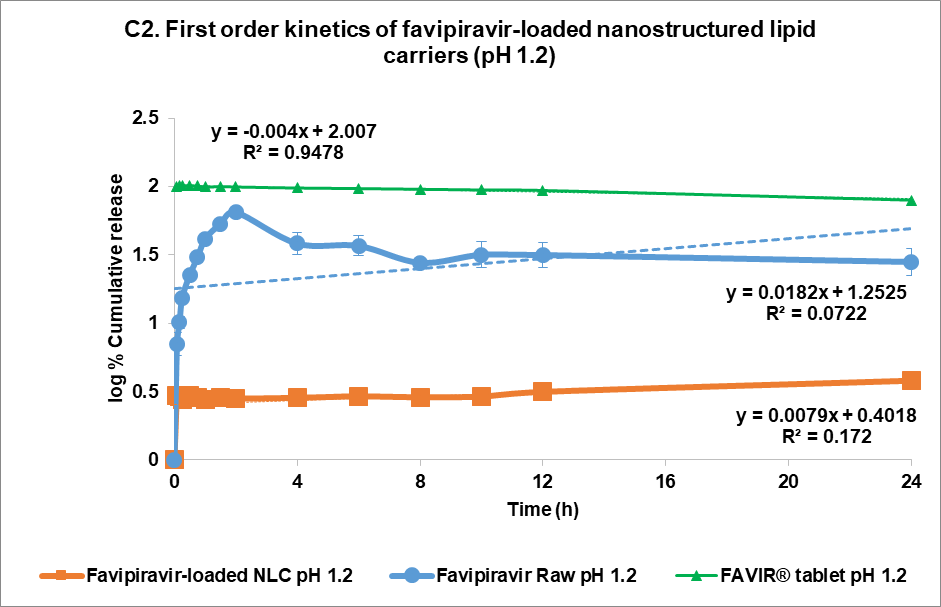
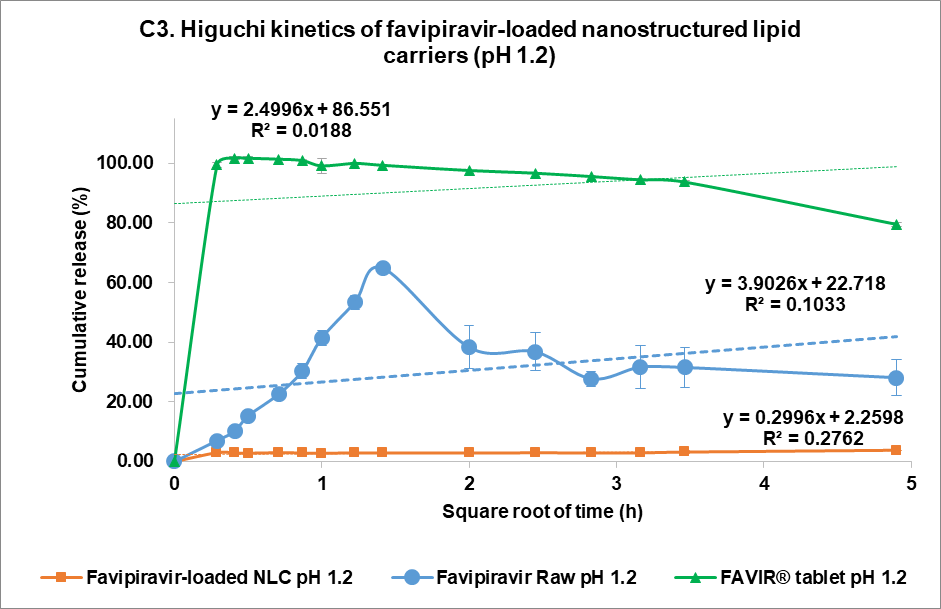
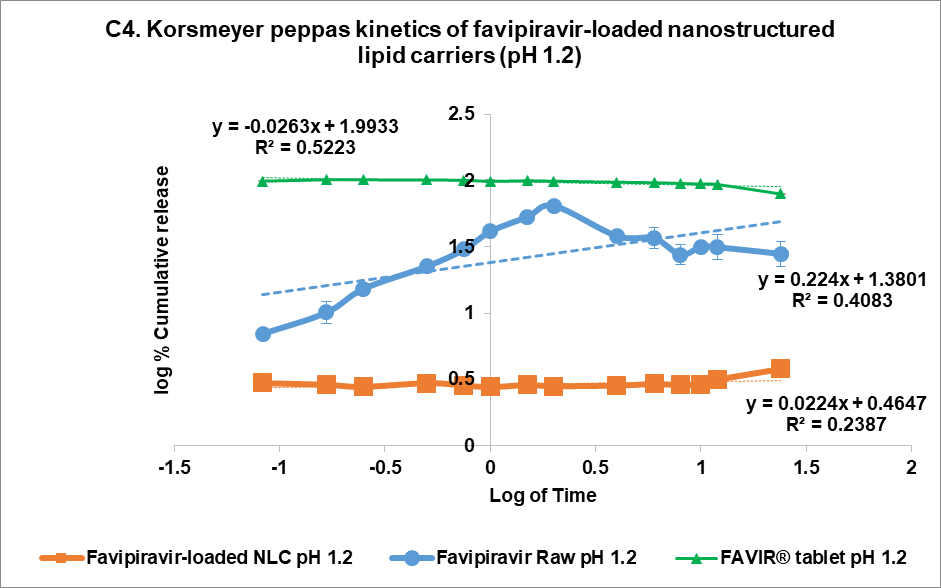
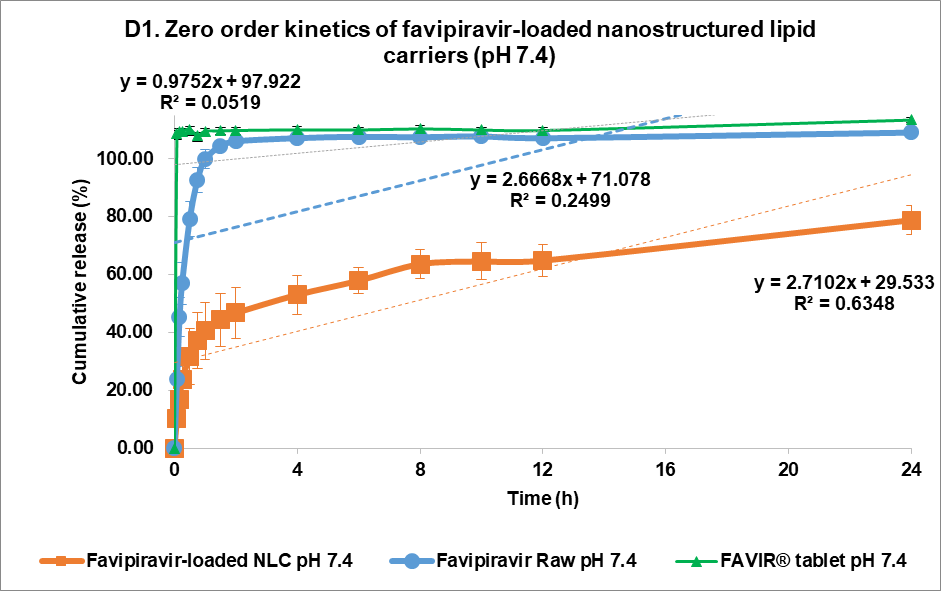
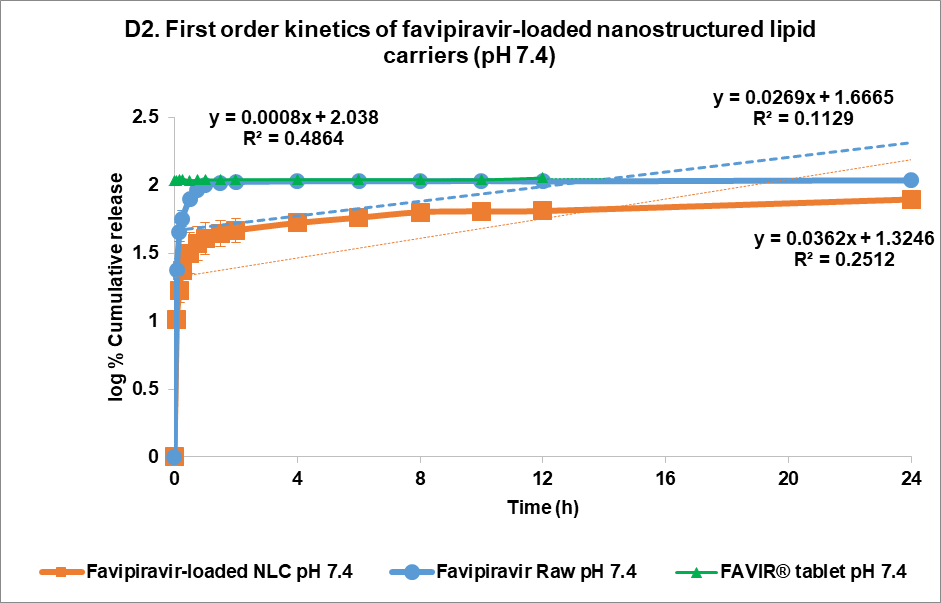
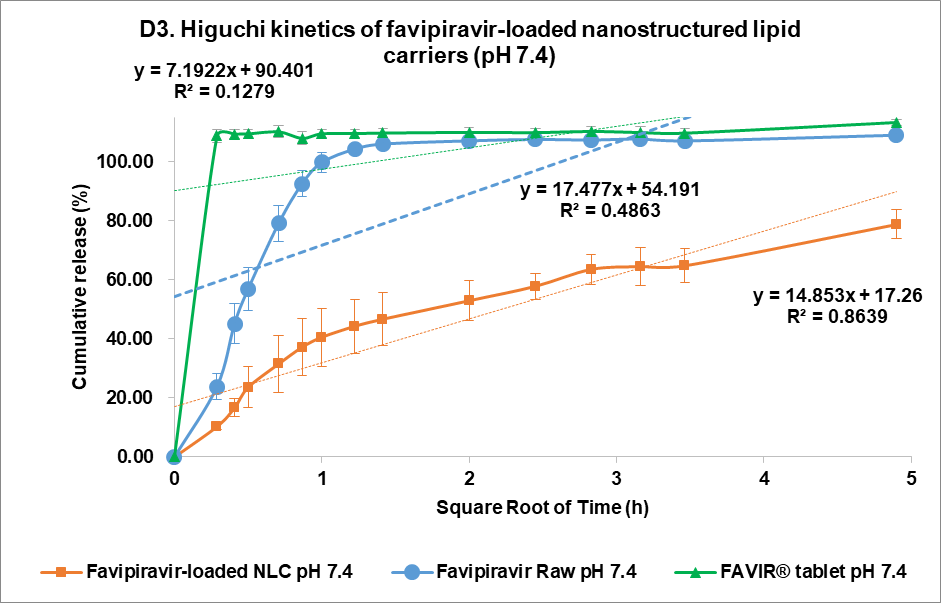
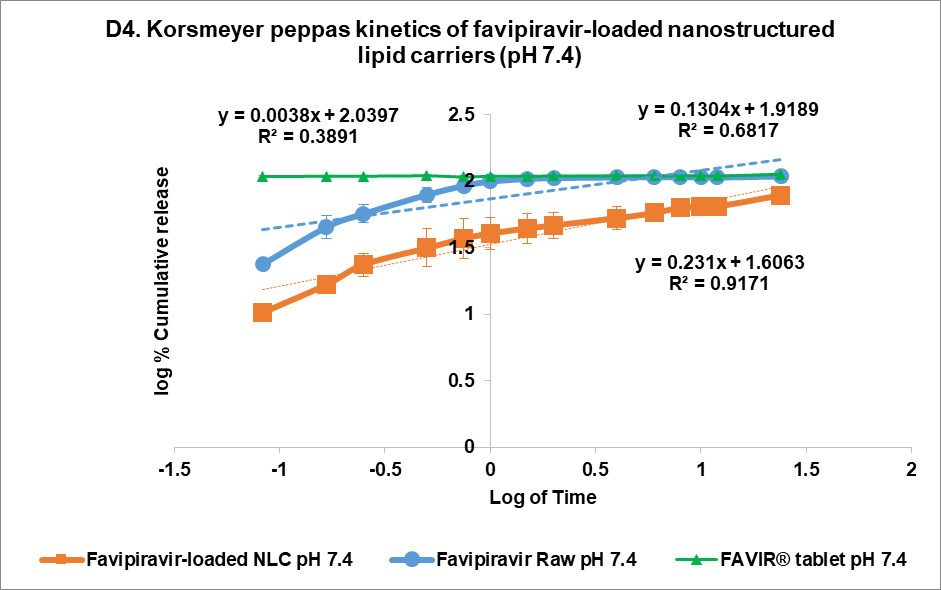
Fig. 5: Release profile and kinetics of optimum favipiravir-loaded nanostructured lipid carriers (F3) in comparison with favipiravir raw materials and FAVIR®(GPO) 200 mg tablet. In vitro dissolution profile in pH 1.2 (A) and pH 7.4 (B). The release kinetics in pH 1.2 (C) and pH 7.4 (D): zero-order (1), first-order (2), Higuchi (3), and Korsmeyer-Peppas (4) models. Data presented as mean±SD (n = 3)
Short-term stability study
A preliminary short-term stability of the F3 formulation was established under three different conditions to refrigerator (5±3 °C), room temperature (25±2 °C, 60±5% RH), and climatic chamber (40±2 °C, 75±5% RH) for 15 d. This would serve as a screening tool in these initial evaluation stages before being further refined in subsequent optimization studies [48]. The particle size remained relatively stable across different storage conditions over the 15 d (fig. 6, about 125 nm). Although there were slight changes in the PDI value between day 0 (0.1386±0.0106) and day 15 (0.1694±0.0134, 0.1675±0.0142, 0.1792±0.0075) for storage in a refrigerator (5±3 °C), at room temperature (25±2 °C, 60±5% RH), and in a climatic chamber (40±2 °C, 75±5% RH), the PDI remained relatively low (<0.3), strongly indicating that the FVP-NLC dispersion was still uniform and consistent size distribution (fig. 6). Furthermore, the zeta potential values showed no significant differences between day 0 (-39.18±0.64 mV) and day 15 under different storage conditions: refrigerator (5±3 °C) at-39.84±0.97 mV, room temperature (25±2 °C, 60±5% RH) at-39.47±0.76 mV, and an accelerated condition (40±2 °C, 75±5% RH) at-38.26±1.87 mV (fig. 6).
Although slight fluctuations were observed over time, the values remained within a stable range, which was also supported by an absence of visible aggregation and phase separation. Finally, the entrapment efficiency was also consistently high across all conditions, showing a minimal decline over time. The highest stability of FVP entrapment was observed at 5 °C from 86.31%±1.46% w/v (day 0) to 85.36%±0.53% w/v (day 15), while the efficiency slightly decreased at elevated temperature (40 °C/75% RH) to 84.74%±1.16% w/v (day 15) (fig. 6). Overall, F3 exhibited good stability under all conditions for 15 d indicated by no significant changes in particle size, PDI, zeta potential, and entrapment efficiency between day-0 and day-15 in all storage conditions (fig. 6).
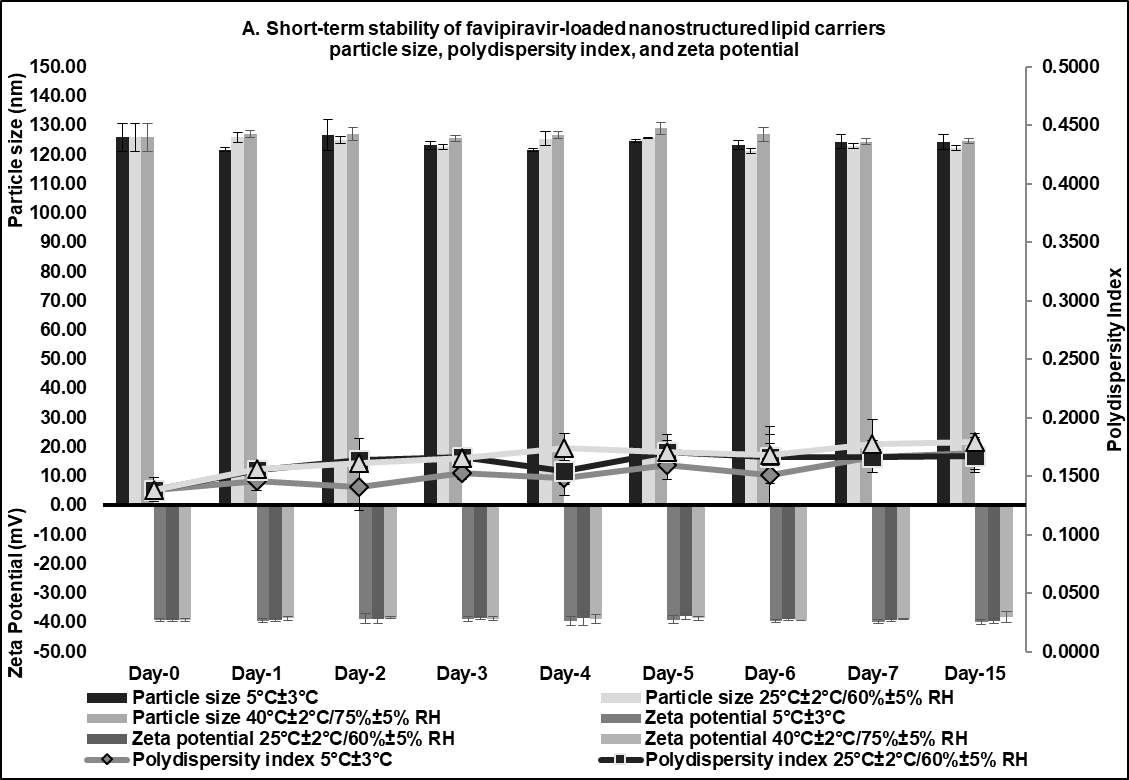
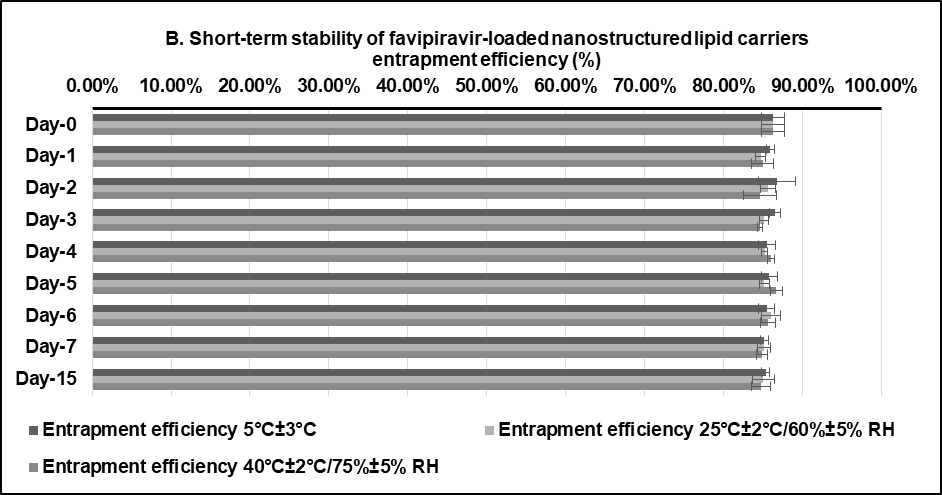
Fig. 6: Short-term stability studies of optimum favipiravir-loaded nanostructured lipid carriers formulation (F3) for 15 d: (A) particle size, polydispersity index, zeta potential, and (B) entrapment efficiency
CONCLUSION
The 26-2 fractional factorial design has been successfully utilized in an FVP-NLC screening formulation to incorporate FVP into the NLC matrix system. The major contributions of independent variables were total lipid, co-surfactant concentrations, and solid lipid combination. Furthermore, the best formulation was F3, consisting of 2% w/v total lipid, 2% w/v co-surfactant, and GMS only, which exhibited a small particle size, a low PDI and zeta potential, and high entrapment efficiency. In vitro release studies indicated controlled release properties via diffusion mechanism over 24 h at pH 7.4, following Korsmeyer-Peppas kinetics. Furthermore, F3 also showed good short-term stability over 15 d of storage in all conditions, especially in a refrigerator (5±3 °C).
ACKNOWLEDGEMENT
MG would like to acknowledge the ASEAN or Non-ASEAN Countries Scholarship granted by the Office of Academic Affairs, Chulalongkorn University, which facilitated the completion of this study as part of the doctoral degree program. The authors would like to acknowledge the Pharmaceutical Research Instrument Center, Faculty of Pharmaceutical Sciences, Chulalongkorn University, for providing the research facility and instruments.
FUNDING
This research project was supported by the Faculty of Pharmaceutical Sciences Fund Chulalongkorn University. The authors expressed their gratitude to the Faculty of Pharmaceutical Sciences, Chulalongkorn University for providing a research fund (Grant number Phar2567_RG010). This work was also partially supported by the Graduate Program of Industrial Pharmacy, Faculty of Pharmaceutical Sciences, Chulalongkorn University.
AUTHORS CONTRIBUTIONS
Maxius Gunawan: Conceptualization, Formal analysis, Methodology, Data curation, Project administration, Visualization, Writing – original draft and review and editing. David G. Fernig: Formal analysis, Supervision, Validation, Writing – review and editing. Veerakiet Boonkanokwong: Formal analysis, Funding acquisition, Investigation, Project administration, Resources, Software, Supervision, Validation, Writing – review and editing. All authors consented to the submission to this journal and granted final approval for the version to be published.
CONFLICT OF INTERESTS
All authors have none to declare
REFERENCES
Hashemian SM, Farhadi T, Velayati AA. A review on favipiravir: the properties function and usefulness to treat COVID-19. Expert Rev Anti Infect Ther. 2021;19(8):1029-37. doi: 10.1080/14787210.2021.1866545, PMID 33372567.
Joshi S, Parkar J, Ansari A, Vora A, Talwar D, Tiwaskar M. Role of favipiravir in the treatment of COVID-19. Int J Infect Dis. 2021 Jan;102:501-8. doi: 10.1016/j.ijid.2020.10.069, PMID 33130203.
Goktug O, Altas E, Kayar G, Gokalp M. The development and the validation of a novel dissolution method of favipiravir film coated tablets. Sci Pharm. 2021;90(1):3. doi: 10.3390/scipharm90010003.
Timur SS, Atasoglu M, Oner Y, Karabulut TC, Eroglu H. In vitro studies for BCS classification of an antiviral agent favipiravir. J Res Pharm. 2021;25(6):944-52. doi: 10.29228/jrp.91.
Mahaparale SP. Development and evaluation of favipiravir agglomerates for direct compression by crystallo-co-agglomeration technique. Int J Pharm Sci Res. 2023;14(1):924-33. doi: 10.13040/IJPSR.0975-8232.14(2).924-33.
Jafar G, Abdassah M, Rusdiana T, Khairunisa R. Development and characterization of precirol ato 88 base in nanostructured lipid carriers (NLC) formulation with the probe sonication method. Int J Appl Pharm. 2021;13(3):43-6. doi: 10.22159/ijap.2021.v13s3.08.
Abdi Syahputra R, Dalimunthe A, Utari ZD, Halim P, Sukarno MA, Zainalabidin S. Nanotechnology and flavonoids: current research and future perspectives on cardiovascular health. J Funct Foods. 2024;120:106355. doi: 10.1016/j.jff.2024.106355.
Ramachandran KM, Tsokos CP. Chapter 9. Design of experiments. In: Ramachandran KM, Tsokos CP, editors. Mathematical statistics with applications in R. 2nd ed. Cambridge: Elsevier; 2015. p. 459-94. doi: 10.1016/B978-0-12-417113-8.00009-6.
Beg S. Response surface designs and their applications in pharmaceutical development. In: Beg S, editor. Design of experiments for pharmaceutical product development. Vol. I. Singapore: Springer; 2021. p. 27-41. doi: 10.1007/978-981-33-4717-5_3.
Mall J, Naseem N, Haider MF, Rahman MA, Khan S, Siddiqui SN. Nanostructured lipid carriers as a drug delivery system: a comprehensive review with therapeutic applications. Intelligent Pharmacy. 2024. doi: 10.1016/j.ipha.2024.09.005.
Gunawan M, Boonkanokwong V. Current applications of solid lipid nanoparticles and nanostructured lipid carriers as vehicles in oral delivery systems for antioxidant nutraceuticals: a review. Colloids Surf B Biointerfaces. 2024 Jan;233:113608. doi: 10.1016/j.colsurfb.2023.113608, PMID 37925866.
Elmowafy M, Al Sanea MM. Nanostructured lipid carriers (NLCs) as drug delivery platform: advances in formulation and delivery strategies. Saudi Pharm J. 2021;29(9):999-1012. doi: 10.1016/j.jsps.2021.07.015, PMID 34588846.
Ortiz AC, Yanez O, Salas Huenuleo E, Morales JO. Development of a nanostructured lipid carrier (nlc) by a low energy method comparison of release kinetics and molecular dynamics simulation. Pharmaceutics. 2021;13(4):531. doi: 10.3390/pharmaceutics13040531, PMID 33920242.
Heade J, Maher S, Bleiel SB, Brayden DJ. Labrasol® and salts of medium chain fatty acids can be combined in low concentrations to increase the permeability of a macromolecule marker across isolated rat intestinal mucosae. J Pharm Sci. 2018;107(6):1648-55. doi: 10.1016/j.xphs.2018.02.012, PMID 29462634.
Ma L, Wei Y, Zhou Y, Ma X, Wu X. Effects of pluronic F68 and Labrasol on the intestinal absorption and pharmacokinetics of rifampicin in rats. Arch Pharm Res. 2011;34(11):1939-43. doi: 10.1007/s12272-011-1114-z, PMID 22139693.
McCartney F, Jannin V, Chevrier S, Boulghobra H, Hristov DR, Ritter N. Labrasol® is an efficacious intestinal permeation enhancer across rat intestine: ex vivo and in vivo rat studies. J Control Release. 2019;310:115-26. doi: 10.1016/j.jconrel.2019.08.008, PMID 31401199.
Duong VA, Nguyen TT, Maeng HJ. Preparation of solid lipid nanoparticles and nanostructured lipid carriers for drug delivery and the effects of preparation parameters of solvent injection method. Molecules. 2020;25(20):4781. doi: 10.3390/molecules25204781, PMID 33081021.
Li Q, Cai T, Huang Y, Xia X, Cole SP, Cai Y. A review of the structure preparation and application of NLCs, PNPs, and PLNs. Nanomaterials (Basel). 2017;7(6):122. doi: 10.3390/nano7060122, PMID 28554993, PMCID PMC5485769.
Takechi Haraya Y, Ohgita T, Demizu Y, Saito H, Izutsu KI, Sakai Kato K. Current status and challenges of analytical methods for evaluation of size and surface modification of nanoparticle based drug formulations. AAPS PharmSciTech. 2022;23(5):150. doi: 10.1208/s12249-022-02303-y, PMID 35596094.
Ross Hallett F. Particle size analysis by dynamic light scattering. Food Res Int. 1994;27(2):195-8. doi: 10.1016/0963-9969(94)90162-7.
Gope Edward R, Srikanth P, Suneetha Y. Novel ultra performance liquid chromatography method for concurrent estimation and pharmacokinetic analysis of favipiravir and molnupiravir in rat plasma. Asian J Pharm Clin Res. 2025;18(2):90-5. doi: 10.22159/ajpcr.2025v18i2.53662.
Almousallam M, Moia C, Zhu H. Development of nanostructured lipid carrier for dacarbazine delivery. Int Nano Lett. 2015;5(4):241-8. doi: 10.1007/s40089-015-0161-8.
Shah NV, Seth AK, Balaraman R, Aundhia CJ, Maheshwari RA, Parmar GR. Nanostructured lipid carriers for oral bioavailability enhancement of raloxifene: design and in vivo study. J Adv Res. 2016;7(3):423-34. doi: 10.1016/j.jare.2016.03.002, PMID 27222747.
Eedara BB, Bastola R, Das SC. Dissolution and absorption of inhaled drug particles in the lungs. Pharmaceutics. 2022;14(12):2667. doi: 10.3390/pharmaceutics14122667, PMID 36559160, PMCID PMC9781681.
Nokhodchi A, Chavan S, Ghafourian T. In vitro dissolution and permeability testing of inhalation products: challenges and advances. Pharmaceutics. 2023;15(3):983. doi: 10.3390/pharmaceutics15030983, PMID 36986844, PMCID PMC10059005.
Bruschi ML. Chapter 5. Mathematical models of drug release. In: Strategies to modify the drug release from pharmaceutical systems. Woodhead Publishing; 2015. p. 63-86.
Trucillo P. Drug carriers: a review on the most used mathematical models for drug release. Processes. 2022;10(6):1094. doi: 10.3390/pr10061094.
Mircioiu C, Voicu V, Anuta V, Tudose A, Celia C, Paolino D. Mathematical modeling of release kinetics from supramolecular drug delivery systems. Pharmaceutics. 2019;11(3):140. doi: 10.3390/pharmaceutics11030140, PMID 30901930, PMCID PMC6471682.
Unnisa A, Chettupalli AK, Alazragi RS, Alelwani W, Bannunah AM, Barnawi J. Nanostructured lipid carriers to enhance the bioavailability and solubility of ranolazine: statistical optimization and pharmacological evaluations. Pharmaceuticals (Basel). 2023;16(8):1151. doi: 10.3390/ph16081151, PMID 37631066.
Garg NK, Tandel N, Bhadada SK, Tyagi RK. Nanostructured lipid carrier mediated transdermal delivery of aceclofenac hydrogel present an effective therapeutic approach for inflammatory diseases. Front Pharmacol. 2021;12:713616. doi: 10.3389/fphar.2021.713616, PMID 34616297, PMCID PMC8488093.
Azhar Shekoufeh Bahari L, Hamishehkar H. The impact of variables on particle size of solid lipid nanoparticles and nanostructured lipid carriers; a comparative literature review. Adv Pharm Bull. 2016;6(2):143-51. doi: 10.15171/apb.2016.021, PMID 27478775, PMCID PMC4961971.
Zirak M, Pezeshki A. Effect of surfactant concentration on the particle size, stability and potential zeta of beta carotene nano lipid carrier. Int J Curr Microbiol Appl Sci. 2015;4(9):924-32.
Houacine C, Adams D, Singh KK. Impact of liquid lipid on development and stability of trimyristin nanostructured lipid carriers for oral delivery of resveratrol. J Mol Liq. 2020;316:113734. doi: 10.1016/j.molliq.2020.113734.
Zingale E, Rizzo S, Bonaccorso A, Consoli V, Vanella L, Musumeci T. Optimization of lipid nanoparticles by response surface methodology to improve the ocular delivery of diosmin: characterization and in vitro anti-inflammatory assessment. Pharmaceutics. 2022;14(9):1961. doi: 10.3390/pharmaceutics14091961, PMID 36145708.
Sakellari GI, Zafeiri I, Batchelor H, Spyropoulos F. Formulation design production and characterisation of solid lipid nanoparticles (SLN) and nanostructured lipid carriers (NLC) for the encapsulation of a model hydrophobic active. Food Hydrocoll Health. 2021;1:100024. doi: 10.1016/j.fhfh.2021.100024, PMID 35028634, PMCID PMC8721956.
Badawi N, El Say K, Attia D, El Nabarawi M, Elmazar M, Teaima M. Development of pomegranate extract loaded solid lipid nanoparticles: quality by design approach to screen the variables affecting the quality attributes and characterization. ACS Omega. 2020;5(34):21712-21. doi: 10.1021/acsomega.0c02618, PMID 32905321, PMCID PMC7469390.
Apostolou M, Assi S, Fatokun AA, Khan I. The effects of solid and liquid lipids on the physicochemical properties of nanostructured lipid carriers. J Pharm Sci. 2021;110(8):2859-72. doi: 10.1016/j.xphs.2021.04.012, PMID 33901564.
Chinsriwongkul A, Chareanputtakhun P, Ngawhirunpat T, Rojanarata T, Sila on W, Ruktanonchai U. Nanostructured lipid carriers (NLC) for parenteral delivery of an anticancer drug. AAPS PharmSciTech. 2012;13(1):150-8. doi: 10.1208/s12249-011-9733-8, PMID 22167418, PMCID PMC3299450.
Nemeth Z, Csoka I, Semnani Jazani R, Sipos B, Haspel H, Kozma G. Quality by design driven zeta potential optimisation study of liposomes with charge imparting membrane additives. Pharmaceutics. 2022;14(9):1798. doi: 10.3390/pharmaceutics14091798, PMID 36145546, PMCID PMC9503861.
Hyun JE, Yi HY, Hong GP, Chun JY. Digestion stability of curcumin loaded nanostructured lipid carrier. LWT. 2022;162:2022.113474. doi: 10.1016/j.lwt.2022.113474.
Marzouk HM, Rezk MR, Gouda AS, Abdel Megied AM. A novel stability indicating HPLC-DAD method for determination of favipiravir a potential antiviral drug for COVID-19 treatment; application to degradation kinetic studies and in vitro dissolution profiling. Microchem J. 2022 Jan;172:106917. doi: 10.1016/j.microc.2021.106917, PMID 34667334, PMCID PMC8518200.
Agrawal M, Saraf S, Pradhan M, Patel RJ, Singhvi G, Ajazuddin. Design and optimization of curcumin loaded nano lipid carrier system using box-behnken design. Biomed Pharmacother. 2021;141:111919. doi: 10.1016/j.biopha.2021.111919, PMID 34328108.
Elkhayat D, Abdelmalak NS, Amer R, Awad HH. Ezetimibe loaded nanostructured lipid carrier for oral delivery: response surface methodology; in vitro characterization and assessing the antihyperlipidemic effect in rats. ACS Omega. 2024;9(7):8103-16. doi: 10.1021/acsomega.3c08428, PMID 38405515.
Ainurofiq A, Choiri S. Model and release pattern of water soluble drug from natural polymer based sustained release tablet dosage form. Int J Pharm Pharm Sci. 2014;6(9):179-82.
Arbain NH, Salim N, Masoumi HR, Wong TW, Basri M, Abdul Rahman MB. In vitro evaluation of the inhalable quercetin loaded nanoemulsion for pulmonary delivery. Drug Deliv Transl Res. 2019;9(2):497-507. doi: 10.1007/s13346-018-0509-5, PMID 29541999.
Ahalwat S, Bhatt DC. Development of novel lipid matrix for improved sustained release effect of a hydrophilic drug via response surface methodology. J Drug Deliv Sci Technol. 2022 Jan;67:102993. doi: 10.1016/j.jddst.2021.102993.
Shah J, Patel S, Bhairy S, Hirlekar R. Formulation optimization characterization and in vitro anti-cancer activity of curcumin loaded nanostructured lipid carriers. Int J Curr Pharm Res. 2022;14(1):31-43. doi: 10.22159/ijcpr.2022v14i1.44110.
Makoni PA, Wa Kasongo K, Walker RB. Short term stability testing of efavirenz loaded solid lipid nanoparticle (SLN) and nanostructured lipid carrier (NLC) dispersions. Pharmaceutics. 2019;11(8):397. doi: 10.3390/pharmaceutics11080397, PMID 31398820.