
Int J App Pharm, Vol 17, Issue 5, 2025, 320-331Original Article
DEVELOPMENT AND OPTIMIZATION OF SOLID LIPID NANOPARTICLES OF ERLOTINIB USING DESIGN OF EXPERIMENTS: IN VITRO DRUGRELEASE AND IN VIVO PHARMACOKINETIC STUDIES
CHANDU VAMSHI GANGULA1*, SEEMA TOMAR2, POLI REDDYPAPAGATLA3
1*Department of Pharmaceutics, FoPS, Motherhood University, Roorkee, India. 2HOD Pharmaceutical Chemistry, FoPS, Motherhood University, Roorkee, India. 3Department of Pharmacology, Nalanda College of Pharmacy, Nalgonda, Telangana, India
*Corresponding author: Chandu Vamshi Gangula; *Email: gcvyadav@gmail.com
Received: 08 Feb 2025, Revised and Accepted: 10 Jun 2025
ABSTRACT
Objective: This study aimed to develop and optimize erlotinib-loaded solid lipid nanoparticles (ERL-SLNs) using response surface methodology (RSM) with a box-behnken design. The goal was to enhance the drug's solubility, stability, and bioavailability by optimizing key formulation parameters and evaluating the in vitro and in vivo performance of the nanoparticles.
Methods: ERL-SLNs were prepared using the hot homogenization method. Key formulation parameters, including the Quantity of Lipid, Concentration of Tween 80, and Homogenization Time, were optimized using RSM to achieve desirable characteristics such as Particle Size, Entrapment Efficiency, and Zeta Potential. The optimized ERL-SLNs were characterized for in vitro drug release using dissolution studies and fitted to various kinetic models. In vivo pharmacokinetic studies were conducted to evaluate the drug's bioavailability, maximum plasma concentration (Cmax), time to maximum concentration (Tmax), and half-life (t½) in comparison to conventional Erlotinib.
Results: The optimized ERL-SLNs exhibited a Particle Size of 152.8 nm, Entrapment Efficiency of 87.6%, and Zeta Potential of-23.4 mV. The in vitro drug release study demonstrated a significant enhancement in the release profile of ERL-SLNs (85.4% in 24 h) compared to free Erlotinib (42.3% in 24 h). The release kinetics best fit the Korsmeyer-Peppas model (R² = 0.9942, n = 0.71), indicating a non-Fickian diffusion mechanism involving both drug diffusion and nanoparticle erosion. Pharmacokinetic analysis revealed a higher Cmax (1408.35 ng/ml) for ERL-SLNs compared to conventional Erlotinib (1185.81 ng/ml), along with a prolonged Tmax (6 h vs. 4 h) and extended t½ (6.88 h vs. 3.7 h).
Conclusion: The study demonstrates that ERL-SLNs significantly improve the solubility, stability, and bioavailability of Erlotinib. The optimized formulation exhibited controlled drug release, enhanced pharmacokinetic properties, and prolonged therapeutic efficacy, highlighting its potential as an effective drug delivery system for Erlotinib.
Keywords: Erlotinib, Nanoparticles, Lauric acid, Design of experiments, In vivo pharmacokinetics
© 2025 The Authors. Published by Innovare Academic Sciences Pvt Ltd. This is an open access article under the CC BY license (https://creativecommons.org/licenses/by/4.0/)
DOI: https://dx.doi.org/10.22159/ijap.2025v17i5.53909 Journal homepage: https://innovareacademics.in/journals/index.php/ijap
INTRODUCTION
Erlotinib, a potent tyrosine kinase inhibitor, has demonstrated promising results in the treatment of non-small cell lung cancer (NSCLC) [1], and pancreatic cancer [2]. However, its clinical efficacy is hindered by challenges associated with its physicochemical properties and biopharmaceutical limitations.
Physicochemical limitations of erlotinib, including poor aqueous solubilityand low bioavailability, pose significant hurdles to its effective delivery [3]. Erlotinib belongs to the biopharmaceutics classification system (BCS) class II, characterized by low solubility and high permeability (The maximal solubility of erlotinib is ~ 0.4 mg/ml at a pH of approximately 2 and highly permeable (log P = 2.7)) [4]. These properties often lead to suboptimal drug dissolution and absorption, limiting the overall bioavailability (59%) and therapeutic efficacy of the drug [5]. Moreover, the high lipophilicity of erlotinib further complicates its formulation in traditional drug delivery systems.
In addition to physicochemical challenges, the biopharmaceutical limitations of erlotinib, such as its vulnerability to degradation and limited residence time in systemic circulation, contribute to suboptimal therapeutic outcomes. The rapid metabolism and clearance of erlotinib necessitate frequent and high-dose administrations, leading to potential toxicity concerns and patient discomfort [6]. Furthermore, the clinical utility of ERL chemotherapy is hindered by its associated toxicities, such as skin rash, diarrhoea, and anorexia [7, 8]. Consequently, various approaches have been investigated to enhance the therapeutic potential of ERL and mitigate its toxicity. These strategies include the exploration of lipid-based formulations [9], micellar systems [10], and polymeric nanoparticles [11].
Solid lipid nanoparticles (SLNs) present a novel and promising approach to overcome these challenges and enhance the therapeutic potential of erlotinib. SLNs present an innovative solution to address these challenges in erlotinib drug delivery. SLNs are nanoscale colloidal carriers composed of biocompatible lipids, offering a unique platform for the encapsulation and controlled release of hydrophobic drugs like erlotinib [12, 13]. The lipid matrix of SLNs provides a protective environment for the drug, enhancing its stability and preventing premature degradation. Compared to polymeric nanoparticles, SLNs offer superior biocompatibility and controlled release, making them ideal for sustained drug delivery. Unlike liposomes, which are prone to instability and low drug-loading capacity, SLNs provide a more robust and scalable platform for hydrophobic drugs like Erlotinib. Additionally, SLNs are cost-effective and easier to manufacture, making them a promising alternative for clinical applications [14].
Furthermore, the small particle size and large surface area of SLNs contribute to improved drug solubility, dissolution, and absorption, ultimately enhancing bioavailability.
The incorporation of erlotinib into SLNs not only mitigates its physicochemical and biopharmaceutical limitations but also facilitates sustained and controlled drug release. This controlled release profile can lead to prolonged drug circulation, reduced frequency of administration, and enhanced therapeutic efficacy. Additionally, the potential for targeted drug delivery to the site of action is increased, minimizing off-target effects and improving overall patient compliance.
The utilization of solid lipid nanoparticles as a drug delivery system for erlotinib holds great promise in overcoming the physicochemical and biopharmaceutical challenges associated with this anticancer agent. This approach has the potential to significantly improve the therapeutic outcomes of erlotinib, paving the way for more effective and patient-friendly treatment strategies in the management of lung and pancreatic cancers.
MATERIALS AND METHODS
Erlotinib HCl was kind gift sample from RX Innovation Pvt Ltd, Hyderabad, India. Lauric acid and Tween 80 were procured from Sd Fine Chem Ltd, Hyderabad, India.
Design of experiments
Erlotinib loaded solid lipid nanoparticles (ERL-SLNs) were systematically designed and optimized using a response surface methodology (RSM) with a Box-Behnken design. The design aimed to investigate the influence of critical factors on the formulation of ERL-SLNs, utilizing a quadratic model. The study involved 17 experimental runs, and the critical factors selected for optimization included the quantity of lipid (Factor A), concentration of tween 80 (Factor B), and homogenization time (Factor C) [15].
The Box-Behnken design with a quadratic model facilitated a comprehensive exploration of the critical factors influencing the formulation of ERL-SLNs. The Quantity of Lipid (Factor A) is a key parameter affecting the nanoparticle structure, with the design encompassing a range from 100.00 mg to 400.00 mg. The concentration of tween 80 (Factor B) played a vital role, varying between 1.00% and 3.00% (w/v), impacting the stability and size distribution of the nanoparticles. The homogenization time (Factor C) ranged from 4.00 to 10.00 min, influencing the efficiency of the homogenization process in the formation of ERL-SLNs.
The critical responses, including particle size (R1), entrapment efficiency (R2), and zeta potential (R3), were monitored across the experimental runs. These responses serve as key indicators of the quality and performance of ERL-SLNs. The comprehensive design and analysis aim to identify the optimal conditions for ERL-SLNs formulation, considering the interplay of the selected critical factors.
Preparation of ERL-SLNs
In the present study, ERL-SLNs were accurately formulated employing the hot homogenization method, representing a sophisticated approach towards enhancing the bioavailability and efficacy of erlotinib [16]. A consistent amount of 100 mg of Erlotinib was maintained across all experimental runs, while the weights of lauric acid and surfactant were systematically varied according to the specified experimental design runs. The method began with the precise melting of a predefined quantity of lauric acid in a 10 ml conical flask, rigorously controlled at a temperature of 60 °C. Subsequently, 100 mg of enzalutamide was incorporated into the molten lauric acid within the conical flask, ensuring the formation of a homogeneous mixture through thorough stirring. Concurrently, in a 100 ml beaker, a solution of tween 80 was prepared at 60 °C and stirred continuously. The molten lipid-enzalutamide solution was then introduced to the aqueous surfactant layer with continuous stirring, resulting in the formation of a stable emulsion. The emulsion then subjected a high-speed homogenization process at 14000 rpm for different specified durations to achieve optimal particle size and distribution. Later, the emulsion was carefully cooled to room temperature while continuously stirring at 500rpm. Following the homogenization and cooling steps, the cooled mixture underwent centrifugation at 20,000 rpm for 30 minto separate SLNs from larger aggregates. The supernatant, enriched with SLNs, was collected and subjected to lyophilization, culminating in the acquisition of a finely powdered ERL-SLNs product.
Characterization of ERL-SLNs
Particle size and polydispersity index (PDI) and analysis
The particle size of all produced ERL-SLNs batches was assessed using equipment from Malvern Instruments Ltd, Worcestershire, UK. This analysis aimed to determine the uniformity of particle size distribution and the size range of the ERL-SLNs. Prior to each analysis, the ERL-SLNs were suitably diluted with distilled water [17].
Zeta potential
Zeta potential measurement serves to assess the surface charge of the particles and was conducted to evaluate the stability of the nanoparticles within the suspension. The zeta potential (ZP) of these developed formulations was measured using a Zetasizer, from Malvern Instruments Ltd, Worcestershire, UK. The instrument was operated at a constant room temperature, employing a clean, disposable zeta cell [17]. The average particle size, PDI and ZP of the ERL-SLNs were determined and then averaged from three independent measurements.
Entrapment efficiency and drug loading
For encapsulation studies, the dispersion of ERL-SLNs was centrifuged at 20,000 rpm at 4 C for 30 min using a cold centrifuge (Sigma Labort Centrifuge GmbH, Germany). After centrifugation, the supernatant and the precipitation obtained were separated and analysed for the drug concentration using a UV spectrophotometer at wavelength 236 nm [17].
The encapsulation efficiency and percent drug loading were calculated using the following formulae:

FTIR studies
FTIR spectra were generated for various substances, including pure Erlotinib, Lauric acid, polysorbate 80, and the optimized ERL-SLNs. This was accomplished by blending these samples with FTIR-grade KBr and compressing the mixture into transparent pellets using a die. The scanning process covered a wavenumber range from 4000 to 400 cm-1 with Bruker Tensor FTIR instrument. In this analysis, each sample was exposed to infrared (IR) photons, allowing for the identification of distinctive functional group signatures within the chemical compounds. These spectral fingerprints were utilized to infer potential chemical interactions occurring between the drug, formulation ingredients and also nanoparticles [17].
Thermal analysis by differential scanning calorimetry
DSC (Differential Scanning Calorimetry) curves were generated for pure Erlotinib, Lauric acid, and the optimized ERL-SLNs using a thermos-analytical technique employing the Scinco N650 instruments, Korea. Each sample of 5 mg quantity, was tightly packed into a hemispherical aluminium pan, individually placed adjacent to a reference pan left empty. The analysis chamber was supplied with nitrogen at a flow rate of 20 ml/min, and the temperature was incrementally increased at a rate of 20 °C within the range of 50–250 °C [17].
Surface morphology
The surface morphology of the optimized ERL-SLNs was assessed through Scanning Electron Microscopy (SEM) using a Zeiss EVO LS10 instrument. The sample was affixed onto a stub and subjected to a gold-sputter process for coating before imaging was conducted [17].
In vitro drug release study and kinetic modelling
In vitro drug release studies of pure Erlotinib and optimized ERL-SLNs were conducted using dialysis bag (Hi-media Mol. 12,000 Dalton) diffusion technique. The sample of ERL-SLNs (Weight equivalent to 150 mg of Erlotinib) was sealed in the dialysis membrane bag. The dialysis bag was placed in the cylindrical vessel of a USP Dissolution Apparatus II (Lab India DS 8000, Mumbai, India) containing 200 ml of dissolution medium (0.1N HCl), maintained at 37±0.5 °C, with a rotation speed set to 75 rpm. At pre-determined time interval (0.5, 1, 2, 4, 6, 8, 12, and 24h) 2 ml sample is withdrawn from outer solution at each time interval and replaced by fresh 0.1N HCl medium to maintain sink conditions. The aliquots were filtered and analysed for drug release by using UV-spectrophotometer at 236 nm (Jasco V-630 Made in Japan). The experiment was done in triplicate.
The drug release data underwent fitting to various kinetic models, including the zero-order, first-order, Higuchi, and Korsmeyer-Peppas models. These models were applied by establishing relationships between the percentage of drug release per unit time, the percentage of log cumulative drug release per unit time, the percentage of log cumulative drug release per unit square root of time, and the percentage of log cumulative drug release per unit log of time, respectively. The selection of the most appropriate model for describing the medication release was determined based on the highest correlation coefficient value (R²). Additionally, the release-exponent, which provides insights into the mechanism of drug release, was calculated using the slope and R² values obtained from the respective plots [17].
In vivo pharmacokinetics study
Female Sprague Dawley rats (180–200 g) were procured from the animal facility of Ziva Life Sciences. The study was conducted following approval from the Institutional Animal Ethics Committee (IAEC), Jeeva Life Sciences, Hyderabad, India (1757/PO/RcBiBtNRc/S/14/CPCSEA). Animals were housed under controlled conditions (25±2 °C, 50–60% relative humidity) with natural light/dark cycles and acclimatized for one week prior to the experiment. The rats were randomly assigned to two groups (n = 5 per group). Following an overnight fast (12 h) with ad libitum access to water, Group 1 received ERL-PC orally at a dose equivalent to 10 mg/kg of Erlotinib (ERL), while Group 2 received ERL suspended in 0.2% w/v carboxymethyl cellulose at the same dose. Blood samples (250 µl**) were collected from the tail vein into heparinized microcentrifuge tubes at predetermined time intervals (0.5, 1, 2, 4, 6, 8, 12, and 24 h). The samples were centrifuged at 10,000 rpm for 5 min to separate plasma, which was then stored at –20 °C until analysis [18]. Plasma concentrations of ERL were quantified using a previously validated HPLC method [19]. The non-compartmental pharmacokinetic evaluation was carried out using the "Phoenix WinNonlin PK/PD Analysis Tool" developed by Certara, USA, in order to determine a range of pharmacokinetic parameters. The results were expressed as mean±standard deviation (SD). Pharmacokinetic parameters, including peak plasma concentration (Cmax), time to reach peak concentration (Tmax), area under the curve (AUC), and [(AUC0–24) (AUC0–∞)], half-life (T1/2), rate constant (Kz), mean residence time (MRT), were estimated. An unpaired t-test was used to statistically compare the ERL-SLNs formulation and the standard ERL suspension. The level of statistical significance was chosen at p<0.05.
RESULTS AND DISCUSSION
Design of experiments
The study followed the Box-Behnken design with accurately executed series of seventeen experiments, maintaining adherence to a predetermined framework. The Box-Behnken design was selected due to its efficiency in exploring quadratic interactions with fewer experimental runs compared to CCD, making it more cost-effective and time-efficient. This systematic approach enabled the acquisition of data for key response variables—Particle Size (R1), Entrapment Efficiency (R2), and Zeta Potential (R3). Findings of the response variables were presented in table 1, offering a clear and comprehensive analysis of the experimental parameters' effects on these variables. Table 2 displays the ANOVA results for each response variable, obtained using Design Expert 13.0.
Particle size
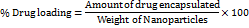
The quadratic model, with an Adjusted R² of 0.9703, effectively explains 97.03% of the response variability. The Lack of Fit p-value (0.1216) confirms the model's appropriateness by showing the non-significance of lack of fit relative to pure error. ANOVA results underscore the significance (p-value<0.0001) of the quadratic model, demonstrating the substantial influence of Quantity of Lipid, Concentration of Tween 80, and Homogenization time on ERL-SLNs' Particle Size. Notably, individual factors (A, B, C) and interaction effects (AB, AC, BC) alongside quadratic terms (A², B², C²) all significantly contribute to the model. The model equation 1 (Eq.1) for particle size (R1) disclose the overall impact of critical factors on particle size of ERL-SLNs.
Particle size = 265+40.125 *A+-32.75 *B+-25.875 *C+20 *AB+12.25 *AC+6 *BC+22.875 *A2+33.625 *B2+6.875 *C2 …Eq.1
The perturbation plot of all factors, as shown in fig. 1, reveals that an increase in the Quantity of Lipid (A) is positively correlated with a rise in Particle Size, as indicated by a coefficient of 40.125. This positive correlation can be attributed to the higher lipid content, which likely affects the structural organization of the nanoparticles, leading to larger particle sizes. The plot underscores the sensitivity of Particle Size to variations in the Quantity of Lipid, highlighting its critical role in nanoparticle formulation.
Table 1: Summary of results of experimental design
| Run | Factor 1 | Factor 2 | Factor 3 | Response 1 | Response 2 | Response 3 |
| A: Quantity of lipid | B: Concentration of tween 80 | C: Homogenization time | Particle size | Entrapment efficiency | Zeta potential | |
| mg | %w/v | min | nm | % | mv | |
| 1 | 400 | 2 | 10 | 330 | 68.8 | -15.4 |
| 2 | 250 | 1 | 10 | 305 | 70.2 | -17.2 |
| 3 | 250 | 3 | 4 | 294 | 73.7 | -17.9 |
| 4 | 250 | 2 | 7 | 272 | 76.7 | -18.7 |
| 5 | 100 | 3 | 7 | 236 | 82.5 | -24.7 |
| 6 | 400 | 2 | 4 | 351 | 66.4 | -14.9 |
| 7 | 250 | 2 | 7 | 265 | 75.8 | -19.8 |
| 8 | 250 | 2 | 7 | 269 | 76.4 | -18.6 |
| 9 | 400 | 3 | 7 | 345 | 64.9 | -15.1 |
| 10 | 100 | 1 | 7 | 338 | 68.3 | -15.2 |
| 11 | 100 | 2 | 10 | 214 | 85.6 | -25.8 |
| 12 | 250 | 2 | 7 | 261 | 76.1 | -20.9 |
| 13 | 250 | 2 | 7 | 258 | 75.9 | -21.6 |
| 14 | 100 | 2 | 4 | 284 | 74.8 | -18.2 |
| 15 | 250 | 3 | 10 | 248 | 77.5 | -22.5 |
| 16 | 400 | 1 | 7 | 367 | 62.2 | -12.2 |
| 17 | 250 | 1 | 4 | 375 | 60.5 | -11.5 |
The cooperative effect between Quantity of Lipid (A) and Concentration of Tween 80 (B), denoted by a positive coefficient of 20, suggests that simultaneous variations in lipid quantity and surfactant concentration contribute to larger particle sizes. Additionally, the quadratic terms for the Quantity of Lipid (A) and the Concentration of Tween 80 (B) exhibit positive coefficients of 22.875 and 33.625, respectively. This suggests a significant non-linear relationship between these variables and Particle Size. The positive coefficients indicate that an increase in the levels of A and B leads to a more pronounced rise in Particle Size at higher values, highlighting the influence of these factors on the response. This trend is clearly illustrated by the curvature observed in the 3D response surface plots shown in fig. 1, which emphasize the interactive and quadratic effects of the variables on Particle Size.
The negative coefficient (-32.75) associated with Concentration of Tween 80 suggests that an increase in Tween 80 concentration has a diminishing effect on Particle Size. Higher surfactant concentrations typically lead to smaller particle sizes, enhancing the stability of nanoparticles. The negative coefficient (-25.875) for Homogenization time implies that longer homogenization times result in a reduction in Particle Size. Prolonged homogenization allows for more effective particle size reduction during the formulation process.
Table 2: Statistical ANOVA results of response variables
| Source | Particle size (R1) | Entrapment efficiency (R2) | Zeta potential (R3) | ||||
| F-value | p-value | F-value | p-value | F-value | p-value | ||
| Model | 59.10 | <0.0001 | 237.07 | <0.0001 | 24.96 | 0.0002 | significant |
| A-Quantity of Lipid | 185.61 | <0.0001 | 850.36 | <0.0001 | 77.14 | <0.0001 | |
| B-Concentration of Tween 80 | 123.65 | <0.0001 | 497.43 | <0.0001 | 64.78 | <0.0001 | |
| C-Homogenization time | 77.19 | <0.0001 | 253.52 | <0.0001 | 37.76 | 0.0005 | |
| AB | 23.06 | 0.0020 | 94.06 | <0.0001 | 9.72 | 0.0169 | |
| AC | 8.65 | 0.0217 | 50.18 | 0.0002 | 11.24 | 0.0122 | |
| BC | 2.08 | 0.1929 | 24.76 | 0.0016 | 0.2699 | 0.6194 | |
| A² | 31.75 | 0.0008 | 32.22 | 0.0008 | 3.11 | 0.1211 | |
| B² | 68.60 | <0.0001 | 307.31 | <0.0001 | 18.35 | 0.0036 | |
| C² | 2.87 | 0.1342 | 4.91 | 0.0623 | 0.7109 | 0.4270 | |
| Lack of fit | 3.65 | 0.1216 | 4.65 | 0.0858 | 0.1551 | 0.9212 | not significant |
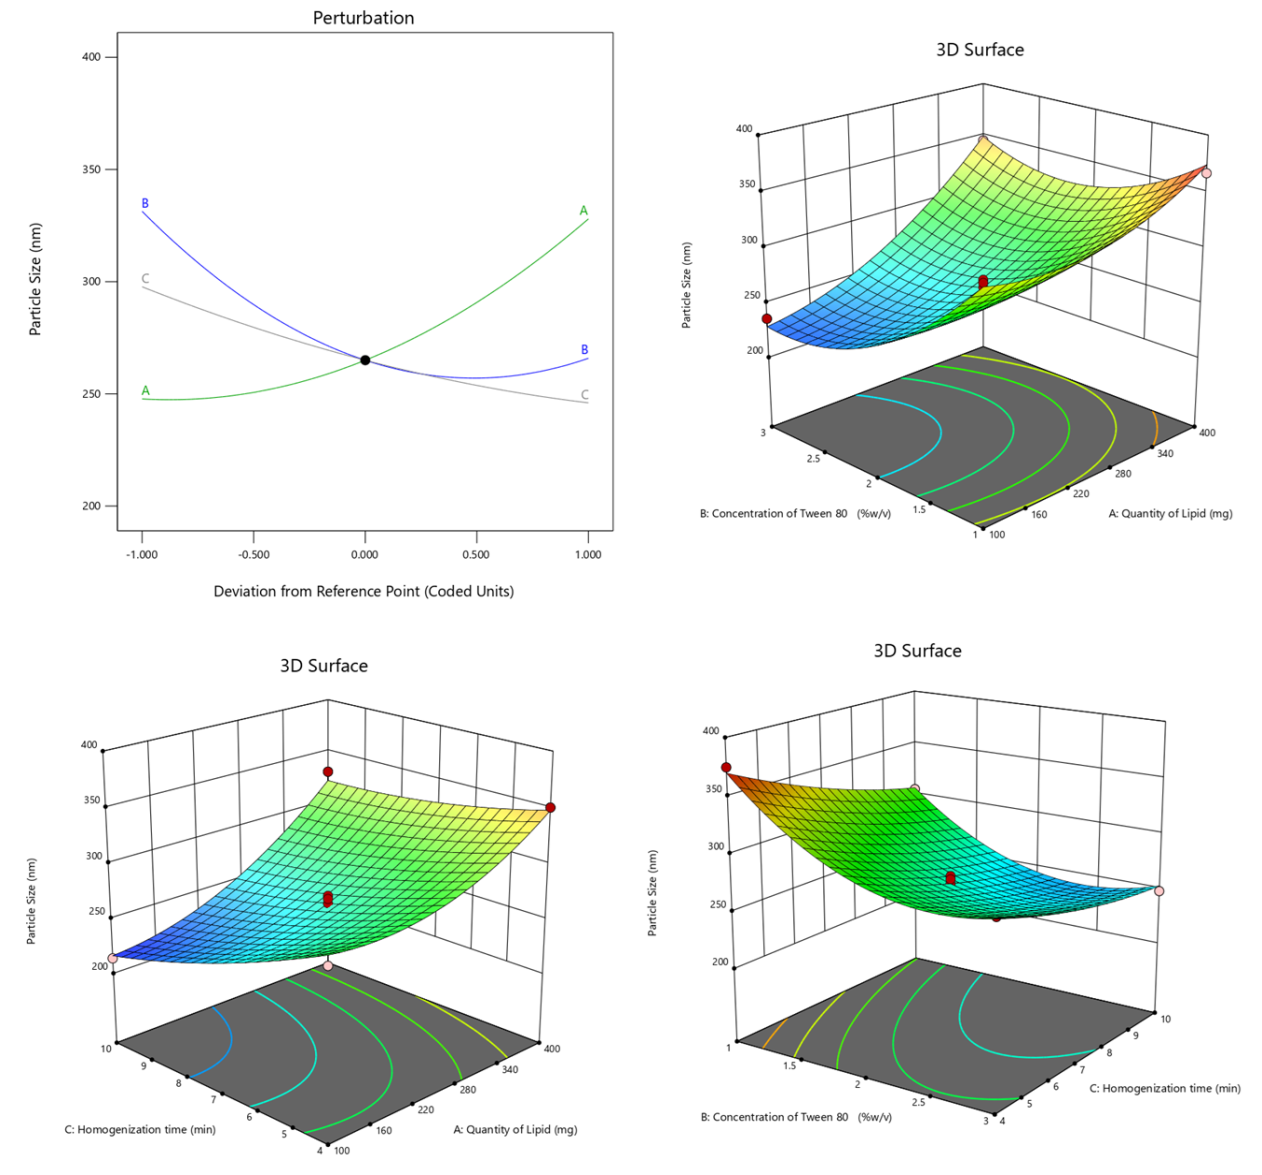
Fig. 1: Perturbation and 3D response surface plots of particle size of ERL-SLNs
Entrapment efficiency
The quadratic model, with an Adjusted R² of 0.9925, explains 99.25% of Entrapment Efficiency variability, affirmed by a non-significant Lack of Fit p-value (0.0858). ANOVA results show the quadratic model's significance (p-value<0.0001), emphasizing the substantial impact of Quantity of Lipid, Concentration of Tween 80, and Homogenization time on Entrapment Efficiency. Individual factors (A, B, C), interaction effects (AB, AC, BC), and quadratic terms (A², B², C²) all significantly contribute to the model, providing valuable insights into the factors influencing Entrapment Efficiency in ERL-SLNs. Positive and negative effects of the selected factors are evident from the coefficients in the model equation 2 (Eq.2).
Entrapment efficiency = 76.18+-6.1125 * A+4.675 * B+3.3375 * C+-2.875 * AB+-2.1 * AC+-1.475 * BC+-1.64 * A2+-5.065 * B2+-0.64 * C2 …Eq. 2
An increase in the Quantity of Lipid, as reflected by the positive coefficient of 5.54, indicates a positive correlation with Entrapment Efficiency. This suggests that higher lipid content enhances the encapsulation of Erlotinib, likely by providing a larger lipid matrix for drug entrapment. The perturbation plot in fig. 2 further illustrates this relationship, emphasizing the critical role of lipid quantity in optimizing entrapment efficiency.
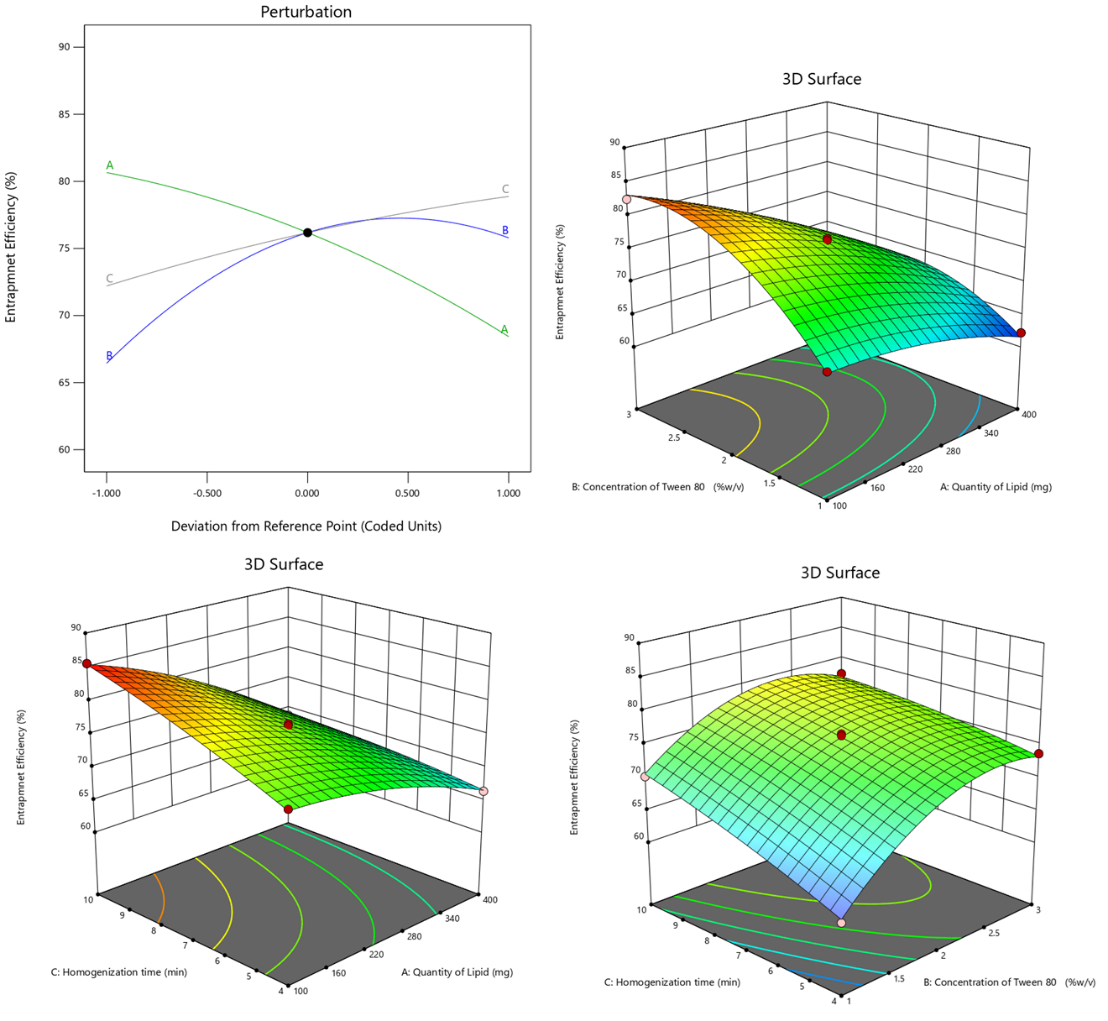
Fig. 2: Perturbation and 3D response surface plots of entrapment efficiency of ERL-SLNs
Similarly, the positive coefficient (4.18) associated with the Concentration of Tween 80 implies that higher concentrations of Tween 80 contribute to an augmented Entrapment Efficiency, thereby improving the encapsulation process. Furthermore, the positive coefficient (3.00) for Homogenization time suggests that prolonged homogenization times lead to higher Entrapment Efficiency, underscoring the idea that extended homogenization enhances the encapsulation of Erlotinib.
The negative coefficients (-0.86 for AB,-0.96 for AC, and-0.39 for BC) indicate a reduction in Entrapment Efficiency due to the interactions between the Quantity of Lipid (A) and the Concentration of Tween 80 (B), the Quantity of Lipid (A) and Homogenization Time (C), and the Concentration of Tween 80 (B) and Homogenization Time (C). This interaction effect, as depicted in the 3D response surface plot in fig. 2, highlights the sensitivity of Entrapment Efficiency to these combined factors. Maintaining an optimal balance and carefully controlling these conditions is critical to maximizing encapsulation. Additionally, the quadratic terms 𝐴 2 A2, 𝐵2, and 𝐶2 contribute significantly to the model's curvature, further influencing Entrapment Efficiency by reflecting non-linear dependencies in the system.
Zeta potential
The quadratic model displayed strong fitness, with an Adjusted R² of 0.9309, signifying that the model explains 93.09% of the variability in Zeta Potential. The Lack of Fit p-value (0.9212) indicates non-significance relative to pure error, validating the model's appropriateness.
The ANOVA results revealed the significance of the quadratic model (p-value = 0.0002), emphasizing the substantial impact of the selected factors (Quantity of Lipid, Concentration of Tween 80, Homogenization time) on Zeta Potential. Quantity of Lipid (A), Concentration of Tween 80 (B), and Homogenization time (C) exhibited highly significant effects (p-values<0.0001), indicating their substantial influence on Zeta Potential. Interaction effects (AB, AC) and quadratic terms (A², B²) also contributed significantly to the model represented in model equation 3(Eq.3).
Zeta potential =-19.92+3.2875 * A+-3.0125 * B+-2.3 * C+1.65 * AB+1.775 * AC+0.275 * BC+0.91 * A2+2.21 * B2+0.435 * C2
The positive coefficient (3.2875) indicates that an increase in the Quantity of Lipid leads to a rise in Zeta Potential. This suggests that higher lipid content enhances the surface charge of the nanoparticles, thereby improving their stability. The perturbation plot in fig. 3 further illustrates this relationship, emphasizing the critical role of lipid quantity in influencing the electrostatic stability of the nanoparticle formulation. Conversely, the negative coefficient (-3.0125) associated with Concentration of Tween 80 indicates that higher concentrations of Tween 80 diminish Zeta Potential, potentially reducing the surface charge. Similarly, the negative coefficient (-2.3) for Homogenization time suggests that longer homogenization times lead to a decrease in Zeta Potential, indicating that extended homogenization may impact the surface charge of nanoparticles.
Fig. 3: Perturbation and 3D response surface plots of zeta potential of ERL-SLNs
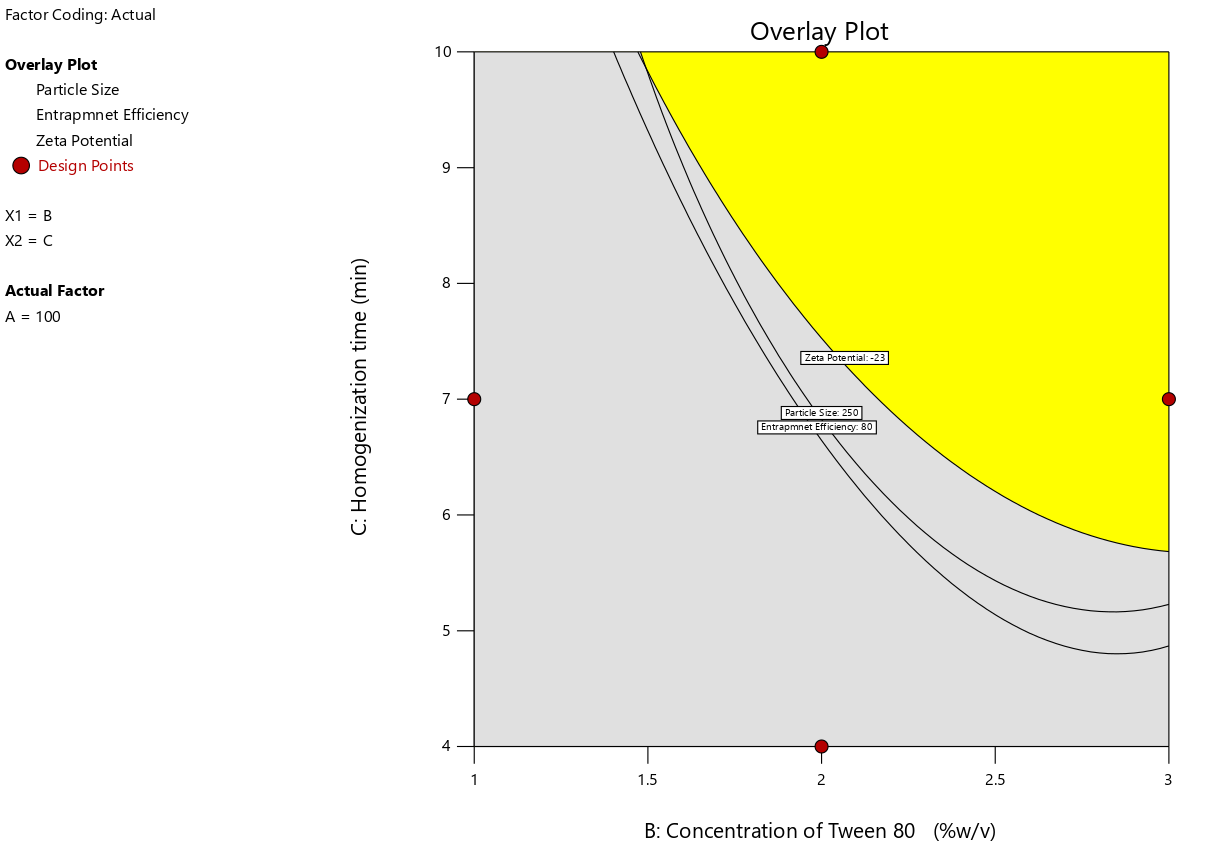
Fig. 4: Overlay plot of design optimization for ERL-SLNs
The 3D response surface plots in fig. 3 reveal cooperative effects of interaction terms on Zeta Potential, as evidenced by their positive coefficients. The positive coefficient (1.65) for the interaction between Quantity of Lipid (A) and Concentration of Tween 80 (B) indicates a synergistic effect, leading to an increase in Zeta Potential. Similarly, the positive coefficient (1.775) for the interaction between Quantity of Lipid (A) and Homogenization Time (C) reflects a cooperative influence on enhancing Zeta Potential.
Additionally, the positive coefficient (0.275) for the interaction between Concentration of Tween 80 (B) and Homogenization Time (C) suggests a mild synergistic effect, further contributing to the elevation of Zeta Potential. These findings underscore the importance of optimizing these interactive factors to achieve desired nanoparticle stability. Quadratic terms A², B², and C² also play a significant role, contributing to the curvature in the model and influencing Zeta Potential.
The final optimization of the desired levels of the response variables identified the optimal design region using the overlay plot (fig. 4), which integrates the design optimization constraints. This plot visually represents the feasible region where all specified criteria for the response variables are simultaneously met, ensuring the method's optimal performance. The overlay plot serves as a critical tool in identifying the balance between conflicting constraints, facilitating a robust and efficient formulation design.
FT-IR analysis
The FT-IR spectra of Erlotinib, Lauric Acid, and the optimized ERL-SLN formulation are presented in fig. 5, providing critical insights into the structural confirmation and interactions within the formulation. The FTIR spectrum of Erlotinib exhibits key peaks, including 3247 cm⁻¹ for N-H stretching (amines/amides), 2931 cm⁻¹ for C-H stretching (aliphatic/aromatic hydrogens), and 1578 cm⁻¹ for aromatic C=C stretching or N-H bending. Peaks at 1497 cm⁻¹ and 1426 cm⁻¹ suggest aromatic ring vibrations and possible C-N stretching. Additional peaks at 1244 cm⁻¹ and 1124 cm⁻¹ indicate C-O stretching (ethers/esters) and C-N stretching (aromatic amines), respectively. The spectrum confirms the structure of lauric acid with peaks at 2920 cm⁻¹ and 2869 cm⁻¹ for C-H stretching in aliphatic chains and a strong 1705 cm⁻¹ peak for C=O stretching in the carboxylic acid group. Other notable peaks include 1543 cm⁻¹ for O-H bending (carboxylic acid), 1465 cm⁻¹ and 1412 cm⁻¹ for C-H bending, 1286 cm⁻¹ and 1109 cm⁻¹ for C-O stretching, and 933 cm⁻¹ and 720 cm⁻¹ for C-H rocking or out-of-plane bending, reflecting the long aliphatic chain.
The FTIR spectrum of the Erlotinib-loaded solid lipid nanoparticles (ERL-SLN) provides critical insights into the encapsulation and interactions between the components. Broad peaks observed in the range of 3504–3362 cm⁻¹ indicate O-H stretching vibrations, suggesting the presence of hydroxyl groups, likely from lauric acid or water molecules in the formulation. Peaks at 2927 cm⁻¹ and 2765 cm⁻¹ represent the asymmetric and symmetric stretching vibrations of C-H bonds in the aliphatic hydrocarbon chains of lauric acid, highlighting the lipid matrix. A strong peak at 1729 cm⁻¹ corresponds to C=O stretching of the ester or carboxylic acid group from lauric acid. The peak at 1550 cm⁻¹ likely indicates aromatic C=C stretching from the Erlotinib structure, confirming its incorporation into the nanoparticles. A peak at 1268 cm⁻¹ represents C-O stretching vibrations, likely arising from the ester functionality in lauric acid or interactions with Erlotinib. Another peak at 1077 cm⁻¹ suggests C-O stretching vibrations, possibly due to interactions between Erlotinib and the lipid carrier. Finally, peaks at 902 cm⁻¹ and 756 cm⁻¹ correspond to C-H out-of-plane bending vibrations, which are likely associated with the aromatic ring of Erlotinib. Additionally, the disappearance of sharp crystalline peaks typically observed in the Erlotinib spectrum suggests that the drug is in an amorphous or molecularly dispersed state within the lipid matrix. The disappearance of Erlotinib’s crystalline peaks in the FTIR spectrum suggests molecular dispersion within the lipid matrix, enhancing encapsulation and stability. The structure of the nanoparticles likely consists of a hydrophobic lipid core of lauric acid, encapsulating Erlotinib, and a stabilizing hydrophilic shell formed by Tween 80.
Differential scanning calorimetry
The DSC thermogram for Erlotinib, Lauric acid and ERL-SLNs were shown in fig. 6. The DSC thermogram for Erlotinib shows a sharp endothermic peak at approximately 232 °C, indicative of its melting point. The thermogram for Lauric Acid reveals a prominent endothermic peak at around 45 °C, which corresponds to its melting point. The difference in melting behaviours between Erlotinib (232 °C) and the lipid component (around 44 °C) suggests that Erlotinib may not be in its pure crystalline form within the SLNs. The lower melting point observed for the SLNs formulation could indicate a potential alteration in the drug's crystallinity, which is a desirable property in nanocarrier systems. This is often indicative of the drug being in an amorphous state or being molecularly dispersed in the lipid matrix, which can enhance drug solubility and bioavailability. The absence of an Erlotinib peak around 232 °C in the SLNs thermogram may also suggest that the drug has been successfully encapsulated or dissolved within the lipid matrix, potentially improving its stability and controlled release. The enthalpy change (ΔH) observed in the DSC thermogram indicates a transition to an amorphous state, which improves drug solubility and stability. The observed changes in the melting point could imply an interaction between the drug and the lipid core that alters the physical state of Erlotinib, which could result in improved solubility, stability, and controlled drug release, potentially enhancing its therapeutic efficacy in cancer treatment.
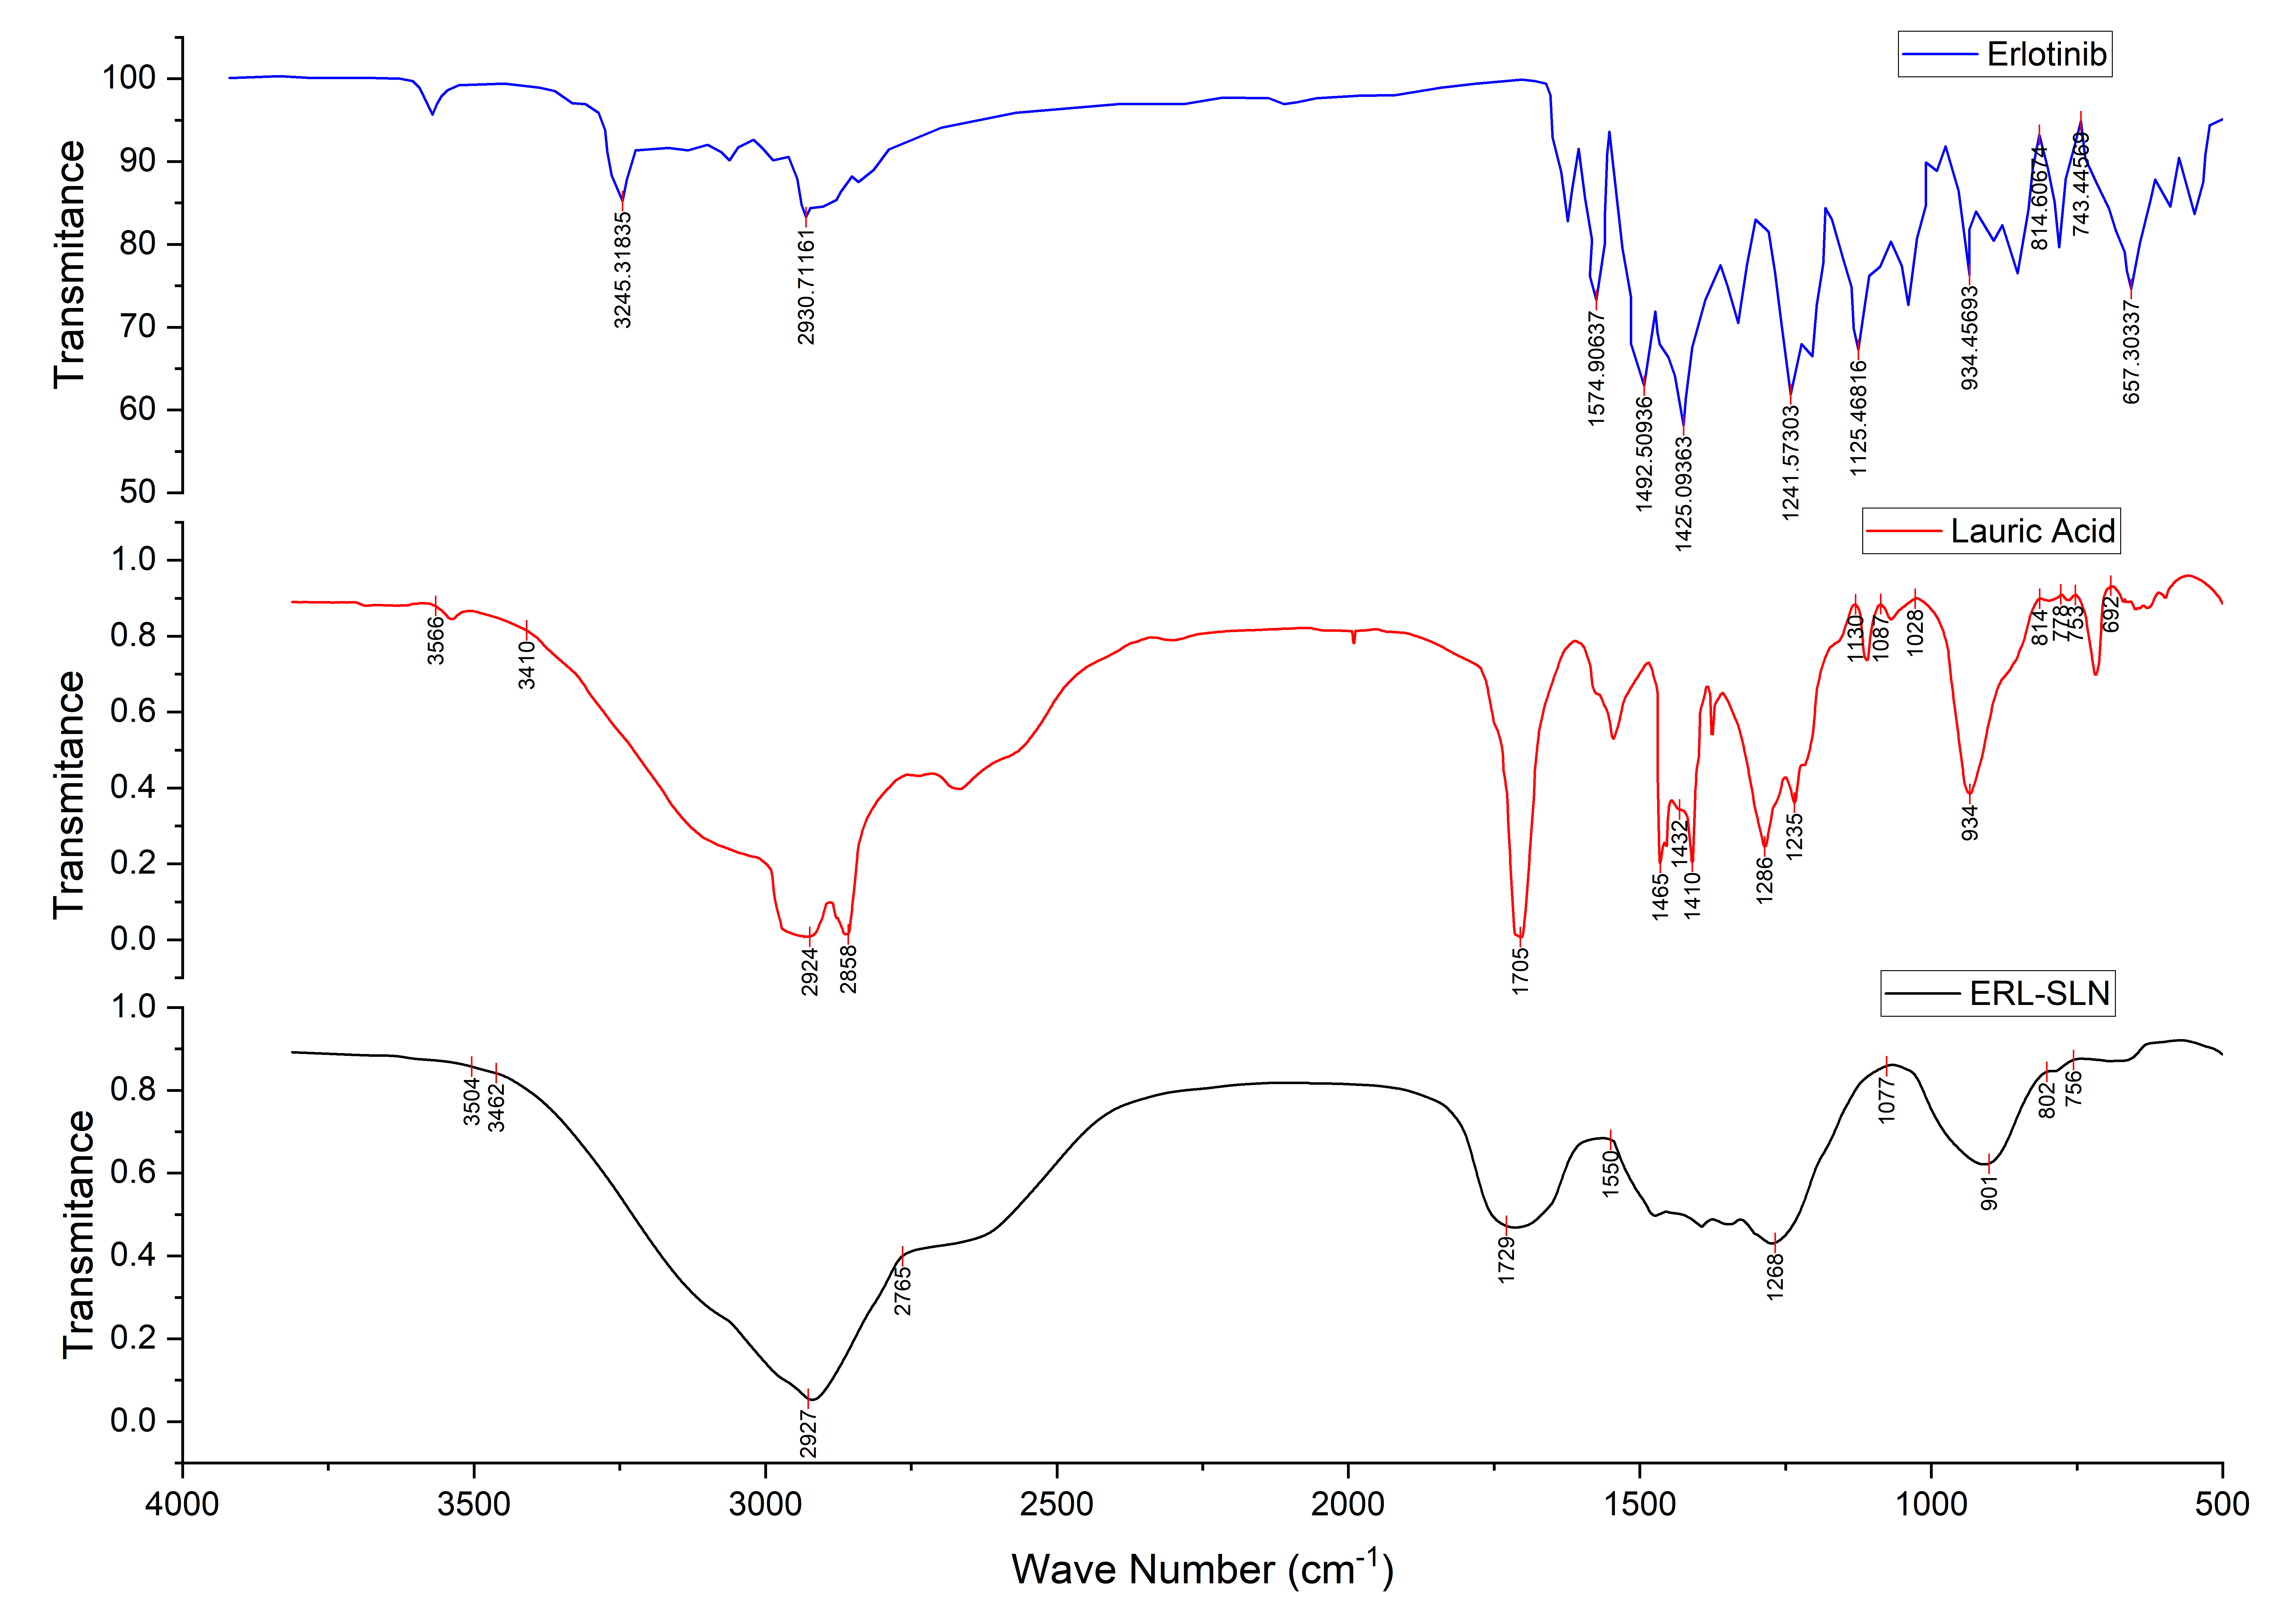
Fig. 5: FTIR spectra of erlotinib, lauric acid and optimized formulation of erlotinib SLNs
SEM analysis
The SEM image of the optimized Erlotinib-loaded Solid Lipid Nanoparticles (ERL-SLNs) presented in fig. 7 reveals their morphological characteristics. The image shows spherical and smooth particles, which is a typical feature of SLNs. The uniformity in particle size indicates a successful formulation process, which is crucial for ensuring consistent drug release and stability.
The particles appear to be well-defined with some slight irregularities, which might indicate the presence of small amounts of drug aggregates or lipid crystallization. These irregularities, however, do not significantly impact the overall smooth surface of the SLNs, suggesting that the formulation has been optimized for effective drug encapsulation. The particle size distribution from SEM images (150–160 nm) was consistent with DLS results (152.8 nm), confirming the uniformity of the nanoparticles. Additionally, the absence of large aggregates or uneven distributions points to a stable formulation that could be beneficial for controlled release.
The presence of a relatively narrow size distribution also suggests that the formulation process, such as homogenization, was effective in producing SLNs of a consistent size. This consistency in size distribution is important for the potential application of these particles in targeted drug delivery, as it helps to avoid issues like sedimentation or instability over time.
In vitro dissolution study
The in vitro dissolution study of the optimized Erlotinib-loaded Solid Lipid Nanoparticles (ERL-SLNs) was compared with the marketed tablet formulation in 0.1N HCl medium. The results, as summarized in the table 3, demonstrate significant differences in the release profiles between the two formulations. The marketed tablet exhibited a rapid release of Erlotinib, with approximately 78.24±1.08% of the drug released within the first 30 min and over 97.61±0.32% release achieved at 24 h. This rapid release profile is characteristic of immediate-release formulations. In contrast, the optimized ERL-SLNs showed a slower, sustained release profile. At 0.5 h, only 6.32±0.74% of the drug was released, gradually increasing to 94.32±1.82% over 24 h. This indicates the controlled release behaviour of the SLNs.
The marketed tablet demonstrated a burst release in the initial phase, with over 78% of the drug released within the first 30 min. In comparison, the ERL-SLNs released only 6.32% in the same time frame, indicating minimal initial drug leakage and efficient encapsulation of Erlotinib within the lipid matrix. The ERL-SLNs exhibited a gradual release of Erlotinib over time, achieving approximately 80.09±1.38% at 18 h and reaching nearly complete release (94.32±1.82%) by 24 h. This sustained release profile is indicative of the drug being retained within the lipid core and released in a controlled manner, likely due to diffusion and erosion mechanisms. While the marketed tablet achieved almost complete drug release (97.61±0.32%) at 24 h, the ERL-SLNs showed a slightly delayed but comparable cumulative release. This suggests that the SLN formulation effectively delivers Erlotinib over an extended period, which can be advantageous for improving drug bioavailability and reducing dosing frequency.
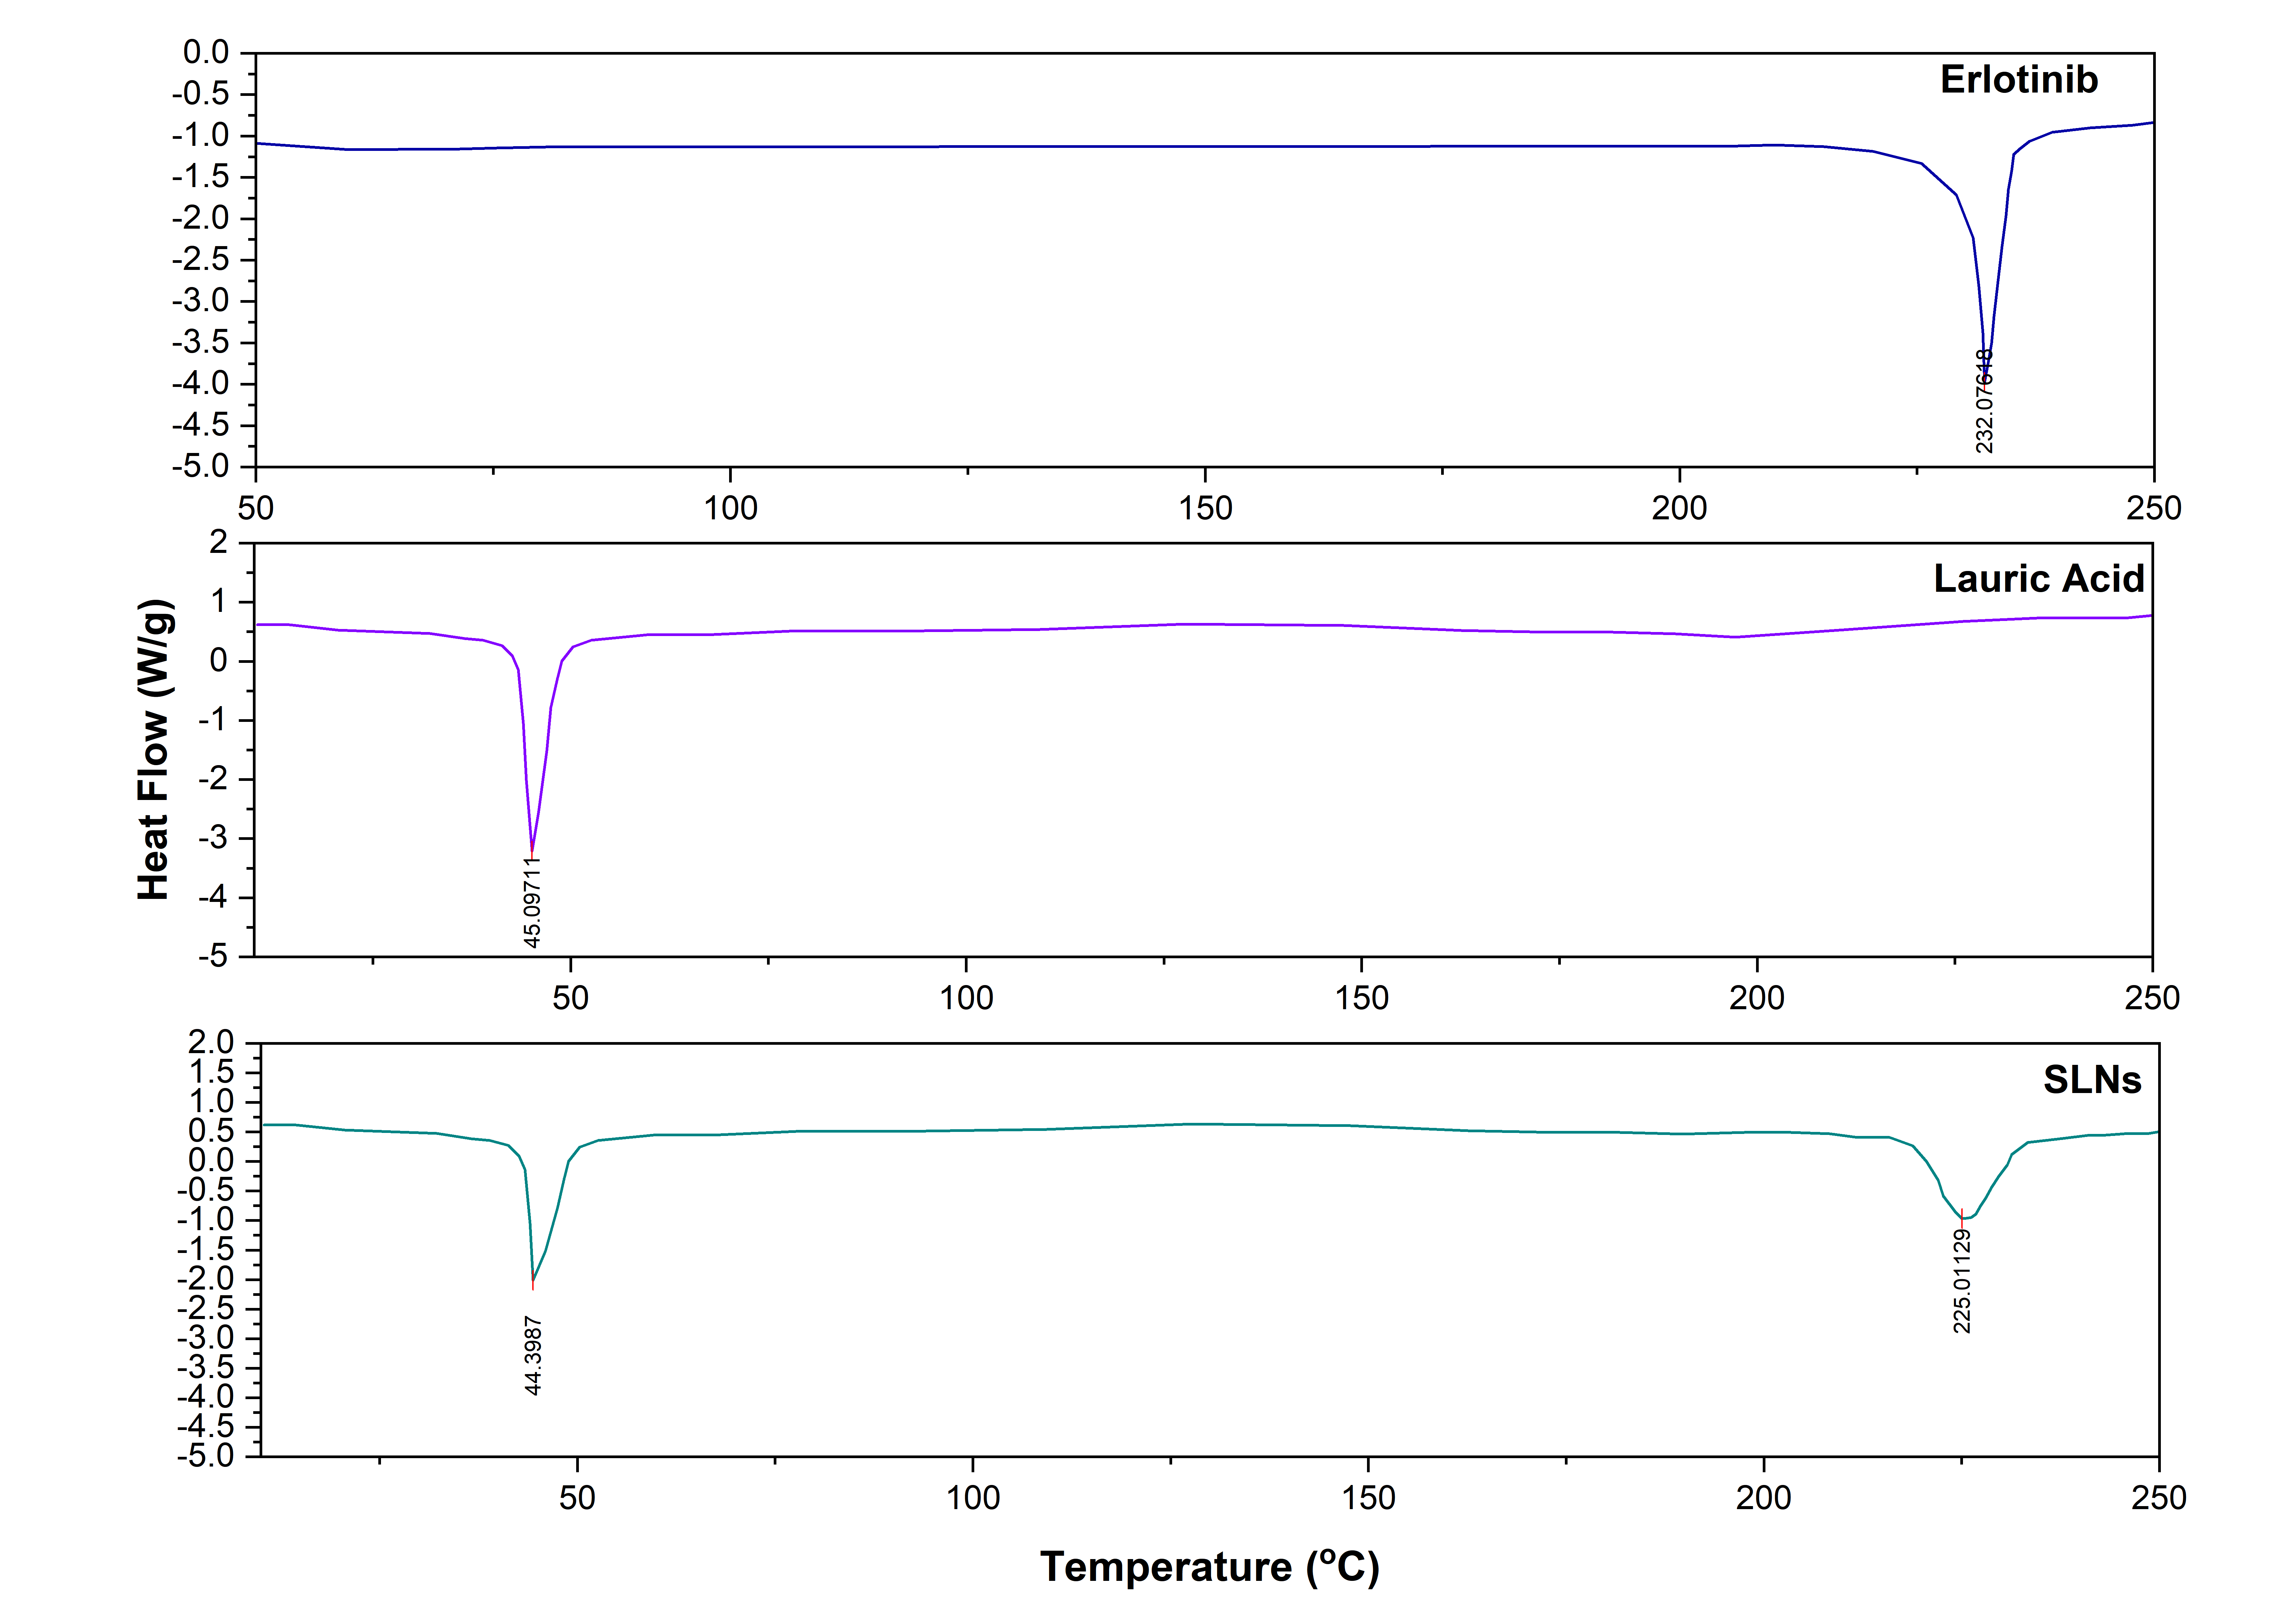
Fig. 6: DSC thermograms of erlotinib, lauric acid and ERL-SLN
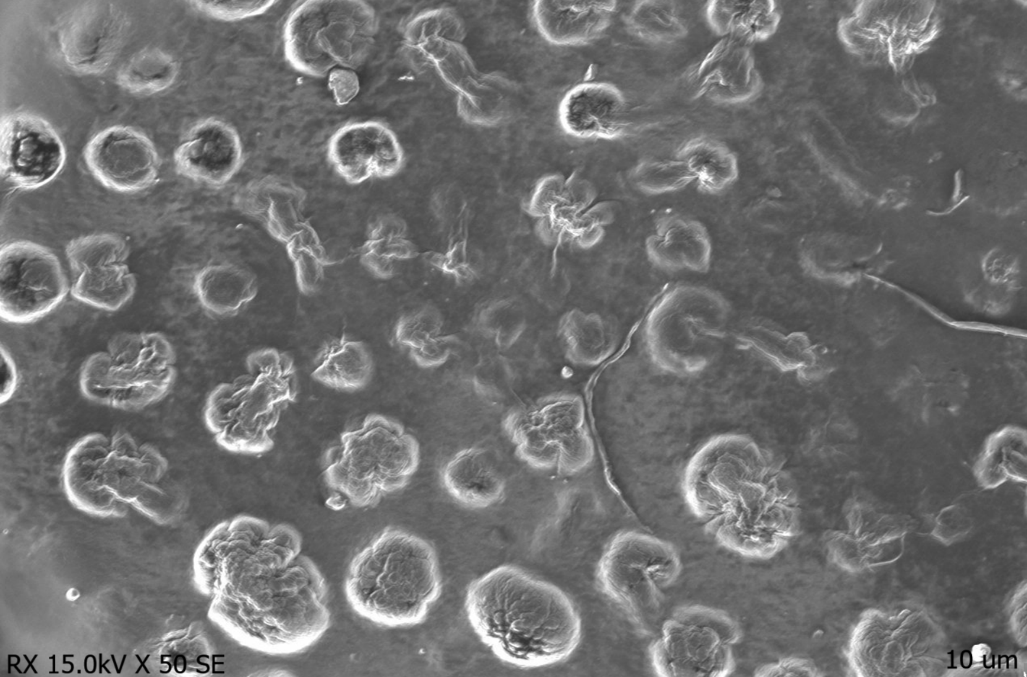
Fig. 7: SEM image of erlotinib-SLNs
Table 3: Summary of dissolution data of ERL-SLNs and Erlotinib suspension
| Time interval (Hours) | % Cumulative drug released from optimized ERL-SLNs (0.1N) | % Cumulative drug released from erlotinib (0.1N HCl medium) |
| 0.5 | 6.32±0.74 | 78.24±1.08 |
| 1 | 11.08±0.95 | 80.14±1.06 |
| 2 | 16.71±1.07 | 83.06±0.97 |
| 4 | 30.56±1.33 | 85.73±0.55 |
| 6 | 41.88±0.98 | 87.92±1.03 |
| 8 | 53.07±1.51 | 90.04±0.48 |
| 12 | 65.91±1.43 | 93.15±0.87 |
| 18 | 80.09±1.38 | 95.63±0.62 |
| 24 | 94.32±1.82 | 97.61±0.32 |
N=3; data expressed in mean±SD.
The sustained release pattern of the ERL-SLNs is desirable for maintaining a prolonged therapeutic effect, minimizing drug plasma fluctuations, and potentially reducing side effects. The slower release profile can enhance the drug's bioavailability by providing a controlled release in the gastrointestinal tract, preventing premature degradation in the acidic medium.
Drug release kinetics analysis
The release kinetics analysis of ERL-SLNs enumerated in table 4 fit best with the Korsmeyer-Peppas model (𝑅2 = 0.9942), indicating anomalous (non-Fickian) diffusion (𝑛 = 0.71) as the primary mechanism, driven by a combination of drug diffusion and nanoparticle erosion. This suggests that the release is governed by a combination of drug diffusion through the lipid matrix and the erosion of the nanoparticle structure. The non-Fickian diffusion mechanism ensures sustained drug release, reducing plasma fluctuations and minimizing side effects, which is advantageous over immediate-release formulations. The zero-order model (𝑅2= 0.9481 R 2 =0.9481) also suggests a sustained release profile. Moderate fits to the Higuchi (𝑅2= 0.8637) and Hixson-Crowell (𝑅2= 0.8243) models indicate partial contributions from diffusion and surface dissolution, respectively. The poor fits to the first-order (𝑅2= 0.7347) and second-order (𝑅2= 0.4527) models confirm the release is not concentration-dependent. These results collectively demonstrate a controlled release profile suitable for enhanced therapeutic efficacy.
Table 4: Summary of release kinetics analysis
| Model | R2 | n |
| Zero order | 0.9481 | NA |
| first order | 0.7347 | NA |
| Second Order | 0.4527 | NA |
| Huguchi model | 0.8637 | NA |
| Hixson-Crowell | 0.8243 | NA |
| Korsmeyer-peppas | 0.9942 | 0.71 |
In vivo pharmacokinetics analysis
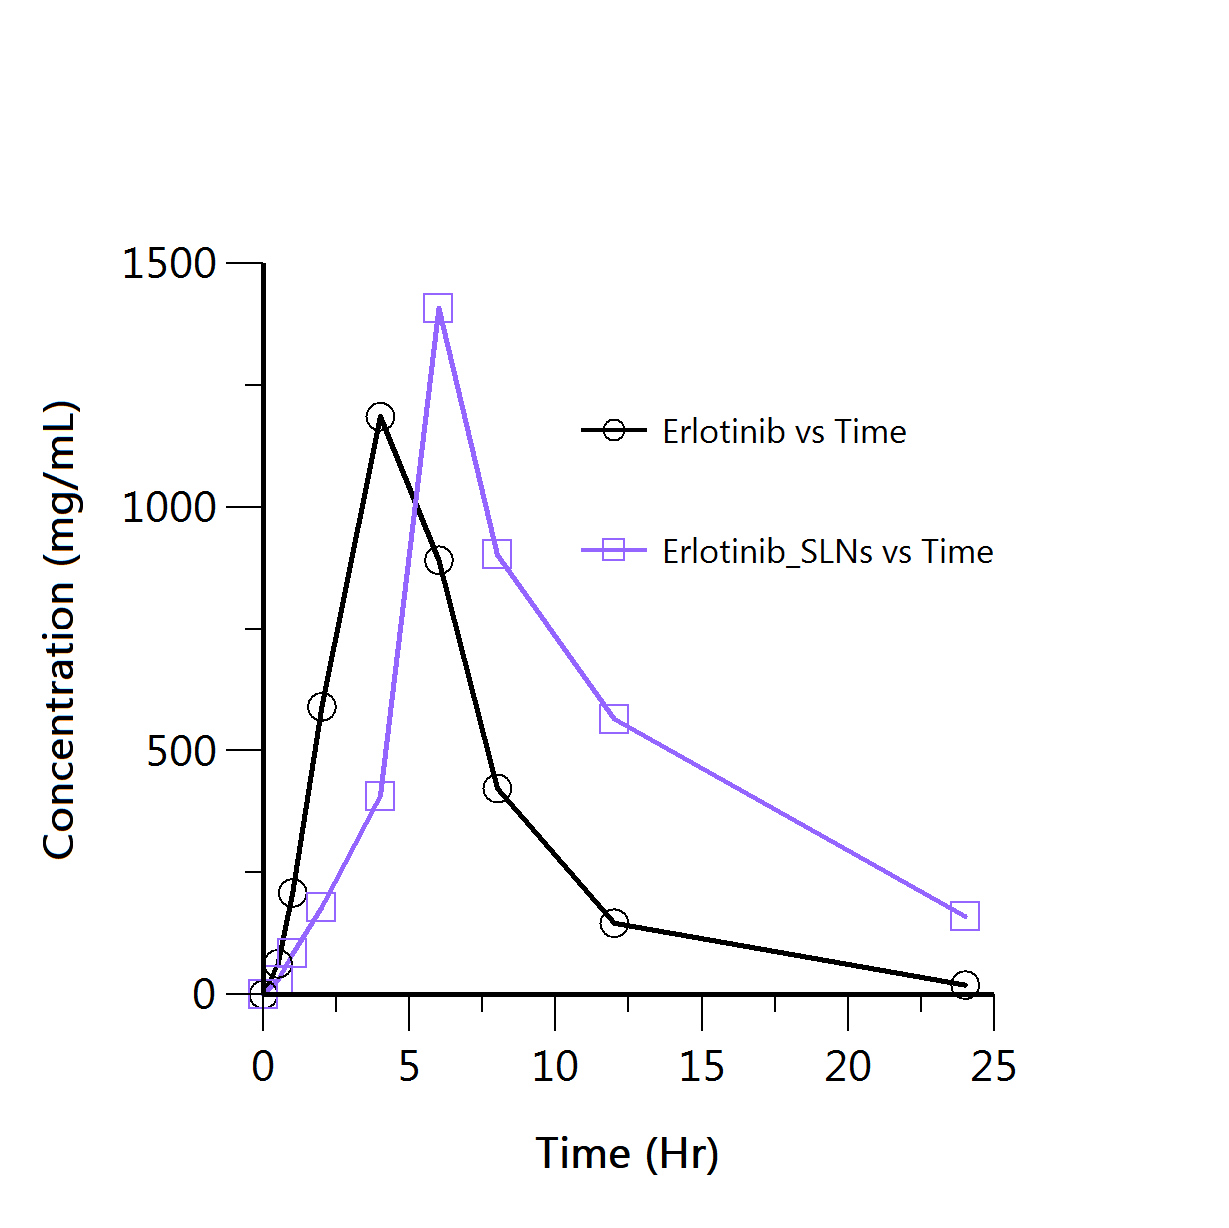
The pharmacokinetic profiles of ERL-SLNs and Erlotinib formulations given in table 5 and fig. 8(a) demonstrate significant differences that highlight the improved drug delivery characteristics of ERL-SLNs. Also the The ERL-SLNs formulation exhibited a delayed time to maximum concentration (Tmax) of 6 h compared to 4 h for Erlotinib, indicating its sustained release properties. The maximum plasma concentration (Cmax) was higher for ERL-SLNs (1408.35 ng/ml) compared to Erlotinib (1185.81 ng/ml), suggesting enhanced bioavailability due to improved solubility and stability afforded by the nanoparticle-based delivery system. Additionally, the terminal half-life (t½) of ERL-SLNs was almost double that of Erlotinib (6.88 h vs. 3.7 h), reflecting prolonged systemic retention and therapeutic potential.
Table 5: Summary of pharmacokinetic parameters of ERL-SLNs and erlotinib
| Parameter | Units | ERL-SLNs | Erlotinib |
| Dose | mg | 10 | 10 |
| Time to Maximum Concentration (Tmax) | h | 6* | 4 |
| Maximum Plasma Concentration (Cmax) | ng/ml | 1408.35** | 1185.81* |
| Terminal Half-Life (t½) | h | 6.88** | 3.7 |
| Area Under the Curve, Last (AUClast) | ng·h/ml | 10860.42* | 7782.65* |
| Area Under the Curve, Infinity Observed (AUCINF_obs) | ng·h/ml | 12450.45 | 7886.17 |
| Percentage of AUC Extrapolated Observed (AUC_%Extrap_obs) | % | 12.77 | 1.31 |
| Apparent Volume of Distribution/F (Vz/F_obs) | L/kg | 0.00797 | 0.00678 |
| Apparent Clearance/F (Cl/F_obs) | L/h/kg | 0.000803 | 0.00127 |
| Mean Residence Time, Infinity Observed (MRTINF_obs) | h | 12.69 | 6.61 |
Statistical significance: *p<0.05, **p<0.01
The area under the curve values, both AUC last and AUCINF_obs, were substantially higher for ERL-SLNs, with values of 10860.42 ng·h/ml and 12450.45 ng·h/ml, respectively, compared to 7782.65 ng·h/ml and 7886.17 ng·h/ml for Erlotinib. This increase in drug exposure over time further confirms the superior bioavailability of the ERL-SLNs formulation. While the percentage of AUC extrapolated was higher for ERL-SLNs (12.77%) than for Erlotinib (1.31%), this did not compromise the reliability of the pharmacokinetic data. The apparent clearance (Cl/F_obs) of ERL-SLNs was lower (0.000803 l/h/kg vs. 0.00127 l/h/kg), indicating slower drug elimination, and the mean residence time (MRTINF_obs) was notably longer (12.69 h vs. 6.61 h), supporting sustained drug release. The relative bioavailability of ERL-SLNs was calculated to be 57.88% higher than that of Erlotinib, with a fold increase of 1.58 based on AUCINF_obs values. This demonstrates that ERL-SLNs are 1.58 times more bioavailable than the conventional Erlotinib formulation.
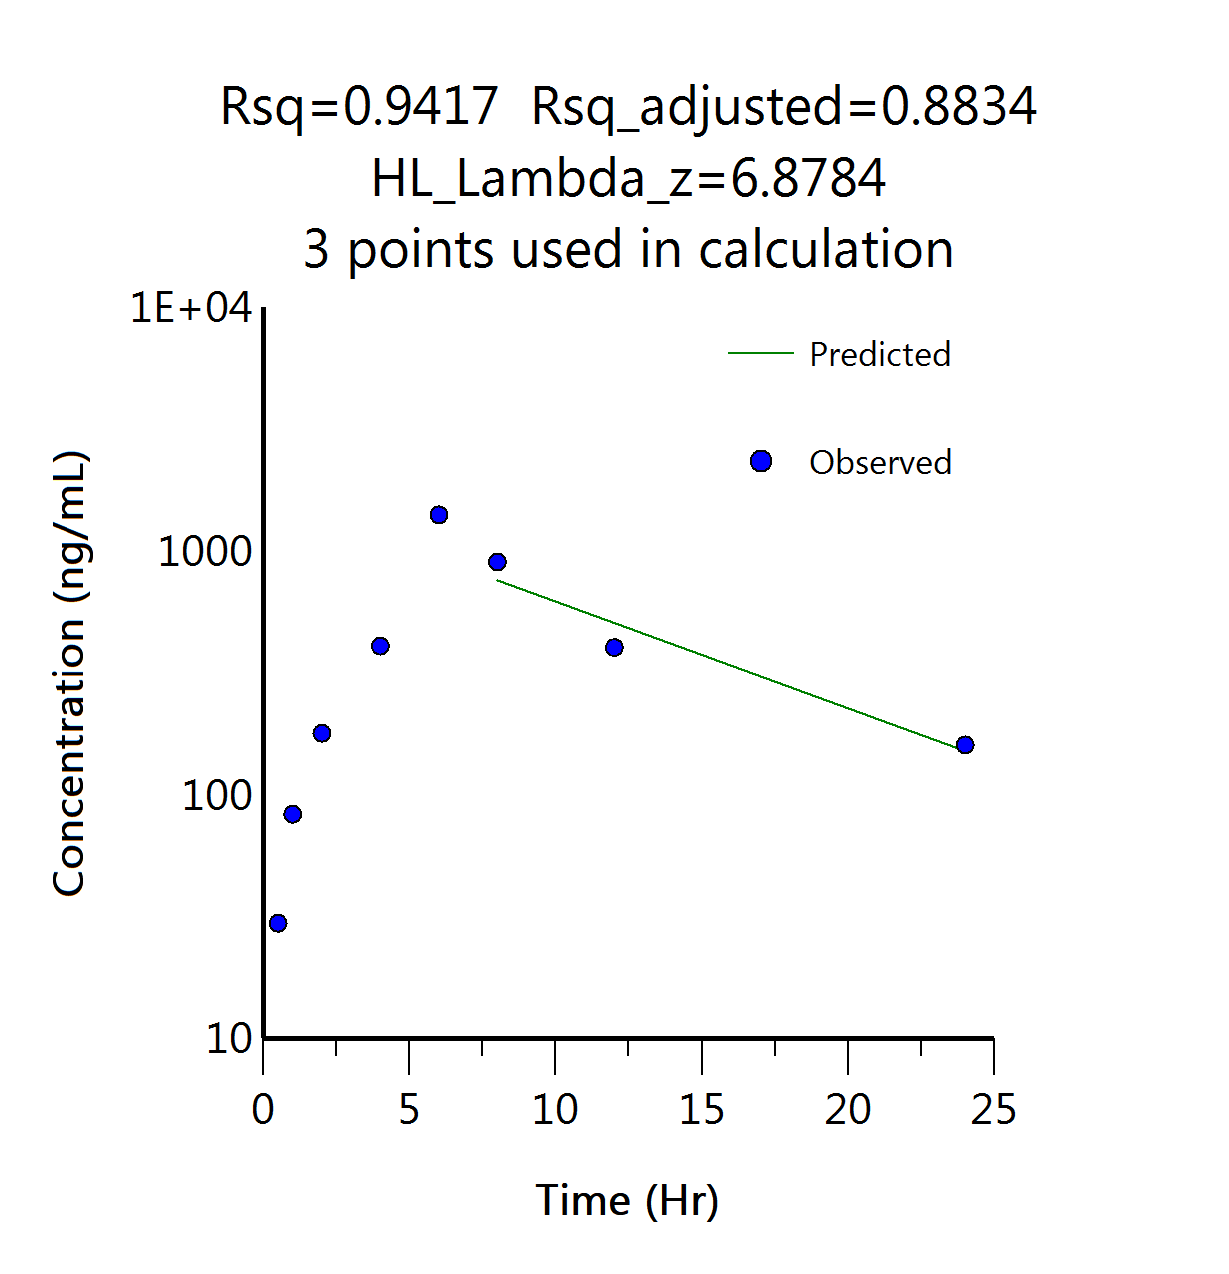
The Predicted vs Observed plot of concentration over time displayed in fig. 8(b) in the pharmacokinetic study demonstrated a strong correlation, with an R² value of 0.9417. This indicates that the predicted concentration values closely align with the observed experimental data, suggesting the accuracy and reliability of the pharmacokinetic model used. The high R² value reflects a good fit between the predicted and observed concentrations, which is crucial for ensuring that the model can accurately describe the drug's behaviour in the body over time.
 |
 |
| (a) | (b) |
| Fig. 8(a): Concentration Vs time profile of erlotinib and Erlotinib-SLNs in pharmacokinetic study | Fig. 8(b): Predicted Vs observed data points in NCA of ERL-SLNs pharmacokinetic profile |
This finding supports the validity of the model and its potential use in predicting the drug's pharmacokinetic parameters, such as absorption, distribution, metabolism, and excretion, with a high degree of confidence. These results underscore the potential of ERL-SLNs to enhance pharmacokinetic performance, reduce dosing frequency, and improve therapeutic efficacy, making them a promising alternative for clinical application.
DISCUSSION
The Box-Behnken design effectively captured the complex interactions among lipid quantity (A), Tween 80 concentration (B), and homogenization time (C) in formulating Erlotinib-loaded solid lipid nanoparticles (ERL-SLNs). The observed increase in particle size (R1) with higher lipid quantity (+40.125 nm) aligns with previous studies, where elevated lipid content increased viscosity, leading to larger nanoparticles [18]. Conversely, Tween 80 (-32.75 nm) and prolonged homogenization (-25.875 nm) reduced particle size by lowering interfacial tension and enhancing shear forces, consistent with findings by [19]. The antagonistic interaction (AB:+20 nm) suggests that excessive surfactant and lipid levels may hinder emulsification, emphasizing the need for balanced optimization, as reported in similar SLN formulations [20].
Entrapment efficiency (R2) improved with lipid (+5.54%) and Tween 80 (+4.18%), likely due to enhanced drug solubilization, but the negative interaction (AB:-2.875%) and quadratic effects (B²:-5.065%) indicate drug leakage at extreme surfactant concentrations, corroborating earlier observations [21]. Zeta potential (R3) trends—increasing with lipid (+3.2875 mV) but declining with Tween 80 (-3.0125 mV)—reflect surface charge modulation, where lipid mitigated surfactant-induced destabilization (AB:+1.65 mV), ensuring colloidal stability, as seen in prior studies [22].
Physicochemical characterization confirmed Erlotinib’s amorphous dispersion in lauric acid, while SEM revealed spherical SLNs with uniform morphology. The in vitro release profile (94.32% over 24 h) followed anomalous diffusion (Korsmeyer-Peppas, n = 0.71), indicating a combination of diffusion and erosion mechanisms. Pharmacokinetically, ERL-SLNs exhibited superior performance over conventional formulations, with a 1.58-fold bioavailability increase, aligning with reports on SLN-enhanced drug delivery [3]. The prolonged half-life (6.88 h vs. 3.7 h) and delayed Tmax (6 h vs. 4 h) further support sustained release, reducing plasma fluctuations—a key advantage noted in similar nanocarrier systems [22].
The high correlation (R² = 0.9417) between predicted and observed responses validates the model’s reliability. These findings collectively demonstrate ERL-SLNs as a promising strategy for improving Erlotinib delivery, offering controlled release and enhanced pharmacokinetics. Potential challenges in scaling up the SLN formulation include batch-to-batch variability and reproducibility. Additionally, variability in in vivo results due to interspecies differences should be considered when translating findings to clinical settings.
CONCLUSION
This study successfully developed and optimized Erlotinib-loaded solid lipid nanoparticles using a systematic design of experiments approach. The Box-Behnken design enabled precise identification of the critical factors affecting nanoparticle formulation. Optimized ERL-SLNs exhibited controlled particle size, high entrapment efficiency, and adequate zeta potential, contributing to stability and sustained drug release. In vitro drug release studies confirmed extended release, and in vivopharmacokinetic analysis demonstrated enhanced bioavailability compared to Erlotinib alone. Collectively, the study findings position ERL-SLNs as a promising platform for improving the pharmacokinetic performance and therapeutic outcomes of Erlotinib. The enhanced solubility, stability, and sustained release characteristics of the nanoparticle system address the limitations of conventional formulations, offering a more efficient and patient-friendly approach to cancer treatment. Future studies should focus on exploring the clinical applicability of ERL-SLNs and evaluating their long-term safety and efficacy in larger population cohorts to establish their potential for routine clinical use.
ACKNOWLEDGEMENT
The authors express their gratitude to Motherhood University, Roorkee, Uttarakhand, India, for their support in the successful completion of this work.
FUNDING
Nil
ABBREVIATIONS
ANOVA – Analysis Of Variance, AUC – Area Under The Curve, BCS – Biopharmaceutics Classification System, CCD – Central Composite Design, Cmax – Maximum Plasma Concentration, DSC – Differential Scanning Calorimetry, ERL – Erlotinib, ERL-SLNs – Erlotinib-Loaded Solid Lipid Nanoparticles, FTIR – Fourier Transform Infrared Spectroscopy, HPLC – High-Performance Liquid Chromatography, IAEC – Institutional Animal Ethics Committee, Kz – Elimination Rate Constant, MRT – mean Residence Time, NSCLC – Non-Small Cell Lung Cancer, PDI – Polydispersity Index, R² – Coefficient of Determination, RSM – Response Surface Methodology, SD – Standard Deviation, SEM – Scanning Electron Microscopy, SLNs – Solid Lipid Nanoparticles, USP – United States Pharmacopeia, ZP – Zeta Potential.
AUTHORS CONTRIBUTIONS
Chandu Vamshi Gangula contributed to the conceptualization of the study, conducted the experimental investigations, and prepared the manuscript. Seema Tomar played a key role in conceptualizing the research, analyzing the results, interpreting the data, and supervising the project. Poli Reddy Papagatla assisted in data curation and manuscript editing.
CONFLICT OF INTERESTS
Authors disclose no conflict of interest with current research work.
REFERENCES
Azzoli CG, Temin S, Giaccone G. 2011 focused update of 2009 American society of clinical oncology clinical practice guideline update on chemotherapy for stage iv non small cell lung cancer. J Oncol Pract. 2012;8(1):63-6. doi: 10.1200/JOP.2011.000374, PMID 22548014.
OB. Pharmacotherapy of non-small cell lung cancer: a short review. Asian J Pharm Clin Res. 2018;11(3):7-10. doi: 10.22159/ajpcr.2018.v11i3.23253.
Erdogar N. Development of oral tablet formulation containing erlotinib: randomly methylated-β-cyclodextrin inclusion complex using direct compression method. Turk J Pharm Sci. 2021;18(5):589-96. doi: 10.4274/tjps.galenos.2021.95680, PMID 34719186.
US Food and Drug Administration. Oral dosage strength physicochemical and pharmacokinetic data; 2008. Available from: https://www.accessdata.fda.Gov/drugsatfda_docs/label/2008/021743s010lbl.pdf.
Frohna P, Lu J, Eppler S, Hamilton M, Wolf J, Rakhit A. Evaluation of the absolute oral bioavailability and bioequivalence of erlotinib an inhibitor of the epidermal growth factor receptor tyrosine kinase in a randomized crossover study in healthy subjects. J Clin Pharmacol. 2006;46(3):282-90. doi: 10.1177/0091270005284193, PMID 16490804.
Gala UH, Miller DA, Williams RO. Harnessing the therapeutic potential of anticancer drugs through amorphous solid dispersions. Biochim Biophys Acta Rev Cancer. 2020;1873(1):188319. doi: 10.1016/j.bbcan.2019.188319, PMID 31678141.
Fan L, Hu L, Yang B, Fang X, Gao Z, Li W. Erlotinib promotes endoplasmic reticulum stress mediated injury in the intestinal epithelium. Toxicol Appl Pharmacol. 2014;278(1):45-52. doi: 10.1016/j.taap.2014.04.015, PMID 24768708.
Geetha VS, Velraj M. Design development and in vitro evaluation of erlotinib loaded liquorice crude protein nanoparticles by box-behnken design. Int J App Pharm. 2021;13(4):94-101. doi: 10.22159/ijap.2021v13i4.41580.
Vrignaud S, Hureaux J, Wack S, Benoit JP, Saulnier P. Design optimization and in vitro evaluation of reverse micelle loaded lipid nanocarriers containing erlotinib hydrochloride. Int J Pharm. 2012;436(1-2):194-200. doi: 10.1016/j.ijpharm.2012.06.026, PMID 22721853.
Zhou Z, Kennell C, Jafari M, Lee JY, Ruiz Torres SJ, Waltz SE. Sequential delivery of erlotinib and doxorubicin for enhanced triple negative breast cancer treatment using polymeric nanoparticle. Int J Pharm. 2017;530(1-2):300-7. doi: 10.1016/j.ijpharm.2017.07.085, PMID 28778627.
Mishra V, Bansal KK, Verma A, Yadav N, Thakur S, Sudhakar K. Solid lipid nanoparticles: emerging colloidal nano drug delivery systems. Pharmaceutics. 2018;10(4):191. doi: 10.3390/pharmaceutics10040191, PMID 30340327.
Pandey S, Shaikh F, Gupta A, Tripathi P, Yadav JS. A recent update: solid lipid nanoparticles for effective drug delivery. Adv Pharm Bull. 2022;12(1):17-33. doi: 10.34172/apb.2022.007, PMID 35517874.
Akanda M, Mithu MS, Douroumis D. Solid lipid nanoparticles: an effective lipid based technology for cancer treatment. J Drug Deliv Sci Technol. 2023 Sep;86:104709. doi: 10.1016/j.jddst.2023.104709.
Dudhipala N, Janga KY. Lipid nanoparticles of zaleplon for improved oral delivery by box-behnken design: optimization in vitro and in vivo evaluation. Drug Dev Ind Pharm. 2017;43(7):1205-14. doi: 10.1080/03639045.2017.1304957, PMID 28274147.
Amit Kumar S, Alok M, Himanshu P, Shanti Bhushan M. Fabrication of solid lipid nanoparticles by hot high shear homogenization and optimization by box-behnken design: an accelerated stability assessment. J Appl Pharm Sci. 2021;11(9):35-47. doi: 10.7324/JAPS.2021.110905.
Dora CP, Kushwah V, Katiyar SS, Kumar P, Pillay V, Suresh S. Improved oral bioavailability and therapeutic efficacy of erlotinib through molecular complexation with phospholipid. Int J Pharm. 2017;534(1-2):1-13. doi: 10.1016/j.ijpharm.2017.09.071, PMID 28970115.
Dora CP, Trotta F, Kushwah V, Devasari N, Singh C, Suresh S. Potential of erlotinib cyclodextrin nanosponge complex to enhance solubility dissolution rate in vitro cytotoxicity and oral bioavailability. Carbohydr Polym. 2016 Feb 10;137:339-49. doi: 10.1016/j.carbpol.2015.10.080, PMID 26686138.
Muller RH, Mader K, Gohla S. Solid lipid nanoparticles (SLN) for controlled drug delivery a review of the state of the art. Eur J Pharm Biopharm. 2000;50(1):161-77. doi: 10.1016/s0939-6411(00)00087-4, PMID 10840199.
Mehnert W, Mader K. Solid lipid nanoparticles: production characterization and applications. Adv Drug Deliv Rev. 2001;47(2-3):165-96. doi: 10.1016/s0169-409x(01)00105-3, PMID 11311991.
Pardeike J, Hommoss A, Muller RH. Lipid nanoparticles (SLN, NLC) in cosmetic and pharmaceutical dermal products. Int J Pharm. 2009;366(1-2):170-84. doi: 10.1016/j.ijpharm.2008.10.003, PMID 18992314.
Shah R, Eldridge D, Palombo E, Harding I. Optimisation and stability assessment of solid lipid nanoparticles using particle size and zeta potential. J Physiol Sci. 2014;25(1):59-75.
Uner M, Yener G. Importance of solid lipid nanoparticles (SLN) in various administration routes and future perspectives. Int J Nanomedicine. 2007;2(3):289-300. PMID 18019829.