
Int J App Pharm, Vol 17, Issue 6, 2025, 526-537Original Article
FORMULATION AND IN VITRO CHARACTERISATION OF ATENOLOL TRANSDERMAL FILM WITH NATURAL POLYSACCHARIDE
SWARNIM GUPTA1,2, RIMA DAWN2, ABHISHEK JANA1,2, DEBARATI KAR1,2, TATHAGATA ROY3, PINTU KUMAR DE2*
1JIS Institute of Pharmacy, Kalyani, Nadia, West Bengal-741235, India. 2Department of Pharmaceutical Technology JIS University, Kolkata, West Bengal-700109, India. 3Department of pharmaceutical Technology, NSHM Knowledge Campus Kolkata, Group of Institutions, Kolkata-700053, India
*Corresponding author: Pintu Kumar De; *Email: pintu.de@jisuniversity.ac.in
Received: 11 Feb 2025, Revised and Accepted: 21 Aug 2025
ABSTRACT
Objective: The objective of this research work targeted to create a mechanism for transdermal drug delivery containing atenolol with natural polysaccharide and modified natural polymeric combinations, using solvent evaporation technique and to analyse how polymers affect the transdermal patches physicochemical and drug-release characteristics.
Methods: Solvent casting method has been used to formulate transdermal film. Chia seed mucilage (CSM), Carboxymethylated chia seed mucilage, Hydroxypropyl methylcellulose (HPMC) and Gelatin in different combination ratios were used as the polymer. Dibutyl phthalate was chosen as a plasticizer.
Results: Result showed that the thickness of all film varied from 0.0546±0.0048 to 0.073±0.0032 mm with uniformity of thickness in each formulation. The average moisture content is found to be ranging between 4.8±0.13 to 5.67±0.14%. All batches had drug contents varying between 96 to 98 percent. All batches showed folding endurance grades exceeding 120. In comparison to formulation samples F1 to F4 (62.39%, 63.03%, 41.90%, and 23.68%, respectively), formulation samples F5 and F6 showed slower cumulative drug release of 35.26% and 34.27% at 480 min.
Conclusion: According to the study’s findings, modifying the polymer has an impact on the transdermal film’s physicochemical and drug-release characteristics, and formulating an efficient transdermal film requires an optimum ratio of polymer to plasticizer combination. Higher proportion of modified polymer and plasticizer in the formulation of transdermal film, gives lower percentage drug release from prepared film. Thus, it can be concluded that the increase in the ratio of plasticizer and modified CSM polymer in comparison to unmodified CSM polymer will result in retarding drug release rate.
Keywords: Transdermal drug delivery systems (TDDS), Chia seed mucilage (CSM), Atenolol, HPMC, Carboxymethylation, Dibutyl phthalate, Drug release
© 2025 The Authors. Published by Innovare Academic Sciences Pvt Ltd. This is an open access article under the CC BY license (https://creativecommons.org/licenses/by/4.0/)
DOI: https://dx.doi.org/10.22159/ijap.2025v17i6.53930 Journal homepage: https://innovareacademics.in/journals/index.php/ijap
INTRODUCTION
Novel controlled-release drug delivery system has been applied in various other therapeutic areas, but treating hypertension with these techniques is a relatively recent development [1]. Various chemical-dispensing systems have been used in biotechnology, including those for propranolol, clonidine (the transdermal therapeutic system), nifedipine (the gastrointestinal therapeutic system), verapamil (the sodium alginate and spheroidal oral-delivery absorption system), felodipine (the hydrophilic gel principle), metoprolol succinate (the multiple-unit pellet system), and diltiazem (one system comprising sustained-release beads and the other utilizing the patented Geo-matrix extended-release system) [2]. Antihypertensive drugs may now be taken once daily instead of two to four times per day through the development of oral drug delivery systems [3]. The delayed onset of pharmacodynamics action, variable or low bioavailability, increased first-pass hepatic metabolism, dosage dumping, prolonged toxicity, inflexibility in dosing, and higher price are some potential drawbacks of oral controlled-release drugs [4]. Reduced toxicity, improved compliance and convenience, stable medication levels, homogeneous drug impact, and lower overall dosage are a few potential benefits of transdermal drug delivery [5]. The transdermal delivery of atenolol provides another innovative approach to controlled continuous delivery of drugs. Selection of polymers are important for the formulation of TDDS [6]. Polymers have the film-forming capacity. When a solution of the polymer in a suitable solvent spreads on a flat surface and allows to evaporate, then a thin film of polymer is left behind. Similarly, if the drug is incorporated in polymer-solvent then drug molecules are dispersed in the polymer film and forms the drug-loaded films. Hence drug release entirely depends on polymer [7, 8]. Atenolol is a well-established beta-blocker, its delivery through transdermal systems remains limited due to challenges in achieving sustained and controlled drug release. The innovative aspect of this research lies in the use of biocompatible, naturally derived polysaccharides-an eco-friendly and cost-effective alternative to synthetic polymers-for the fabrication of the film matrix. This green formulation strategy not only aligns with the current trend of sustainable pharmaceutical development but also enhances the film’s safety and patient compliance. The aim of this study is to formulate transdermal film containing atenolol with naturally occurring polysaccharides using solvent evaporation techniques and examine drug release properties of transdermal film for providing better control on drug release characteristics in transdermal film.
MATERIALS AND METHODS
Atenolol API donated by Caplet India Pvt Ltd. Chia Seed purchased from local vendor. Acetone purchased from Merck Life Sciences Pvt Ltd, Mumbai, India. Sodium Hydroxide purchased from Merck Life Sciences Pvt Ltd, Mumbai, India. Monochloroacetic Acid purchased from LobaChemie Pvt Ltd. Methanol purchased from Merck Life Sciences Pvt Ltd, Mumbai, India. Hydroxypropyl Methyl Cellulose (HPMC) purchased from Finar chemical, Ahmedabad. Gelatin purchased from HI Media Laboratories Pvt Ltd. Potassium Dihydrogen Phosphate purchased from Merck Life Sciences Pvt Ltd, Mumbai, India. Di-Sodium Hydrogen Phosphate purchased from Merck Life Sciences Pvt Ltd, Mumbai, India. Potassium Bromide purchased from Merck Life Sciences Pvt Ltd, Mumbai, India. Analytical balance (Model No. BL220H, Shimazdu, Japan). FTIR (Model No. ALPHA II, Bruker Corporation, Germany). UV-Vis Spectrophotometer (Model No. UV 1800, Shimazdu, Japan). Magnetic Stirrer (Model No. 1MPH, Remi and Techno Makes, Mumbai, India). Dissolution Test Apparatus (Model No. VDA-8D Veego, Mumbai, India).
Chia seed mucilage extraction
Chia seeds (Salvia hispanica) were brought from local herbs market in Kolkata, West Bengal India, weigh and soaked overnight in distilled water with ratio seed: water (1:30) weigh to volume. Subsequently the mixture was subjected to continuous stirring for 1hour at a temperature of 80 °C for 30 min. on a hot plate. Filtration of the mixture is done using muslin cloth with fabric filtration process. Filtrate residue obtained was put on water bath for reduction process at 80 °C after reduction acetone was added to the filtrate for precipitation at (2:1) volume-to-volume ratio. The chia seed mucilage precipitated sample was filtered using a nylon cloth and air dried for 24 h and weight was recorded (shown in fig. 1-2) [9-12].
Percentage yield of chia seed mucilage-formula

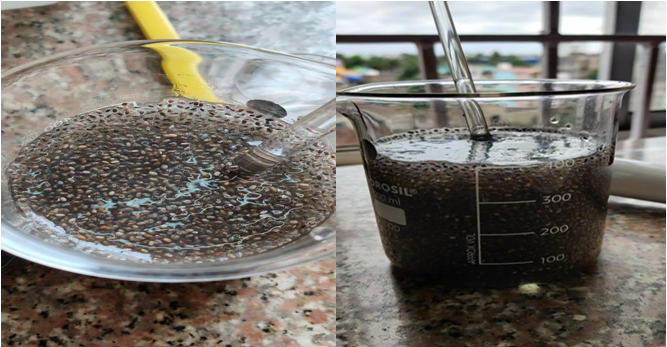
Fig. 1: Chia seeds (Salvia hispanica) immersed in distilled water
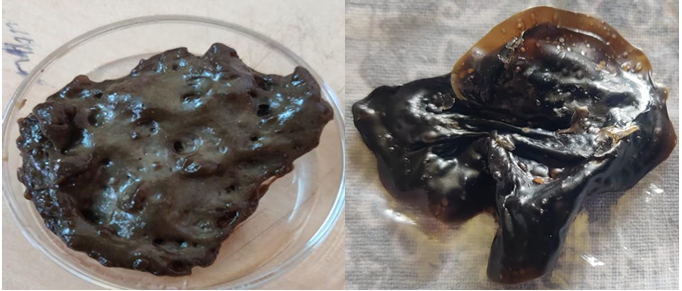
Fig. 2: Extracted chia seed mucilage
Modification of chia seed mucilage
Carboxymethylation of polysaccharides
2 g mucilage was dispersed in 4 ml water and heated to 80 °C for 15 min. 6.71 ml cold 45% (w/v) Sodium Hydroxide solution was added over a period of 45 min. 3.3 ml 45% (w/v) aqueous solution of monochloroacetic acid was added slowly to the reaction mixture over a period of 1 hour at temperature between 15-18 °C. The temperature of the mixture was raised slowly up to 60-65 °C and it was maintained for another 1 hour. Wetted mass was washed with 50 ml methanol and filtered. Residue was further washed with 20 ml 80% (v/v) methanol.
The mixture solution was filtered using muslin cloth and air-dried. The dried carboxymethylated chia seed polymer was weigh and recorded (fig. 3).
Percentage yield of modified chia seed mucilage-formula [13-16].

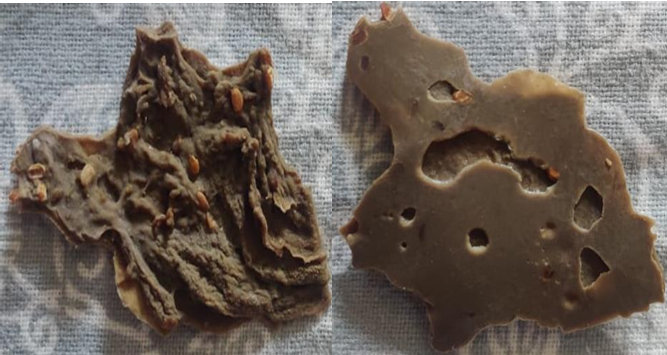
Fig. 3: Carboxymethylated chia seed mucilage
Preparation of formulation
Solvent casting method is used for the preparation of films. Polymer, API and distilled water are weighed in a fixed amount and put on a magnetic stirrer. Dibutyl phthalate is added into it forming a homogenous mixture; the mixture is poured on a petri dish and kept in hot air oven with circulating hot air for uniform drying. After the film dried the film are stored in air tight container away from sunlight in room temperature in desiccator for further use [17, 18].
Table 1: Composition of transdermal film
| Formulation | CSM (g) | CSM Modified (g) | HPMC (g) | Gelatin (g) | Atenolol (mg) | Plasticizer (ml) | Water (ml) |
| F1 | 0.4 | 0 | 0 | 0 | 50 | 0.084 | 8 |
| F2 | 0.4 | 0 | 0 | 0 | 50 | 0.158 | 8 |
| F3 | 0 | 0.4 | 0 | 0 | 50 | 0.084 | 8 |
| F4 | 0 | 0.4 | 0 | 0 | 50 | 0.158 | 8 |
| F5 | 0 | 0.6 | 0.3 | 0 | 50 | 0.28 | 10 |
| F6 | 0 | 0.6 | 0 | 0.3 | 50 | 0.28 | 10 |
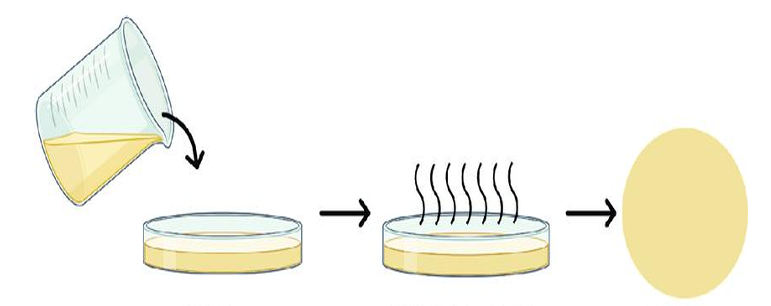
Fig. 4: Diagrammatic representation of the solvent casting method of transdermal film
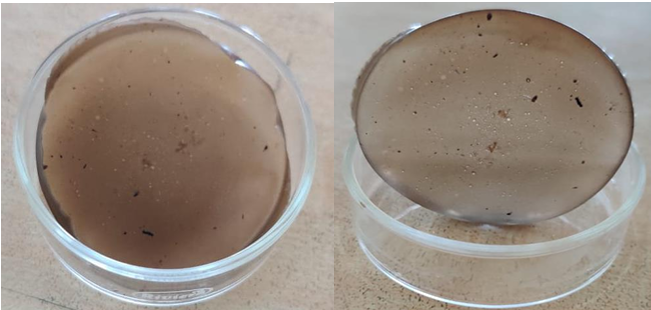
Fig. 5: Dry transdermal film of atenolol
Preformulation studies
Uv spectrophotometric analysis
To determine absorption maxima (λmax), the accurately weighed quantity 10 mg of Atenolol drug sample was dissolved in 6.8 phosphate buffer and volume make up to 100 ml with buffer in a 100 ml volumetric flask to obtain a stock solution 10 µg/ml. 1 ml of stock solution was pipet out in a 25 ml volumetric flask and volume was made up to the mark with phosphate buffer to obtain the concentration 4 µg/ml. The solution was then scanned between 200-400 nm using UV spectrophotometer (Model-1700, Shimadzu, Japan). The UV spectrum sample of Atenolol was recorded and obtained (λmax) was matched with the spectrum reported in official monograph [19, 20].
Media solution preparation
Dissolve 28.20 g of disodium hydrogen phosphate and 11.45 g of potassium dihydrogen phosphate in a 1000 ml volumetric flask and volume makeup with sufficient amount of distilled water to produce 1 l of 6.8 phosphate buffer [21].
Stock solution preparation
10 mg of Atenolol in 100 ml volumetric flask, volume is made up to 100 ml with phosphate buffer Drug stock solution was prepared. The stock solution sent through serial dilution of six different concentrations in the range of 2-12µg/ml to prepare the standard curve [22].
Fourier transform infrared (FT-IR) spectroscopy
The infrared spectroscopy of the pure drug sample was carried out to identify the drug. A pellet of drug was prepared by compressing of the drug with IR grade potassium bromide (KBr) by applying of 10 metric ton of pressure in KBr press. The pellet was mounted in IR compartment and scanned between wavelength 4000-450 cm-1 using FTIR spectrophotometer (Model No. ALPHA II, Bruker Corporation, Germany). The observed peaks corresponding to the various functional group were compared with the reference [23].
Drug polymer interaction study
FTIR spectroscopy of dry mixture of polymers (chia seed mucilage, HPMC and gelatin) and API (atenolol) in a ratio of 1:1:1 is done to see if any incompatibility between the API and polymers is there or not. Bruker FTIR alpha is used for the study [23].
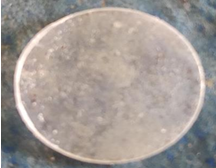
Fig. 6: KBr pellets of transmission in infrared spectroscopy
Formulation studies
Physical appearance
Formulated transdermal film were physically evaluated for colour, clarity, entrapment of any air bubble, flexibility and smoothness to determine patient acceptability and the therapeutic efficacy of the film [24, 25].
Thickness
Thickness of film was measured at 6 different spots of the film with screw gauge and average of the measurements is taken the average thickness [26].
Weight variation
Weight variation is studied by individually weighing 6 randomly selected film of same formulation and calculating the average weight [26].
Drug content
A portion of film (about 100 mg) is dissolved in 100 ml solution of phosphate buffer pH 6.8 in which the drug is soluble and the solution is shaken continuously for 24h in the shaker incubator. Then the whole solution is sonicated. After sonication and subsequent filtration, the drug in solution is estimated in spectrophotometer after suitable dilution [23, 24].
Moisture content
Films are weighed individually and kept in desiccators containing calcium chloride at room temperature for 24 h. The films are weighed again after a specified time interval until they show a constant weight [27].

Folding endurance
It is measured by repeatedly folding the film at the same place until it breaks. The number of times the films could be folded at the same place without breaking is the folding endurance value [27].
Content uniformity
For Content uniformity test 10 films are selected and the drug content is determined for individual film [28].
Surface pH
pH of the TDDS produced was tested using a digital pH meter by bringing the upper layer of the drug matrix of the TDDS to contact with the digital pH meter bulb. Thus the pH data were recorded [29, 30].
Flatness
One strip is cut from the centre and two from each side of film. The length of each strip is measured and variation in length is measured by determining percent constriction. Zero percent constriction is equivalent to 100 percent flatness [29, 30].

In vitro drug release
In vitro drug release study was carried out using USP dissolution type-II apparatus in 900 ml of phosphate buffer, pH 6.8 at 50 rpm and temperature was adjusted at 34±0.5 °C. The study was carried out for 12 h. and 5 ml samples were withdrawn at different time intervals and analysed for drug released to that point of time in the UV-VIS Spectrophotometer [31-33].
Determination of drug release kinetics
The dissolution data of different transdermal formulations containing atenolol was recorded and cumulative percentage drug release was calculated at intervals of 15, 30, 60, 120, 240, 360 and 480 min [34]. The data was fitted to different kinetic models like Zero zero-order model, first order model, Higuchi model, Hixson Crowell model and Korsmeyer-Peppas model. The𝑅² value was determined for each model using Microsoft excel 2007 [34, 35].
Light microscopic images
The transdermal film of atenolol was seen under light microscope and were photographed under the light microscope and were also photographed under open eye [36-38].
SEM: Scanning electron microscopy
Scanning electron microscopy of the transdermal film has been performed to study the drug distribution in comparison of the F6 batch of transdermal film of atenolol and blank polymer film [39, 40].
RESULT AND DISCUSSION
Extraction of chia seed mucilage
Table 2: Average percentage yield of extracted mucilage
| Batch number | Dry seed weight (g) | Dry mucilage weight (g) | Yield (%) | Average percentage yield |
| 1 | 64 | 1.759 | 2.748 | 2.914±0.368 |
| 2 | 120 | 4.283 | 3.569 | |
| 3 | 60 | 1.658 | 2.763 | |
| 4 | 200 | 5.623 | 2.811 | |
| 5 | 74 | 1.985 | 2.682 |
The extracted chia seed mucilage is found to be dark brown in colour (fig. 6,7), by using this method on average 2.914±0.368 % yield is obtained [11, 12].
Modification of chia seed mucilage
Table 3: Average percentage yield of carboxymethylated (modified) chia seed mucilage
| Batch number | Dry mucilage weight (g) | Dry modified mucilage weight (g) | Yield (%) | Average percentage yield |
| 1 | 2.188 | 1.123 | 51.32 | 68.672±22.02 |
| 2 | 4.283 | 3.513 | 82.02 | |
| 3 | 2.661 | 1.034 | 38.85 | |
| 4 | 5.623 | 4.824 | 85.79 | |
| 5 | 2.354 | 2.010 | 85.38 |
The modified chia seed mucilage is obtained using the method of carboxymethylation and found to be light brown in colour (fig. 8) with average of 68.672±22.02% of yield value [15, 16].
Preformulation studies
The preformulation study was performed in order to assure the authenticity of sample drug and determination of some parameters for the development of formulation preformulation studies of atenolol, including UV absorption maxima and identification of drug sample by FT-IR spectroscopy and other studies were carried out, the observed results were compared with the references [20].
UV spectrophotometric analysis
The UV absorption maxima of drug sample was characterized. The drug sample was identified by UV scanning spectroscopy (Model-1800, Shimadzu, Japan) and the maximum absorbance of drug max 225 nm which shown in fig. 7 [19, 20].
Preparation of calibration curve
Phosphate buffer 6.8 preparation
The calibration curve of atenolol was prepared by 28.20g of disodium hydrogen phosphate and 11.45g of potassium dihydrogen phosphate dissolve in 1000 ml of distilled water. The absorbance value corresponding to each concentration was plotted on y-axis and concentration on x-axis. The regression was found to be 0.999 in phosphate buffer 6.8. The calibration curve showed the linearity between the concentration ranging from 2-12 µg/ml analyzed by using UV spectrophotometer at a wavelength 225 nm. Where we get (y = mx+c) slope value and r2 value 0.999 [21, 22].

Fig. 7: UV Absorption spectra of atenolol and peak detection chart
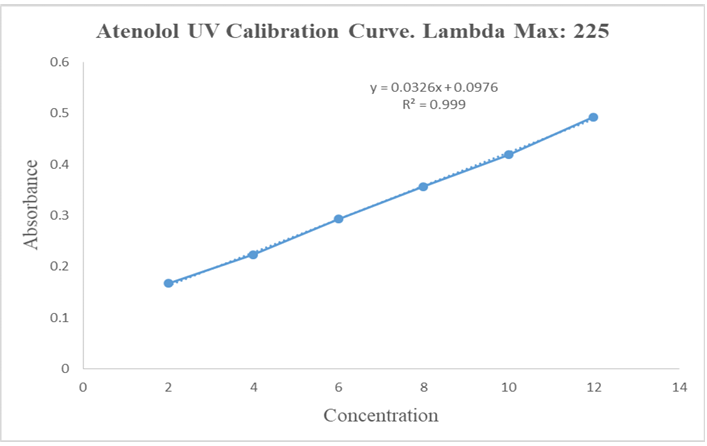
Fig. 8: Calibration curve of atenolol in phosphate buffer 6.8 at 225 nm
Table 4: Absorbance values of atenolol in 6.8 phosphate buffer at 225 nm
| Concentration (µg/ml) | Stock solution (ml) | Media solution (ml) | Absorbance |
| 2 | 0.5 | 24.5 | 0.167 |
| 4 | 1 | 24 | 0.224 |
| 6 | 1.5 | 23.5 | 0.293 |
| 8 | 2 | 23 | 0.357 |
| 10 | 2.5 | 22.5 | 0.419 |
| 12 | 3 | 22 | 0.493 |
FTIR spectroscopy of atenolol
The infrared spectroscopy of the pure drug sample (Atenolol) was carried out to identify the drug sample. Potassium bromide was used for preparing the pellets of the drug along with the excipients as mentioned in the composition list in the I. R spectroscopic scan. The pellet was mounted in IR compartment and scanned between wavelength 4500-450 cm-1 using FTIR spectrophotometer (Model No. ALPHA II Bruker Corporation, Germany).
Significant peaks of API Atenolol at 1588 for C=C (conjugated); 1728 peak for C=O; 2854 peak for C-H (bend in plane); 2921 peak for CH2; 3173 peak for H-N; 3356 peak for –OH are significant and are present in curves of API thus it can be stated that there is no interaction occurring as shown in fig. 9 [23].
Drug polymer interaction study
Active pharmaceutical ingredient and polymer compatibility using Fourier transform infrared spectroscopy is carried out in order to physicochemical compatibility between drug and polymer used in the formulation. Significant peaks of API Atenolol at 1588 for C=C (conjugated); 1728 peak for C=O; 2854 peak for C-H (bend in plane); 2921 peak for CH2; 3173 peak for H-N; 3356 peak for –OH are significant and also present in physical admixture of API and polymer (fig. 10) thus it can be stated that there is no interaction occurring in the physical mixture of drug and polymer [24].
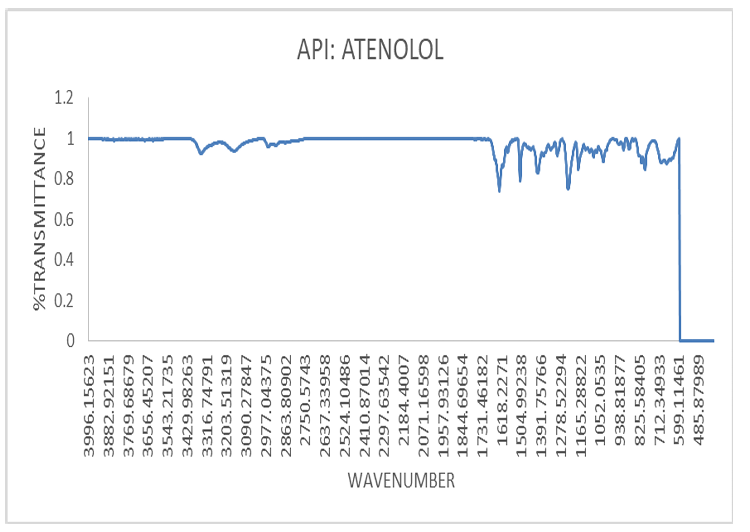
Fig. 9: I. R. spectrum of atenolol
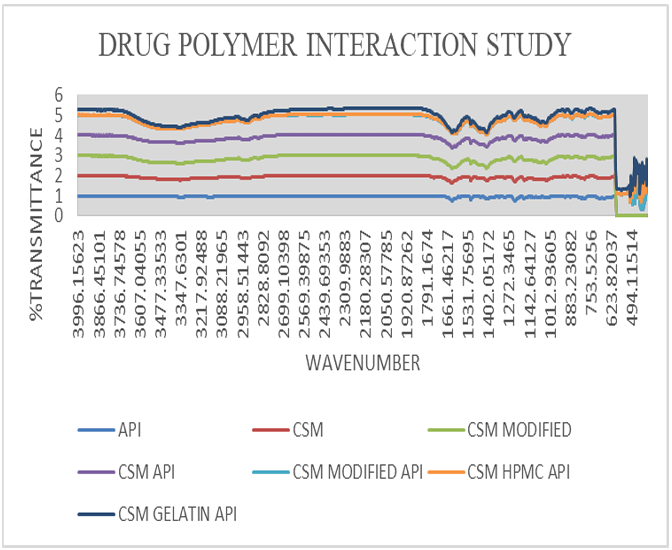
Fig. 10: I. R spectra of drug and polymer interaction study
Formulation studies
Physical appearance
When studied from both the sides the formulated films were found to be (table 5) clear, smooth, even and semi-transparent with light brown in colour with modified CSM (F3, F4, F5, F6) and rough and even surface with CSM polysaccharide (F1, F2)[24, 25].
Thickness
The thickness of all formulations measured with screw gauge is tabulated in table. The thickness of the films varies from 0.0546±0.0048 to 0.073±0.0032 mm. The thickness is increasing with increased in the proportion of polymer in the film; it may be due to the less water permeability nature of polymer and retains the mass of the film (table 5) [26].
Weight variation
Weight of the transdermal film varies within a range of 415±35 mg to 446.25±12.52 mg (depicted in table), weight of the formulation also increases with increasing polymer ratio as in case of thickness (table 5) [26].
Drug content
The uniformity in drug content and minimum variability from batch to batch is found from the results of drug content assay which ranging between 96 to 98% as shown in table 6 [27].
Table 5: Physical appearance, thickness and weight variation of different formulation where n=6
| Formulation number | Physical appearance | Thickness average±SD (mm) | Weight variation average±SD (mg) |
| F1 | Rough and even | 0.055±0.004 | 415±35 |
| F2 | Rough and even | 0.0588±0.009 | 425±63 |
| F3 | Smooth and even | 0.0546±0.0048 | 441.8±25 |
| F4 | Smooth and even | 0.063±0.0032 | 442±64 |
| F5 | Smooth and even | 0.064±0.0032 | 442±15 |
| F6 | Smooth and even | 0.031±0.0031 | 446.25±12.52 |
Moisture content
Moisture content is increased with the increasing concentration of the hydrophilic polymer, as depicted in table. The average moisture content is found to be ranging between 4.8±0.13 to 5.67±0.14%. Low moisture content of the formulation protects from bulking of patches and microbial contamination and helps to remain stable with brittle and dried film (table 6) [28].
Folding endurance
Average folding endurance value was found greater than 120 in all transdermal film. Folding endurance is seen to be more in formulations with combination polymer with modification with 40% of dibutyl phthalate as seen in F5 and F6. Folding endurance ensures that the concentration of plasticizer used (dibutylphthalate) having the capacity of making flexible patches (table 6) [27, 28].
Flatness and content uniformity
The content uniformity is also found to be 93.162% as shown in table. Which is quite good as it will help the film to release the drug uniformly. The flatness is found to be approximately even and strip length of the formulation shows no difference before and after cutting the film and maintains the smooth surface with no constriction when applied to skin and hence gives good drug permeation (table 6) [28, 29].
Surface pH
pH of the film was found to be 5.72 in average, which is an inacceptable range as per dosage form for dermal administration (table 6) [30].
In vitro drug release
The cumulative percentage drug release when plotted against time in hrs it is observed that the drug release following controlled release pattern from the transdermal films. The fastest drug release is seen in F1 (62.49% at 480 min) film with low ratio of plasticizer and unmodified hydrophilic polymer as in case of other authors [Kulkarni RV et al., 2002] and the slowest is seen in F5 and F6 (35.26% and 34.27% at 480 min) batch film containing highest ratio of plasticizer and modified combined polymer. So this can be stated that an increase in amount of plasticizer has a property of retarding the drug release rate and it is visible in drug release rate of F5 and F6 batch. Whereas in the case of unmodified polymer amount it is seen to be increasing the drug release rate. As unmodified polymer is more soluble in water, it shows more drug release compared to modified polymer. Thus, it can be concluded that the increase in the ratio of plasticizer and modified polymer in comparison to unmodified polymer will result in retarding drug release rate (fig. 11) [31, 32].
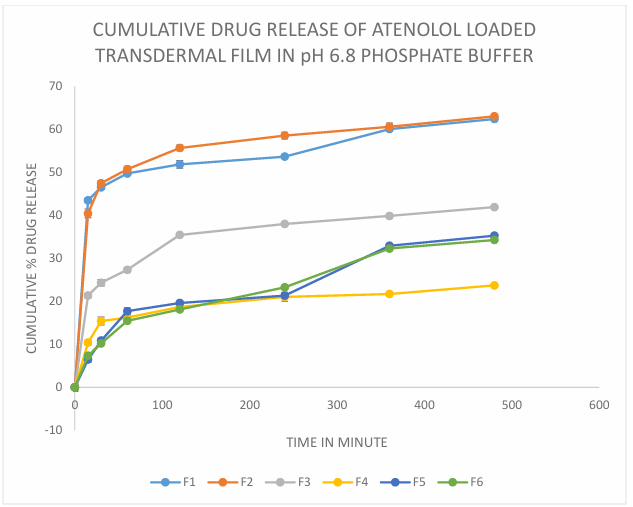
Fig. 11: Cumulative drug release of atenolol loaded transdermal film in pH 6.8 phosphate buffer, n=6
Table 6: Drug content, moisture content, folding endurance, surface pH, content uniformity and flatness of all formulation where n=6
| Formulation number | Drug content % | Moisture content | Folding endurance | Surface pH | Content uniformity % | Flatness % |
| F1 | 96.33 | 4.87±0.15 | 121±15 | 5.4 | 85.98 | 96±0.58 |
| F2 | 96.57 | 4.98±0.54 | 128±32 | 5.72 | 87.63 | 97±0.75 |
| F3 | 97.56 | 5.67±0.14 | 150±28 | 5.4 | 91.75 | 98±1.27 |
| F4 | 98.24 | 5.57±0.12 | 152±54 | 5.8 | 94.58 | 99±0.64 |
| F5 | 98 | 4.8±0.13 | 176±62 | 6.0 | 96.65 | 100±1.19 |
| F6 | 98.87 | 4.58±0.13 | 180±25 | 6.1 | 96.85 | 100±0.99 |
Determination of drug release kinetics
The drug release data was fitted to different kinetic model and values of R² was determined and shown in following table number 7. From the results it was observed that the drug release following the Higuchi model with the highest values of R2 closest to 0.999 so it can be stated that the release mechanism of Atenolol from transdermal film followed diffusion method (fig. 12) [33, 34].
Table 7: Drug release kinetics table of R2 value
| Kinetics model | F1 R² | F2 R² | F3 R² | F4 R² | F5 R² | F6 R² |
| Zero order | 0.4095 | 0.4153 | 0.5945 | 0.5828 | 0.8664 | 0.8984 |
| First order | 0.5535 | 0.5503 | 0.6697 | 0.6209 | 0.8991 | 0.9288 |
| Higuchi | 0.6228 | 0.6473 | 0.8171 | 0.803 | 0.9574 | 0.9858 |
| Hixon Crowell | 0.2182 | 0.224 | 0.2951 | 0.2922 | 0.4968 | 0.5094 |
| Korsmeyer Peppas | 0.2723 | 0.2823 | 0.425 | 0.3411 | 0.5877 | 0.6566 |
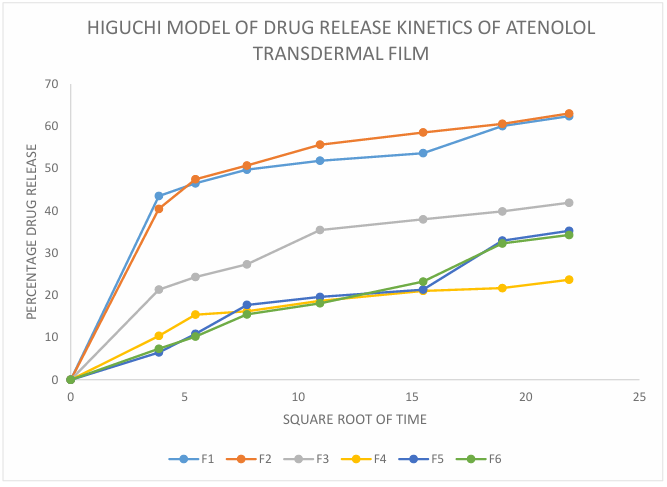
Fig. 12: Higuchi model of drug release kinetics of atenolol transdermal film
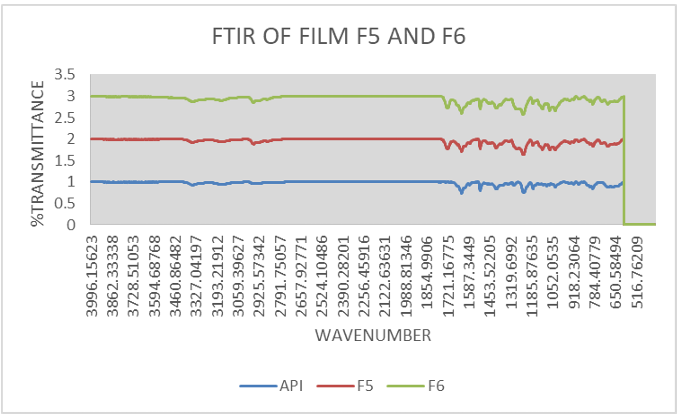
Fig. 13: FTIR of film (F5, F6)
FTIR of film
Significant peaks of API Atenolol at 1588 for C=C (conjugated); 1728 peak for C=O; 2854 peak for C-H (bend in plane); 2921 peak for CH2; 3173 peak for H-N; 3356 peak for –OH are significant and are present in curves of best-found film showing controlled release (F5, F6) [35].
Light microscopic images of atenolol-loaded transdermal film
The light microscopic images of atenolol loaded transdermal film were captured under 40X lens shows surface texture of formulation, smoothness and elasticity of transdermal film. F1 image shows the rough uneven and stiff texture of film due to unmodified chia seed mucilage and low plasticizer concentration (fig. 14), F2 shows unstable structure with slightly smooth with unmodified chia seed mucilage and slight increased plasticizer (fig. 15) whereas modified chia seed polymer in F3 (fig. 16), F4 (fig. 17) both shows smooth and even surface, formulation F5 and F6 shows better smoothness, even texture of surface with more elastic property due to combination of modified chia seed mucilage polymer with HPMC and gelatin respectively (fig. 18, 19) [36-38].
Scanning electron microscopy
The uniform drug distribution is clearly noticeable in the scanning electron microscopy (fig. 20), which is blank film compared to (fig. 21) with drug (atenolol) loaded film [39, 40].
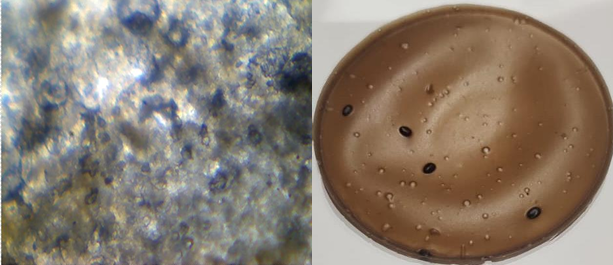
Fig. 14: Light microscopic image and open eye image of formulation F1
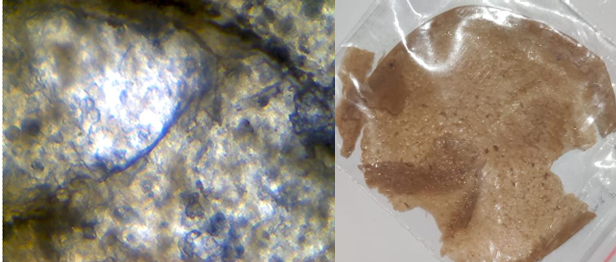
Fig. 15: Light microscopic image and open eye image of formulation F2
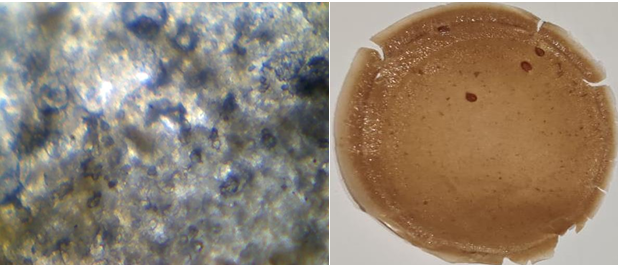
Fig. 16: Light microscopic image and open eye image of formulation F3
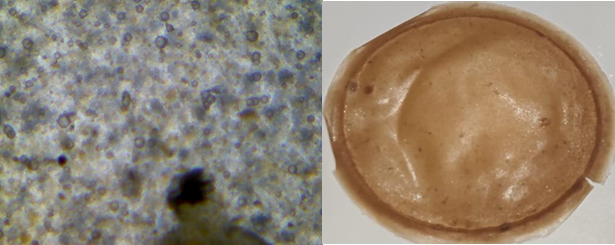
Fig. 17: Light microscopic image and open eye image of formulation F4
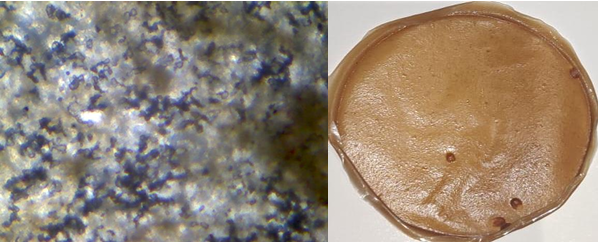
Fig. 18: Light microscopic image and open eye image of formulation F5
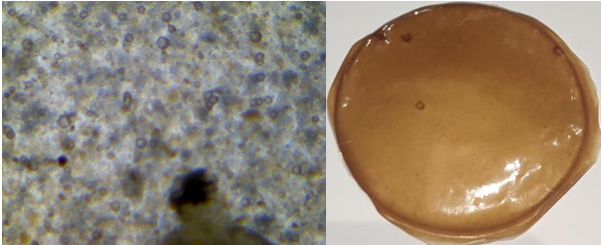
Fig. 19: Light microscopic image and open eye image of formulation F6
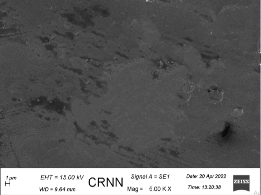
Fig. 20: Scanning electron microscopy of transdermal film (blank i. e. without drug)
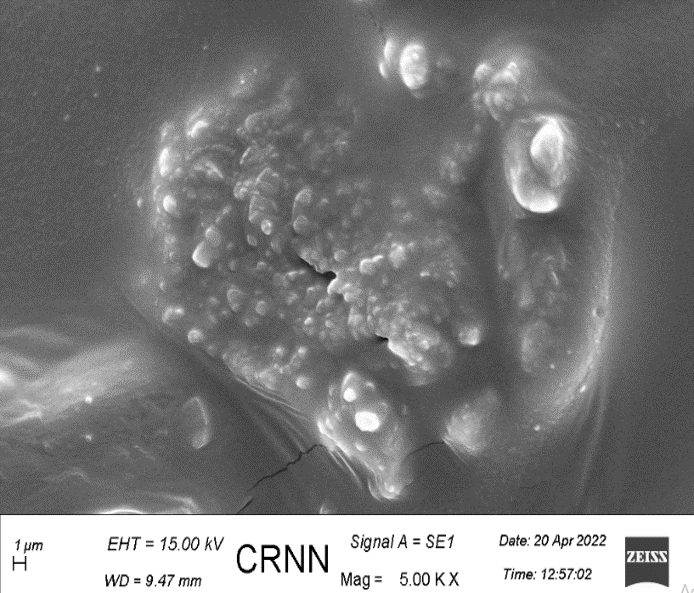
Fig. 21: Scanning electron microscopy of transdermal film (with drug)
CONCLUSION
The optimum extraction process was performed at a temperature of 80 °C with a seed: water ratio of 1:30 (weight to volume). The maximum hydration occurred with best result at a temperature 80 °C. The results of this study showed that the mucilage can be easily extracted, and the polysaccharide was chemically modified to obtain its carboxymethylated derivative. Results suggested that carboxymethylation not only affected the physicochemical properties of CSM, but also increased its stability of structure and texture of polymer and formulation of hydrogel film using extracted, modified and in combination with HPMC and gelatin polymer was successfully done and found to be having no incompatibility between API and excipients and ran through various physicochemical tests to decide the changes due to variation in polymer and plasticizer concentration. The drug release of the optimized batch F5 and F6 is 35.63 and 34.25, respectively, which is more than the batch F1, F2, F3, and F4 at 480 min. Comparatively, it can be stated that an increase in amount of plasticizer has a property of retarding the drug release rate and it is visible in drug release rate of F5 and F6 batch. Whereas in the case of unmodified CSM polymer, it is seen to be increasing the drug release rate. As unmodified CSM polymer is more soluble in water, it shows more drug release compared to modified polymer. Thus, it can be concluded that the increase in the ratio of plasticizer and modified CSM polymer in comparison to unmodified CSM polymer will result in retarding drug release rate.
ACKNOWLEDGEMENT
The authors are grateful to the authorities and management of JIS group for providing the necessary research facilities at JIS University.
FUNDING
Nil
AUTHORS CONTRIBUTIONS
Swarnim Gupta contributed to the conceptualization, methodology, data analysis, and writing of the manuscript. Rima Dawn was involved in the conceptualization and methodology. Abhishek Jana contributed to data analysis, writing, and editing. Debarati Kar was responsible for writing and editing. Tathagata Roy contributed to the conceptualization. Pintu Kumar De was involved in the conceptualization and provided supervision throughout the project.
CONFLICTS OF INTERESTS
The authors have no conflict of interest
REFERENCES
Ramadon D, McCrudden MT, Courtenay AJ, Donnelly RF. Enhancement strategies for transdermal drug delivery systems: current trends and applications. Drug Deliv Transl Res. 2022;12(4):758-91. doi: 10.1007/s13346-021-00909-6, PMID 33474709.
Kanase VG, Dani SM, Pandagale PM. Salvia hispanica (chia) seeds a review on pharmacological benefits, nutraceutical properties, extraction method and applications. Int J Pharm Sci Res. 2022;13(6):2263-73. doi: 10.13040/IJPSR.0975-8232.13(6).2263-73.
Fancher IS, Rubinstein I, Levitan I. Potential strategies to reduce blood pressure in treatment-resistant hypertension using food and drug Administration-approved nanodrug delivery platforms. Hypertension. 2019 Feb;73(2):250-7. doi: 10.1161/HYPERTENSIONAHA.118.12005, PMID 30624988.
Li J, Chen B, Yu T, Guo M, Zhao S, Zhang Y. An efficient controlled release strategy for hypertension therapy: folate-mediated lipid nanoparticles for oral peptide delivery. Pharmacol Res. 2020 Jul 1;157:104796. doi: 10.1016/j.phrs.2020.104796, PMID 32278048.
Moradifar N, Kiani AA, Veiskaramian A, Karami K. Role of organic and inorganic nanoparticles in the drug delivery system for hypertension treatment: a systematic review. Curr Cardiol Rev. 2022 Jan 1;18(1):e110621194025. doi: 10.2174/1573403X17666210611115823, PMID 35297343.
Kamaly N, Yameen B, Wu J, Farokhzad OC. Degradable controlled release polymers and polymeric nanoparticles: mechanisms of controlling drug release. Chem Rev. 2016 Feb 24;116(4):2602-63. doi: 10.1021/acs.chemrev.5b00346, PMID 26854975.
Fard MM, Fard AM. Modeling drug release. Eurasian J Sci Technol. 2022;2(1):14-33.
Rastogi V, Upadhyay P. A brief view on antihypertensive drugs delivery through transdermal patches. Int J Pharm Sci Res. 2012:3(7):1955. doi: 10.13040/IJPSR.0975-8232.3(7).1955-70.
Marineli RS, Moraes EA, Lenquiste SA, Godoy AT, Eberlin MN, Marostica Jr MR. Chemical characterization and antioxidant potential of Chilean chia seeds and oil (Salvia hispanica L.). LWT Food Sci Technol. 2014 Dec 1;59(2):1304-10. doi: 10.1016/j.lwt.2014.04.014.
Munoz LA, Cobos A, Diaz O, Aguilera JM. Chia seeds: microstructure, mucilage extraction and hydration. J Food Eng. 2012 Jan 1;108(1):216-24. doi: 10.1016/j.jfoodeng.2011.06.037.
Souza AL, Martinez FP, Ferreira SB, Kaiser CR. A complete evaluation of thermal and oxidative stability of chia oil: the richest natural source of α-linolenic acid. J Therm Anal Calorim. 2017 Dec;130(3):1307-15. doi: 10.1007/s10973-017-6106-x.
Korczak R, Kamil A, Fleige L, Donovan SM, Slavin JL. Dietary fiber and digestive health in children. Nutr Rev. 2017 Apr 1;75(4):241-59. doi: 10.1093/nutrit/nuw068, PMID 28586481.
Scapin G, Schmidt MM, Prestes RC, Rosa CS. Phenolic compounds, flavonoids and antioxidant activity of chia seed extracts (Salvia hispanica) obtained by different extraction conditions. Int Food Res J. 2016 Dec 22;23(6):2341-6.
Cuomo F, Iacovino S, Cinelli G, Messia MC, Marconi E, Lopez F. Effect of additives on chia mucilage suspensions: a rheological approach. Food Hydrocoll. 2020 Dec 1;109:106118. doi: 10.1016/j.foodhyd.2020.106118.
Chakka VP, Zhou T. Carboxymethylation of polysaccharides: synthesis and bioactivities. Int J Biol Macromol. 2020 Dec 15;165(B):2425-31. doi: 10.1016/j.ijbiomac.2020.10.178, PMID 33132131.
Li Y, Yuan Y, Lei L, Li F, Zhang Y, Chen J. Carboxymethylation of polysaccharide from Morchella angusticepes peck enhances its cholesterol-lowering activity in rats. Carbohydr Polym. 2017 Sep 15;172:85-92. doi: 10.1016/j.carbpol.2017.05.033, PMID 28606551.
Parhi R, Padilam S. In vitro permeation and stability studies on developed drug in adhesive transdermal patch of simvastatin. Bull Fac Pharm Cairo Univ. 2018 Jun 1;56(1):26-33. doi: 10.1016/j.bfopcu.2018.04.001.
Lu Y, Luo Q, Chu Y, Tao N, Deng S, Wang L. Application of gelatin in food packaging: a review. Polymers. 2022 Jan 21;14(3):436. doi: 10.3390/polym14030436, PMID 35160426.
Liu Y, Sun Y, Huang G. Preparation and antioxidant activities of important traditional plant polysaccharides. Int J Biol Macromol. 2018 May 1;111:780-6. doi: 10.1016/j.ijbiomac.2018.01.086, PMID 29355627.
Liu X, Wang X, Xu X, Zhang X. Purification antitumor and anti-inflammation activities of an alkali-soluble and carboxymethyl polysaccharide CMP33 from Poria cocos. Int J Biol Macromol. 2019 Apr 15;127:39-47. doi: 10.1016/j.ijbiomac.2019.01.029, PMID 30629996.
Ah YC, Choi JK, Choi YK, Ki HM, Bae JH. A novel transdermal patch incorporating meloxicam: in vitro and in vivo characterization. Int J Pharm. 2010 Jan 29;385(1-2):12-9. doi: 10.1016/j.ijpharm.2009.10.013, PMID 19833177.
Bhagyeshwar G, Ramu B, Rajkamal B. Formulation and evaluation of transdermal patches of metformin hydrochloride. World Res J Pharm Technol. 2017;2(4):1-20.
Amjad M, Ehtheshamuddin M, Chand S, Hanifa SM, Asia R, Kumar GS. Formulation and evaluation of transdermal patches of atenolol. Adv Res Pharm Biol. 2011 Oct;1(2):12-23.
Kulkarni RV, Mutalik S, Hiremath D. Effect of plasticizers on the permeability and mechanical properties of Eudragit films for transdermal application. Indian J Pharm Sci. 2002;64(1):28-31.
Budhathoki U, Gartoulla K, Shakya S. Formulation and evaluation of transdermal patches of atenolol. Indonesian J Pharm. 2016 Dec 23;27(4):196. doi: 10.14499/indonesianjpharm27iss4pp196.
Sivasankarapillai VS, Das SS, Sabir F, Sundaramahalingam MA, Colmenares JC, Prasannakumar S. Progress in natural polymer engineered biomaterials for transdermal drug delivery systems. Mater Today Chem. 2021 Mar 1;19:100382. doi: 10.1016/j.mtchem.2020.100382.
Biswas D, Das S, Mohanto S, Mantry S. Extraction modification and characterization of natural polymers used in transdermal drug delivery system: an updated review. Asian J Pharm Clin Res. 2020;13(7):10-20. doi: 10.22159/ajpcr.2020.v13i7.37756.
Mo L, Lu G, Ou X, Ouyang D. Formulation and development of novel controlled-release transdermal patches of carvedilol to improve bioavailability for the treatment of heart failure. Saudi J Biol Sci. 2022 Jan 1;29(1):266-72. doi: 10.1016/j.sjbs.2021.08.088, PMID 35002418.
Kandalkar A, Dhole R, Jawarkar S, Patel A, Pawar D, Wagh H. Transdermal telmisartan patch development with natural permeation enhancers: ex vivo release comparison. J Namibian Stud Hist Polit Cult. 2023 Aug 10;35(1):3504-23. doi: 10.59670/jns.v35i.4242.
Maruti MM, Shirsat MK. Formulation and characterization of multilayered controlled-release topical patch for cure of cardiac disease. NVEO Nat Volat Essent Oils J. 2021 Dec 20;8(4)13737-64.
Hardainiyan SW, Kumar KR, Nandy BC, Saxena RI. Design formulation and in vitro drug release from transdermal patches containing imipramine hydrochloride as model drug. Int J Pharm Pharm Sci. 2017 Jun 1;9(6):220. doi: 10.22159/ijpps.2017v9i6.16851.
Gannu R, Vishnu YV, Kishan V, Rao YM. Development of nitrendipine transdermal patches: in vitro and ex vivo characterization. Curr Drug Deliv. 2007 Jan 1;4(1):69-76. doi: 10.2174/156720107779314767, PMID 17269919.
Hasnain MS, Guru PR, Rishishwar P, Ali S, Ansari MT, Nayak AK. Atenolol-releasing buccal patches made of Dillenia indica L. fruit gum: preparation and ex vivo evaluations. SN Appl Sci. 2020 Jan;2(1). doi: 10.1007/s42452-019-1756-x.
Kim HS, Yun YH, Shim WG, Yoon SD. Preparation of atenolol imprinted polysaccharide-based biomaterials for a transdermal drug delivery system. J Drug Deliv Sci Technol. 2020 Oct 1;59:101893. doi: 10.1016/j.jddst.2020.101893.
Adhikari SN, Panda S. Development, evaluation and characterization of buccal patches containing atenolol using hydrophilic polymers. Int J Appl Pharm. 2022;14(2):61-7. doi: 10.22159/ijap.2022v14i2.43589.
Mehta P, Al Kinani AA, Arshad MS, Chang MW, Alany RG, Ahmad Z. Development and characterisation of electrospun timolol maleate loaded polymeric contact lens coatings containing various permeation enhancers. Int J Pharm. 2017 Oct 30;532(1):408-20. doi: 10.1016/j.ijpharm.2017.09.029, PMID 28917987.
Bialik M, Kurkowski P, Strzelecka K, Kuras M, Sobczak M, Mulas K. Dual-controlled delivery of furosemide and atenolol using a biodegradable nanosystem for antihypertensive therapy. J Drug Deliv Sci Technol. 2023 Nov 1;89:105006. doi: 10.1016/j.jddst.2023.105006.
Zhang K, Zhuang Y, Li J, Liu X, He S. Poly(acrylic acid) modified MoS2 nanoparticle based transdermal delivery of atenolol. Int J Nanomedicine. 2020 Aug 4;15:5517-26. doi: 10.2147/IJN.S257906, PMID 32801703.
Ahad A, Al Jenoobi FI, Al Mohizea AM, Akhtar N, Raish M, Aqil M. Systemic delivery of β-blockers via transdermal route for hypertension. Saudi Pharm J. 2015 Nov 1;23(6):587-602. doi: 10.1016/j.jsps.2013.12.019, PMID 26702253.
Noreen S, Ma JX, Saeed M, Pervaiz F, Hanif MF, Ahmed B. Natural polysaccharide-based biodegradable polymeric platforms for transdermal drug delivery system: a critical analysis. Drug Deliv Transl Res. 2022 Nov;12(11):2649-66. doi: 10.1007/s13346-022-01152-3, PMID 35499715.