
Int J App Pharm, Vol 17, Issue 4, 2025, 344-357Original Article
QUERCETIN PHYTOSOMES: A COMPREHENSIVE APPROACH FOR THE PREPARATION AND OPTIMIZATION USING BOX-BEHNKEN DESIGN
SRIKALA KAMIREDDYa,b, SHANMUGA SUNDARAM SANGEETHAa*, HAREKRISHNA ROYb
aSRM College of Pharmacy, SRM IST, SRM Nagar, Kattankulathur, Chengalpattu Dist, Tamilnadu-603203, India. bNirmala College of Pharmacy, Mangalagiri, Atmakur-522503, Andhrapradesh, India
*Corresponding author: Shanmuga Sundaram Sangeetha; *Email: sangeetha.sa@ktr.srmuniv.ac.in
Received: 26 Feb 2025, Revised and Accepted: 06 May 2025
ABSTRACT
Objective: The main objective of the present study was to develop and optimize quercetin-loaded phytosomes using the Quality by Design (QbD) methodology and to evaluate their in vivo efficacy.
Methods: The rotary evaporation technique was used to formulate phytosomes. The experimental design utilized a box-Behnken model with three levels and three different components and produced 17 batches. The interactions between dependent and independent variables across different levels were analyzed using a polynomial quadratic equation. The optimized phytosomes were characterized through various techniques, including Fourier Transform Infra-Red (FTIR), Differential Scanning Calorimetry (DSC), Zeta potential and Particle Size (PS), X-Ray Diffraction (XRD), Nuclear Magnetic Resonance (NMR), Transmission Electron Microscopy (TEM), Entrapment Efficiency (EE), and Percentage Yield (PY).
Results: FTIR analysis identified key peaks and functional groups, confirming phytosome formation. It was determined that the average particle size was 204.6 nm. DSC tests provide evidence of the development of inclusion complexes and drug amorphization in quercetin phytosome with endothermic peaks at 198.29 °C and 274.75 °C. Zeta potential was determined to be-28.6mV. The crystalline and thermal characteristics of the optimized phytosome were determined by XRD Analysis. The phytosome's diffraction pattern showed intense and crisp crystalline peaks at 2θ of 20.20000, 18.22000, and 19.62000, and the crystallinity index was found to be 16.7%, indicating its amorphous nature. The difference in The NMR spectra of quercetin phytosome can be attributed to the presence of L-α Phosphatidylcholine, which may cause a minor shift in the chemical shift of quercetin. According to the TEM investigation, the phytosome displayed a stable, spherical, self-enclosed shape. The in vitro data demonstrated enhanced dissolution and faster drug release (98.1%) of quercetin phytosome compared to free quercetin (68.4%) at the end of 7 h. The in vivo data demonstrate that these phytosomes efficiently decreased body weight (165±0.29) by comparing with standard drug atorvastatin(162±0.17) with p value less than 0.05, showing this is a significant.
Conclusion: The present study efficiently employed QbD Methodology to formulate and optimize quercetin phytosomes.
Keywords: Quercetin, Obesity, Phytosome, QbD methodology, Bioavailability, Optimization
© 2025 The Authors. Published by Innovare Academic Sciences Pvt Ltd. This is an open access article under the CC BY license (https://creativecommons.org/licenses/by/4.0/)
DOI: https://dx.doi.org/10.22159/ijap.2025v17i4.54075 Journal homepage: https://innovareacademics.in/journals/index.php/ijap
INTRODUCTION
Oral drug delivery is often preferred due to its convenience in administration; however, the major challenge associated with numerous herbal drugs lies in their poor solubility, limited absorption, and degradation within the gut [1]. To address these issues, new technologies are required to enhance its solubility and therapeutic efficacy [2]. Phytosomes have emerged as a novel approach to natural product delivery, which it attracted significant attention recently [3]. These complexes are created by binding plant extracts to phospholipids, forming a unique molecular complex that enhances the bioavailability and efficacy of these natural products [4]. The significance of phytosomes resides in their ability to overcome the limitations of traditional delivery techniques, including poor solubility and absorption [5]. One key advantage of phytosomes is their improved solubility in both water and lipids [6]. Additionally, phytosomes can directly interact with cell membranes due to the presence of phospholipids, leading-improved cellular uptake [7]. This interaction significantly boosts the bioavailability of natural products and maximizes their therapeutic potential [8]. Encapsulating plant extracts within phospholipid complexes, phytosomes protect these sensitive compounds from degradation by enzymes or harsh conditions within the gastrointestinal tract [9]. This targeted delivery system ensures that the active ingredients are delivered specifically to tissues or organs where they exert their desired effects [10]. Consequently, phytosomes offer greater accuracy in the delivery of natural products and potentially reduce side effects associated with non-targeted distribution.
Due to the dominance of bad eating patterns and sedentary lifestyles, obesity has become a serious problem in today's world [11]. Since obesity impacts a person's psychological as well as physical health, there is a greater need to address this issue [12]. We must be aware that obesity can lead to several medical complications, such as Cardio Vascular Problems (CVP), diabetes, and joint problems [13]. These conditions not only lower one's quality of life but also raise healthcare expenditures for both the affected person and society at large [14]. Furthermore, combating obesity is essential for improving the mental health of the public [15]. Research indicates that individuals who are overweight are more likely to develop psychological problems, such as anxiety and stress, compared to those with a healthy weight [16]. This phenomenon can be attributed to societal stigmatization faced by obese individuals, leading to low self-esteem and feelings of isolation [17]. Additionally, the lack of physical activity associated with obesity aggravates these mental health issues due to the crucial role of Endorphins released during exercise in maintaining positive mood states [18]. While conventional methods are available for weight loss, such as dieting and exercise, some individuals may prefer more natural approaches [19]. Fortunately, several natural products have demonstrated efficacy in treating obesity [20]. Quercetin is especially noteworthy among them, and it is known as 3,3,4,5,7-pentahydroxyflavone according to International Union of Pure Applied Chemistry (IUPAC). Several fruits and vegetables contain quercetin, a polyphenolic flavonoid that possesses multiple pharmacological properties. It has drawn much attention because of its potential as an anti-obesity agent [21]. Several studies have demonstrated quercetin's capability to efficiently suppress lipogenesis, which is the process of formation of fat cells in the body [22]. This lipogenesis is especially significant given the alarming rise in global obesity rates [23]. Targeting lipogenesis, quercetin offers a promising solution to combat excess weight gain and its associated health risks [24]. Quercetin appears to help prevent excessive fat storage through a dual mechanism. On one hand, it has been shown to inhibit fat production by down-regulating key transcription factors such as CCAAT/enhancer-binding protein(C/EBP)α and Peroxisome Proliferator-Activated Receptor (PPAR)γ that are essential for the differentiation of preadipocytes into fat-storing adipocytes. In several cell-based studies like 3T3-L1 adipocytes, quercetin treatment reduced the activity of enzymes like glycerol-3-phosphate dehydrogenase, which is a marker of lipid accumulation, and lowered the messenger RiboNucleicAcid (mRNA) expression of adipogenic markers, suggesting suppression of new fat formation. On the other hand, it can also promote fat breakdown by activating AMP-activated protein kinase (AMPK). It is a cellular energy sensor that limits lipogenesis. This dual action, reducing the formation of new fat cells and enhancing the breakdown of stored lipids, contributes to an overall anti-obesity effect. In an animal study, quercetin supplementation led to lower weight gain and reduced fat accumulation compared to control groups [25]. Researchers observed that the gene expression reduced related to lipid synthesis and the gene expression increased related to the breakdown of fatty acids [26]. These findings suggest that quercetin may prevent excessive fat storage by inhibiting fat production and promoting fat breakdown [27]. Additionally, a separate study investigated the impact of quercetin on individuals with metabolic syndrome, a condition often linked to obesity-related issues such as hypertension and insulin resistance [28]. Participants who received quercetin supplements experienced improvements in several metabolic parameters, including reduced waist circumference and decreased fasting glucose levels [29]. However, one challenge with quercetin is its low oral bioavailability. The therapeutic efficacy of quercetin is inhibited by its gastrointestinal instability, poor aqueous solubility and, minimal oral bioavailability, extensive first-pass metabolism. To lessen these limitations, recent studies relied on phytosome technology, which was discussed first, explains its role in enhancing drug delivery of a poorly water-soluble drug. A Phytosome is a formulation in which quercetin molecules are complexed with phospholipids, forming a lipid-compatible molecular complex that enhances water solubility and oral bioavailability of quercetin by up to 20 times compared to unformulated quercetin [30].
In the present work, quercetin-loaded phytosomes were initially formulated to enhance solubility and bioavailability by using the Rotary evaporation technique and it is optimized by box-behnken design using Quality By Design (QbD) initiative that incorporates the Design of Experiments (DoE) [31]. DoE uses a risk and science-based development strategy to specify the ideal qualities of a product and the control approach required to attain those qualities. DoE makes it possible to generate complex directions with few experimental runs by systematically changing the parameters and evaluating the effects of several variables at once. The QbD idea replaces conventional experimental pharmaceutical development with a risk-based methodology. The Physiochemical properties of the quercetin phytosomes were characterized and pharmacokinetics were investigated in rats [32].
In spite of its convenience, oral drug delivery is limited for many herbal medications because of their poor absorption and solubility [1]. To address these issues, new technologies are required to enhance its solubility and therapeutic efficacy [2]. Plant extracts are bound to phospholipids to produce phytosomes [3], which improve cellular uptake and shield natural compounds from gastrointestinal degradation while increasing their solubility, stability [4] and bioavailability [5-10]. Poor diet and a sedentary lifestyle are the main causes of obesity, a serious health problem that has been related to metabolic, psychological, and physical problems [11-20]. Certain natural substances, such as quercetin, a polyphenolic flavonoid present in a variety of fruits and vegetables, have demonstrated anti-obesity properties [21-24]. By activating AMP-activating protein kinase (AMPK), quercetin increases fat breakdown and prevents the synthesis of fat (lipogenesis) by activating downregulating important transcription factors (PPARγ, C/EBPα) [25]. Quercetin has been linked to better metabolic indicators, decreased weight gain, and decreased lipid buildup, according to studies [26].
Although quercetin has potential, its limited solubility and first-pass metabolism result in poor oral bioavailability [27, 28]. In order to get around this, quercetin-phospholipids complexes were made using phytosome technology, which increased its solubility and bioavailability by up to 20 times [29, 30].
In this work, rotatry evaporation was used to create quercetin-loaded phytosomes, and Box-Behnken Design (BBD) a Quality by Design (QbD) tool, was used to optimize the process [31]. Design of Experiments (DoE) uses a risk and science-based development strategy to specify the ideal qualities of a product and the control approach required to attain those qualities. DoE makes it possible to generate complex directions with few experimental runs by systematically changing the parameters and evaluating the effects of several variables at once. The QbD idea replaces conventional experimental pharmaceutical development with a risk-based methodology. The physico-chemical properties of the quercetin phytosomes were characterized and pharmacokinetics were investigated in rats [32].
MATERIALS AND METHODS
Materials
Quercetin was sourced from Sigma Aldrich Pvt Ltd, Bangalore, India, while L-α-phosphatidyl choline was acquired from Himedia Laboratories Pvt Ltd, Mumbai. Then, all additional substances and reagents used in this research were analytical and commercial grade. Mahaveer Enterprises of Malakajgiri, Telangana offered healthy Wister Albino rats weighing between 150 g to 200 g. The subjects were acclimatized to laboratory conditions, maintained at a temperature of 25±1 °C and a relative humidity of 50±15%, following a 12 h light-dark cycle. The rats were housed in standard polypropylene cages with unrestricted access to standard feed and water. Before the experiment, the rats fasted for 12 h while having access only to water. The experimental design was based on a BBD, incorporating three factors at three levels.
Methods
Preparation of quercetin phytosomes
Rotary evaporation was used to synthesize quercetin phytosomes. In a 250 ml round bottom flask coupled to a rotary evaporator, carefully weighed amounts of quercetin and L-α phosphatidylcholine [1%w/w, 2%w/w, 3%w/w] were dissolved in 30 ml of tetrahydrofuran. The mixture was then rotated at a temperature of 40 °C/50 °C/60 °C [33, 34] for 1.5, 2.5, or 3.5 h, based on the BBD, as illustrated in table 1. A thin film was generated from the sample, which was subsequently mixed with n-hexane and stirred continuously using a magnetic stirrer. The resulting precipitate was collected, dried under vacuum, and stored in an airtight container at a temperature between 2-8 °C.
Table 1: Independent and dependent variables studied during formulation of quercetin loaded phytosomes using BBD DoE)) factors at three levels regions
| Box-behnken design (BBD) | Codes | Levels |
| Independent | Factor | -1 |
| Phospholipid concentration (%w/w) (L-α phosphatidyl choline) | A | 1.0 |
| Temperature (degree Celsius) | B | 40 |
| Time (in hours) | C | 1.5 |
| Dependent variables | R1 | Entrapment efficiency (%) |
| Dependent variables | R2 | Percentage yield (%) |
Optimization of the quercetin phytosome by box-behnken design (BBD)
The Design Expert program was used to optimize the formulation of quercetin phytosomes. The factorial, three-level Box-Behnken Design (BBD) was used in this investigation [35, 36]. Table 2 displays the experimental design, which included three independent factors (phospholipid content, mixing temperature, and mixing time) and measured responses (Dependent variables; R1 Entrapment efficiency (EE). R2 Percentage Yield (PY)). Design Expert® from Stat-ease Inc., Minneapolis, was used to create three-dimensional and two-dimensional models (3D, 2D Models), as well as quadratic equations. The resultant quadratic polynomial equation is shown below:
Y=XO+X1A+X2B+X3C+X12AB+X13AC+X23BC+X11A2+X22B2+X33C2. (1)
Where y is the response (EE,PY)) at each factor combination level, XO serves as the intercept, while to are regression coefficients derived from the experimental response values of Y. The variables A, B, and C, along with their interaction terms (AB, AC, BC) and quadratic terms (A², B², C²), represent the combined interactive effects of two factors on the observed responses.
Table 2: Box-behnken design layout with experimental values of response variables of quercetin-loaded phytosomes [Batch1-17]
| Bbd run | Factor A phospholipids (%W/W) |
Factor B temperature (Degree celsius) |
Factor C time (Hour) |
Response (R1)(EE) | Response (R2) (PY) |
| FI | 1 | 60 | 2.5 | 84.48 | 82.01 |
| F2 | 2 | 60 | 3.5 | 85.36 | 84.35 |
| F3 | 2 | 50 | 2.5 | 85.51 | 85.12 |
| F4 | 1 | 50 | 1.5 | 85.73 | 86.54 |
| F5 | 2 | 50 | 2.5 | 86.48 | 85.19 |
| F6 | 2 | 40 | 1.5 | 85.27 | 84.28 |
| F7 | 3 | 50 | 3.5 | 86.53 | 86.17 |
| F8 | 2 | 60 | 1.5 | 85.53 | 85.34 |
| F9 | 1 | 40 | 2.5 | 86.48 | 86.46 |
| F10 | 1 | 50 | 3.5 | 88.59 | 87.56 |
| F11 | 3 | 60 | 2.5 | 85.89 | 85.67 |
| F12 | 2 | 50 | 2.5 | 87.41 | 87.17 |
| F13 | 2 | 40 | 3.5 | 88.26 | 88.06 |
| F14 | 2 | 50 | 2.5 | 86.53 | 86.14 |
| F15 | 3 | 50 | 1.5 | 87.41 | 87.17 |
| F16 | 2 | 50 | 2.5 | 85.46 | 85.16 |
| F17 | 3 | 50 | 2.5 | 86.57 | 86.16 |
Fitness and analysis of response model
The optimal model for analyzing the response variable was selected based on sequential p-values and lack-of-fit p-values for linear, 2-factor Interaction (2-FI), quadratic, and cubic models. An analysis of variance was conducted to determine the p-values for independent parameters. Contour and response surface plots were generated to visually represent the relationship between independent and response variables. The quadratic polynomial equation needed for statistical validation was obtained through Analysis of Variance (ANOVA). To identify the optimal composition within the experimental range, 2D and 3D response surface models were employed. These models were used to assess and confirm the statistically significant coefficients and R-squared values from triplicate center points across seventeen experimental runs.
Characterization
Optimized batches of quercetin phytosomes were actually analysed for compatibility, Particle Size (PS), and Zeta Potential (ZP) using Fourier Transform Infra-Red (FTIR), Differential Scanning Calorimetry (DSC), Zeta potential and Particle Size (PS), X-Ray Diffraction (XRD), Nuclear Magnetic Resonance (NMR), Transmission Electron Microscopy (TEM). Additionally, the batches were assessed for Percentage Yield (PY) and Entrapment Effeciency (EE) in order to optimally synthesise quercetin phytosomes [37, 38].
Fourier transform infrared (FTIR) analysis
For the FTIR analysis [39, 40] of the optimized quercetin phytosome formulations, an FTIR instrument (Model: IFS 25, Bruker, Germany) with software-controlled data processing was used. The optimized formulation was individually mixed with Infra-Red-grade Potassium Bromide (KBr) at a 1:100 ratio and compressed into pellets. The pellet samples were analyzed in triplicate, using plain KBr pellets as the blank reference. Infrared transmission data were recorded over a wave number range of 4500 cm⁻¹ to 500 cm⁻¹ at a resolution of 2 cm⁻¹. The functional groups in the sample were identified by comparing the obtained spectral data with a reference spectrum.
Differential scanning calorimetry (DSC) studies
For the DSC studies, [41] the thermograms of the optimized quercetin phytosome formulations were obtained using a Shimadzu DSC-60. The analysis was performed with aluminum pans, and dry samples weighing 2.00 to 10.00±5 mg were precisely measured and then sealed in aluminum containers. The samples were heated at a rate of 10 °C per minute within a temperature range of 30 °C to 360 °C, with nitrogen flowing at a rate of 40 ml/min to maintain optimal conditions. The quercetin samples were individually placed on metal supports for electron expansion and coated with gold through particle sputtering [42]. Subsequently, the preparations were scanned, and digital images were captured to examine any irregularities in strain at various magnifications.
Particle size (PS) and zeta potential
A key aspect of phytosome research that provides valuable insights into the quality and various forms of a sample is the evaluation of particle size and shape. The optimized phytosomes were characterized for both PS and Zeta Potential. Particle size was measured using the Dynamic Light Scattering (DLS) technique with a particle size analyzer (SZ-100 Nano Particle Analyzer). The Polydispersity index (PDI) is a crucial parameter in nanoparticle and colloidal systems, calculated by using the following formula.
 (2)
(2)
The surface charge of the optimized phytosomes was analyzed through photon correlation spectroscopy [43] using a ZS-90 Zetasizer (Malvern Instruments, UK), also utilizing the Dynamic Light Scattering (DLS) method. The sample was diluted with distilled water and sonicated for 5 min. Measurements were conducted in a 0.1 N KCl aqueous solution at 25 °C with a detection angle of 90°. Each analysis was repeated three times, and the values were adjusted to a standard reference temperature of 25 °C.
X-ray diffraction (XRD) analysis
XRD analysis is a non-destructive technique that offers detailed information about the crystallographic structure, chemical composition, and physical properties of a material [44]. The powder XRD pattern of the optimized phytosome was recorded using a Shimadzu XRD-7000 diffractometer with a Cu-Kα radiation source operating at 40 kV. The diffraction data were collected across a scan range from 10.000° to 80.000°. The experiment employed Bragg-Brentano geometry with a 2θ scan rate of 0.020°/min at room temperature. The crystalline properties of the phytosome were analyzed using Origin Lab Software and the Crystallinity Index (CI) was calculated by using the following formula.
 … (3)
… (3)
Nuclear magnetic resonance (NMR)
NMR is a flexible analytical method that provides detailed structural information about both organic and inorganic molecules. In NMR, magnetic nuclei of certain isotopes are aligned by a strong external magnetic field and exposed to electromagnetic radiation at a specific frequency. The principle behind NMR is that certain nuclei occupy distinct spin states when exposed to an external magnetic field. This study utilized proton NMR, which focuses on hydrogen-1 nuclei within a molecule to determine its structure [45]. The sample was placed in a thin-walled glass vial and positioned inside an electronic coil, which was housed within a powerful magnet at the core of the NMR spectrometer (Model: Varian 400 MHz NMR system). The magnet aligns the atomic nuclei within the sample, creating a consistent resting orientation.
Transmission electron microscope (TEM)
TEM is a commonly employed method for observing phytosomes. For TEM analysis, a drop of the suspension was applied to a carbon-coated 400 mesh copper grid. The excess water was gently removed by blotting the grid with filter paper, and the sample was then stained with a 2% (w/v) phosphotungstic acid solution for 20 min [46]. Following staining, the sample was allowed to air-dry. The morphology of the phytosomes was observed with a transmission electron microscope (Model: JEM-F200Kv), and images were captured using the TEM.
Evaluation of response variables of quercetin phytosomes
Determination of entrapment efficiency (EE)
EE was evaluated through the use of the ultracentrifugation method. A precisely weighed amount of the phytosome complex (10 mg) was dissolved and diluted in methanol. The solution was subsequently ultra-centrifuged at 15,000 rpm for 15 min at room temperature, and the supernatants were left undisturbed for 20 min [47]. The quercetin concentration in the solution was assessed by measuring absorbance at 370 nanometers with a Ultra Violet (UV)-visible spectrophotometer. The EE was calculated by determining the amount of quercetin in the total yield. The percentage of entrapment efficiency was calculated using the formula provided below.
 . (4)
. (4)
Percentage yield (PY)
The PY was calculated as the weight fraction of the phytosome complexes relative to the initial total mass or weight of quercetin and L-α-phosphatidylcholine [48]. The resulting phytosome complexes were drained in a desiccator and then measured weight to determine the final quantity [49]. The PY was computed using the formula provided below.
 . (5)
. (5)
In vitro drug release studies
In vitro drug release studies of quercetin phytosome and free quercetin powder are conducted using the USP-I Dissolution apparatus. Simulated gastric fluid (at pH 1.2) and Phosphate buffer (at pH 6.8) were used as dissolution medium. Samples collected at 0,15,30,60,120,240,480 min. Quantification of drug release was done at 256 nm by using a UV-Vis spectrophotometer.
Stability study
Stability testing is essential for assessing how the quality of a drug substance or product is affected over time by environmental factors like temperature, humidity, and light. This evaluation is crucial for determining the retest period of the drug substance, the shelf life of the drug product, and the optimal storage conditions. The formulated products were stored for two months at 40±2 °C in a stability chamber and at 4.0±1 °C in a refrigerator to assess their stability. Both chemical aspects, including entrapment efficiency and drug content, and physical attributes, such as consistency, phase separation, and clog formation, were evaluated. The stability assessment of the optimized formulation adhered to the guidelines established by the International Conference on Harmonization (ICH).
In vivo experimental procedure
The study received approval from the Institutional Animal Ethical Committee (IAEC) under project proposal number 009/IAEC/NCPA/PhD21-22 and employed an anti-hyperlipidemic model induced by a cholesterol-rich diet. Wistar Albino rats, which weigh between 150 g to 200 g, were used as the subjects and acclimatized to the laboratory at temperature (25±1) C, relative humidity (50±15)%, 12 h light-dark cycles, kept in standard polypropylene cages and given standard diet and water ad-libitum the treatment period was extended for 21 d. The high-cholesterol diet pellets consisted of ingredients such as maize, soybean pulp (okara), sunflower seed, Bonquality bread flour, alfalfa pellets (lucerne), molasses (maple syrup), meat and bone meal, poultry meal, sepiolite (meerschaum), inorganic dicalcium phosphate (DCP), vitamins, minerals, and cholesterol. The dose for the study was determined to be 500 mg per kg body weight based on data from acute toxicity studies.
Drug protocol for the study
After a week of acclimatization, the animals were categorized into four groups: control, toxic, standard, and test, which included quercetin pure drug and quercetin phytosome formulations [51]. Each group had six animals. The first group was administered normal saline orally, while the second group was given a standard cholesterol diet combined with Atorvastatin (10 mg/kg of body weight) [52], and the third group received only a cholesterol diet. In the fourth group, animals received a cholesterol diet combined with pure Quercetin at a dosage of 500 milligrams/kg of body weight, while the fifth group was provided with a cholesterol diet al. ong with Quercetin phytosomes at a dosage of 100 milligrams/kg of body weight [53]. The treatment period lasted 20 d, during which the average weight of the animals was regularly monitored. On the 21st day, blood samples of rats were collected from arterial lesions to assess serum levels of Total cholesterol (TC), Tri Glycerides (TG), High-Density Lipoprotein (HDL), and Low-Density Lipoprotein (LDL) Very Low-Density Lipoproteins (VLDL)
After the study, rats were anesthetized using ether to allow for blood collection through cardiac puncture. The blood was then placed in heparinized tubes, and the serum was separated for analysis. The serum samples were thoroughly mixed and incubated at 4 °C for 2-3 h [54]. Plasma was isolated by centrifuging at 2500 rpm for 30 min, divided into aliquots, and kept at 4 °C for later analysis. The evaluation focused on obtaining fresh, clear, and non-hemolyzed serum. Serum TC, TG, and HDL cholesterol levels were measured using kits from Beacon Diagnostic Pvt Ltd. Triglyceride levels were determined using a diagnostic kit that employed an enzymatic test with glycerol-3-phosphate oxidase for calorimetric endpoint detection[55]. A triglyceride solution with a concentration of 200 mg/dl was used as a standard. Absorbance was measured at 505 nanometres against a reagent blank with a 1 cm optical path length. The serum triglyceride levels were calculated by comparing the absorbance of the test sample with that of the standard. For total serum cholesterol estimation, Friedwald’s formula was applied to calculate serum LDL and VLDL levels.
RESULTS AND DISCUSSION
Design analysis
Throughout the design of tests for the three-level responses, the observed response ranges (R1:EE) for seventeen batches ranged from 84.48 to 88.59%, while (R2:PY) ranged from 82.01 to 88.06%. Table 3 displays the optimized formula for both responses. In addition to statistically significant term coefficients, the table shows the best-fitting model R-square values, which are 0.996 for response R1 and 0.992 for response R2. The collected data were analyzed using Design Expert software, applying first-order, second-order, and quadratic models for comparison. From the analysis, it was found that a p-value>0.05 indicates the lack of fit is non-significant. This is a good sign indicates the model adequately fits well and this model is appropriate.
Table 3: Quadratic model polynomial equation and R-square value of response 1[R1] Entrapment efficiency (EE), response 2 [R2] percentage yield (PY)
| Quadratic model | R2 | Adjusted R2 | Predicted R2 | SD | %CV |
| Response 1 | 0.996 | 0.65 | 0.48 | 0.64 | 0.75 |
| Response 2 | 0.992 | 0.68 | -0.58 | 0.80 | 0.94 |
| Response surface model(RSM) | 2nd order polynomial equation | ||||
| R1= 86.28+0.039A-0.554B+0.6C+0.55AB-0.93AC-0.79BC+0.168A2-0.81B2+0.62C2 | |||||
| R2= 85.78+0.0087A-0.59B+0.35C+1.70AB-0.50AC-1.19BC+0.023A2-1.413B2+1.08C2 |
Models (RSM; 2 and 3-D displays) and equation analysis
Two (fig. 1, fig. 2), three-dimensional plots (fig. 3), and overlay plots (fig. 4) are used statistically to examine the interaction effect of their two factorial combinations on the responses at one time, both separately and simultaneously. The positive and negative terms in the 2nd-order polynomial equation indicated direct and inverse relationships between the factors and the responses [56]. Additionally, the quadratic equation was used to demonstrate the interaction between the independent variables and the responses. The variables A, B, and C represent lipid concentration (L-α phosphatidylcholine), temperature, and time, respectively, while R1 and R2 refer to entrapment efficiency and percentage yield. The quadratic equation (table 3) highlighted the significant effects of A, B, C, AB, AC, BC, A², B², and C², with strong model terms. The correlation coefficients (R²) were 0.996 for response 1 and 0.992 for response 2, indicating an excellent fit. Furthermore, the a lack of fit values (0.9206 for R1 and 06699 for R2). Observing predicted and adjusted values as shown in table 3 ensures constant variance and shows a random scatter with no clear pattern, indicating that this model is valid.
The optimized quercetin phytosomes produced using the rotary evaporation method and they were assessed for their percentage yield, particle size, entrapment efficiency in order to identify the optimal formulation.
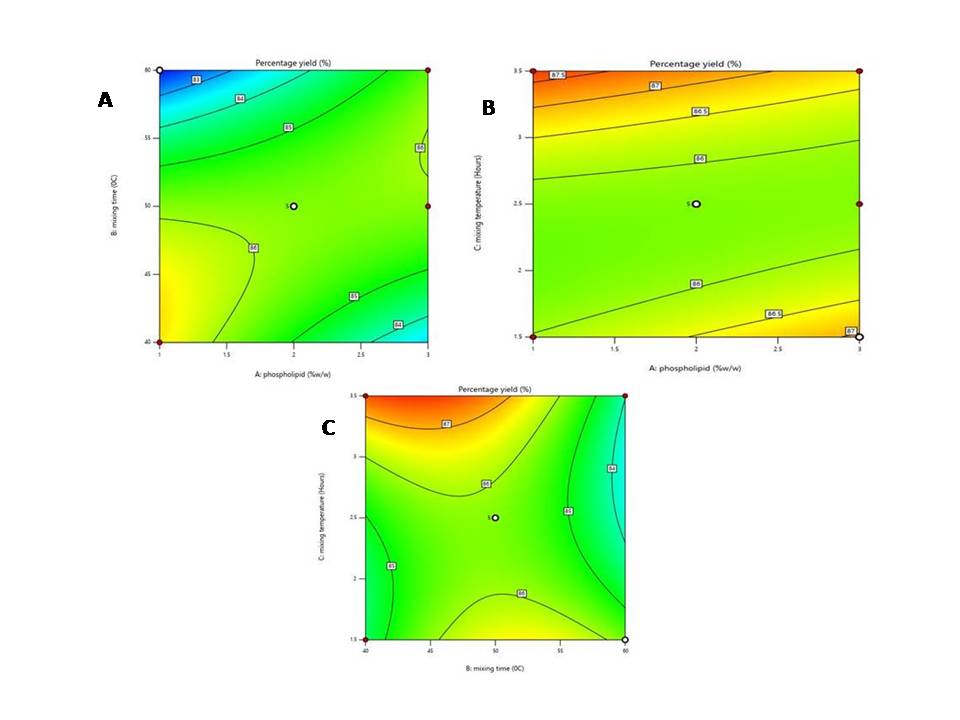
Fig. 1: Two-dimensional response surface plots showing the effect of independent variables such as phospholipid concentration (mg) (L-α phosphatidyl choline) (A), mixing temperature (C) (B) and mixing time (Hours) (C) on % entrapment efficiency (R1). Image a representing BC Plot (mixing time and mixing temperature), b representing AC Plot (L-α phosphatidyl choline, mixing time), c representing AB Plot (L-α phosphatidyl choline, mixing temperature)
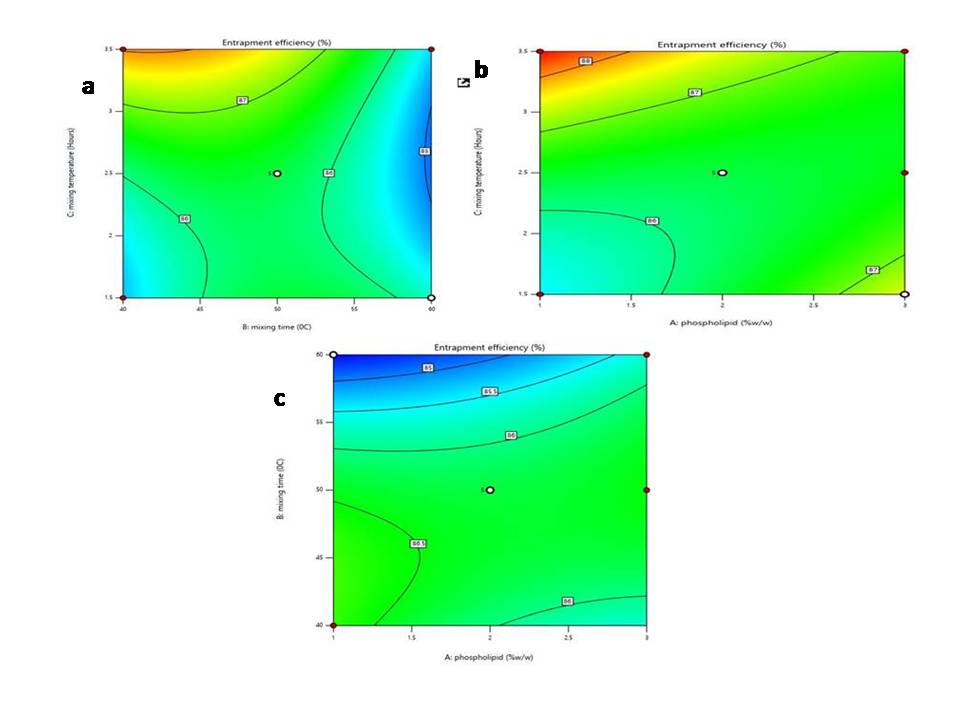
Fig. 2: Two dimensional response surface plots showing the effect of independent variables such as phospholipid concentration (mg) (L-α phosphatidyl choline) (A), mixing temperature (C) (B) and mixing time (Hours) (C) percentage yield (R2). Image A representing representing AB Plot (L-α phosphatidyl choline, mixing temperature), B representing AC Plot (L-α phosphatidyl choline, mixing time), C representingBC Plot (mixing time and mixing temperature)
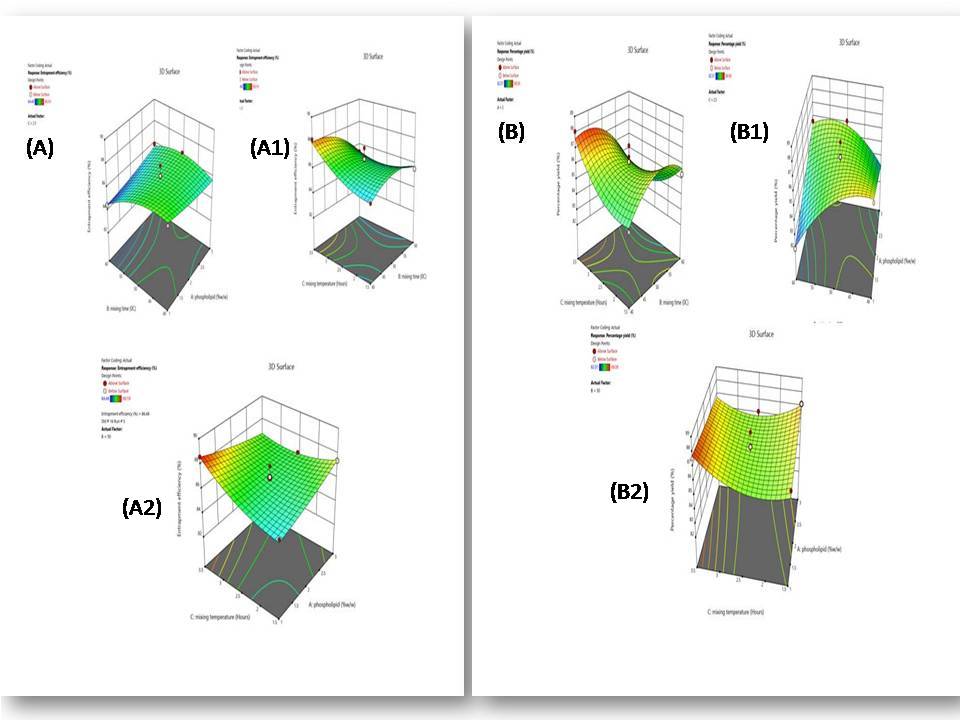
Fig. 3: Three dimensional 3D-response surface plots showing the effect of independent variables such as phospholipids concentration (mg) (L-α phosphatidyl choline) (A), mixing temperature (C) (B) mixing time (Hours) (C) on Percentage entrapment efficiency (R1) and percentage yield (R2) respectively. Image(A) Represents the AB, plotted between L-α phosphatidyl choline, mixing time, A1 Represents BC, Plotted between mixing temperature and mixing time, A2 Represents AC, plotted between L-α phosphatidyl choline and mixing time. Image (B) Represents the AB Plot,(BI) Represents BC,(B2) Represents AC
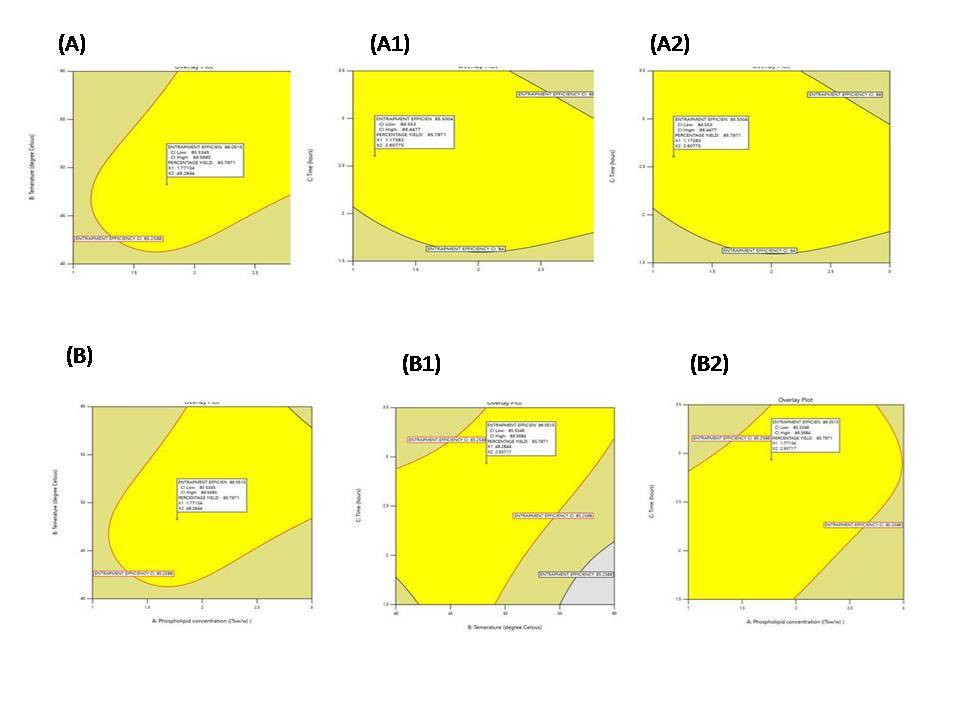
Fig. 4: Overlay plot (where the design space is highlighted in yellow) of entrapment efficiency [R1], percentage yield [R2] depicting predicted optimized values of dependent and independent variables (in square box) of optimized phytosome. here (A) phospholipids concentration (mg) (L-α phosphatidylcholine), (B) Mixing temperature (C), and (C) Mixing time (Hours), Image(A) Represents the AB, plotted between L-α phosphatidylcholine, mixing time, A1 Represents BC, Plotted between mixing temperature and mixing time, A2 Represents AC, plotted between L-α phosphatidylcholine and mixing time. Image (B) Represents the AB Plot,(BI) Represents BC,(B2) represents AC
FTIR study of optimized quercetin phytosome
The FTIR spectrum of the optimized Quercetin phytosome composition was analyzed to identify characteristic functional group shifts and determine the nature of molecular interactions and it is depicted in fig. 5. The spectrum of phospholipids exhibited characteristic absorption bands at 3000-3500 cm-1, corresponding to-OH or N-H stretching vibrations. Peaks in the 2800-3000 cm-1 range were attributed to C-H stretching, while the 1600-1800 cm-1 region represented the C=O stretching of ester groups. Quercetin showed strong absorption in the 3200-3500 cm-1 range, attributed to O-H stretching, indicating intermolecular hydrogen bonding. Additionally, peaks at 1600 cm-1 and 1500 cm-1 corresponded to aromatic C=C stretching, while the 1650-1750 cm-1 band was assigned to C=O stretching vibrations. The O-H stretching band shifted from 3400 cm-1 to a lower wavenumber (3200 cm-1), suggesting the formation of hydrogen bonds between quercetin and phospholipids. A shift in C=O stretching (1650 cm-1) to lower wavenumbers further indicates hydrogen bonding interactions [57]. No significant changes in the C-H stretching region (2800-3000 cm-1) suggest that van der Waals interactions are minimal compared to hydrogen bonding. The quercetin-phytosome complex's observed redshift in O-H and C=O stretching vibrations reveals a strong hydrogen connection between the phospholipids and the hydroxyl/carbonyl groups of quercetin. In the phytosome formulation, this interaction probably improves quercetin's stability and solubility. Vander Waals forces appear to be a minimal factor in molecular interactions within the complex, as evidenced by the lack of significant shifts in the C-H region.
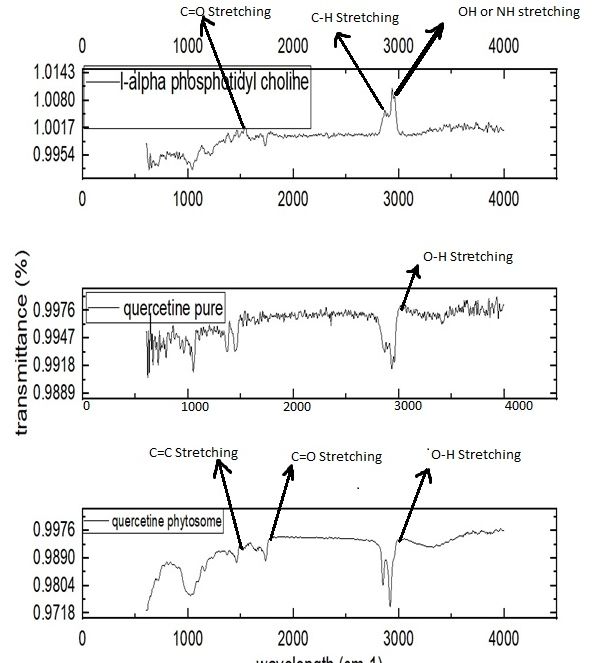
Fig. 5: The FTIR spectrum of the L-Alpha phosphatidylcholine, pure quercetin and optimized quercetin phytosome showing distinct absorption peaks
Differential scanning calorimetry (DSC) study of optimized phytosomes
DSC is a widely used analytical method for studying the thermal behavior of materials [58], offering insights into phase transitions, thermal stability, heat capacity, and other thermodynamic properties. DSC studies have documented notable shifts in the endothermic peaks of quercetin when it forms complexes with other molecules, such as phospholipid. These shifts are indicative of interactions that alter the thermal behavior of the compound. This was incorporated with reference DSC data from the literature for comparing both quercetin and its phytosomal complex. In the DSC thermogram of quercetin, endothermic peaks were observed at 155.22 °C and 189.22 °C, as shown in fig. 6(c). The DSC analysis of the phytosome complex revealed endothermic peaks at 198.29 °C and 274.75 °C, as depicted in fig. 6(a), with fig. 6(b) providing a comparative thermogram of pure quercetin and the quercetin-phytosome complex. This significant shift in the melting point of quercetin, decreased crystallinity and enthalpic changes serves as a strong indicator of amorphization and enhanced solubility. The quercetin thermogram displayed a smaller area under the curve compared to the phytosome complex [59], likely due to the melting behavior of the fat components and their interaction with the quercetin. This serves as evidence of the interaction between the components in the binary systems, indicating the formation of an inclusion complex and drug amorphization.
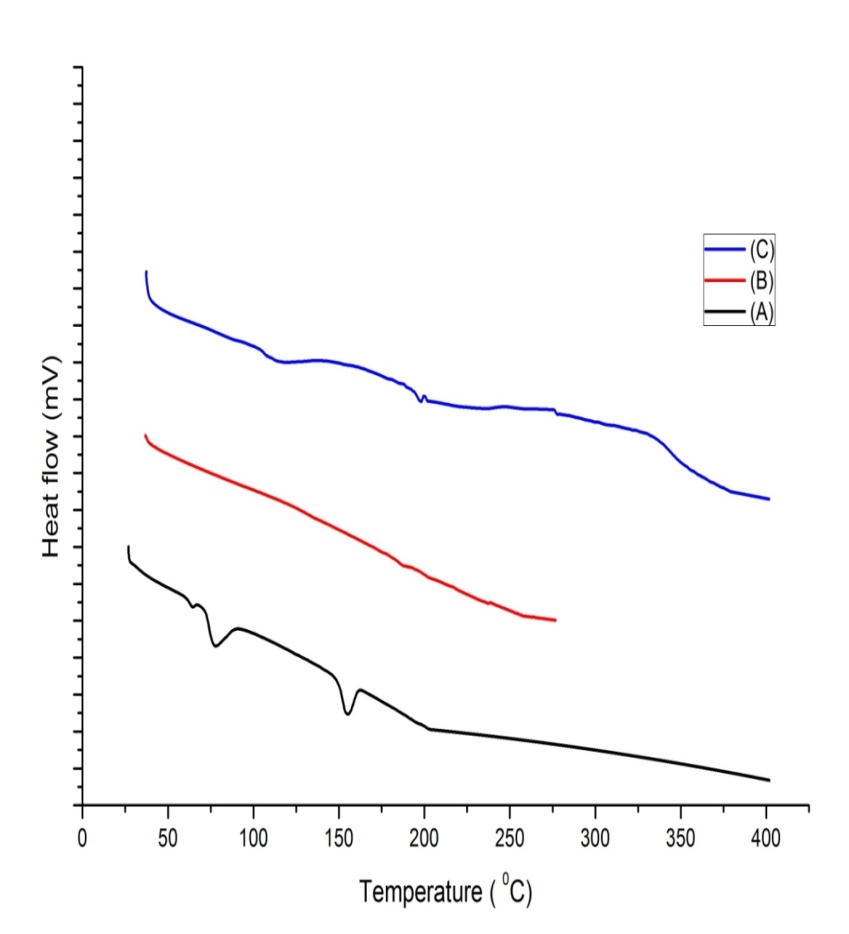
Fig. 6: DSC graph showing endotherms of (a) Quercetin, (b) L-α phosphatidyl choline, (c) Quercetin phytosome
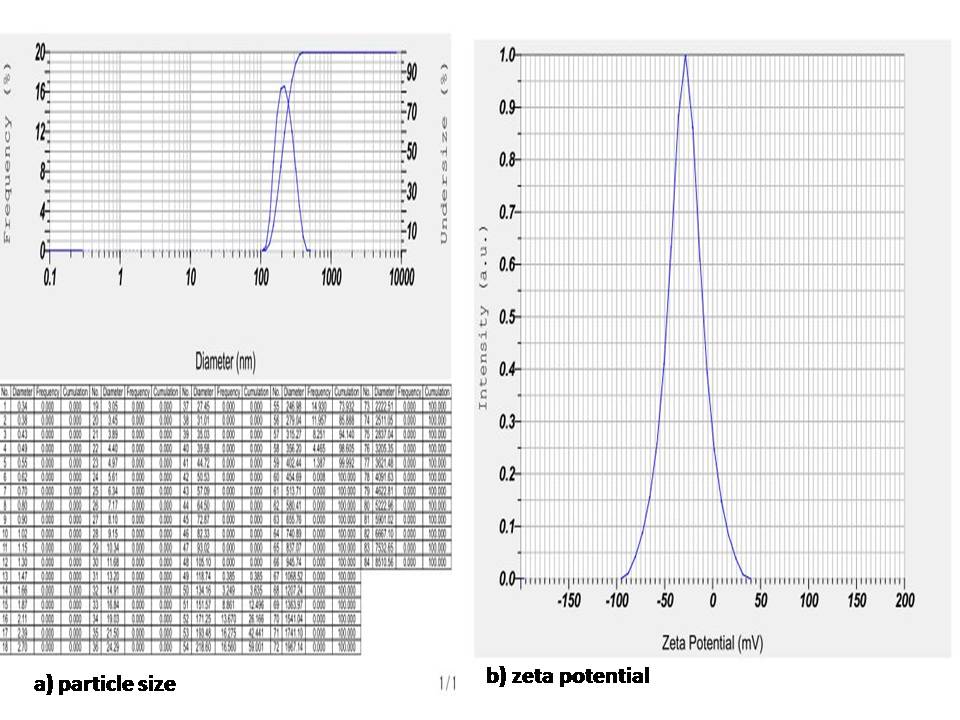
Fig. 7: Shows a) PS of optimized phytosome b) zeta potential of optimized phytosome
Particle size (PS) and zeta potential of optimized phytosome
The optimised phytosome PS were consistent, with a narrow size dispersion and an average median of 204.6 nm. Polydispersity index (PDI) was calculated with Z-average of 143.35 nm, mean of 213.7 nm and is found to be 0.45 indicates a more uniform distribution, improving stability and performance.
The surface charge of nanoparticle systems can be assessed by measuring the phytosome's zeta potential [60]. The zeta potential of quercetin phytosomes was determined with a ZS-90 Zetasizer (Malvern Instruments, UK). Phytosomes with a zeta potential exceeding-30 mV are considered stable, as the electrical repulsions prevent particle aggregation, according to reports. In this investigation, it was determined that the zeta potential of the optimised formulation is-28.6mV, as illustrated in fig. 7.
Powder X-ray diffractometry (XRD)
Fig. 8 shows the XRD of an optimized phytosome. The phytosome's diffraction pattern showed intense and crisp crystalline peaks at 2θ of 20.20000, 18.22000, and 19.62000. Quercetin pure showed peaks at 27.800, 19.030, and 22.210. L-α-phosphatidyl choline showed peaks at 19.74000, 18.80000, and 20.44000. The signals shown in fig. 10 are characteristic of quercetin phytosomes, pure quercetin, and L-α-phosphatidyl choline. Thus, the obtained data for quercetin phytosomes, pure quercetin, and L-α-phosphatidyl choline have a good correlation with thermophysical investigations, and quercetin may be molecularly dispersed in L-α-phosphatidyl choline, and they exist in an amorphous form.
Crystallinity index (CI) of phytosome was found to be 16.8% indicates more amorphous nature that can able to improve bioavailability. For pure quercetin CI is 86.7% indicates more crystalline nature.
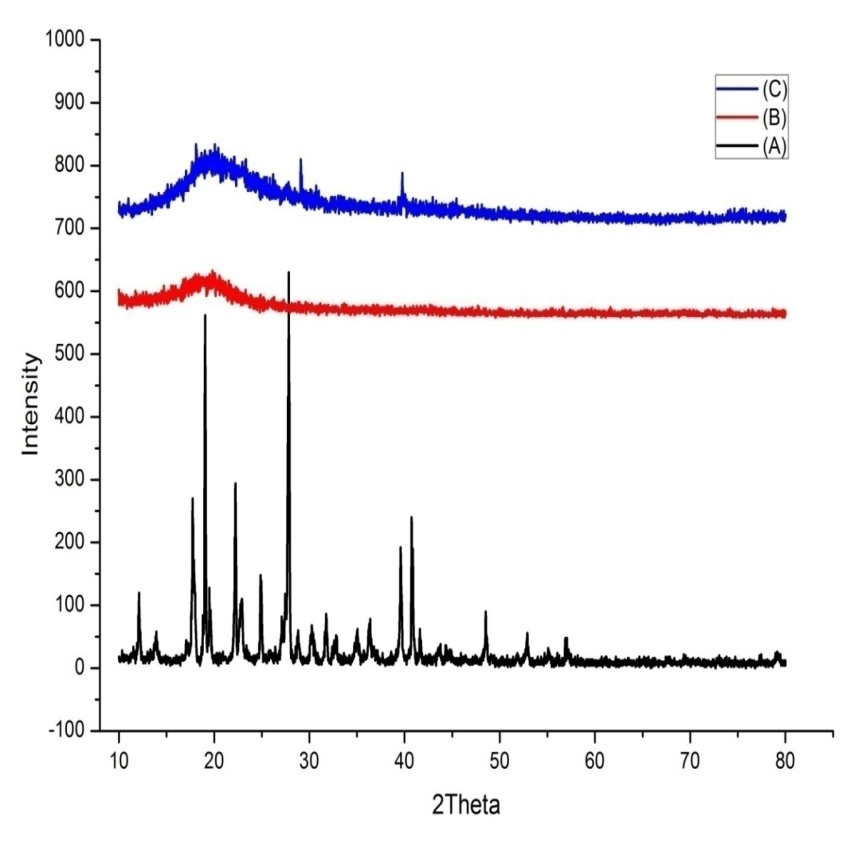
Fig. 8: XRD patterns of (A). Pure quercetin (B). L-α-phosphatidyl choline (C). Quercetin phytosome
Nuclear magnetic resonance (NMR) study of optimized phytosome
Interpreting the NMR spectrum of quercetin phytosomes requires understanding both the structure of quercetin and the characteristics of the phytosome complex. The presence of phospholipids in the quercetin phytosome might slightly shift the chemical shifts of quercetin. The results of NMR spectra of quercetin phytosome, L-α phosphatidylcholine, and quercetin pure were shown in fig. 9. The NMR spectra of the compound entitled quercetin phytosome exhibit 21 distinct proton environments with chemical shifts ranging from 2.3 to 6.2 and the integration of the peaks range from 0.3-3.0 matching the expected hydrogen distribution the splitting patterns that are observed in different regions confirm the presence of hydrogen bonds of the protons The NMR spectra of the L-alpha phosphatidylcholine exhibits 12 distinct proton environments with a chemical shift of range 0-5.3 and integration within 0.9-11 this compound exhibits 1:2 ratio of doublet and singlet splitting confirming the presence of hydrogen bonds on adjacent sides. Quercetin pure has specific functional groups that will give distinct signals in the NMR spectrum. The NMR spectra of the compound quercetin pure exhibit 9 proton environments with chemical shifts ranging from 1.0-2.4and the integration peaks are observed from the 3.0-6.2 range a singlet splitting pattern was observed near every peak, confirming the presence of hydrogen bonds [61]. When quercetin interacts with L-α phosphatidylcholine to form a phytosome, its protons and carbon atoms undergo changes in their electronic environment, which is echoed as shifts in the chemical shift of the NMR spectra. These shits indicate that quercetin is not free but is allianced with the L-α phosphatidylcholine confirming complex formation. The shifts observed in NMR spectra, particularly in the aromatic and hydroxyl regions of quercetin confirm its interaction with the phospholipid bilayer [L-α phosphatidyl choline]. The NMR data provides molecular-level proof of encapsulation, leading to the formation of a stable phytosome. This interaction increases the bioavailability of quercetin.
Transmission electron microscopy (TEM) of optimized phytosomes
Transmission electron microscopy (TEM), which also uses an electron beam to interact with the extremely fine sample, can provide the most precise and high resolution imaging data on the size, shape, morphology, state of aggregation, and distribution of nanoparticles at nanometre resolution. Fig. 10 shows the TEM pictures of an optimised phytosome. The TEM investigation showed that the phytosomes had a spherical shape with a uniform size in the nanometre range and no aggregation [62].
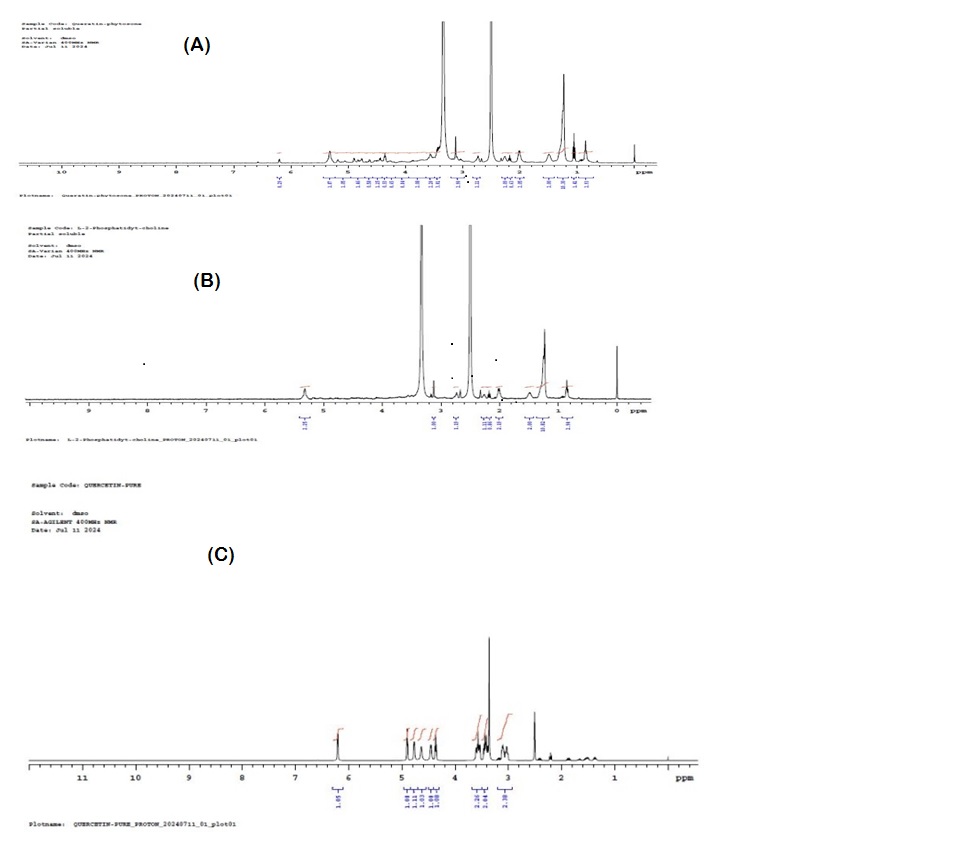
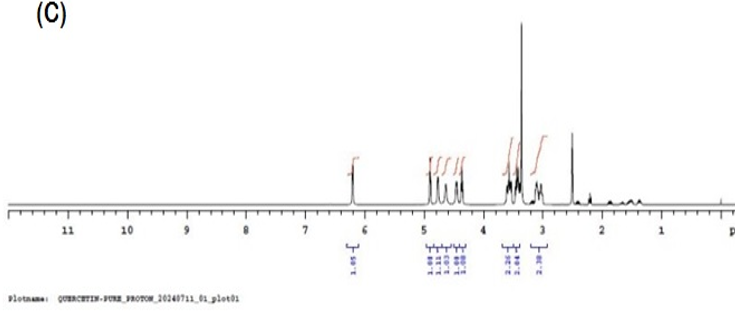
Fig. 9: Depicted nuclear magnetic resonance of (A) optimized Quercetin phytosome (B) L-α phosphatidylcholine (C) Quercetin pure
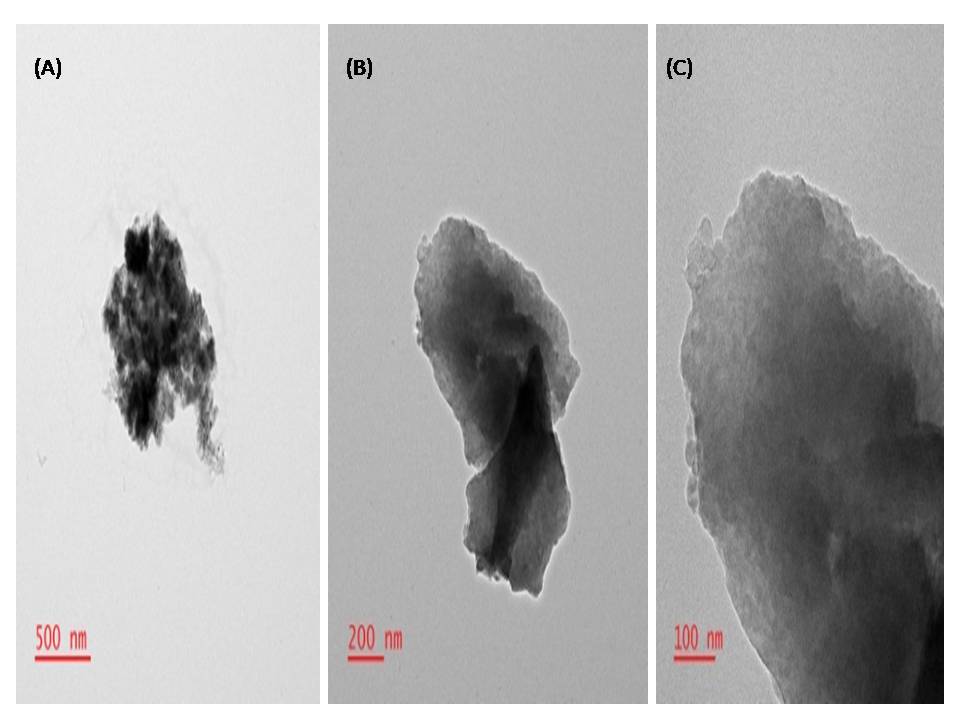
Fig. 10: Transmission electron micrographs of quercetin phytosomes at different scale bars. Image (A) with particle size of 500 nm, (B) with particle size of 200 nm, (c) with particle size of 100 nm
Evaluation of entrapment efficiency (EE) and percentage yield (PY)
The quadratic model was chosen for EE (R1) as it demonstrated the highest R² value of 0.996 with the equation of line y=0.0101x+0.0076. The limit of detection [LOD] was found to be 1.63μM and the Limit of quantification was found to be 4.95μM. The quadratic Equation for EE, derived from multiple regression analysis, is presented in Equation 4.
The quadratic model was chosen for percentage yield (R2) because it exhibited the highest R² value of 0.992. Indicate an excellent fit of the model to the experimental data; over 99% of the variability in the response variables can be explained by the selected model. The quadratic Equation for percentage yield is shown in Equation 5.
The entrapment efficiency and percentage yield of different batches of formulations are listed in table 2, the maximum entrapment efficiency was 88.59%, and the minimum was 84.48%. Phytosomes showed a good percentage yield as shown in table 2, which might be an essential aspect for enhancing drug delivery with 88.06% as the maximum suggested optimized condition for formulation and 82.01% as the minimum value highlight process variability. These values gave valuable insights into formulation robustness and reproducibility, which are essential for drug delivery optimization.
Table 2: Box-behnken design layout with experimental values of response variables of quercetin-loaded phytosomes [Batch1-17]
Bbd run |
Factor A phospholipids (%W/W) |
Factor B temperature (Degree celsius) |
Factor C time (H) |
Response (R1) entrapment efficiency (EE) | Response (R2) percentage yield (PY) |
| FI | 1 | 60 | 2.5 | 84.48 | 82.01 |
| F2 | 2 | 60 | 3.5 | 85.36 | 84.35 |
| F3 | 2 | 50 | 2.5 | 85.51 | 85.12 |
| F4 | 1 | 50 | 1.5 | 85.73 | 86.54 |
| F5 | 2 | 50 | 2.5 | 86.48 | 85.19 |
| F6 | 2 | 40 | 1.5 | 85.27 | 84.28 |
| F7 | 3 | 50 | 3.5 | 86.53 | 86.17 |
| F8 | 2 | 60 | 1.5 | 85.53 | 85.34 |
| F9 | 1 | 40 | 2.5 | 86.48 | 86.46 |
| F10 | 1 | 50 | 3.5 | 88.59 | 87.56 |
| F11 | 3 | 60 | 2.5 | 85.89 | 85.67 |
| F12 | 2 | 50 | 2.5 | 87.41 | 87.17 |
In vitro dissolution studies
Quercetin showed significantly higher release compared to free quercetin. The %drug release at different time intervals is as follows. At 15 min quercetin phytosome (QP) shows 28.3±2.2% where, as free quercetin (FQ) shows 10.1±1.2%, at 30 min 45.8±2.6 (QP), 18.5±2.1(FQ), at 60 min 68.2±3.1(QP), 30.2±2.6(FQ), at 120 min 85.6±3.6(QP), 42.6±3.1(FQ), at 240 min 93.1±4.6 (QP),55.5±3.6(FQ), at 480 min 98.1±6.59(), 68.6±7.6(FQ) respectively indicating its potential for improved oral bioavailability [63].
Accelerated stability studies
The produced formulations were kept for two months at 40±200c in a stability testing chamber and 4.0±100c in a refrigerator to assess their stability. Their physical and chemical characteristics, such as phase separation, clog presence and consistency, content of drug and entrapment were assessed. There was not a noticeable modification in the formula for the parameters listed above.
In vivo animal studies
The animals were categorized into five groups, each group consisting of six subjects. Group I is known as the control, while Group II is known as the cholesterol-induced toxicity group. Group III received a standard drug, atorvastatin, at a dosage of 10 milligrams/kg body weight. Group IV was treated with pure quercetin at 500 mg/kg body weight, and Group V received the quercetin phytosome formulation at a dose of 100 milligrams/kg body weight [64]. The animals in the toxic, standard, and test groups were fed a cholesterol-rich diet for 21 d along with their respective drugs. The average body weight of all selected animals was measured every 5 d, starting from day 0 up to day 20. The recorded average body weights are presented below.
Table 4: Results of the body weight of the animals during the treatment process
| Groups | Initial day | 5th day | 10th day | 15th day | 20th day |
| Control | 142± 0.45 | 142±0.56 | 143±0.47 | 144±0.18 | 144±0.36 |
| Cholesterol | 143±0.67 | 150±0.67 | 165±0.12 | 178±0.27 | 198±0.38 |
| Standard | 142±0.23 | 146±0.35 | 149±0.25 | 154±0.36 | 162±0.17 |
| Quercetin pure drug (500 mg/kg body weight) | 141±0.34 | 146±0.21 | 152±0.16 | 159±0.58 | 170±0.18 |
| Quercetin phytosome (100 mg/kg body weight) | 142±0.46 | 145±0.32 | 149±0.29 | 154±0.89 | 165±0.29 |
Data are represented as mean±standard deviation, n=3, P<0.05 value when compared with standard and control, the represented values demonstrate significant difference P<0.05 in comparison to both the control group and standard group
On the 21st day, a 2 ml blood sample was collected from the retro-orbital plexus for analysis of total cholesterol, triglycerides, HDL, VLDL, and LDL levels across all this groups. The values of the toxic group were compared to control group, the standard group was compared to the toxic group, and the test group results were compared to those of the standard group.
The total cholesterol levels of the toxic group were found to be 178.1±2.7, whereas for the standard group, it was found to be 143.21±2.83. In the case of the control group, the total cholesterol values were found to be 65.98±2.12; for quercetin pure drug-treated group, it was 143.24±0.34; for Quercetin phytosome, it was 131.21±0.24. This indicates that quercetin phytosome has individually shown profound action in controlling Triglyceride levels when compared to another group.
Excess levels of Triglycerides may lead to excess accumulation of LDL cholesterol in blood vessels, which may lead to hyper tri glyceridemia condition. Triglyceride levels of the toxic group were found to be 153.21±2.24, whereas for the standard group, it was found to be 94.12±0.21. In the case of the control group, the total cholesterol values were found to be 55.92±0.93; in the case of the quercetin drug-treated group, it was found to be 119.42±0.34, Quercetin phytosome it was 93±0.21, this indicates that quercetin phytosome, individually, has shown profound action in controlling triglyceride levels when compared to the other group.
High-density lipoproteins are the protecting agents against the accumulation of LDL in the blood vessels, if there is a decrease in HDL levels in the blood, it may act as one of the causative agents for the hyperlipidemic condition. HDL levels of the toxic group were found to be 14.32±0.21 whereas, for the standard group, it was found to be 37.23±0.12; in the case of the control group, HDL values were found to be 27.21±1.1. Upon comparison with test groups, for the Quercetin pure drug-treated group It was 36.14±0.31; for Quercetin phytosome, it was 39.12±0.432. This indicates that quercetin phytosome increases HDL levels compared to other groups.
Very low-density lipoproteins have less protein level and high concentration of phospholipid composition. Their accumulation will trigger scarification of the blood vessels, and the increase in VLDL levels in the blood may act as one of the causative agents for the hyperlipidemic condition. VLDL levels of the toxic group were found to be 34.23±0.23 whereas, for the standard group, it was found to be 20.12±0.32; in the case of the control group, VLDL values were found to be 12.67±0.4, for Quercetin pure drug-treated group, it was 26.33±0.14, for Quercetin phytosome it was 19.23±0.91. This indicates that the quercetin phytosome, individually, has shown profound action in declining VLDL levels when compared to another group [65]
Low-density lipoproteins have less protein level and a high concentration of phospholipid composition. Their accumulation will trigger the scarification of the blood vessels, and the increase of LDL in the blood may act as one of the causative agents for hyperlipidemic conditions. LDL levels of the toxic group were found to be 117.27±0.21; for the standard group, it was found to be 50.12±0.71; in the case of the control group, LDL values were found to be 16.5±2.7; in the case of Quercetin pure drug-treated group, it was 89.16±0.31; for Quercetin phytosome, it was 42.43±0.24. This indicates that the quercetin phytosome, individually, has shown profound action in reducing the LDL levels when compared to another group. The results of all biochemical parameters are listed in the below table 5. To validate our biochemical findings, one-way ANOVA was performed among groups for total cholesterol, triglycerides, HDL, VLDL, and LDL levels. Results showed highly significant differences (p<0.01) across all parameters. Following ANOVA, independent t-tests between specific groups. Cholesterol group (total cholesterol, HDL, VLDL, and LDL) vs. Control and quercetin phytosome vs. cholesterol group shows (p<0.001), whereas quercetin phytosome vs. standard drug (Atorvastatin) shows no significant difference (p>0.05). These results confirm that quercetin phytosome significantly reduces lipid levels.
Table 5: Results of the biochemical parameters of the animals during the treatment process
| Group | Total cholesterol (mg/dl)>200 | Triglycerides (mg/dl)>150 | High-density lipoproteins (mg/dl)≤40 |
Very low-density lipoproteins (mg/dl)≥30 |
Low-density lipoproteins (mg/dl)≥100 |
| Control | 65.98±2.12 | 55.92±0.93 | 27.21±1.1 | 12.67±0.4 | 16.5±2.7 |
| Cholesterol | 178.1±2.7** | 153.21±2.24** | 14.32±0.21** | 34.23±0.23** | 117.27±0.21** |
| Standard | 143.21±2.83** | 94.12±0.21** | 37.23±0.12** | 20.12±0.32** | 50.12±0.71** |
| Quercetin pure drug (500 mg/kg b. w.) | 143.24±0.34* | 119.42±0.34* | 36.14±0.31* | 26.33±0.14* | 89.16±0.31* |
| Quercetin phytosomes (100 mg/kg b. w.) | 131.21±0.24* | 93±0.21* | 39.12±0.43* | 19.23±0.91* | 42.43±0.24* |
Data are represented as Mean±Standard deviation, n=3, **P≤0.01 value when compared with control group, *P≤0.01 upon comparison of values with standard group, The represented values demonstrate a significant difference (p<0.01) in comparison to both the control group and the standard group
CONCLUSION
The Box-Behnken design was employed in the study to produce and optimize quercetin phytosomes. Important parameters like phospho lipid concentration, mixing temperature, and mixing duration were chosen because of their effects on the stability and production of phytosomes. Techniques such as Transmission Electron Microscopy, FTIR, Differential Scanning Calorimetry, X-ray diffraction, Particle size, zeta potential, and drug release experiments were used to characterize the phytosomes. Quercetin has the potential to be an anti-obesity agent because it can control fat cell differentiation and encourage lipolysis. Quercetin has also demonstrated potent antioxidant properties that aid in reducing oxidative stress, which is often linked to obesity. This makes it a safe and natural substitute for synthetic medications, to address this relevant references related to toxicity evaluations and safety studies are included [66]. Its efficacy in drug delivery applications has to be confirmed by more clinical research, formulation scalability, and long-term stability.
ACKNOWLEDGEMENT
The authors are expressing their gratitude to the SRM College of Pharmacy, Chennai and Nirmala College of Pharmacy, Guntur for providing facilities to carry out this research work.
FUNDING
This research did not receive funding from any public, commercial, or not-for-profit organizations.
AUTHORS CONTRIBUTIONS
All authors confirm their significant involvement in the research and accept full responsibility for its content, including contributions to the conceptualization, design, analysis, writing, or revision of the manuscript. SS was involved in the original draft preparation, conceptualization, methodology, and investigation. SK contributed to visualization, investigation, and data interpretation. HR provided supervision, as well as contributed to the conceptualization and methodology.
CONFLICT OF INTERESTS
The authors declare no financial or personal conflicts of interest that could have influenced the work presented in this paper.
REFERENCES
Chenthamara D, Subramaniam S, Ramakrishnan SG, Krishnaswamy S, Essa MM, Lin FH. Therapeutic efficacy of nanoparticles and routes of administration. Biomater Res. 2019 Dec;23(1):20. doi: 10.1186/s40824-019-0166-x, PMID 31832232.
Vaou N, Stavropoulou E, Voidarou C, Tsigalou C, Bezirtzoglou E. Towards advances in medicinal plant antimicrobial activity: a review study on challenges and future perspectives. Microorganisms. 2021 Sep 27;9(10):2041. doi: 10.3390/microorganisms9102041, PMID 34683362.
Saeed M, Sadr S, Gharib A, Lotfalizadeh N, Hajjafari A, Ahmadi Simab PA. Phytosomes: a promising nanocarrier for enhanced delivery of herbal compounds in cancer therapy. J Lab Anim Res. 2022 Dec 25;1(1):26-32. doi: 10.58803/jlar.v1i1.8.
Gaur PK, Singh R, Rastogi S, Lata K. Recent advancements and applications of phospholipid complexes: a strategy to enhancing the bioavailability of phytopharmaceuticals. Drug Deliv Lett. 2023 Mar 1;13(1):2-12. doi: 10.2174/2210303112666220929151010.
Dutt Y, Pandey RP, Dutt M, Gupta A, Vibhuti A, Raj VS. Silver nanoparticles phytofabricated through azadirachta indica: anticancer apoptotic and wound healing properties. Antibiotics (Basel). 2023;12(1):121. doi: 10.3390/antibiotics12010121, PMID 36671322.
Barani M, Sangiovanni E, Angarano M, Rajizadeh MA, Mehrabani M, Piazza S. Phytosomes as innovative delivery systems for phytochemicals: a comprehensive review of literature. Int J Nanomedicine. 2021 Oct 15;16:6983-7022. doi: 10.2147/IJN.S318416, PMID 34703224.
Islam N, Irfan M, Hussain T, Mushtaq M, Khan IU, Yousaf AM. Piperine phytosomes for bioavailability enhancement of domperidone. J Liposome Res. 2022 Apr 3;32(2):172-80. doi: 10.1080/08982104.2021.1918153, PMID 33944662.
Salehi B, Machin L, Monzote L, Sharifi Rad J, Ezzat SM, Salem MA. Therapeutic potential of quercetin: new insights and perspectives for human health. ACS Omega. 2020 May 14;5(20):11849-72. doi: 10.1021/acsomega.0c01818, PMID 32478277.
Tavares L, Santos L, Zapata Norena CP. Bioactive compounds of garlic: a comprehensive review of encapsulation technologies characterization of the encapsulated garlic compounds and their industrial applicability. Trends Food Sci Technol. 2021 Aug;114:232-44. doi: 10.1016/j.tifs.2021.05.019.
Adepu S, Ramakrishna S. Controlled drug delivery systems: current status and future directions. Molecules. 2021;26(19):5905. doi: 10.3390/molecules26195905, PMID 34641447.
Beltran Carrillo VJ, Megias A, Gonzalez Cutre D, Jimenez Loaisa A. Elements behind sedentary lifestyles and unhealthy eating habits in individuals with severe obesity. Int J Qual Stud Health Well-being. 2022;17(1):2056967. doi: 10.1080/17482631.2022.2056967, PMID 35356850.
Garcia Garcia JA, Cufarfan Lopez J, Aguilar CN. The incidence of educational institutions in the integral health of students. Role Nutr Integr Health Quallife. 2024:487-94. doi: 10.1201/9781003413585-21.
Sahoo K, Sahoo B, Choudhury AK, Sofi NY, Kumar R, Bhadoria AS. Childhood obesity: causes and consequences. J Fam Med Prim Care. 2015 Apr;4(2):187-92. doi: 10.4103/2249-4863.154628, PMID 25949965.
Testa MA, Simonson DC. Assessment of quality of life outcomes. N Engl J Med. 1996 Mar 28;334(13):835-40. doi: 10.1056/NEJM199603283341306, PMID 8596551.
Chapman DP, Perry GS, Strine TW. Peer reviewed: the vital link between chronic disease and depressive disorders. Prev Chronic Dis. 2005 Jan;2(1)A14. PMID 15670467.
Gariepy G, Nitka D, Schmitz N. The association between obesity and anxiety disorders in the population: a systematic review and meta-analysis. Int J Obes (Lond). 2010 Mar;34(3):407-19. doi: 10.1038/ijo.2009.252, PMID 19997072.
Myers A, Rosen JC. Obesity stigmatization and coping: relation to mental health symptoms body image and self esteem. Int J Obes Relat Metab Disord. 1999 Mar;23(3):221-30. doi: 10.1038/sj.ijo.0800765, PMID 10193866.
Legey S, Aquino F, Lamego MK, Paes F, Nardi AE, Neto GM. Relationship among physical activity level mood and anxiety states and quality of life in physical education students. Clin Pract Epidemiol Ment Health. 2017 Aug 9;13:82-91. doi: 10.2174/1745017901713010082, PMID 29081825.
Heron KE, Smyth JM. Ecological momentary interventions: incorporating mobile technology into psychosocial and health behaviour treatments. Br J Health Psychol. 2010 Feb;15(1):1-39. doi: 10.1348/135910709X466063, PMID 19646331.
Zhang WL, Zhu L, Jiang JG. Active ingredients from natural botanicals in the treatment of obesity. Obes Rev. 2014 Dec;15(12):957-67. doi: 10.1111/obr.12228, PMID 25417736.
Mahapatra DK, Patil S, Patil AG. The progressive journey of phytosomes in herbal-based pharmacotherapeutics. Curr Bioact Compd. 2020 Aug 1;16(6):853-86. doi: 10.2174/1573407215666190417121237.
Seo MJ, Lee YJ, Hwang JH, Kim KJ, Lee BY. The inhibitory effects of quercetin on obesity and obesity-induced inflammation by regulation of MAPK signaling. J Nutr Biochem. 2015;26(11):1308-16. doi: 10.1016/j.jnutbio.2015.06.005, PMID 26277481.
Seidell JC, Halberstadt J. The global burden of obesity and the challenges of prevention. Ann Nutr Metab. 2015 Jun 1;66 Suppl 2:7-12. doi: 10.1159/000375143, PMID 26045323.
Goktas Z, Zu Y, Abbasi M, Galyean S, Wu D, Fan Z. Recent advances in nanoencapsulation of phytochemicals to combat obesity and its comorbidities. J Agric Food Chem. 2020 Jul 7;68(31):8119-31. doi: 10.1021/acs.jafc.0c00131, PMID 32633507.
Hoek Van Den Hil EF, Van Schothorst EM, Van Der Stelt I, Swarts HJ, Venema D, Sailer M. Quercetin decreases high-fat diet induced body weight gain and accumulation of hepatic and circulating lipids in mice. Genes Nutr. 2014;9(5):418. doi: 10.1007/s12263-014-0418-2, PMID 25047408.
Bhalla K, Hwang BJ, Dewi RE, Ou L, Twaddel W, Fang HB. PGC1α promotes tumor growth by inducing gene expression programs supporting lipogenesis. Cancer Res. 2011 Nov 1;71(21):6888-98. doi: 10.1158/0008-5472.CAN-11-1011, PMID 21914785.
James PT, Leach R, Kalamara E, Shayeghi M. The worldwide obesity epidemic. Obes Res. 2001 Nov;9 Suppl 4:228S-33S. doi: 10.1038/oby.2001.123, PMID 11707546.
Abete I, Goyenechea E, Zulet MA, Martinez JA. Obesity and metabolic syndrome: potential benefit from specific nutritional components. Nutr Metab Cardiovasc Dis. 2011 Sep 1;21 Suppl 2:B1-15. doi: 10.1016/j.numecd.2011.05.001, PMID 21764273.
Dallas C, Gerbi A, Elbez Y, Caillard P, Zamaria N, Cloarec M. Clinical study to assess the efficacy and safety of a citrus polyphenolic extract of red orange grapefruit and orange (Sinetrol‐XPur) on weight management and metabolic parameters in healthy overweight individuals. Phytother Res. 2014 Feb;28(2):212-8. doi: 10.1002/ptr.4981, PMID 23554029.
Baishya BI, Rahman SS, Rynjah DA, Barman KA, Bordoloi SS, Islam JA. Enhancing of oral bioavailability of poorly water-soluble antihypertensive drugs. Int J Curr Pharm Sci. 2021;13(4):42-7. doi: 10.22159/ijcpr.2021v13i4.42741.
Alshahrani SM. Optimization and characterization of cuscuta reflexa extract loaded phytosomes by the box-behnken design to improve the oral bioavailability. J Oleo Sci. 2022;71(5):671-83. doi: 10.5650/jos.ess21318, PMID 35387912.
Lu M, Qiu Q, Luo X, Liu X, Sun J, Wang C. Phyto-phospholipid complexes (phytosomes): a novel strategy to improve the bioavailability of active constituents. Asian J Pharm Sci. 2019 May 1;14(3):265-74. doi: 10.1016/j.ajps.2018.05.011, PMID 32104457.
Patil N, Bhaskar R, Vyavhare V, Dhadge R, Khaire V, Patil Y. Overview on methods of synthesis of nanoparticles. Int J Curr Pharm Sci. 2021;13(2):11-6. doi: 10.22159/ijcpr.2021v13i2.41556.
Alshahrani SM. Optimization and characterization of cuscuta reflexa extract loaded phytosomes by the box-behnken design to improve the oral bioavailability. J Oleo Sci. 2022;71(5):671-83. doi: 10.5650/jos.ess21318, PMID 35387912.
Roy H, Panda SP, Panda SK, Tripathi AK, Srivastava SK, Nayak BS. N-trimethyl chitosan and tripalmitin loaded solid lipid nanoparticles of tofacitinib citrate: characterization and in vivo anti-inflammatory assessment. J Drug Deliv Sci Technol. 2023 Jul 26;87:104789. doi: 10.1016/j.jddst.2023.104789.
Roy H, Srungarapati S, Gade NJ, Gummadi A, Marry Karunasree BK, Dakkumalla M. Citicoline loaded nanoemulsion enriched with D-alpha tocopherol acetate and protein: formulation and in silico study. J Drug Deliv Sci Technol. 2023 Apr 1;82:104340. doi: 10.1016/j.jddst.2023.104340.
Maddiboyina B, Roy H, Nakkala RK, Gandhi S, Kavisri M, Moovendhan M. Formulation optimization and characterization of raloxifene hydrochloride loaded PLGA nanoparticles by using taguchi design for breast cancer application. Chem Biol Drug Des. 2023 Mar 1;102(3):457-70. doi: 10.1111/cbdd.14222, PMID 36856306.
Vasam M, Maddiboyina B, Talluri C, Alagarsamy S, Gugulothu B, Roy H. Formulation characterization and taguchi design study of eplerenone lipid-based solid dispersions integrated with gelucire. Bionanosci. 2023;13(2):576-87. doi: 10.1007/s12668-023-01102-4.
Sravan Kumar S, Manoj P, Giridhar P. Fourier transform infrared spectroscopy (FTIR) analysis chlorophyll content and antioxidant properties of native and defatted foliage of green leafy vegetables. J Food Sci Technol. 2015 Dec;52(12):8131-9. doi: 10.1007/s13197-015-1959-0, PMID 26604386.
Ho HM, Chen RY, Leung LK, Chan FL, Huang Y, Chen ZY. Difference in flavonoid and isoflavone profile between soybean and soy leaf. Biomed Pharmacother. 2002 Aug 1;56(6):289-95. doi: 10.1016/s0753-3322(02)00191-9, PMID 12224600.
Habbu P, Madagundi S, Kulkarni R, Jadav S, Vanakudri R, Kulkarni V. Preparation and evaluation of bacopa phospholipid complex for antiamnesic activity in rodents. Drug Invent Today. 2013 Mar 1;5(1):13-21. doi: 10.1016/j.dit.2013.02.004.
Song W, Zhang Q, Guan Y, Li W, Xie S, Tong J. Synthesis and characterization of porous chitosan/saccharomycetes adsorption microspheres. Polymers. 2022 Jun 5;14(11):2292. doi: 10.3390/polym14112292, PMID 35683963.
Harnafi M, Bekkouch O, Touiss I, Khatib S, Mokhtari I, Milenkovic D. Phenolic rich extract from almond (prunus dulcis) hulls improves lipid metabolism in triton WR-1339 and high-fat diet-induced hyperlipidemic mice and prevents lipoprotein oxidation: a comparison with fenofibrate and butylated hydroxyanisole. Prev Nutr Food Sci. 2020 Sep 9;25(3):254-62. doi: 10.3746/pnf.2020.25.3.254, PMID 33083374.
Chouhan A, Shah SK, Tyagi CK, Budholiya P, Wazid A, Khan F. Formulation development and evaluation of phytosomes of Swertia perennis. AJPER. 2021;10(2):55-66. doi: 10.38164/AJPER/10.2.2021.55-66.
Nguyen HT, Pham BT. Preparation and physicochemical evaluation of hydrogel containing quercetin phytosomes. Pharm Sci Asia. 2021 Mar 1;48(2):122-38. doi: 10.29090/psa.2021.02.19.094.
Maryana W, Rachmawati H, Mudhakir D. Formation of phytosome containing silymarin using thin layer hydration technique aimed for oral delivery. Mater Today Proc. 2016 Jan 1;3(3):855-66. doi: 10.1016/j.matpr.2016.02.019.
Hindarto CK, Surini S, Permana AH, Redjeki S, Irawan C. Effect of mole ratio on physicochemical properties of luteolin loaded phytosome. J Pharm Innov. 2017 Nov 18;6(12):96-101.
Singh A, Arora S, Singh TG. Development and optimization of andrographis paniculata extract loaded phytosomes using box behnken design approach. J Integr Sci Technol. 2023 Jan 24;11(4):558.
Ittadwar PA, Puranik PK. Novel umbelliferonephytosomes: development and optimization using experimental design approach and evaluation of photo protective and antioxidant activity. Int J Pharm Pharm Sci. 2016;9(1):218. doi: 10.22159/ijpps.2017v9i1.14635.
Shariare HM, Afnan K, Iqbal F, A Altamimi M, Ahamad SR, S Aldughaim M, K Alanazi F, Kazi M. Development and optimization of epigallocatechin-3-gallate (EGCG) nano phytosome using design of experiment (DoE) and their in vivo anti-inflammatory studies. Molecules. 2020 Nov 20;25(22):5453. doi: 10.3390/molecules25225453.
Pathak K, Das A, Shakya A, Saikia R, Sarma H. Evaluation of anti-diabetic and anti-hyperlipidemic activity of isolated bioactive compounds of leaves of Annona reticulata Linn. NPJ. 2021 Jun 1;11(3):414-21. doi: 10.2174/2210315510999200511132940.
Wu LC, Cheng CM. Flow injection enzymatic analysis for glycerol and triacylglycerol. Anal Biochem. 2005 Nov 15;346(2):234-40. doi: 10.1016/j.ab.2005.08.031, PMID 16213458.
Sivagamasundari R. Anti-hyperlipidemic activity of aerial parts of Delonix elata on high cholesterol diet induced hyperlipidemia in rats. Doctoral dissertation Mohamed Sathak AJ College of Pharmacy Chennai; 2017 Apr. Available from: https://core.ac.uk/download/pdf/235665223.pdf.
Mayes PA. Intermediary metabolism of fructose. Am J Clin Nutr. 1993 Nov 1;58(5) Suppl :754S-65S. doi: 10.1093/ajcn/58.5.754S, PMID 8213607.
Bachorik PS, Albers JJ. Precipitation methods for quantification of lipoproteins. Methods Enzymol. 1986 Jan 1;129:78-100. doi: 10.1016/0076-6879(86)29063-1, PMID 3724552.
Rathee S, Kamboj A. Optimization and development of antidiabetic phytosomes by the box-Behnken design. J Liposome Res. 2018 Apr 3;28(2):161-72. doi: 10.1080/08982104.2017.1311913, PMID 28337938.
Nandayasa WW, Febriyenti, Lucida H. Optimization and characterization of quercetin vitamin c nano-phytosome formulation. Int J App Pharm. 2023;15(1):51-5. doi: 10.22159/ijap.2023.v15s1.47507.
Chivte PS, Pardhi VS, Joshi VA, Rani A. A review on therapeutic applications of phytosomes. J Drug Delivery Ther. 2017;7(5)17-21. doi: 10.22270/jddt.v7i5.1513.
Yue PF, Zhang WJ, Yuan HL, Yang M, Zhu WF, Cai PL. Process optimization characterization and pharmacokinetic evaluation in rats of ursodeoxycholic acid phospholipid complex. AAPS PharmSciTech. 2008 Mar;9(1):322-9. doi: 10.1208/s12249-008-9040-1, PMID 18446498.
Barani M, Sangiovanni E, Angarano M, Rajizadeh MA, Mehrabani M, Piazza S. Phytosomes as innovative delivery systems for phytochemicals: a comprehensive review of literature. Int J Nanomedicine. 2021 Oct 15;16:6983-7022. doi: 10.2147/IJN.S318416, PMID 34703224.
Alhakamy NA, Fahmy UA, Eldin SM, Ahmed OA, Aldawsari HM, Okbazghi SZ. Scorpion venom functionalized quercetin phytosomes for breast cancer management: in vitro response surface optimization and anticancer activity against MCF-7 cells. Polymers. 2021 Dec 27;14(1):93. doi: 10.3390/polym14010093, PMID 35012116.
Rekha M, Sangeetha S. Formulation development and pharmacokinetic studies of nirmatrelvir loaded solid lipid nanoparticles using box-behnken design. Int J Appl Pharm. 2025;17(1):101-12. doi: 10.22159/ijap.2025v17i1.52380.
Agustina RE, Setyaningsih DE. Solid dispersion as a potential approach to improve dissolution and bioavailability of curcumin from turmeric (Curcuma longa L.). Int J App Pharm. 2023;15(5):37-47. doi: 10.22159/ijap.2023v15i5.48295.
Direito R, Reis C, Roque L, Goncalves M, Sanches Silva A, Gaspar MM. Phytosomes with persimmon (Diospyros kaki L.) extract: preparation and preliminary demonstration of in vivo tolerability. Pharmaceutics. 2019 Jun 22;11(6):296. doi: 10.3390/pharmaceutics11060296, PMID 31234548.
Lestari D. Anredera cordifolia leaves fraction as an antihyperlipidemia. Asian J Pharm Clin Res. 2016;9(6):82-4. doi: 10.22159/ajpcr.2016.v9i6.13628.
Joshua JM, Anilkumar A, Cu VE, Vasudevan T, DE, Surendran SA. Formulation and evaluation of antiaging phytosomal gel. Asian J Pharm Clin Res. 2018 Mar;11(3):409-22. doi: 10.22159/ajpcr.2018.v11i3.24257.