
Int J App Pharm, Vol 17, Issue 5, 2025, 214-226Original Article
MAXIMIZING THE POTENTIAL OF IBRUTINIB: MULTI-FACTOR OPTIMIZATION AND INTERACTION ANALYSIS FOR IMPROVED NANOBUBBLE FORMULATION AND BIOAVAILABILITY PERFORMANCE
B. VIJAYA LAXMI1, D. V. R. N. BHIKSHAPATHI2,3*, V. V. RAJESHAM4, P. POORNIMA5, P. SANDHYA6, G. ARJUN3
1,2Bir Tikandrajit University, Canchipur, Imphal West-795003, Manipur, India. 3Department of Pharmaceutics, Teegala Ram Reddy College of Pharmacy, Meerpet, Hyderabad-500097, Telangana, India. 4Department of Pharmacology, CMR College of Pharmacy, Kandlakoya (V) Medchal (MandD), Hyderabad-501401, Telangana, India. 5Siddhartha Institute of Pharmacy, Korremula Road, Narepally, Ghatkesar, Hyderabad-501301, Telangana, India. 6Shadan Women’s College of Pharmacy, Khairatabad, Hyderabad-500004, Telangana, India
*Corresponding author: D. V. R. N. Bhikshapathi; *Email: dbpathi71@gmail.com
Received: 28 Feb 2025, Revised and Accepted: 09 Jun 2025
ABSTRACT
Objective: Ibrutinib (IBR), a v-Raf murine sarcoma viral oncogene homolog B1 (BRAF) inhibitor, faces solubility challenges as a Biopharmaceutics Classification System Class II drug. The objective of this was to formulate IBR-loaded polylactic-co-glycolic acid (PLGA) nanobubbles (NBs) using the solvent evaporation method with ultrasound assistance.
Methods: IBR-PLGA nanobubble optimization was achieved by implementing a four-factor, three-level BBD and a total of 29 experimental runs, including three replicated centre points, comprised the Box-Behnken design (BBD). The formulated NBs were characterized for particle size, zeta potential (ZP), drug entrapment efficiency (EE), compatibility studies in vitro studies, and stability studies along with in vivo studies in rats.
Results: The optimized NBs displayed a particle size of 130±13.3 nm, ZP of-23.0±0.89 mV and EE of 49.14±1.32. In vitro studies revealed superior drug release (98%) with ultrasound versus plain drugs (20%). Fourier Transform Infrared Spectroscopy and Differential Scanning Calorimetry studies confirmed no drug-polymer interaction. Scanning Electron Microscopy images showcased uniform spherical nano-sized particles. Stability studies indicated no significant changes after 1 mo. The Cmax increased 4.35-fold (p<0.01), and AUC0-t enhanced 8.13-fold (p<0.001) compared to plain IBR with statistical significance.
Conclusion: Results indicate that IBR-loaded PLGA NBs could be effective in sustaining its release for a prolonged period for the treatment of breast cancer. Targeted medicine delivery through passive targeting via enhanced permeability and retention is made possible by the potential use of NBs in the creation of ultrasonic-responsive combinations.
Keywords: Box-behnken design, Ibrutinib, Mantle cell lymphoma, Nanobubbles, PLGA
© 2025 The Authors. Published by Innovare Academic Sciences Pvt Ltd. This is an open access article under the CC BY license (https://creativecommons.org/licenses/by/4.0/)
DOI: https://dx.doi.org/10.22159/ijap.2025v17i5.54081 Journal homepage: https://innovareacademics.in/journals/index.php/ijap
INTRODUCTION
The cure of mantle cell lymphoma (MCL) and chronic lymphocytic leukemia (CLL) has been revolutionized by the irreversible Bruton tyrosine kinase (BTK) inhibitor ibrutinib (IBR). With a strong half-maximal inhibitory concentration of 0.5 nM, IBR is a type IV irreversible kinase inhibitor that blocks the B-cell receptor (BCR) pathway, which is a game-changer in treating these common leukemias in the Western hemisphere [1].
IBR binds to BTK and has varying affinity for kinases, including BLK, JAK3, EGFR family, and TFK. IBR's effectiveness in treating various malignancies is being investigated in ongoing trials, suggesting broader potential uses [2]. IBR although showing promise in B-cell malignancies, is not without its hurdles because of its low oral bioavailability of 2.9%. This constraint is linked to its first-pass metabolism susceptibility and low solubility (0.002 mg/ml) [3, 4]. For patients with MCL and CLL, the recommended daily dosage is higher-560 mg and 420 mg, respectively-which can have serious adverse effects on the nervous system. In addition to these problems, when food is given with IBR, there is an almost twofold spike in exposure [5]. Food intake-related pharmacokinetic variability lowers a drug's safety and efficacy. Therefore, a strategy that reduces the pharmacokinetic variations between the fed and fasting states must be developed. Strategies such as phospholipid complexes, nanosuspensions, and self-nanoemulsifying drug delivery system (SNEDDS) are designed to improve the bioavailability of IBR [4, 6, 7].
Nanostructured lipid carriers (NLCs), of IBR was reported by authors and proved for lymphatic uptake while addressing fast-fed variability [8]. Scalability problems and the need for pricey specialist excipients are obstacles. Beyond enhancing solubility, an approach that offers the potential to target drug molecules specifically to diseased tissues while reducing their concentration in normal tissues is highly essential. Such targeted delivery system will not only improve stability in bodily fluids, optimize concentration and release kinetics in the bloodstream, but also enhance pharmacokinetic and pharmacodynamic properties. All these factors collectively contribute to heightened efficacy and reduced side effects. One such system is Smart delivery systems, currently focused on cancer treatment. The term "smart drug delivery systems" is refined to indicate that nanobubbles (NBs) function as stimuli-responsive carriers rather than a broad, undefined category.
Among the forefront of these innovative delivery systems are smart delivery systems, which have garnered significant attention and focus, particularly in the realm of cancer treatment. By leveraging advanced technologies and principles, Smart delivery systems represent a cutting-edge approach to drug administration, aiming to precisely navigate drugs to their intended targets within the body. Through the integration of sophisticated mechanisms, these systems hold the potential to revolutionize cancer therapy by maximizing efficacy and minimizing the impact on healthy tissues.
The ability to react to sudden changes in its surroundings, particularly those brought on by chemical stimuli, is possessed by a smart drug delivery system. Extensive research has been conducted on the application of pressure waves and ultrasonic (US) triggers for triggered drug delivery, which is dependent on external stimuli [9]. The ultrasound-triggered drug release mechanism involves acoustic cavitation, which disrupts NB structure, facilitating drug diffusion. This concept is supported by recent studies (2020-2024) demonstrating the effectiveness of ultrasound-sensitive carriers in site-specific drug delivery. The potential for targeted therapy in a range of medical applications has been enhanced by the broad exploration of these external stimuli to establish precise control over medication release.
NBs, or microscopic bubbles at the nanoscale, are used in numerous fields, most notably in drug delivery systems. Their amazing stability, high internal pressure, and large surface-to-volume ratio are only a few of their outstanding physical characteristics [10]. NBs were selected over alternative solubility-enhancing techniques such as SNEDDS, nanosuspensions, and micellar systems due to their dual benefits of solubility enhancement and ultrasound-responsive drug release. Unlike traditional nanocarriers, NBs allow stimuli-responsive, controlled drug release, enhancing therapeutic efficacy. Drugs and other therapeutic agents can be efficiently delivered to cancer cells by using NBs as carriers. NBs can vary in size from 1 nm to 500 nm, and their dimensions can be precisely tailored to the nanoscale using amphiphilic polymers like pluronic or surfactants. Research has been done on both polymeric and lipidic NBs; however, the instability of lipid-based NBs leads to breakup and a shorter circulation period. Poly (lactic-co-glycolic acid), or PLGA, is a special kind of nano/micro biomaterial that can be used for diverse applications such as targeted medication delivery, molecular diagnostics, tissue engineering, and gene transfer [11]. Its favourable characteristics stem from its distinct attributes, including its high stability, biodegradability, and ease of chemical modification [12]. Ponnganati et al. reported chitosan-shelled IBR NBs, but the authors did not report the in vivo studies and about the sustain release [13]. To the best of our knowledge and based on available literature, there are no prior studies documenting the utilization of PLGA NBS for delivering IBR to cancer cells. This study aims to address this gap by developing IBR-loaded NBs to induce spontaneous cell death and enhance the effectiveness of chemotherapy in MCL. The research involves the preparation of IBR-containing NBs using PLGA, followed by comprehensive in vitro characterization, including analysis of particle size (PS), size distribution, zeta potential (ZP), morphology, release kinetics, and subsequent in vivo evaluation.
MATERIALS AND METHODS
Materials
IBR pure drug was acquired from Dr Reddy's Ltd., Hyderabad, India. Sigma Aldrich, US, supplied Poly (D, L-lactide-co-glycolide) 50:50 with an intrinsic viscosity of 0.22 dl/g and Mw 25,000. Polyvinyl alcohol (PVA; Mw 30,000-70,000) was purchased from Sigma Aldrich (St. Louis, MO, USA). Isopropanol, dichloromethane was acquired from S. D. inehemicals, Hyderabad. We purchased acetonitrile from Qualigens, India. The cells were purchased from NCS Pune, Maharashtra, India. All the media components were purchased from Gibco, USA, and Invitrogen, USA.
Methods
Analytical method development using reverse-phased high-performance liquid chromatography (RP HPLC)
IBR was analysed chromatographically using a RP HPLC method on a Develosil ODS HG-5 RP C18 (150 x 4.6 mm, 5µm). The mobile phase with the composition of 0.1% orthophosphoric Acid: Methanol with a 35:65 ratio at a 1.0 ml/min flow rate was used. At 287 nm, detection was carried out. The technique showed linearity within the scale of 25-1000 ng/ml. The HPLC method was validated in accordance with ICH Q2 (R1) guidelines, demonstrating excellent linearity with an R² value of 0.9998 across a concentration range of 5–100 µg/ml. Precision analysis showed intraday and interday variations of less than 2%, ensuring method reliability. Accuracy was confirmed with a recovery range of 98.2%–101.4%, while the limit of detection (LOD) and limit of quantification (LOQ) were determined to be 0.45 µg/ml and 1.35 µg/ml, respectively. Additionally, plasma extraction recovery was 92.6%±3.2%, and matrix effect analysis indicated no significant interference, validating the robustness of the method for bioanalytical applications.
IBR nanobubbles (IBR NBs) formulation development and optimization
IBR-loaded PLGA NBs were created using the solvent evaporation method with ultrasound assistance following a modified procedure [14]. Initially, PLGA was dissolved in a water-immiscible solvent such as dichloromethane (DCM) to form a single-phase solution. The drug (IBR) was then added to create a dispersion, which was sonicated for two minutes at 45% amplitude in an ice bath using a Digital Sonifier S-250D (Branson Ultrasonic, Danbury, USA). Next, the drug dispersion was mixed with 20 ml of chilled 2.0% PVA (polyvinyl alcohol) solution and homogenized at 6,700 rpm for 10 min with a high-speed homogenizer, followed by sonication at 30 W for 1 minute in the dark using an ultrasonic probe. The homogenization speed of 6,700 rpm was determined through preliminary trials to achieve optimal nanobubble size and polydispersity index (PdI). To remove the DCM, a 2.5% v/v isopropanol solution (20 ml) was added to the emulsion and stirred mechanically at room temperature for 5 h. The solution was centrifuged at 8000 rpm for five minutes, and the precipitate was washed with deionized water after discarding the supernatant. Centrifugation and washing process was repeated three times. The cleaned NBs were then freeze-dried in the dark for 36 h using a LYPH LOCK 4.5 (Labconco Corporation, Kansas City, MO). Finally, C3F8 gas (Perfluoropropane) was introduced into the lyophilization chamber through a vial connector at a flow rate of 50 ml/min for 1 minute. Perfluoropropane gas was selected over perfluorobutane due to its superior biocompatibility, stability, and ultrasound responsiveness. Subsequently, the screw vials were capped.
PLGA-IBR nanobubble optimization was achieved by implementing a four-factor, three-level Box-Behnken design (BBD). A total of 29 experimental runs, including three replicated centre points, comprised the BBD. The optimization was based on a BBD to evaluate the influence of drug concentration, PLGA concentration, PVA concentration, and stirring speed; each at three levels of variation: low (-1), middle (0), and high (1) were taken. The chosen ranges were based on preliminary screening studies, ensuring optimal PS, entrapment efficiency, and stability. The response (dependent variables) were PS (Y1), ZP(Y2), and encapsulation efficiency (EE%) (Y3); table 1 lists their respective ranges. Utilizing Response Surface Charts and contour (2D) plots, response surface search was carried out with Design Expert® tools (Version 12, Stat-Ease Inc., Minneapolis, MN). The Quality Target Product Profiles (QTPP) and Critical Quality Attributes (CQAs) are mentioned in table 2.
Table 1: Box-Behnken design (BBD) with independent and dependent variables considered for the study
| Independent variables | Levels | |||
| LOW (-1) | Medium (0) | High (+1) | ||
| A | Amount of Ibrutinib (mg) | 140 | 210 | 280 |
| B | Amount of PLGA (mg) | 250 | 375 | 500 |
| C | Amount of PVA (% w/v) | 1 | 1.5 | 2 |
| D | Stirring Speed (rpm) | 6000 | 9000 | 12000 |
| Dependent variables | Restrictions | |||
| X | Particle size (nm) | Minimize | ||
| Y | Zeta potential (mV) | In range | ||
| Z | Encapsulation Efficiency (%) | Maximum | ||
Characterisation and evaluation
Measurements of PS, PdI, and ZP
Using a Malvern Zetasizer (Malvern Instruments, UK), dynamic light scattering (DLS) theory was used to calculate the PS, ZP and PdI of IBR NBs after tenfold dilution of the sample with double-distilled water [13]. A higher ZP (>±30 mV) would enhance stability, steric stabilization using PVA compensated for the lower charge, preventing aggregation.
Entrapment efficiency (EE and load capacity (LC)
The EE and LC were assessed by using DCM to dissolve a specific quantity of loaded drug (IBR)-containing NBs. The complex was dissolved by sonication for 12 min. The resulting solution was appropriately diluted and analysed using HPLC. The drug concentration was detected using UV absorbance at 287 nm. The data is measured in triplicate. The following formulas can be used to calculate these values [15]:

Fourier transform infrared spectroscopy (FTIR)
The FTIR spectrum was obtained using a spectroscopy instrument (Bruker Optics, model: Tensor 27) from Germany. The pure drug (IBR), physical mixture, and the optimized NBs were all analysed in the wavenumber range of 4000-450 cm-1 with a resolution of 1.0 cm-1 [7].
Differential scanning calorimeter (DSC)
DSC was used to analyse thermal behaviour (Mettler Toledo DSC-1). Samples weighing (2 mg) were placed in aluminium pans and heated at a rate of 10 degrees Celsius per minute from 20 to 400 degrees Celsius [8].
Scanning electron microscopy (SEM)
Using a Quanta FESEM 250 SEM, the structure of the drug and NBs was photographed. Before the examination, the sample was sputter-coated with Au using an ion sputter and placed over double-sided adhesive carbon tape, then mounted over aluminium pin stubs. The samples were tested at a working distance of 10 mm, 500–10,000 times magnification, and 30 kV accelerating voltage [16].
Drug release (DR)
Using the dialysis bag method, the IBR DR values from the NBs with and without ultrasonography at 37 °C were ascertained. The release data was recorded for up to 24 h by taking 1 ml of the receiving phase at predefined intervals and replacing the medium with fresh phosphate buffer. Following ultrasound utilization, the release was monitored as well (frequency 2.5±0.1 MHz, insonation time = 1 min). To ascertain the amount of drug present in each sample, HPLC analysis was performed as per the developed method [17].
Stability studies
In accordance with ICH recommendations, the stability of IBR NBs was assessed for three months at three different temperatures (4 °C, 25 °C, and 40 °C). On the day one, 1, 2 and 3rd month the PS, ZP and EE of drug-loaded NBs were measured [18].
Pharmacokinetic studies
The National Institute Nutrition (NIN), situated in Telangana, India, provided the male Wistar rats used in the study, which had an approximate weight of 200±20 g and an age of 4-5 w. Every animal study followed the "Guidelines for Care and Use of Laboratory Animals," and the Institutional Animal Ethics Committee (IAEC) formally approved the protocols identified by protocol number.1447/PO/Re/S/11/CPCSEA-82/A. Animals were exposed to natural light/dark settings for one week, during which they were acclimated to a temperature of 20ºC±2ºC and a relative humidity of 40–60%. After that, they were randomly divided into three groups of six animals. The NBs formulation (40 mg/kg BW), the vehicle, and the IBR (dispersed in 0.25% w/v sodium carboxymethylcellulose) were all given orally. Blood specimens (250µl*) were removed via the retroorbital plexus and placed into tubes impregnated with EDTA at predetermined intervals [19]. An Eppendorf centrifuge was used to centrifuge blood samples for ten minutes at 7500 rpm. The extracted plasma was processed and examined using HPLC.
Method for preparing samples and bioanalytical method establishment
Protein precipitation was used to remove IBR from plasma samples. In summary, 250 µl** of acetonitrile was used to quench 50 µl** of rat plasma containing sorafenib as the internal standard. The mixture sample was vortexed and centrifuged for 10 min at 10,000 rpm. RP-HPLC was used to separate and examine the supernatant [7]. The HPLC method described previously in the analytical part was used for bioanalysis.
Data and statistical analysis
Data analysis was performed using WinNonlin (version 3.1; Pharsight Co., Mountain View, CA, USA) on the acquired concentration-time profile. The pharmacokinetic variables were examined using the non-compartmental methodology. The pharmacokinetic variables' standard deviation (SD) was represented as mean ±SD. The variables were further examined with the aid of the statistical analysis program GraphPad Prism (GraphPad Software 8.05 Inc., CA).
RESULTS
In the present study, NBs of IBR were developed using the solvent evaporation method to create ultrasound-assisted NBs. In brief PLGA was first dissolved in DCM followed by the addition of drug to form a dispersion, which was subjected to sonication. The drug dispersion was then added to chilled PVA (2.0% w/v) solution and subjected to high speed homogenizer followed by sonication at 30 W for 1 min in the dark using an ultrasonic probe. To extract the DCM, isopropanol (2.5 % v/v) solution was added to the emulsion under mechanical stirring at room temperature for 5h. Although the term "nanodroplets" is more accurate, "NBs" are used for simplicity's sake because perfluoropentane is fluid at room temperature (boiling point of 29 °C). Acoustic droplet vaporization is the name given to the liquid-to-vapor phase that these nanodroplets in perfluoropentane go through when they encounter ultrasound waves [20, 21]. Perfluoropentane undergoes a phase transition that turns nanodroplets into NBs, which have high US wave reflectivity. This presentation emphasizes their echogenic qualities and makes them visible in ultrasonography images. The NBs were developed using PLGA polymer containing unbound carboxylic end chains using perfluoropentane for the inner core and PLGA as the outer shell. The selected drug was efficiently entrapped in the NBs core forming nanoscale particles.
The term "ultrasound" describes mechanical vibrations or pressure waves that exhibit compressional and rarefactional pressure fluctuations and have frequencies that are either equivalent to or higher than the human hearing threshold (20 kHz) [22]. The main mechanism of ultrasound effects including the cavitation and sonoporation effects. The cavitation effect helps in the size reduction of bubble, while the sonoporation effect leads to uptake of the reduced bubble. Despite adjusting the concentration of formulation components preliminary experiments showed inconsistent PS distribution may be due to the challenges in controlling the formulation variables of NBs. The amounts of drug (A), PLGA (B), PVA (C), and stirring speed (D) significantly influenced the PS, ZP and entrapment of the NBs and hence were considered as CQAs.
The QTPP were well-defined compared to the conventional product and are shown in table 2. The basis of QbD is identifying and accurate monitoring of CQAs. Achieving QTPP is feasible if CQAs are precisely established and kept within predetermined bounds [23]. NBs were created to increase the drug's stability, bioavailability, and biodistribution for targeted delivery to solve solubility problems and a short half-life. This can be enhanced by nanoscale PS reduction, in this experiment, PS, ZP and EE were chosen as CQAs. Table 2 offers a succinct summary of the chosen CQAs and an explanation.
Table 2: Selection of QTPP and CQAs and justification
| QTPP | Target | Justification |
| Formulation | Nanobubble | The selected formulation strategy facilitates targeted drug distribution to the intended site of action while improving half-life, stability, and bioavailability. |
| Route of administration | Oral | The available formulation in the market is oral; hence, we are attempting to increase the half-life and bioavailability. |
| Drug release | More significant as compared to PD | Decreased size can improve the rate of drug release. |
| Stability | Up to thirty days following formulation, no outward indications of aggregation or cake formation | Because particle size affects this formulation's efficiency, it is critical to keep it constant. |
| CQAs | ||
| CQA | Target | Justification |
| Particle size | In Nano-range | Reducing the size of the nanoscale increases surface area, which boosts release and distribution to the site. |
| Zeta Potential | In range-23.0 to 25.0 mV | It should be in range as it helps in the stability of the formed nanobubbles |
| EE | High | Higher EE helps to release the drug at the site |
In the study we employed a four-factor, three-level BBD with a total of twenty-nine leads with three centre points. The results from these randomized trials encompassing both he chosen independent and dependent variables are detailed in table 3. Multiple linear regression analysis (2FI) was utilized to build polynomial models, including quadratic, two-factor, and linear models. R2, predicted R2, adjusted R2, and coefficient of variance (C. V) were used in the model selection process. ANOVA was also used to evaluate the impact of various variables on the replies.
The PS (Y1) ranged from 126 nm to 760 nm, while the ZP (Y2) ranged from-38.86 mV to-12.34 mV. Likewise, the EE (Y3) ranged from 15.12 % to 62.46 % across all the trails. Multiple batches were analyzed to ensure reproducibility, with results confirming a consistent size distribution. The PS ranged from 126±5.2 nm to 134±4.7 nm across batches, with a PdI of 0.210±0.03, indicating uniformity.
Table 3: Runs designed for the trails
| Run | Factor 1 | Factor 2 | Factor 3 | Factor 4 | Response 1 | Response 2 | Response 3 |
| A: Amount of ibrutinib | B: Amount of PLGA | C: Amount of PVA | D: Stirring speed | Particle size | Zeta potential | Encapsulation efficiency | |
| mg | mg | % w/v | rpm | nm | mV | % | |
| 1 | 210 | 500 | 1.5 | 6000 | 186.89 | -23.56 | 40.44 |
| 2 | 280 | 375 | 1.5 | 6000 | 294.56 | -25.14 | 44.38 |
| 3 | 210 | 375 | 1.5 | 9000 | 354.82 | -12.34 | 25.67 |
| 4 | 140 | 375 | 1.5 | 6000 | 302.34 | -14.42 | 62.46 |
| 5 | 210 | 375 | 2 | 12000 | 162.86 | -18.64 | 20.12 |
| 6 | 140 | 375 | 1 | 9000 | 522.04 | -28.66 | 31.48 |
| 7 | 210 | 375 | 1 | 6000 | 659.12 | -20.24 | 30.78 |
| 8 | 210 | 375 | 1.5 | 9000 | 350.22 | -13.22 | 27.98 |
| 9 | 140 | 375 | 1.5 | 12000 | 208.96 | -16.82 | 43.56 |
| 10 | 210 | 250 | 1 | 9000 | 749 | -31.64 | 32.56 |
| 11 | 210 | 375 | 1.5 | 9000 | 348.76 | -13.42 | 27.12 |
| 12 | 210 | 500 | 2 | 9000 | 256.6 | -28.88 | 34.66 |
| 13 | 280 | 375 | 1.5 | 12000 | 144.78 | -29.92 | 26.12 |
| 14 | 280 | 375 | 1 | 9000 | 724.93 | -35.28 | 40.88 |
| 15 | 210 | 375 | 1.5 | 9000 | 354.54 | -14.26 | 24.22 |
| 16 | 210 | 500 | 1 | 9000 | 596.98 | -34.12 | 27.13 |
| 17 | 280 | 375 | 2 | 9000 | 126 | -31.28 | 28.34 |
| 18 | 210 | 250 | 2 | 9000 | 356 | -26.68 | 40.24 |
| 19 | 140 | 375 | 2 | 9000 | 400.6 | -20.12 | 54.66 |
| 20 | 280 | 500 | 1.5 | 9000 | 178.34 | -31.48 | 38.46 |
| 21 | 210 | 500 | 1.5 | 12000 | 248.66 | -30.66 | 23.98 |
| 22 | 140 | 500 | 1.5 | 9000 | 496.98 | -20.42 | 58.18 |
| 23 | 280 | 250 | 1.5 | 9000 | 582 | -28.64 | 41.78 |
| 24 | 140 | 250 | 1.5 | 9000 | 343.33 | -16.16 | 62.37 |
| 25 | 210 | 375 | 1.5 | 9000 | 354.54 | -14.26 | 24.22 |
| 26 | 210 | 250 | 1.5 | 12000 | 182 | -24.12 | 25.34 |
| 27 | 210 | 250 | 1.5 | 6000 | 510.56 | -23.06 | 45.88 |
| 28 | 210 | 375 | 1 | 12000 | 364.48 | -38.86 | 15.12 |
| 29 | 210 | 375 | 2 | 6000 | 138.34 | -29.54 | 37.12 |
PS
The small size of NBs results in a significantly higher surface area-to-volume ratio, enhancing their stability, penetrability, and reactivity in targeted drug delivery [24]. The model F value of 4025.53, which suggests a mere 0.01 percent possibility of being due to noise, indicates that the proposed model is ‘quadratic' and proved noteworthy with an insignificant lack of fit. The surface response (SR) and contour plots (CP) displaying the impact of various variables on PS is displayed in fig. 1 and the perturbation plot of all variables is shown in supplementary fig. 1. The “lack of fit F-Value” (2.28) indicates that any lack of fit is not statistically significant. There is 22.18 % chance that a “Lack of Fit F-value” of this magnitude would arise due to random noise, underscoring the model’s reliability. ANOVA found variables with a p-value of less than 0.0500 to impact the response significantly. ANOVA details are; Model Type: Quadratic; Model F-value: 4025.53; Lack of Fit F-value: 2.28 (not significant, indicating a good model fit); p-value:<0.0001 (significant model terms); R² (coefficient of determination): 0.9998; Adjusted R²: 0.9995; Predicted R²: 0.9987.
The R2, corrected R2, and anticipated R2 estimates were, in order, 0.9998, 0.9995, and 0.9987. The model explored the design space with a sufficient precision of 218.2206, exceeding the needed value 4. With p-values of less than 0.05, all the typical relationships (A and B) significantly affected the outcome. The terms A, B, C, D, AB, AC, AD, BC, BD, CD, B2, C2, and D2 are significant model terms. These variables are now regarded as being meaningful, and the subsequent equation for regression is given as follows:
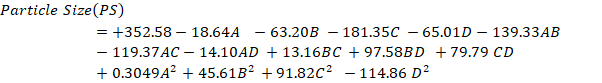
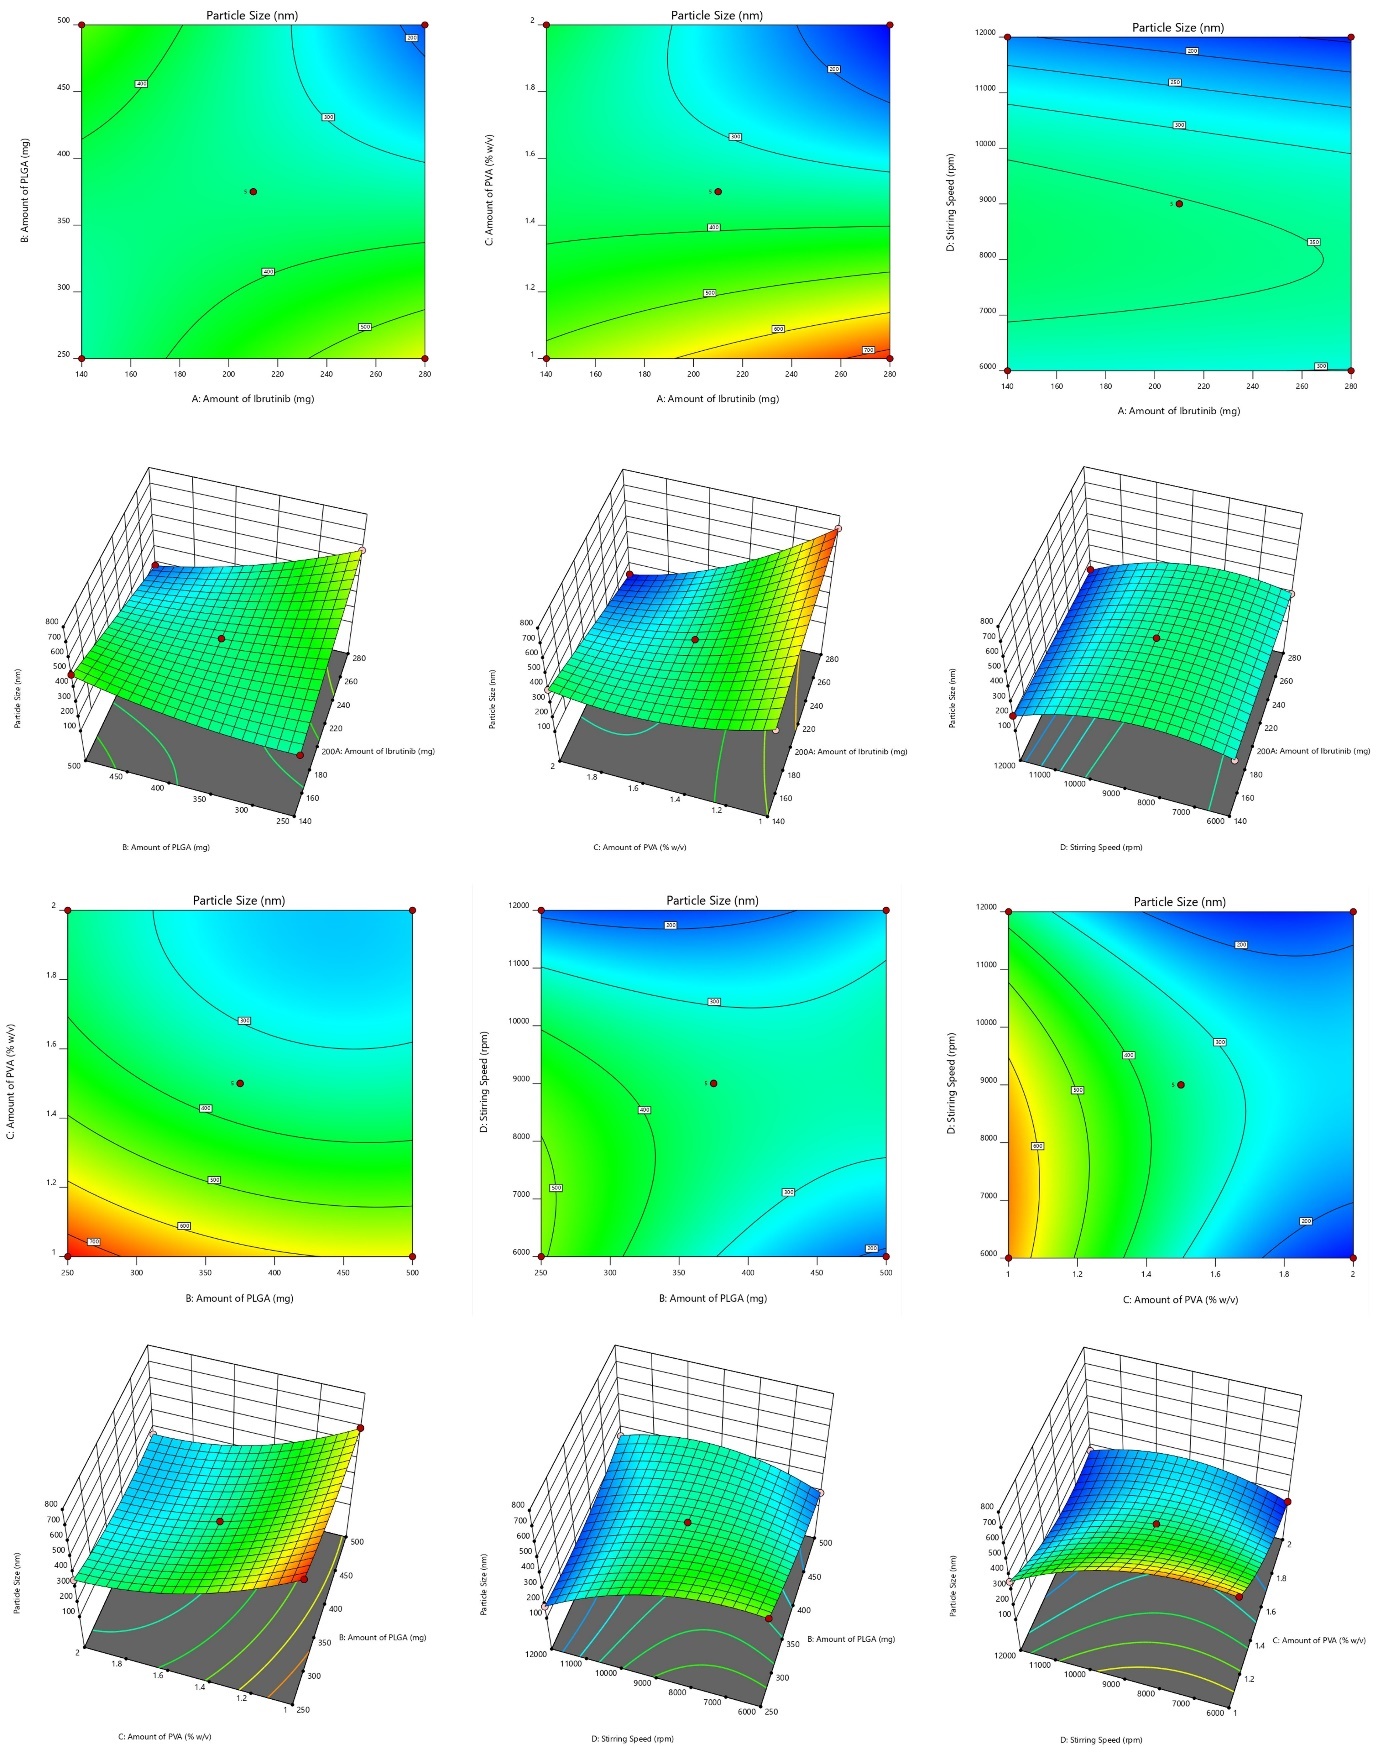
Fig. 1: Response surface and contour plots illustrating variable effects on particle size (PS)
Zeta potential
It is influenced by surface charges, shows an important role in the stability of nanoparticle suspensions and the initial interaction of nanoparticles with cell membrane, making it crucial for effective drug delivery [25]. In our study, the ZP of NBs ranged from-38.36 mV to – 12.34 mV. The quadratic model for ZP demonstrates notable statistical significance, illustrated by the substantial F-value of 76.84. Regression coefficients (R2, adjusted R2, and anticipated R2) were 0.9872, 0.9743, and 0.9326, respectively. The predicted R2 aligns closely with the adequate R2, differing by 0.2. The model, evidenced by adequate precision (signal-to-noise ratio) of 29.64, surpassing the necessary value of 4, proved useful for exploring the design space. Each individual variables (A, B, C and D), interactive terms (BD, CD,) and quadratic terms (A2, B2, C2 and D2) have a substantial effect on zeta potential, with P value below 0.0500 for all of them. ANOVA details are: Model Type: Quadratic; Model F-value: 76.84; Lack of Fit F-value: 2.85 (not significant); p-value:<0.05 for most model terms; R²: 0.9872; Adjusted R²: 0.9743; Predicted R²: 0.9326; Adequate Precision: 29.64.
The “lack of fit F-Value” (2.85) indicates that any lack of fit is not statistically significant. There is 16.25 % chance that a “Lack of Fit F-value” of this magnitude would arise due to random noise, underscoring the model’s reliability. Non-significant Lack of fit is good, and we want model to be fit. Consequently, these terms are deemed necessary, and the resulting regression equation is as follows:
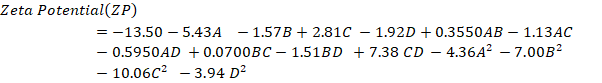
Positive coefficients indicate a positive connection, which implies that a rise in the associated variable or variables causes an increase in ZP. A negative correlation is implied by the negative coefficients, which show that a decline in the related variable or variables causes a reduction in ZP. The SR and contour plots (CP) demonstrating the consequence of variables on ZP is shown in fig. 2.
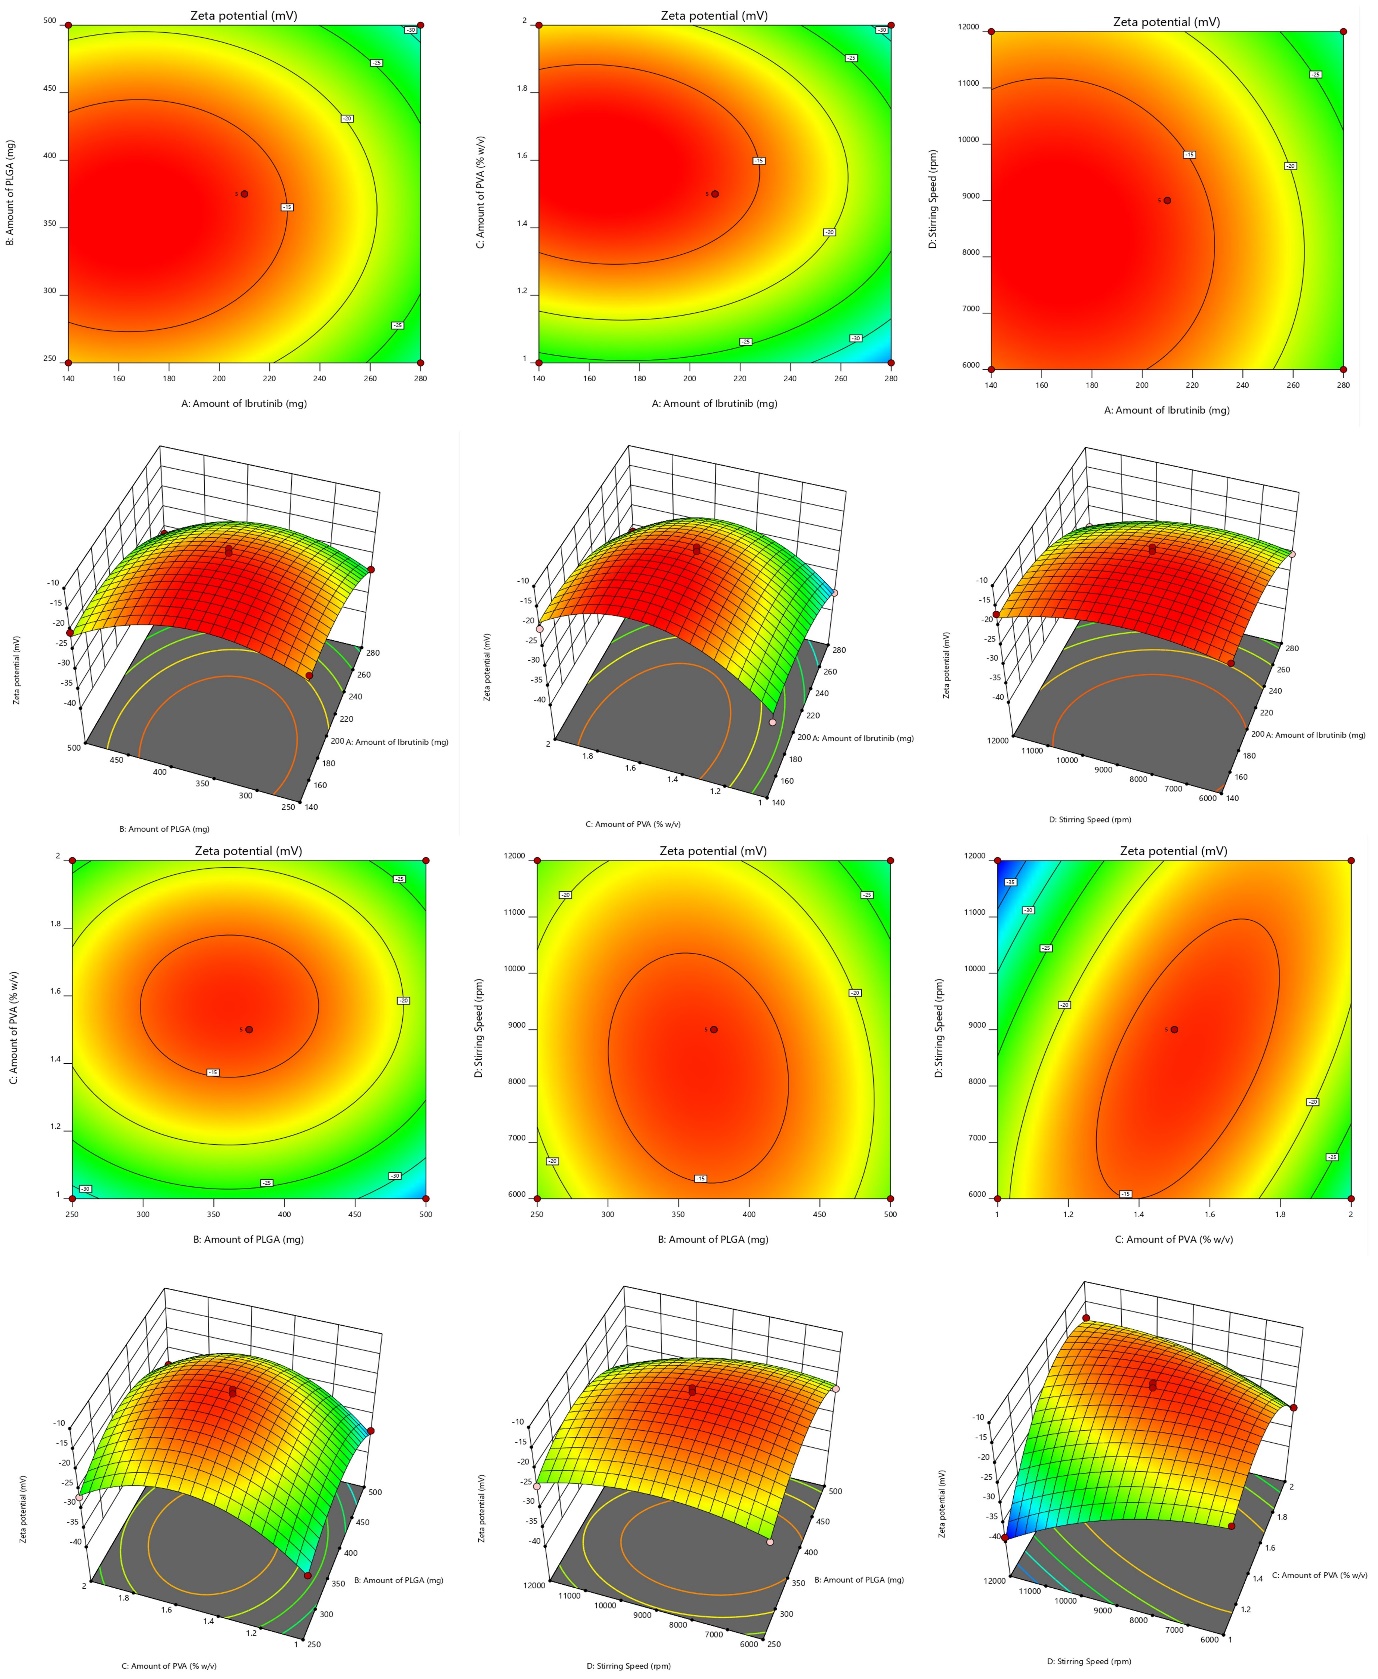
Fig. 2: Graphical representation of SR and contour plots (CP) demonstrating the consequence of variables on ZP
Entrapment efficiency (EE)
Impact on EE ranges from 62.46 to 15.12 percent. The NBs with high entrapment is always desirable to reduce the dose of the drug [26]. The model's F value of 34.31, with a 0.01% chance likely due to noise, indicates significance and negligible fit error for the suggested "quadratic" model. The lack of fit's F-value (3.87) isn't statistically significant based on pure error, with a 10.22% probability of being noise. ANOVA identified significant factors (p-value<0.0500), leading to removal of non-significant variables.
ANOVA details are: Model Type: Quadratic; Model F-value: 34.31; Lack of Fit F-value: 3.87 (not significant); p-value:<0.05 for key variables; R²: 0.9717; Adjusted R²: 0.9434; Predicted R²: 0.8484; Adequate Precision: 21.67.
Response surface and contour plots depicting the impact of variables on EE is shown in fig. 3. Regression coefficients (R2, adjusted R2, and anticipated R2) were 0.9717, 0.9434, and 0.8484, respectively. The predicted R2 aligns closely with the adequate R2, differing by 0.2. The model, evidenced by adequate precision (signal-to-noise ratio) of 21.67, surpassing the necessary value of 4, proved useful for exploring the design space. Model terms (A, B, C, D, AC, A², and B²) had p-values<0.050, signifying a significant effect. The resulting regression equation is:
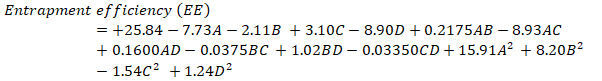
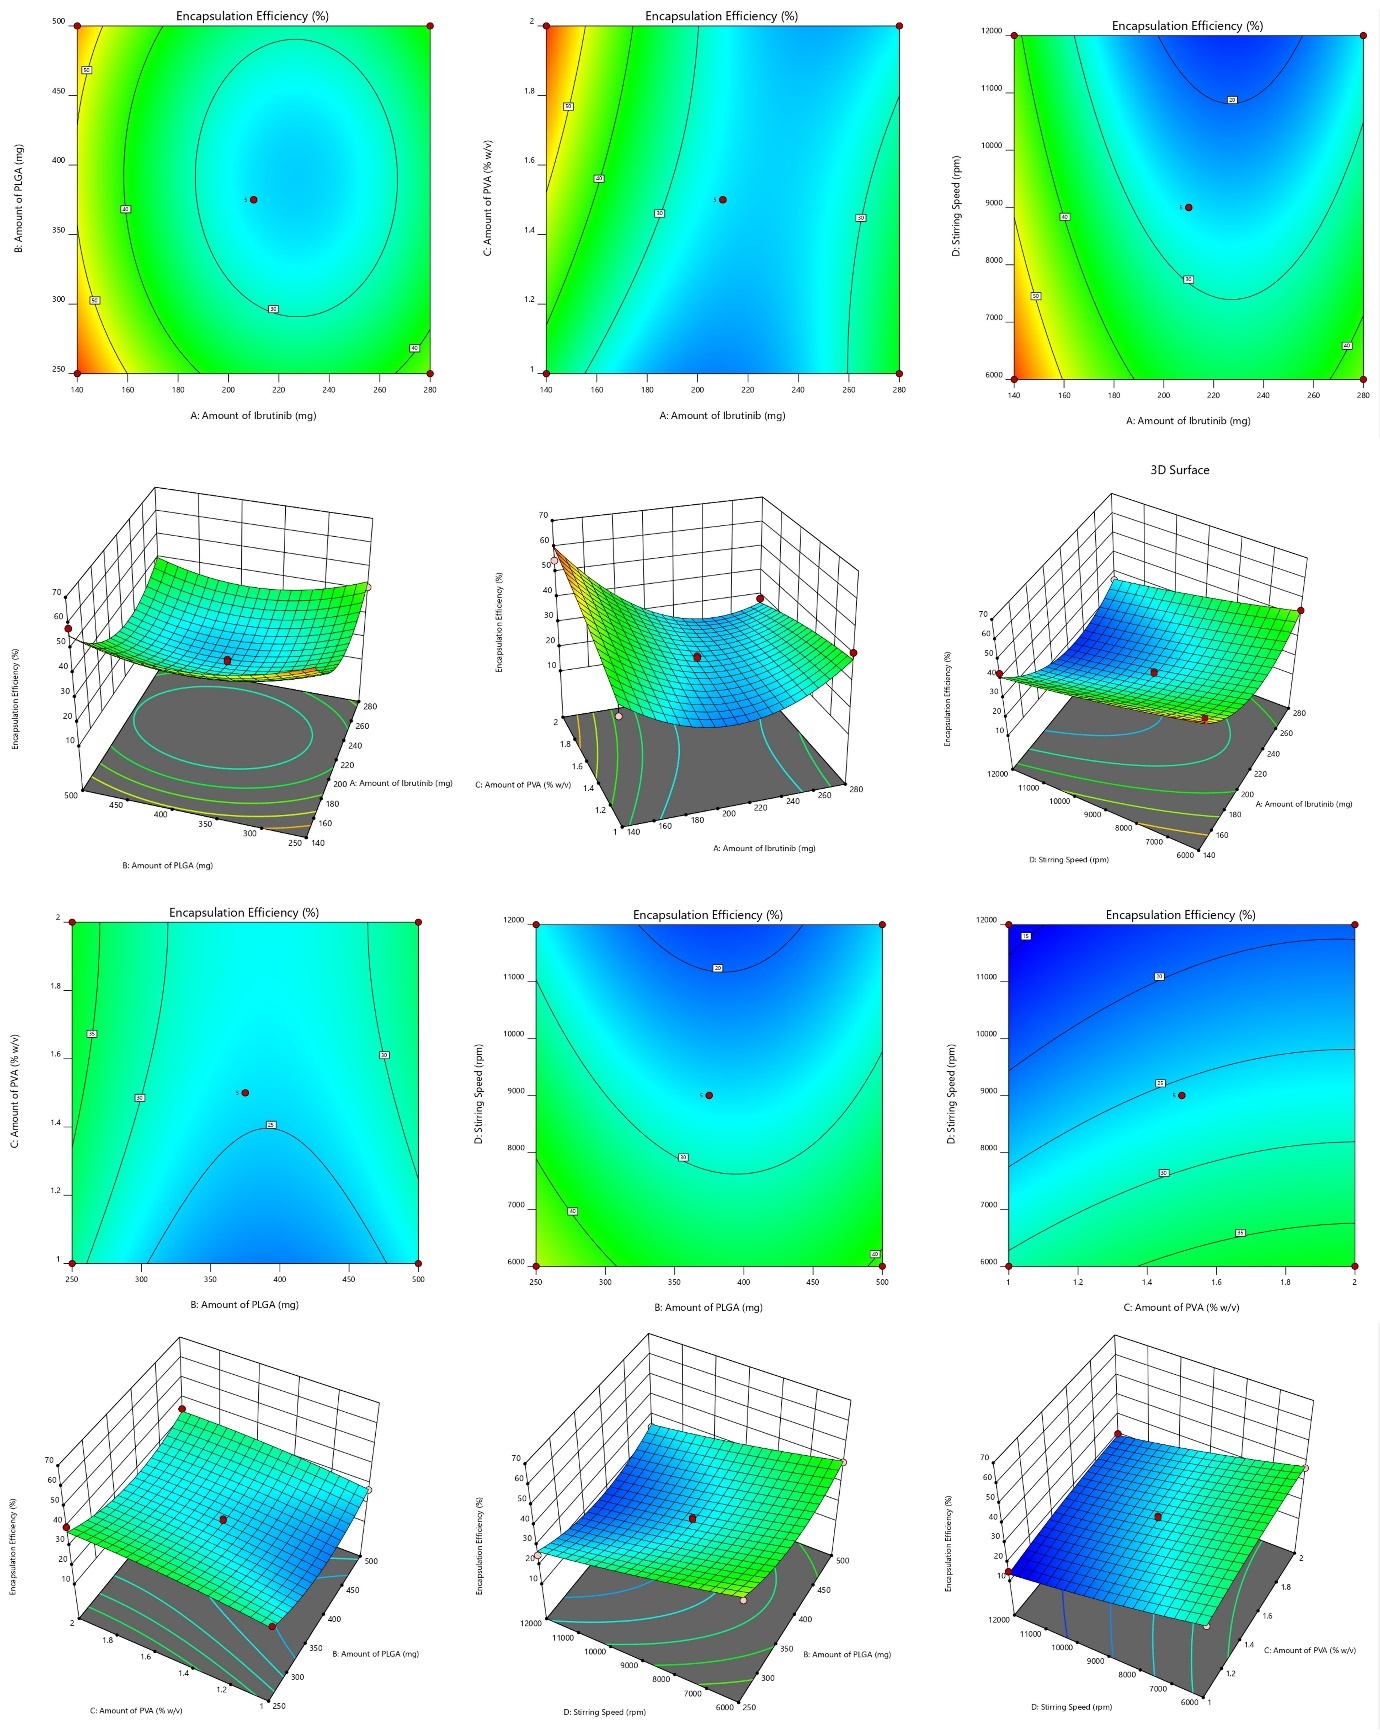
Fig. 3: Graphical representation of SR and contour plots (CP) demonstrating the consequence of variables on EE
Exploration for optimized preparation
The Derringers desirability technique was utilized to optimized the variables affecting response parameters. This involved transforming response into a desirability scale, amalgamating them into a geometric mean function through exhaustive searches, ultimately yielding a global desirability value. The optimum configuration (Fopt solution) with IBR is 140 mg, PLGA at 250 mg, stabilizer (PVA) at 1.37 %w/v with a stirring speed at 11627 resulted in a D value of 0.895. Narrowing the target values of CQAs, namely low PS, ZP and EE, allowed for further graphical customization. Fig. 4 presents the design space and overlay plot. During validation, three checkpoints were used to verify the model's robustness and formulation. As indicated in supp. Table 2, the projected mean standards for size were 129.97 nm with a ZP of -23.0 and EE of 49.089, respectively, while the observed mean values were130±13.3 nm, ZP of-23.0±0.89 and EE of 49.14±1.32.
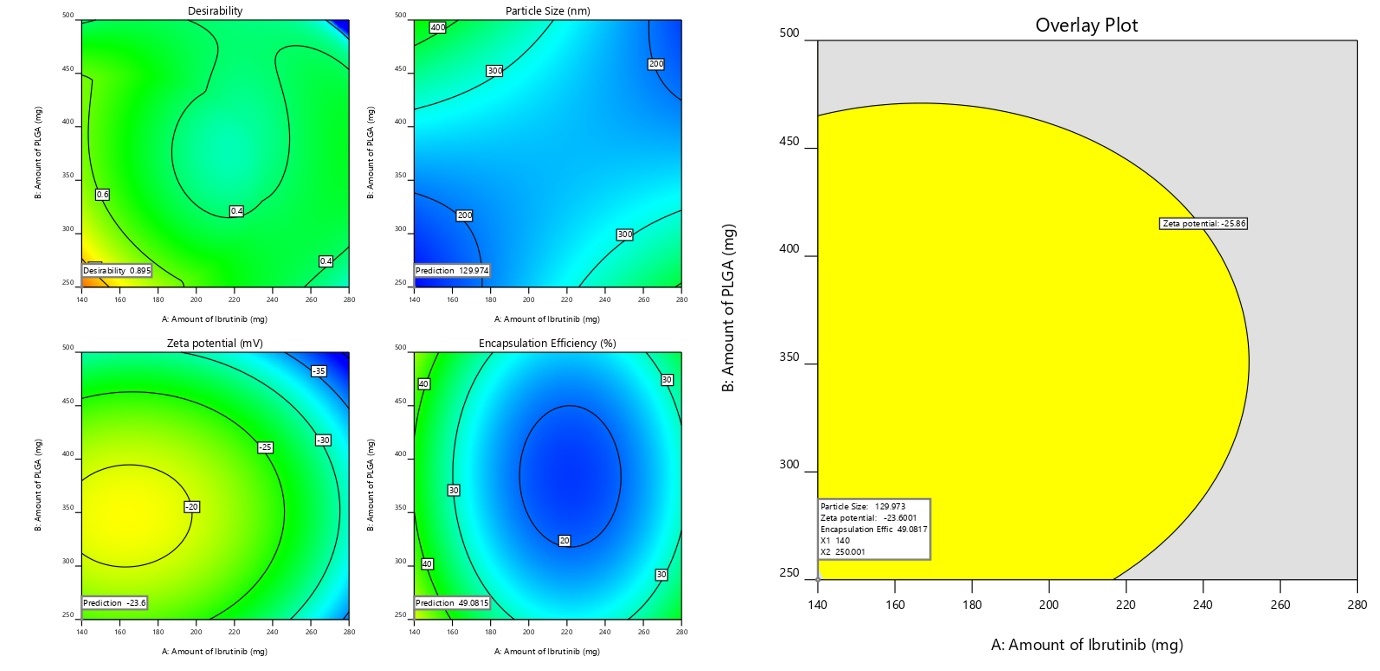
Fig. 4: Graphical illustration of desirability and overlay plot (yellow area denotes the feasible region)
Evaluation
PS, ZP, and EE
The nanosuspension uniformity and size were consistent because the produced formulation's PS, and PdI ranged from 130±13.3 nm and 0.182±0.013. A homogeneous system is indicated by a polydispersity value of less than 0.3 [27]. One can use the ZP to estimate the stability of NS, a property correlated with the stability theory called as double electric layer (DEL) present on the colloidal particles. The Z. P. of the optimized formulation was ZP of-23± 0.89 mV. The observed ZP is because of the stabilizer's steric stabilizing action around the particles. The EE was found to be 49.14±1.32 with a Drug loading of 23.46±2.81.
Scanning electron microscopy (SEM)
Fig. 5 shows the formulation's and the drug's exterior surface characteristics. In its authentic state, the drug has a broad PS range with distinct units and an irregular cubic form with micrometer-sized particles. However, in case of NBs formulation the drug into round nanosized particles with a consistent size of less than 200 nm, and the results correlate with the zeta sizer. SEM images confirmed a spherical morphology with smooth surfaces, indicative of uniform nanobubble formation. Scale bars (100 nm and 200 nm) were incorporated to provide clear reference points for particle dimensions, enhancing the accuracy of size analysis. This work shows that nanosizing effect, obtained via NBs creation, produced PS in nm range with low PdI [28].
Fourier transform infrared spectroscopy (FTIR) and DSC
Analyzing the nano formulation, excipients, and simple IBR IR spectra was used to determine component compatibility, as shown in fig. 5. 400–4000 cm–1 was the scanning range used. The simple drug showed distinct peaks at (1241, 1147, 1100, 986, and 953 cm-1). FTIR spectra were analyzed quantitatively, showing minor peak shifts at 1680 cm⁻¹ and 1512 cm⁻¹, indicating weak hydrogen bonding interactions, but no significant chemical modifications. As no new peaks were seen in the NBs preparation and PM it clearly indicates no chemical interaction between the stabilizer and medication. Fig. 5B reveals the DSC analysis of IBR, the stabilizer's physical combination, and the nanosuspension: The crystalline nature of IBR was confirmed by a strong melting peak at 158 °C, whereas the stabilizer demonstrated a peak at 58.96 °C. The DSC thermograms demonstrated loss of crystallinity, with the crystallinity index (CI) decreasing from 82.3% (plain drug) to 45.8% (NBs), confirming the amorphous transformation, which contributes to improved solubility and dissolution. These findings align with prior studies, indicating a crystalline-to-amorphous transition aided by precipitation [7, 8].
Drug release (DR)
Fig. 7 depicts dissolution profiles of plain drug, drug-loaded NBs without and with acoustic assistance in pH 7.4 phosphate buffer. Drug release from NBs was significantly higher than a simple drug suspension. Notably, ultrasound assistance increased drug release. After 8 h, cumulative drug release (CDR) was 20.43%, 46.94%, and 70.04% for plain drug, NBs without acoustic, and with acoustic, respectively. By 24 h, over 98.5% was released from NBs with acoustic assistance. Regulated and non-invasive, acoustic waves are ideal for precise drug administration and targeting [13, 15]. The role of acoustic cavitation in accelerating drug release was significant (p<0.01), as ultrasound exposure led to nanobubble disruption and enhanced drug diffusion, confirming its role as an effective release trigger. The bioavailability enhancement was statistically validated using ANOVA (p<0.001) and independent t-tests.
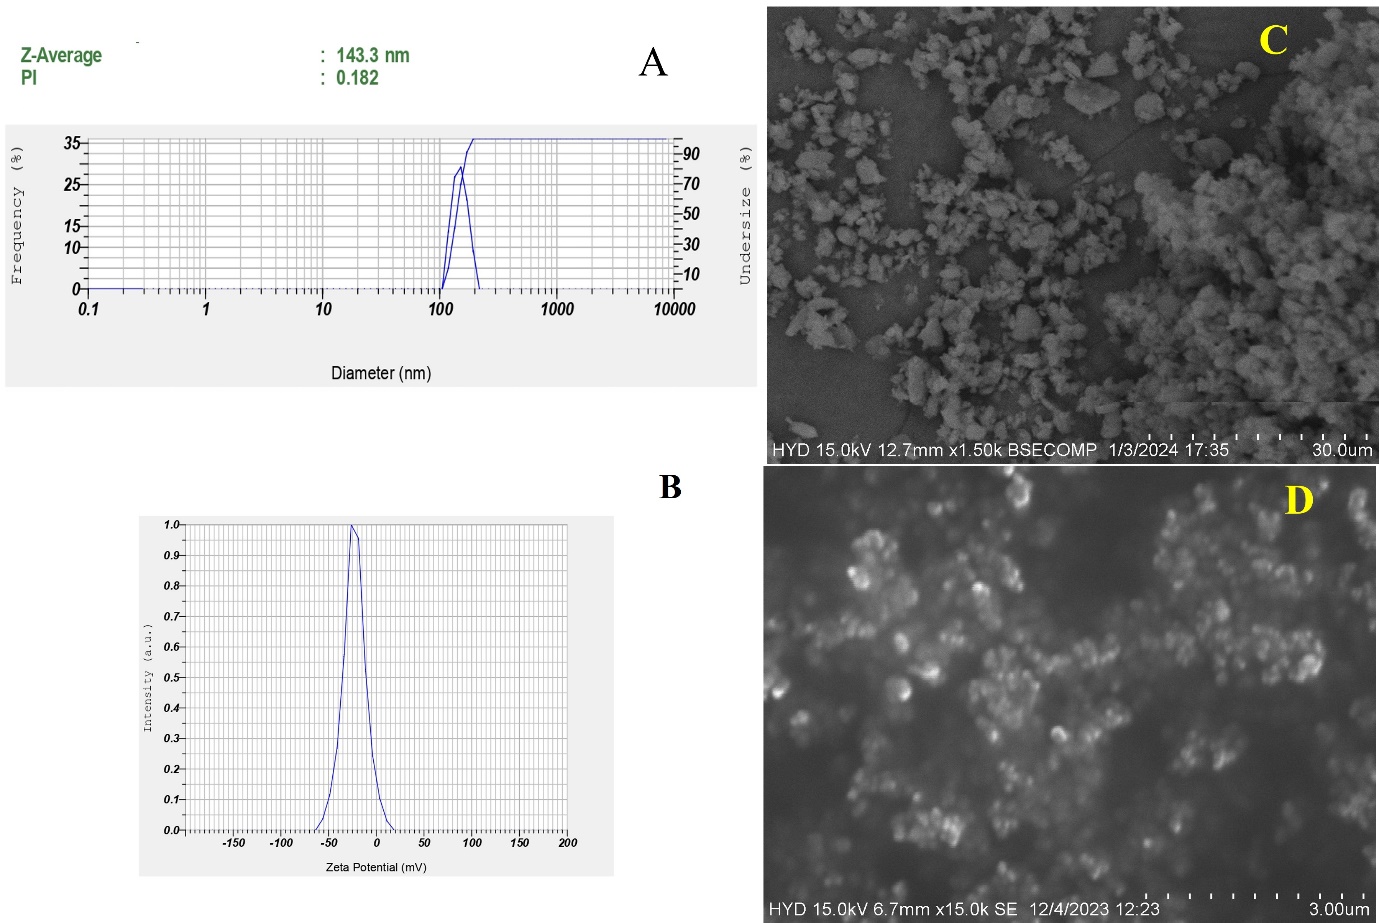
Fig. 5: Malvern image of A) Particle size and PdI; B) ZP; C) SEM image of pure drug; D) Nanobubbles (NBs)
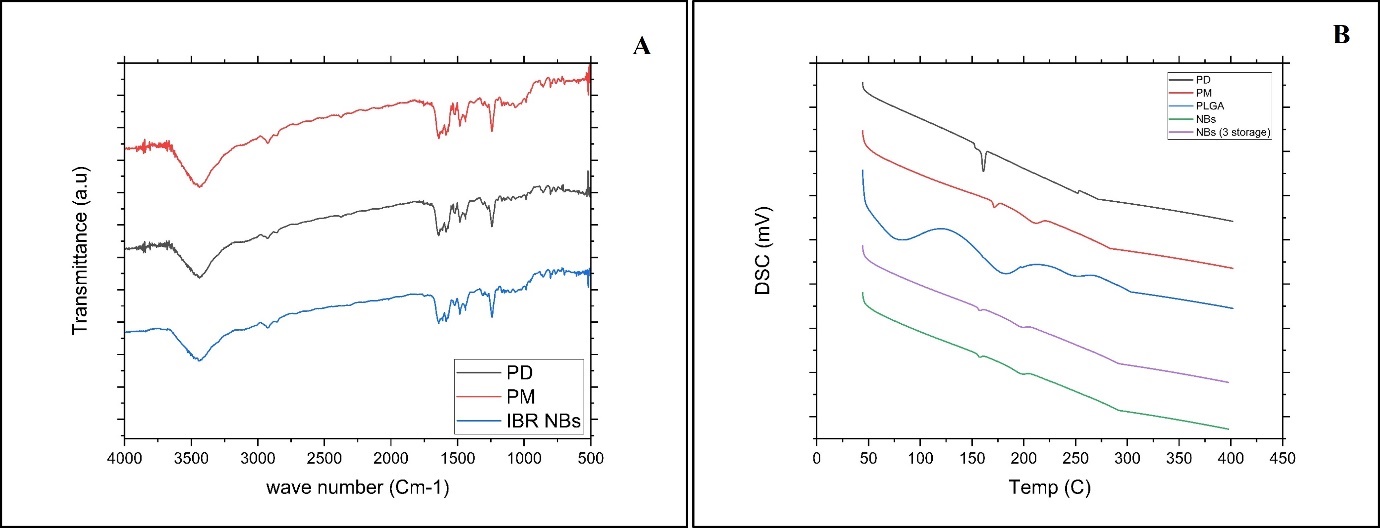
Fig. 6: A) Overlay of FTIR analysis PD (black line-IBR; PM (red line-Physical mixture; IBR NBs (Blue line-Nanobubble (NS). B) Overlay of DSC thermograms of PD (black line IBR); PM (Red line-Physical mixture; PLGA (Blue line); NBs (Green line-Nanobubble) and NBs 3 storage (Purple line-Nanobubbles stored for 3 mo)
Table 4: P. S, PdI and DE Ibrutinib-loaded nanobubbles stored at different temperatures
| Fopt | Initial (day 1) | 1 mo | 2 mo | 3 mo | |
| 4ºC | PS (nm) | 130±13.3 | 132.3±12.2 | 133.8±3.81 | 136.4± 14.0 |
| ZP | -23.0±0.89 | -23.1±0.66 | -23.24±0.55 | -22.88±0.66 | |
| EE (%) | 49.14±1.32 | 49.02±2.12 | 47.88±2.04 | 47.42±3.63 | |
| 25ºC | PS (nm) | 130±13.3 | 130.69±10.0 | 134.46±9.23 | 135.68±11.0 |
| ZP | -23.0±0.89 | -23.1±0.77 | -22.82±0.72 | -22.49±0.72 | |
| EE (%) | 49.14±1.32 | 48.85±1.36 | 47.32±2.06 | 47.14±2.66 | |
| 40ºC | PS (nm) | 130±13.3 | 132.46±12.8 | 134.20±12.4 | 150.4 ±8.60 |
| ZP | -23.0±0.89 | -22.82±0.46 | -22.22±1.16 | -22.0 ±1.38 | |
| EE (%) | 49.14±1.32 | 49.08±1.80 | 48.82±2.16 | 46.25±2.69 |
All the values were expressed in Mean±SD; (n=3)
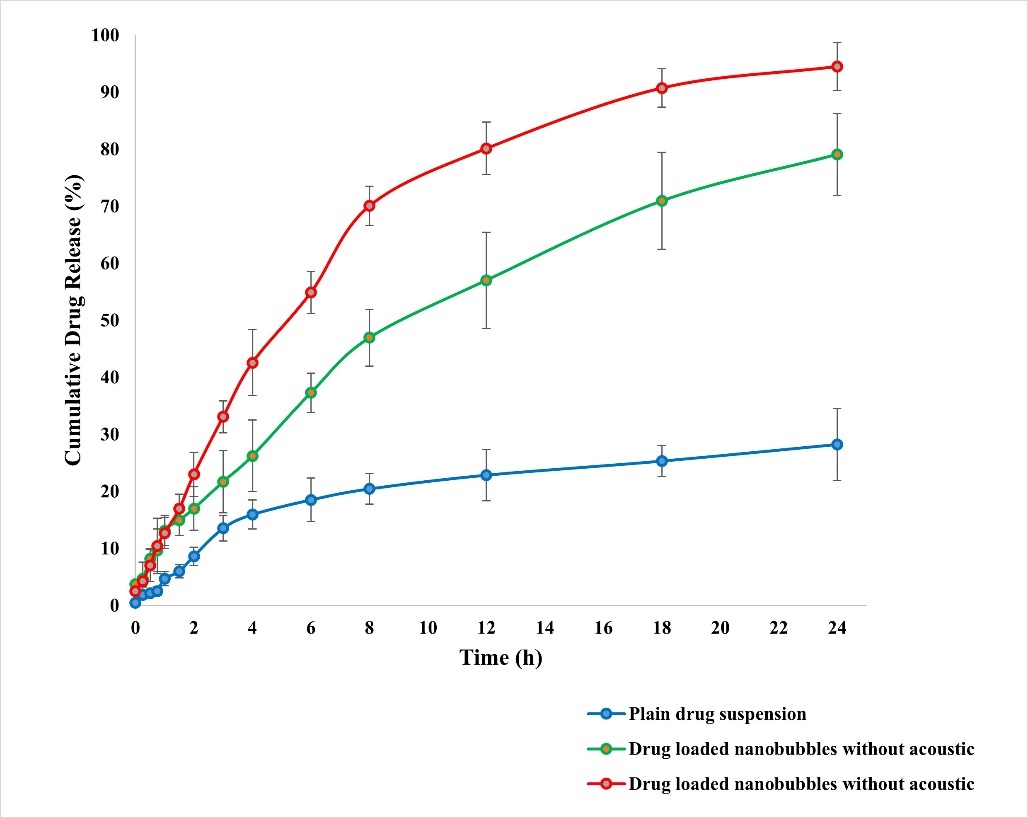
Fig. 7: In vitro DR display in the presence and absence of ultrasound aid, All the values were expressed in mean±SD, (n=3)
Evaluation of the stability of DBF NBs
DBF-loaded NBs underwent stability assessments at 4 °C, 25 °C, and 40 °C for 0, 1 mo, 2 mo, and 3 mo (table 4). At 4 °C and 25 °C, minimal changes in drug content indicated robustness, with EE showing little variation, suggesting protection against degradation. However, a notable reduction in entrapment (DE) occurred at elevated temperatures, indicating structural disruption. Throughout the experiment, PS of the formulation is less than 200 nm and ZP is around-22 to-23 mV, highlighting the stability and uniformity of IBR NBs. Storage in a polyethylene (PE) pouch led to a faster drop in number concentration compared to a glass bottle [29, 30]. Stability studies conducted at 4 °C, 25 °C, and 40 °C showed that PS remained stable at 4 °C and 25 °C, but at 40 °C, an increase in size (up to 180 nm) and PdI (0.38) was observed, suggesting minor aggregation. However, no precipitation occurred, and the drug release rate was only slightly affected at 40 °C, confirming acceptable stability under storage conditions. At 4 °C and 25 °C, the formulation exhibited minimal changes in drug content and EE, indicating satisfactory chemical stability and protection of the active molecule. However, at 40 °C, a significant reduction in EE was observed over time, suggesting thermal degradation or structural disruption of the nanobubble shell.
Table 5: Mathematical modeling of in vitro drug release
| Model | R² value | Interpretation |
| Zero-order | 0.876 | Poor fit; indicates non-linear release |
| First-order | 0.912 | Moderate fit; concentration-dependent release |
| Higuchi | 0.923 | Diffusion-controlled release |
| Korsmeyer–Peppas | 0.985 | Best fit; anomalous (non-Fickian) diffusion (n = 0.69) |
The release profiles were evaluated for plain IBR, NBs (without ultrasound), and ultrasound-triggered NBs. Drug release kinetics were analyzed using Korsmeyer-Peppas (R² = 0.985), Higuchi (R² = 0.923), and first-order (R² = 0.912) models, with the Korsmeyer-Peppas model providing the best fit, suggesting an anomalous (non-Fickian) diffusion mechanism.
Pharmacokinetic studies
Fig. 8 illustrates the plasma concentration-time curve after oral administration of the standard PD dispersed in sodium carboxy methylcellulose and the optimized NBs. Table 6 provides pharmacokinetic information, and fig. 15 shows the bioanalytical chromatogram. The IBR plasma NBs formulation displayed significantly higher area under the curve levels compared to the pure drug treatment.
Table 6: Pharmacokinetic parameters
| Pharmacokinetic parameters | Ibrutinib pure drug | Ibrutinib-loaded NBs |
| Cmax (ng/ml) | 1180.14±329.91 | 5138.13±190.784 |
| Tmax (h) | 2 | 3 |
| Half-life (h) | 2.506±0.44 | 4.622±0.74 |
| AUC 0-t (ng. h/ml) | 3921.813±184.11 | 31905.795±328.64 |
| AUC 0-inf (ng. h/ml) | 4239.230±261.12 | 34043.693±428.02 |
| Ke (h-1) | 0.353 | 0.114 |
| MRT(h) | 3.875± 0.63 | 9.480± 1.20 |
All the values were expressed in mean±SD; (n=3)
The Cmax increased 4.35-fold (p<0.01) and AUC0-t improved 8.13-fold (p<0.001), confirming significant enhancement. Additionally, the elimination half-life (t½) increased from 2.4±0.3 h (plain drug) to 5.1±0.5 h (NBs), indicating prolonged systemic circulation. No adverse effects were observed in rats post-administration, as confirmed by histopathological analysis, ensuring the safety of the NBs for further preclinical evaluation. Comparative analysis of previous formulations have been presented in table 7.
Table 7: Comparative analysis of ibrutinib formulations
| Formulation | Particle size (nm) | EE (%) | In vitro release (% at 24h) | Bioavailability increase | Targeting mechanism | Reference |
| Nanosuspension | 200–250 | 35–42 | ~55–60% | 3–4 fold | Passive (solubility enhancement) | Rangaraj et al., 2019 |
| SNEDDS | 100–150 | ~40 | ~75–80% | 5–6 fold | Passive (solubilization) | Qiu et al., 2018 |
| NLCs | 100–200 | 60–70 | ~85% | 6–7 fold | Lymphatic targeting | Rangaraj et al., 2020 |
| Chitosan NBs | ~180 | Not reported | ~70% | Not available | Passive (mucoadhesion, limited data) | Ponnaganti et al., 2021 |
| PLGA Nanobubbles (Current Study) | 130±13.3 | 49.14 | ~98.5% (ultrasound-triggered) | 8.13 fold | Passive (EPR)+ultrasound-triggered | Present study |
The comparative assessment of nanosuspension, SNEDDS, nanostructured lipid carriers (NLCs), and PLGA nanobubbles highlights a progression in nanocarrier design aimed at enhancing oral bioavailability and achieving targeted drug delivery.
Nanosuspensions (150–250 nm) enhance dissolution and absorption via increased surface area, achieving a 3–4-fold bioavailability improvement. Despite ease of preparation, they lack targeting capacity and suffer from physical instability (e.g., sedimentation, agglomeration). SNEDDS (100–150 nm) spontaneously form nanoemulsions in vivo, improving bioavailability by 5–6 fold through enhanced solubilization [6]. They offer better consistency in absorption but may exhibit poor drug loading, excipient-induced toxicity, and potential instability in varying GI conditions. NLCs (100–200 nm) combine solid and liquid lipids, enabling 6–7-fold bioavailability increases with lymphatic targeting. They allow sustained release and high drug entrapment but require complex optimization and may present issues with polymorphic transitions or lipid crystallization during storage. PLGA Nanobubbles (130±13.3 nm) demonstrated the highest bioavailability enhancement (8.13-fold) in the current study. Their dual targeting mechanism passive EPR and ultrasound-triggered release, enables spatially controlled delivery. However, challenges include high production complexity, scalability issues, and current limitations in regulatory acceptance [12].
In summary, while all systems improve bioavailability to varying extents, advanced carriers like NLCs and PLGA nanobubbles offer superior targeting and controlled release. However, these benefits come at the cost of formulation complexity, stability concerns, and limited clinical translation data. Selection should thus be based on a balance between therapeutic goals, formulation feasibility, and intended route of administration.
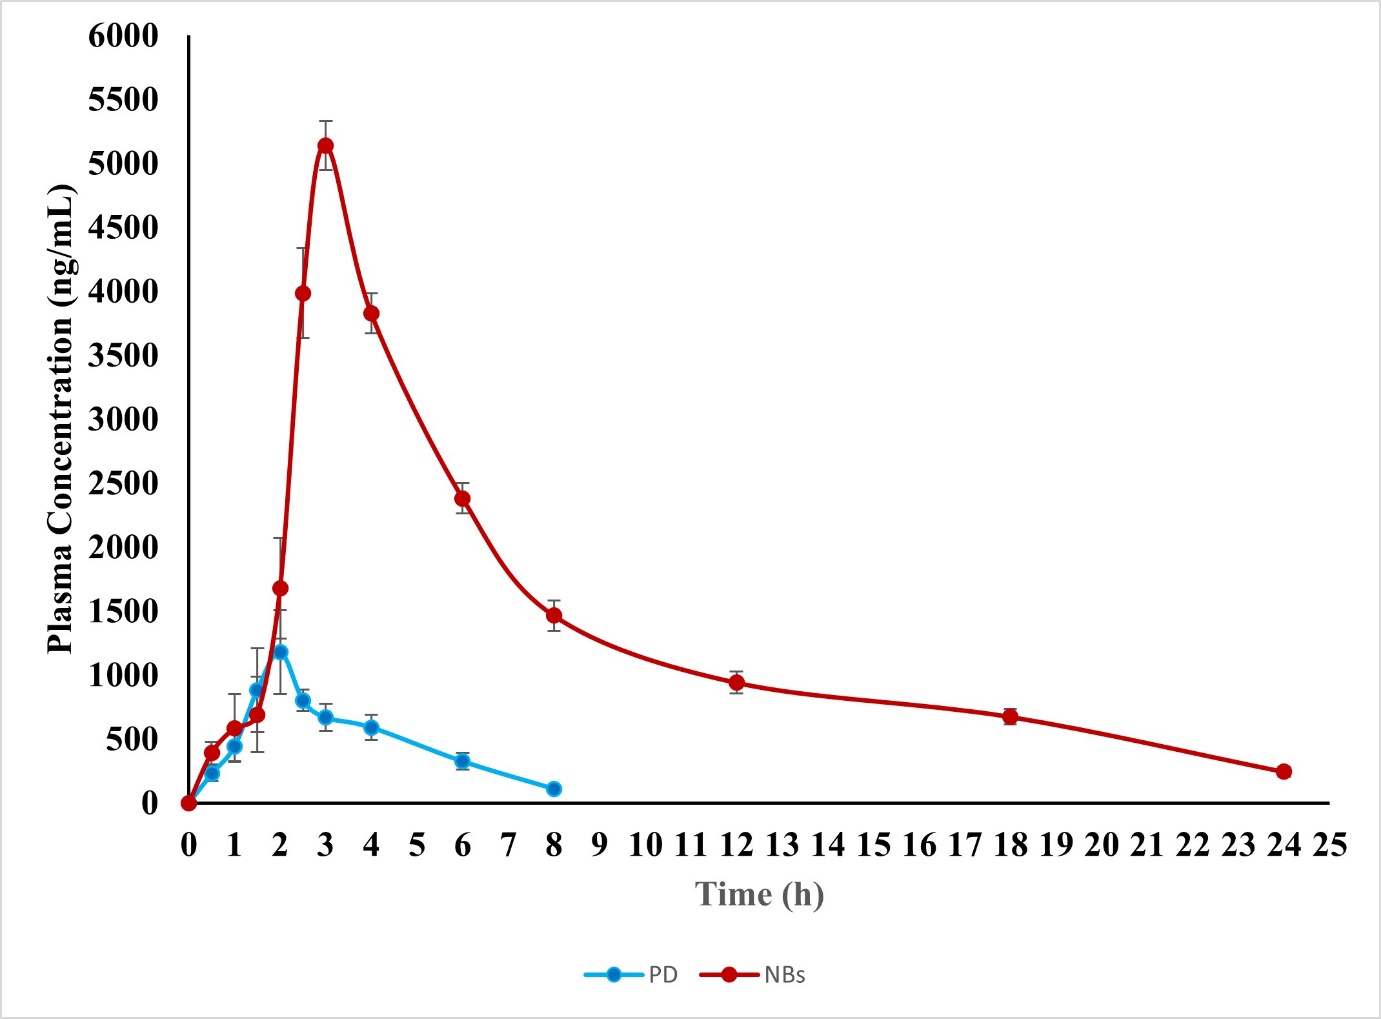
Fig. 8: In vivo pharmacokinetic studies, all the values were expressed in mean±SD; (n=3)
DISCUSSION
In this study, IBR-loaded PLGA nanobubbles (NBs) were successfully formulated using the solvent evaporation method, with process optimization achieved through the Box-Behnken Design (BBD). The use of NBs as a formulation strategy is gaining momentum in the field of targeted drug delivery due to their unique ability to localize drugs at specific sites, thereby minimizing off-target adverse effects [31, 32]. The integration of ultrasound with NBs further enhances drug localization, as ultrasound waves can trigger drug release at the target site through mechanisms such as acoustic cavitation, which increases cell membrane permeability and promotes drug uptake [12].
PLGA (poly(lactic-co-glycolic acid)) was selected as the carrier material for its well-established biocompatibility and biodegradability, making it a preferred choice in various medical applications, including sutures, bone implants, and sustained drug release systems [6]. The quadratic model proposed by the experimental design was applied to analyze particle size (PS), zeta potential (ZP), and entrapment efficiency (EE). Positive coefficients in the model indicated that increasing the associated variables led to higher drug entrapment, which is critical for maximizing the therapeutic efficacy of the formulation [33, 34].
Contour and 3D response surface plots demonstrated that all formulation variables influenced PS, while the stabilizer ratio had a particularly significant impact on both ZP and EE. This highlights the importance of optimizing the stabilizer concentration to achieve stable, highly entrapment-efficient NBs [12]. The NBs exhibited notable drug encapsulation and a low viscosity of 6.22 centipoise, which is advantageous for parenteral administration as it facilitates ease of injection and dispersion in biological fluids [17].
Compatibility studies using FTIR confirmed the absence of chemical interactions between the drug and excipients, while DSC analysis revealed no distinct drug peak in the formulation, indicating that the drug was present in an amorphous or molecularly dispersed state rather than as crystalline material [25]. This amorphous dispersion can contribute to improved drug solubility and bioavailability [26].
SEM imaging showed that the NBs were homogeneous, smooth, and spherical in shape, which is desirable for consistent drug delivery and predictable in vivo behavior. Drug release studies indicated that the application of ultrasound-induced collapse cavitation, leading to the rapid disruption of nanobubble structures and subsequent drug release [19]. The use of regulated, non-invasive acoustic waves enables precise, site-specific drug administration, reducing systemic exposure and potential side effects [35].
Our findings confirm that ultrasound plays a pivotal role in enhancing IBR release from NBs, likely through the cavitation effect, which facilitates the breakdown of the nanobubble shell and promotes drug diffusion [37]. Ultrasound stability studies further demonstrated the transformation of the gas core from nanodroplets to bubbles, a phenomenon known as acoustic droplet vaporization or generation. This transformation is crucial for the controlled release of encapsulated drugs in response to external stimuli [22].
The study’s results are consistent with previous reports on the stability of nanobubbles under different temperature conditions, emphasizing the need to understand the temperature-dependent behavior of PS, ZP, and EE for practical drug delivery applications [14]. The interaction of different polymeric materials with nanobubble dispersions also affected NB concentration, likely due to variations in hydrophobic interactions, which can influence the stability and performance of the delivery system [34].
In vivo pharmacokinetic studies in Wistar rats revealed a sustained drug release profile from the NBs, resulting in a prolonged time to reach maximum plasma concentration (tmax). This sustained release is advantageous for maintaining therapeutic drug levels over an extended period, potentially improving patient compliance and therapeutic outcomes [33]. The enhanced oral bioavailability observed with the NB formulation compared to the free drug can be attributed to increased drug circulation time at the nanoscale and improved tissue penetration facilitated by the polymeric carrier [34].
Overall, these findings underscore the potential of PLGA-based NBs, especially when combined with ultrasound, as a promising platform for targeted and controlled drug delivery. Future studies should focus on further optimizing formulation parameters, scaling up production, and evaluating long-term safety and efficacy in clinical settings.
CONCLUSION
The study demonstrates that IBR-loaded NBs significantly enhance solubility, dissolution, and bioavailability while enabling ultrasound-triggered drug release. However, certain formulation limitations must be addressed for clinical translation. Scalability remains a key challenge, as the homogenization-based fabrication method may require optimization for large-scale production while maintaining particle uniformity and stability. Additionally, the choice of perfluoropropane gas necessitates further evaluation regarding its long-term safety and regulatory approval for human use.
The phrase "sustained targeted drug release" has been revised to "triggered drug release," as NBs enable ultrasound-responsive release rather than prolonged passive diffusion. Future research should focus on patient-specific dosing strategies, optimizing ultrasound parameters for controlled release, and exploring intravenous versus oral administration feasibility. Regulatory challenges, including stability under physiological conditions, long-term toxicity studies, and biocompatibility evaluations, must be systematically addressed. Additionally, establishing a strong in vitro/in vivo correlation (IVIVC) will be essential for predicting clinical outcomes and ensuring a smooth transition from preclinical to clinical trials.
FUNDING
Nil
AUTHORS CONTRIBUTIONS
B. V l and D. V. R. N. B planned the study and performed as per the protocol. V. V. R and P. P performed the data analysis, whereas P. S and G. A guided the process to prepare the manuscript.
CONFLICT OF INTERESTS
Declared none
REFERENCES
Pandey V, Pandey T. Chitosan functionalized nanobubbles for precision oncology: advances in targeted cancer therapeutics. J Mater Chem B. 2024;12(43):11076-88. doi: 10.1039/d4tb01930j, PMID 39385619.
Estupinan HY, Berglof A, Zain R, Smith CI. Comparative analysis of BTK inhibitors and mechanisms underlying adverse effects. Front Cell Dev Biol. 2021 Mar 9;9:630942. doi: 10.3389/fcell.2021.630942, PMID 33777941.
Eisenmann ED, Fu Q, Muhowski EM, Jin Y, Uddin ME, Garrison DA. Intentional modulation of ibrutinib pharmacokinetics through CYP3A inhibition. Cancer Res Commun. 2021 Nov;1(2):79-89. doi: 10.1158/2767-9764.crc-21-0076, PMID 34950932.
Piskin S, Sevim Akan H, Armutcu C, Uzun L. Collagen nanobubbles as efficient carriers for targeted controlled release of ibrutinib. J Mater Chem B. 2024;12(46):12050-61. doi: 10.1039/d4tb01608d, PMID 39441099.
Jin J, Yang L, Chen F, Gu N. Drug delivery system based on nanobubbles. Interdisciplinary Materials. 2022;1(4):471-94. doi: 10.1002/idm2.12050.
Qiu Q, Lu M, Li C, Luo X, Liu X, Hu L. Novel self-assembled ibrutinib phospholipid complex for potently peroral delivery of poorly soluble drugs with pH-dependent solubility. AAPS PharmSciTech. 2018 Aug;19(8):3571-83. doi: 10.1208/s12249-018-1147-4, PMID 30209789.
Rangaraj N, Pailla SR, Chowta P, Sampathi S. Fabrication of ibrutinib nanosuspension by quality by design approach: intended for enhanced oral bioavailability and diminished fast fed variability. AAPS PharmSciTech. 2019 Aug;20(8):326. doi: 10.1208/s12249-019-1524-7, PMID 31659558.
Rangaraj N, Pailla SR, Shah S, Prajapati S, Sampathi S. QbD aided development of ibrutinib loaded nanostructured lipid carriers aimed for lymphatic targeting: evaluation using chylomicron flow blocking approach. Drug Deliv Transl Res. 2020 Oct;10(5):1476-94. doi: 10.1007/s13346-020-00803-7, PMID 32519202.
Darji AA, Bharadia PD. Chronic myelogenous leukemia: a review and update of current and future therapy. Int J Pharm Pharm Sci. 2016 Jul;8(7):35-46.
Jin J, Yang L, Chen F, Gu N. Drug delivery system based on nanobubbles. Interdisciplinary Materials. 2022 Dec;1(4):471-94. doi: 10.1002/idm2.12050.
Rocha CV, Goncalves V, Da Silva MC, Banobre Lopez M, Gallo J. PLGA-based composites for various biomedical applications. Int J Mol Sci. 2022 Feb;23(4):2034. doi: 10.3390/ijms23042034, PMID 35216149.
Shakya G, Cattaneo M, Guerriero G, Prasanna A, Fiorini S, Supponen O. Ultrasound responsive microbubbles and nanodroplets: a pathway to targeted drug delivery. Adv Drug Deliv Rev. 2024 Mar;206:115178. doi: 10.1016/j.addr.2023.115178, PMID 38199257.
Ponnaganti M, Kishore Babu A. Preparation, characterization and evaluation of chitosan nanobubbles for the targeted delivery of ibrutinib. Int J Pharm Pharm Sci. 2021 Aug;8(6):1-12.
Kumar MK, Prakash DJ, Rao VV. Chitosan nanobubbles development and evaluation for the delivery of sunitinib an anticancer agent. Int J App Pharm. 2022 Nov;14(6):58-67. doi: 10.22159/ijap.2022v14i6.45821.
Arafath AA, Jayakar B. Enhancement of oral bioavailability via solid lipid nanoparticles of anticancer drug dasatinib an in vitro cytotoxicity and pharmacokinetic study. Asian J Pharm Clin Res. 2019 Jun;12(6):143-5. doi: 10.22159/ajpcr.2019.v12i6.33135.
Hernandez C, Abenojar EC, Hadley J, De Leon AC, Coyne R, Perera R. Sink or float? Characterization of shell-stabilized bulk nanobubbles using a resonant mass measurement technique. Nanoscale. 2019 Jan;11(3):851-5. doi: 10.1039/c8nr08763f, PMID 30601524.
Zhou L, Wang S, Zhang L, Hu J. Generation and stability of bulk nanobubbles: a review and perspective. Curr Opin Colloid Interface Sci. 2021 Sep;53(1):101439. doi: 10.1016/j.cocis.2021.101439.
Reddy KS, Bhikshapathi D, Kumar JP. Unlocking dabrafenib’s potential: a quality by design (QBD) journey to enhance permeation and oral bioavailability through nanosponge formulation. Braz J Pharm Sci. 2025;61(1):e24209. doi: 10.1590/s2175-97902025e24209.
Kyzas GZ, Mitropoulos AC. From bubbles to nanobubbles. Nanomaterials (Basel). 2021 Oct;11(10):2592. doi: 10.3390/nano11102592, PMID 34685033.
Batchelor DV, Armistead FJ, Ingram N, Peyman SA, McLaughlan JR, Coletta PL. The influence of nanobubble size and stability on ultrasound-enhanced drug delivery. Langmuir. 2022;38(45):13943-54. doi: 10.1021/acs.langmuir.2c02303, PMID 36322191.
Rasmussen MK, Pedersen JN, Marie R. Size and surface charge characterization of nanoparticles with a salt gradient. Nat Commun. 2020 Apr;11(1):2337. doi: 10.1038/s41467-020-15889-3, PMID 32393750.
Danaei M, Dehghankhold M, Ataei S, Hasanzadeh Davarani F, Javanmard R, Dokhani A. Impact of particle size and polydispersity index on the clinical applications of lipidic nanocarrier systems. Pharmaceutics. 2018 Apr;10(2):57. doi: 10.3390/pharmaceutics10020057, PMID 29783687.
Alheshibri M, Al Baroot A, Shui L, Zhang M. Nanobubbles and nanoparticles. Curr Opin Colloid Interface Sci. 2021 Dec;55(43):101470. doi: 10.1016/j.cocis.2021.101470.
SU C, Ren XJ, Nie F, Li T, LV W, Li H. Current advances in ultrasound combined nanobubbles for cancer targeted therapy: a review of the current status and future perspectives. RSC Adv. 2021 May;11(21):12915-28. doi: 10.1039/d0ra08727k, PMID 35423829.
Margheritelli S. Exploring chitosan shelled nanobubbles to improve HER2+immunotherapy via dendritic cell targeting. Drug Deliv Transl Res. 2022;12(11):2590-603.
Laxmi BV, Bhikshapathi D, Sailaja Rao P. Optimization and enhancement of oral bioavailability of dabrafenib as nanobubbles using quality by design approach. Pharm Sci. 2025 Jan;31(1):xx-xx. doi: 10.34172/PS.2024.32.
Danaei M, Dehghankhold M, Ataei S, Hasanzadeh Davarani F, Javanmard R, Dokhani A. Impact of particle size and polydispersity index on the clinical applications of lipidic nanocarrier systems. Pharmaceutics. 2018 Jun 25;10(2):57. doi: 10.3390/pharmaceutics10020057, PMID 29783687.
Prabhakar A, Banerjee R. Nanobubble liposome complexes for diagnostic imaging and ultrasound-triggered drug delivery in cancers: a theranostic approach. ACS Omega. 2019;4(13):15567-80. doi: 10.1021/acsomega.9b01924, PMID 31572858.
Alheshibri M, Al Baroot A, Shui L, Zhang M. Nanobubbles and nanoparticles. Curr Opin Colloid Interface Sci. 2021 Oct;55(43):101470. doi: 10.1016/j.cocis.2021.101470.
Begum MY, Gudipati PR. Formulation and evaluation of dasatinib-loaded solid lipid nanoparticles. Int J Pharm Pharm Sci. 2018 Dec;10(12):14-20. doi: 10.22159/ijpps.2018v10i12.27567.
Su C, Ren XJ, Nie F, Li T, Lv W, Li H. Current advances in ultrasound combined nanobubbles for cancer targeted therapy: a review of the current status and future perspectives. RSC Adv. 2021 May 6;11(21):12915-28. doi: 10.1039/d0ra08727k, PMID 35423829.
Foudas AW, Kosheleva RI, Favvas EP, Kostoglou M, Mitropoulos AC, Kyzas GZ. Fundamentals and applications of nanobubbles: a review. Chem Eng Res Des. 2023 Jan;189(4):64-86. doi: 10.1016/j.cherd.2022.11.013.
Cho CH, Shin HJ, Singh B, Kim K, Park MH. Assessment of sub-200-nm nanobubbles with ultra-high stability in water. Appl Water Sci. 2023 Jul;13(7):1-10. doi: 10.1007/s13201-023-01950-1.
Meegoda JN, Aluthgun Hewage S, Batagoda JH. Stability of nanobubbles. Environ Eng Sci. 2018 Nov;35(11):1216-27. doi: 10.1089/ees.2018.0203.
Aliabouzar M, Quesada C, Chan ZQ, Fowlkes JB, Franceschi RT, Putnam AJ. Acoustic droplet vaporization for on-demand modulation of microporosity in smart hydrogels. Acta Biomater. 2023 Jul 1;164:195-208. doi: 10.1016/j.actbio.2023.04.037, PMID 37121372.
Palanati M, Bhikshapathi DV. Development, characterization and evaluation of entrectinib nanosponges loaded tablets for oral delivery. Int J App Pharm. 2023 Nov-Dec;15(6):269-81. doi: 10.22159/ijap.2023v15i6.49022.
Wang X. Development of folate conjugated nanobubbles for targeted ultrasound imaging and drug delivery in ovarian cancer. Front Pharmacol. 2022;13:835678.