
Int J App Pharm, Vol 17, Issue 4, 2025, 358-369Original Article
QUALITY BY DESIGN ASSOCIATED IBRUTINIB LOADED NANOSUSPENSION FOR AMELIORATED DISSOLUTION USING NANO BALL MILLING AND SPRAY DRYING METHODS
VALLABH DEULKAR, RAGHUVEER PATHURI*
Department of Pharmaceutics, GITAM School of Pharmacy, Hyderabad Campus, GITAM (Deemed to be University), India
*Corresponding author: Raghuveer Pathuri; *Email: rpathuri@gitam.edu
Received: 06 Mar 2025, Revised and Accepted: 05 May 2025
ABSTRACT
Objective: The aim of the present work was to enhance the solubility, reduce fast-fed variability, and increase the oral bioavailability of Ibrutinib (IBR), a Biopharmaceutical Classification System (BCS) class II drug, through the development of a Nanosuspension (NS) formulation.
Methods: Ibrutinib Nanosuspension (IBR NS) was formulated using a three-factor, three-level Box-Behnken Design (BBD). The NS was prepared using a nano ball mill followed by spray drying, with Hypromellose and sodium lauryl sulfate as stabilizers. The particle size and Polydispersity Index (PDI) were measured, and the role of Vitamin E D-α-Tocopheryl Polyethylene Glycol 1000 Succinate (TPGS) as a stabilizer was evaluated. The formulation was characterized using Scanning Electron Microscopy (SEM), X-Ray Diffraction (XRD), Fourier Transform Infrared Spectroscopy (FTIR), and Differential Scanning Calorimetry (DSC). Stability studies were conducted over a 90-day storage period.
Results: The particle size of the NS after nano ball milling ranged from 294.53 to 408.83 nm, with PDI values between 0.075 and 0.278. After spray drying with Vitamin E TPGS, the particle size was further reduced to 135.6 nm. SEM images confirmed the presence of distinct spherical nanoparticles. XRD, FTIR, and DSC studies demonstrated excellent compatibility between the drug and the stabilizers. The formulation remained stable over 90 days of storage. The solubility of IBR NS increased by 12.96-fold compared to the plain drug. In dissolution medium,>94% drug release was achieved within 2 h compared to 63% for plain IBR. Structural characterization confirmed amorphization and compatibility.
Conclusion: The developed IBR NS significantly enhanced solubility, reduced fast-fed variability, and improved oral bioavailability. The use of Hypromellose, sodium lauryl sulfate, and Vitamin E TPGS as stabilizers proved effective in achieving a stable and optimized formulation. This approach holds promise for improving the delivery of poorly soluble drugs like IBR.
Keywords: Hypromellose, Ibrutinib, Fast fed variability, Nanosuspension, Nano-ball mill, Sodium lauryl sulfate
© 2025 The Authors. Published by Innovare Academic Sciences Pvt Ltd. This is an open access article under the CC BY license (https://creativecommons.org/licenses/by/4.0/)
DOI: https://dx.doi.org/10.22159/ijap.2025v17i4.54129 Journal homepage: https://innovareacademics.in/journals/index.php/ijap
INTRODUCTION
Cancer remains a leading global cause of death, marked by uncontrolled cell growth, invasion, and metastasis, distinguishing malignant from benign tumors. According to the International Agency for Research on Cancer, over 14 million new cancer cases and 8 million related deaths occur annually, with projections reaching 23.6 million cases by 2030. Traditional treatments like chemotherapy, radiation, and surgery can suppress tumor growth but often cause systemic toxicity, recurrence, and physiological issues. Chemotherapy remains the primary approach, though its lack of specificity results in widespread side effects [1, 2].
A major hurdle in chemotherapy is Multi-Drug Resistance (MDR), often driven by mechanisms like reduced drug uptake and enhanced efflux through transporters such as P-glycoprotein (P-gp) [3]. P-gp actively pumps out chemotherapeutic agents, reducing intracellular drug concentration and therapeutic efficacy [4]. Overcoming this requires inhibiting P-gp or downregulating its expression [5]. P-gp not only affects cancer drug efficacy but also complicates dosing and increases the risk of toxicity [6]. Strategies like using P-gp inhibitors, prodrugs, or nanoparticles can enhance drug retention in cancer cells and improve outcomes [7].
Ibrutinib (IBR), used in treating cancers like Chronic Lymphocytic Leukemia (CLL) and Mantle Cell Lymphoma (MCL), inhibits Bruton's Tyrosine Kinase (BTK) but faces limitations due to P-gp-mediated efflux, reducing its efficacy [8, 9]. With low oral bioavailability (2.9%) and poor solubility (0.002 mg/ml), IBR requires high doses, increasing side effects. Additionally, food intake nearly doubles its exposure [10, 11]. Various formulation strategies, including phospholipid complexes, Nanosuspensions (NS), nanostructured lipid carriers (NLCs), and Self-Nanoemulsifying Drug Delivery Systems, have been explored to improve bioavailability, though issues like cost and scalability persist [12-14].
IBR undergoes extensive first-pass metabolism via CYP3A4, resulting in low systemic bioavailability (~2.9%). Additionally, it is a known substrate for P-gp, an efflux transporter that actively pumps it out of intestinal epithelial and cancer cells. This dual limitation—enzymatic degradation and efflux—drastically reduces therapeutic efficiency. Incorporating D-α-Tocopheryl Polyethylene Glycol 1000 Succinate (TPGS), a P-gp inhibitor, in a NS platform can enhance intracellular drug accumulation and bypass efflux mechanisms.
This study explores a novel approach combining nanotechnology with natural P-gp inhibition. Specifically, NSs of IBR were developed using ball milling and spray drying, incorporating Vitamin E TPGS as a P-gp inhibitor to counteract MDR and enhance drug bioavailability [15, 16]. To date, no studies have reported combining nanoball milling with natural P-gp inhibitors for oral administration [17].
NSs were chosen over other systems like liquid nanoparticles and micelles due to their simplicity, high drug loading, and scalability. Unlike micelles, which may disassemble in vivo, or lipid carriers that face stability issues, NS offers a robust platform for poorly soluble drugs [13]. While bottom-up methods are cost-effective, they suffer from particle uniformity issues. In contrast, top-down approaches like ball milling offer better control but are more resource-intensive [18, 19]. In this study, a Box-Behnken Design (BBD) optimized formulation and process variables. Characterization included Fourier Transform Infrared Spectroscopy (FTIR), Differential Scanning Calorimetry (DSC), X-Ray Diffraction (XRD), and Scanning Electron Microscopy (SEM), with dissolution tests confirming improved bioavailability.
MATERIALS AND METHODS
Dr Reddys Laboratories Pvt. Ltd., Hyderabad, India, provided us with ibrutinib. Sigma-Aldrich® in India provides a variety of chemicals, such as TPGS (tocopheryl polyethylene glycol succinate), Tween®80, Hypromellose (Hydroxypropyl methylcellulose (HPMC with viscosity of between 2.4-3.6 cP), Sodium lauryl sulfate, Polyvinyl pyrollidone (PVP K 30). Lactose monohydrate (Pharmattose 200) was acquired from TCI Chemicals. Solvents of analytical grade were purchased from Merck pvt ltd, India.
Formulation and optimization of NS using wet media milling technique (Stage-A)
IBR NS was formulated by using nano ball mill (Fritsch Pulverissete 7, Germany). Briefly, 100 mg of drug was added into 2 ml of aqueous stabilizer solution as per table 1. The aqueous dispersion was stirred with the help of vortex mixer until complete wetting of all the drug particles take place. Then the well-mixed dispersion was introduced into the bowels containing milling media (2g of 0.3 mm stainless steel balls). Then, the milling was performed at different rpm for obtaining desired range of particle size (PS) with 5 min on and 5 min of cycles. The formed suspension was characterized for PS, Polydispersity Index (PDI), and Zeta Potential (ZP) [19].
The selection of stabilizer-to-drug ratio, stirring speed, and milling time was based on initial pre-screening studies that indicated their significant impact on PS and PDI. Stirring rate directly influences shear forces during milling, affecting particle breakage efficiency. The stabilizer ratio determines steric and electrostatic stabilization, while milling time impacts size reduction without inducing thermal degradation. These were selected as critical factors based on preliminary results and literature reports supporting their role in particle engineering.
Spray drying of the suspension (Stage-B)
The NS was processed using a Buchi mini spray dryer (B-190, depicted in fig. 2), which employs a co-current flow mechanism where both the atomized product and the heated drying air travel in the same direction and atomization was achieved using a two-fluid nozzle. In brief, the NS formulated with ball mill was mixed with Vitamin E Polyethylene glycol succinate (Vitamin E TPGS) of 5% w/v and Lactose Monohydrate of 10 %w/v and mixed well. The operational parameters were established as follows: inlet temperature at 110 °C, outlet temperature at 55 °C, aspiration air flow rate adjusted to 1400 rpm, and feed pump speed set to 16 rpm. A cyclone separator was utilized to isolate the particles, with the smallest particles being captured in a filter bag [19]. The final product, labeled as SDP-F, was immediately sealed in airtight containers for subsequent analysis, with particular emphasis on evaluating PS and production yield.
The inlet and outlet temperatures (110 °C and 55 °C) were optimized to ensure rapid solvent removal without thermal degradation of IBR. Lower temperatures led to incomplete drying and agglomeration, while higher temperatures reduced drug content. The airflow rate and feed speed were selected to balance particle yield and prevent wall deposition. These conditions resulted in consistent morphology, narrow PDI, and over 85% yield, aligning with prior nanodrying optimization studies.
Formulation by designing (FbD) method
The development of IBR-loaded NS employs a comprehensive Quality by Design (QbD) approach, a methodical strategy endorsed by regulatory agencies for its systematic nature and predefined objectives. This approach, gaining traction in both industrial and academic spheres, aligns with ICH Q8 guidelines, emphasizing risk understanding through existing data, experimental design (Design of Experiments; DoE) implementation, and effective statistical management throughout the product lifecycle. QbD offers advantages over traditional methods, including cost-effective quality assurance and enhanced process understanding [20].
Fbd process begins with a definition of a quality-targeted product profile, followed by the performance of a risk analysis that points to identifying Critical Success Factors (CSFs), Critical Process Parameters (CPPs), and Critical Quality Attributes (CQAs). This process then delineates the design space through the optimization of factor screening and experimental planning, specifying feasible and infeasible areas based on various combinations of variables. Regulatory agencies recognize operations conducted within this framework [21].
The FbD process starts with Quality Target Product Profile (QTPP), which identifies the objectives and optimal characteristics that the product must meet to ensure its quality, safety, and efficacy. CQAs are the ones identified as critical that must lie within set limits to ensure the quality of the product. In this step, other variables that may influence CQAs are identified; these are sorted out as CFAs (formulation factors) and CPPs (process factors), which are respectively related to formulation and process. This systematic approach helps in carrying out a comprehensive analysis of the variables that influence the final formulation and further enables an enhanced understanding of the product development process.
Pre-screening investigations
CQAs can be influenced by a wide range of elements, and taking them into careful consideration during the design process can take some time by filtering the variables using the one-factor-at-a-time (OFAT) method, this procedure was made simpler, reducing the impact of individual components and improving the statistical model’s predicted accuracy. The CQAs chosen were the ZP, PS, and PDI.
Table 1: Factors for design of experiment (drug used is 100 mg)
| Variables | Levels | |||
| -1 | 0 | +1 | ||
| A | Stabilizer to drug ratio (Chosen based on preliminary screening to ensure particle size reduction while maintaining stability) | 1.0 | 1.50 | 2.0 |
| B | Stirring rate (RPM) (Selected based on its impact on shear forces, ensuring effective particle size reduction) | 600 | 800 | 1000 |
| C | Milling time (min) (Optimized to balance energy input while preventing excessive heat generation that may impact drug stability) | 30 | 45 | 60 |
| Responses | Constraints | |||
| Y1 | Particle size (nm) | Minimize | ||
| Y2 | PDI | Minimize |
Experimental design
To assess how input factors, such as CFAs and CPPs, affect the CQAs, the experimental design uses a methodical approach. The sample size needed for the coefficient estimate is significantly reduced with a BBD by utilizing an incomplete block and the exponential approach. This design is as cost-effective as central composite designs [20]. Table 1 looks at three independent parameters: milling duration, stirring rate (rpm), and stabilizer-to-drug concentration (%) in connection to dependent variables such as PS and PDI. Every element is assessed at three different levels.
Response Surface charts and two-dimensional contour plots were generated by the Response Surface analysis using Design Expert® software (Version 12, Stat-Ease Inc., Minneapolis, MN). This analysis helps to make the relationships between the causes and solutions easier to perceive and comprehend. The CQAs and QTPP for the NS formulation are shown in table 2. This information serves as a foundation for assessing the formulation's quality and performance characteristics against predetermined targets and specifications. This structured experimental approach allows for a comprehensive evaluation of the formulation parameters, enabling optimization of the NS properties and ensuring alignment with quality objectives.
Investigating for the ideal possible formulation
To optimize the formulation, a function of desirability was applied, assigning scores from 0 to 1, with higher values indicating greater likelihood of achieving desired outcomes. Visual optimization complemented this approach by exploring the design space graphically. Design validation employed checkpoint analysis involving three confirmatory experiments at specific points within the design space. Results from these trials were compared to predicted values to assess model accuracy. This comprehensive optimization and validation process enhances formulation robustness, increasing confidence in the final product's quality and performance. The approach ensures a thorough evaluation of formulation parameters and alignment with predetermined quality objectives.
NS characterization
Evaluation of PS, PDI, and ZP
Ball milling and spray drying were used to acquire the PS, ZP of IBR NS and PDI. These characteristics were ascertained by applying the theory of dynamic light scattering ((DLS) and analyzing the data with a Malvern zeta sizer (Nano ZS, Malvern Instruments, United Kingdom). Before being analyzed at 25 °C using the same apparatus, the samples were triple-distilled water and reconstituted ten times. Following three measurements, the formulation's ZP was assessed in addition to the Z-average (d. nm) and PDI values being computed [22].
FTIR: fourier-transform infrared spectroscopy
The FTIR spectra were obtained using a Bruker Optics Tensor 27 spectrometer manufactured in Germany, with a resolution of 1.0 cm-1. The study included the drug in its pure form (IBR), as well as its excipients (Hypromellose, SLS, Vit-E-TPGS, Lactose), a physical mixture, a ball milling formulation (BM-F), and a spray-dried nano-formulation (SD-F). The analysis spanned wave numbers ranging from 4000 to 400 cm-1 [23].
DSC: differential scanning calorimetry
To ascertain the drug’s physicochemical characteristics and evaluate any possible chemical interactions with its excipients, DSC testing was carried out. Thermograms of the drug, excipients (Hypromellose, SLS, Vit-E-TPGS, Lactose), physical mixture (PM), ball milled nano-formulation (BM-F), and optimized spray-dried nano-formulation (SD-F) were recorded under nitrogen atmosphere using a DSC calorimeter (DSC-60, Kyoto, Japan). Heating was performed at a rate of 5 °C/min across a temperature interval of 400 °C [24].
XRD
The X-ray diffraction patterns were recorded using a Philips X-ray diffractometer operative underNi-filtered copper Kα radiation at 40 kV along with a graphite monochromator at 100mV. The samples were scanned between 2 and 80 degrees 2 theta (θ) angle from 2° to 60° with an average step size of 0.045° and a duration per step of 0.5 sec [27].
SEM: scanning electron microscopy
The NS formulations (BM-F and SD-F) and the plain drug (PD) were imaged using the Quanta FESEM 250 scanning electron microscope (SEM). The samples were mounted on aluminum pin stubs using double-sided carbon tape adhesive before being imaged. The samples were sputter-coated with gold (Au) using an ion sputter coater. The SEM was run at an accelerating voltage of 30 kV while the examination was carried out at a working distance of 10 mm with magnifications ranging from 500x to 10,000x [25].
Saturation solubility studies
In order to investigate saturation solubility, three milliliters of triple-distilled water were placed in screw-cap vials together with an excess of IBR, its physical mixture with excipients, and the BM-F and SD-F formulations separately. To make sure the medicine was well dispersed, the vials underwent a two-to three-minute sonication. Following a 72 h incubation period at 37 °C on a shaker (SI 200D; UK), the samples underwent a 10 min centrifugation at 8000 rpm using a Thermo Fisher, Sorvall WX 100. A UV-visible spectrophotometer with a 258 nm setting was used to measure the drug concentration after the clear supernatant was filtered through a 0.22 μm Millipore filter [26].
Dissolution investigation
In dissolution investigation, biorelevant fluids were employed to achieve a precise approximation of in vivo function. Drug release tests were carried out in media containing Fed State Simulated Gastric Fluid (FeSSGF), Fed State Simulated Gastric Fluid (FeSSIF), Fasted State Simulated Gastric Fluid (FaSSGF), and Fed State Simulated Intestinal Fluid (FeSSIF). A USP type II equipment was used to perform the dissolving tests for both the pure medication and the improved formulation (Model DS 1400, Lab India, Mumbai), (SD-F, equivalent to 100 mg). 250 ml of dissolving media were used for each sample, and the experiment was run at 37±0.5 °C and 50 revolutions per minute. Three-milliliter aliquots were taken out and replaced with new dissolution media at predetermined intervals. After passing the samples through nylon membrane syringe filters (Sigma-Aldrich, 0.1 µm in size), the drug concentration was determined at 248 nm using a UV-visible spectrophotometer. A comparison was made of the percentage of drug released between the pure drug and the NS. To ensure uniformity, the study was conducted three times [27].
Stability studies
The three ideal SD-F settings were maintained at 4-8 °C, 40 °C, and 28±2 °C for three months in order to undertake stability investigations. A zeta-sizer was used to periodically assess the samples for PS and PDI on day 0, day 15, after one month, and after three months [22].
Analytical statistics
GraphPad Prism (GraphPad Software, version 8.05, CA), a statistical program, was used to perform additional analysis on the variables.
RESULTS AND DISCUSSION
Formulation and optimization of NS
Two primary techniques are used for preparing NSs: top-down and bottom-up methods. Significant study has been conducted in the last few years on the wet milling technique, a top-down method, for the preparation of NSs. In the present study, NS of IBR was developed using wet nano ball milling technique (Fritsch Pulverissete 7, Germany). The pictorial representation of the nano ball milling is shown in fig. 1. Using a combination different stabilizer such as tween 80, Sodium Lauryl Sulphate (SLS), Hypromellose and combination of Hypromellose and SLS as a stabilizer.
SLS acts as a surfactant to lower surface tension and prevent particle aggregation. Additionally, it inhibits P-gp-mediated drug efflux, contributing to increased intracellular drug concentration. HPMC functions as a steric stabilizer, preventing nanoparticle aggregation through polymeric shielding and enhancing wettability. Tween 80 was selected due to its role in stabilizing drug particles in dispersion while improving permeability and bioavailability.
The optimization studies with DoE are presented in the next part. Based on the surface response graphs that were acquired at the conclusions of the DoE, the optimum formulation was determined, and more research was conducted using the chosen formulation. The optimized formulation was subjected to spray drying (fig. 1). Nano ball milling reduced PS, spray drying further refined the nanoparticles to a smaller range by removing excess solvent and inducing amorphization. The DSC and XRD results indicate a transition from a crystalline to a more amorphous state, contributing to improved dissolution.
Implementing designing by formulation approach
Improving bioavailability and solubility was the main goal of the IBR NS design. The QTPP, which were distinctly defined in relation to the conventional product, are shown in table 3. The goal of Quality by Design (QbD) is to precisely identify and track CQAs. It is feasible to attain the intended QTPP if CQAs are precisely defined and kept within predetermined bounds. Reducing the size of the nanoparticles can increase the drug’s solubility because of its low water solubility. PS and PDI were chosen as the primary CQAs in this investigation. A dimensionless metric called the PDI evaluates the system’s uniformity of PS distribution. An overview and justification for the chosen CQAs are given in table 2 [29, 30].
Table 2: Screening of surfactant for ball milling
| Polymer | Conc. (% w/v) | PS | PDI |
| Tween 80 | 0.5 | 2246.54±268.33 | 0.567±0.24 |
| Tween 80 | 1 | 1790.22±446.1 | 0.424±0.28 |
| SLS | 0.25 | 636.21±82.06 | 0.35±0.31 |
| Hypromellose | 0.25 | 964.36±126.14 | 0.423±0.098 |
| Hypromellose | 0.5 | 772.39±86.35 | 0.368±0.06 |
| PVP k30 | 0.5 | 1286.54±69.03 | 0.502±0.16 |
| Hypromellose | 1% | 482.64±63.84 | 0.366±0.087 |
| SLS+Hypromellose | 0.25+0.5 | 438.76±54.78 | 0.262±0.12 |
| SLS+Hypromellose | 0.25+1 | 398.38±23.2 | 0.182±0.26 |
All the values were expressed in (n=3) Mean±SD
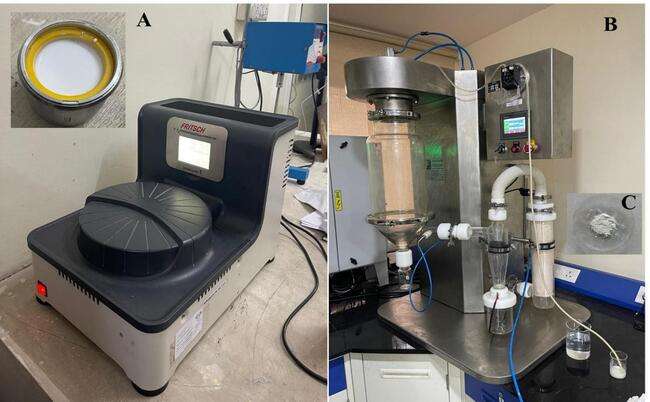
Fig. 1: IBR-NS developed using ball mill (A) followed by spray dryer technique (B) and spray dried product (C)
Stabilizer screening
Accurately, 100 mg of IBR trial batches in 2 ml of the aqueous stabilizer were used to decide the stabilizer, which result in low PS and with less PDI. "The use of an appropriate stabilizer at an ideal concentration ensures that the nanoparticles remain thermodynamically stable, preventing agglomeration and Ostwald ripening”. It also reduces interfacial tension, inhibits crystal growth, and acts as an electrostatic or steric barrier between particles. To find the ideal amount, tests were conducted with different stabilizer concentrations. Table 3 displays the average PS and PDI for various stabilizers.
The order in which the selected variables (PS and PDI) rose was Hypromellose<SLS<PVP K-30<Tween-80. With the lowest PS and PDI of all of them, Hypromellose generated the most uniform NS. Maintaining stability is essential, and the formulations' physical stability was assessed. All formulations showed cake formation, with the exception of the SLS formulation, but over period it resulted in high PDI [22]. Whereas the PVP K-30 stabilizing formulations demonstrated apparent particle segregation and as reported by researchers with high PDI. The Hypromellose stabilized formulation resulted in a uniform and stable formulation with a less particle at a concentration of 1% w/v (482.64±63.84 nm) as compared to other stabilizers. During the initial screening with Hypromellose it is also observed that after 15 days a dispersible cake was produced with high PDI. from the literature, it was found that a combination of stabilizers is suitable to reduce and stabilize the formulation. Hence, a combination of stabilizers was used as per the reported works and a PS of 398.38±23.2) with a PDI of 0.182±0.26 was observed with SLS and hyropmellose and at a ratio of 0.25 and 1 % and hence were selected for further optimization [27].
Experimental design
Three-level Box-Behnken design, a three-factor, was utilized in our investigation, consisting of 17 experimental runs with three replicates at the centre locations. Table 4 displays the outcomes of the randomized trials with the selected independent and dependent variables.
Table 4: BBD and the trial experimental responses that were observed
| Run | A: Stabilizer to drug | B: Stirring speed | C: Milling time | Particle size | PDI |
| ratio | rpm | min | nm | ||
| 1 | 1 | 800 | 30 | 376.23 | 0.125 |
| 2 | 2 | 1000 | 45 | 308.66 | 0.206 |
| 3 | 1.5 | 600 | 30 | 400.44 | 0.209 |
| 4 | 1.5 | 800 | 45 | 330.04 | 0.082 |
| 5 | 2 | 800 | 60 | 354.06 | 0.109 |
| 6 | 1.5 | 1000 | 30 | 342.18 | 0.179 |
| 7 | 1.5 | 600 | 60 | 408.3 | 0.075 |
| 8 | 2 | 600 | 45 | 367.99 | 0.096 |
| 9 | 1.5 | 800 | 45 | 330.62 | 0.125 |
| 10 | 1.5 | 1000 | 60 | 392.12 | 0.278 |
| 11 | 1 | 600 | 45 | 391.23 | 0.102 |
| 12 | 1 | 1000 | 45 | 384.94 | 0.208 |
| 13 | 1.5 | 800 | 45 | 324.8 | 0.088 |
| 14 | 1 | 800 | 60 | 374.22 | 0.118 |
| 15 | 1.5 | 800 | 45 | 329.1 | 0.086 |
| 16 | 1.5 | 800 | 45 | 331.4 | 0.089 |
| 17 | 2 | 800 | 30 | 294.52 | 0.124 |
Quadratic, two-factor interaction, and linear polynomial models were developed using a second-order (2FI) multiple linear regression analysis. The coefficient of variance (C. V.), adjusted R², predicted R², and R² were the statistical measures that were used to pick the model. The PDI, Y2 fluctuated between 0.075 and 0.278, whereas the PS of the NS (Y1) ranged from 294.52 nm to 408.83 nm.
Particle size
The small size of NSs results in a significantly higher surface area-to-volume ratio, enhancing their stability, penetrability, and reactivity in targeted drug [19]. The model F value (390.81), indicating only a 0.01 percent chance of being as a result of sound, suggests that the suggested model has a negligible lack of fit and is quadratic. Fig. 2 shows the surface response and contour plots showing the effects of different factors on PS, while Supplementary fig. 1 shows the perturbation plot of all variables. The “Lack of Fit F-Value’ of 0.52 shows that the lack of fit is not statistically significant when compared to the pure error. The model's dependability is demonstrated by the 69.32% chance that a high "Lack of Fit F-value" might arise from random noise. Analysis of Variance (ANOVA) revealed that the response was significantly influenced by variables with p-values less than 0.0500. The values of R2, corrected R2, and anticipated R2 were 0.9889, 0.9980, and 0.9955, in that order. With a precision of 63.4310, the model significantly outperforms the necessary threshold of 4. It thus successfully explored the design space. It was discovered that the model terms A, B, C, AB, AC, BC, B2, and C2 had a substantial effect on the outcomes. The variables are currently considered significant, leading to the following regression equation:

The quadratic equation provided for PS demonstrates that specific factors can either enhance or diminish the response. Factors that lead to an increase in PS include C (+14.42), the interaction term AC (+15.39), BC (+10.52), B2 (+35.01), and C2 (+21.56). These positive coefficients indicate that as these variables increase, the PS also increases. On the other hand, factors that result in a decrease in PS are A (-25.17), B (-17.51), the interaction term AB (-13.26), and A2 (-0.9948). These negative coefficients suggest that a gain in these variables leads to a reduction in PS [31, 32].
PDI
The dimensionless PDI describes the width of the PS distribution, which normally ranges from 0 to 1. PDI values in the developed formulations ranged from 0.075 to 0.278. With a statistically significant F-value of 28.21, the suggested quadratic model appears to have a little lack of fit. With an F-value of 0.27, the lack of fit, as determined only by error, was not statistically significant, indicating an 84.21% possibility that noise could be the cause of such a high F-value. With the goal to optimize the model, non-significant variables were eliminated and significant components (p-value<0.0500) were highlighted using an ANOVA. Regression coefficients of 0.9732, 0.9387, and 0.8920 were found for R2, adjusted R2, and anticipated R2. The model was able to explore the design space more efficiently than the required threshold of 4 with a precision of 19.1490 [33].
It was discovered that the model coefficients for terms B, BC, B2, and C2 had p-values below 0.0500, indicating a substantial impact on the outcome. As a result, these variables are considered essential, leading to the following regression equation:


Fig. 2: 3 D and SR plots depicting the effect of variables on P. S.
The provided quadratic equation representing the PDI illustrates that specific elements can either raise or lower the PDI value. The factors that lead to an increase in PDI include B (+0.0486), the interaction term AB (+0.0010), the interaction term BC (+0.0583), B2 (+0.0626), and C2 (+0.0286). These positive coefficients signify that as these parameters increase, the PDI value also increases. On the other hand, the factors that contribute to a decrease in PDI consist of A (-0.0022), C (-0.0071), the interaction term AC (-0.0020), and A2 (-0.0036). These negative coefficients indicate that an increase in these variables leads to a reduction in PDI. Fig. 3 displays the surface and 3D response contour plots that illustrate how different variables affect PDI [33, 34].
Optimal preparation for exploration
The factors affecting the response parameters were optimized using the Derringer's desirability approach. Through extensive searches, the responses were transformed into a desirability scale, combined into a geometric mean function, and ultimately, an overall desirability score was generated. The optimum configuration (Fopt solution) with drug to stabilizer ratio of is 2.0% w/v, at a D value of 0.949 was obtained with a milling speed of 810 (rpm) and a milling time of 40.6 min. By adjusting the specified values for CQAs like PS, PDI, were able to improve the potential for customized graphics. The design space and overlay plot are shown in fig. 4. The formulation and strength of the model were validated using three checkpoints. Supp. Table 1 indicates that the expected size mean values were 294.52 nm, with a PDI of 0.095 correspondingly, while the detected mean values were found to be 307.5 nm, with a PDI of 0.084 [35].
Evaluation
Particle size (PS), polydispersity index (PDI) and zeta potential (ZP)
The NS displayed consistent size and uniformity, as evidenced by the PS of 307.5±12.98 nm, and PDI of 0.084±0.013, indicating a homogeneous system (PDI<0.3). The ZP of the optimized formulation after ball milling and after spray drying were found to be-15.3 mv and-27.1±0.26 mV, respectively, highlighting the stabilizing effect of steric stabilizers surrounding the particles, which is essential for stability based on the Double Electric Layer (DEL) theory [34]. A ZP of-27.1 mV indicates strong electrostatic repulsion, which prevents aggregation and ensures colloidal stability over time. Fig. 5 provides a visual representation of the PS, PDI, and ZP after ball milling and spray drying process. From the PS analysis, it is very clear that spray drying has reduced the PS to 135.6 nm with a PDI of 0.389.
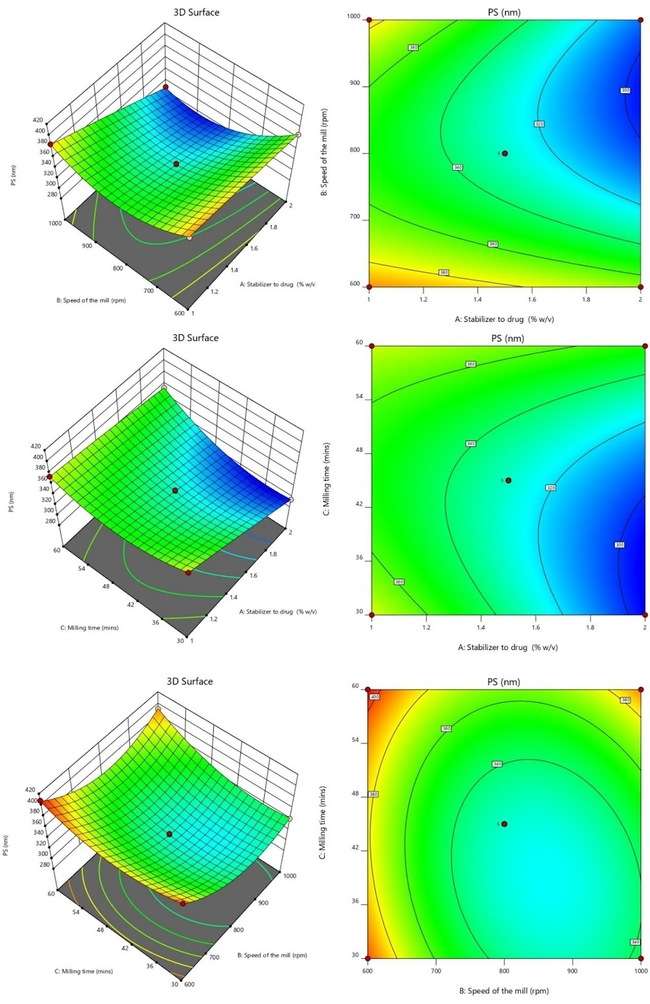
Fig. 3: 3D and SR plots depicting the effect of variables on PDI
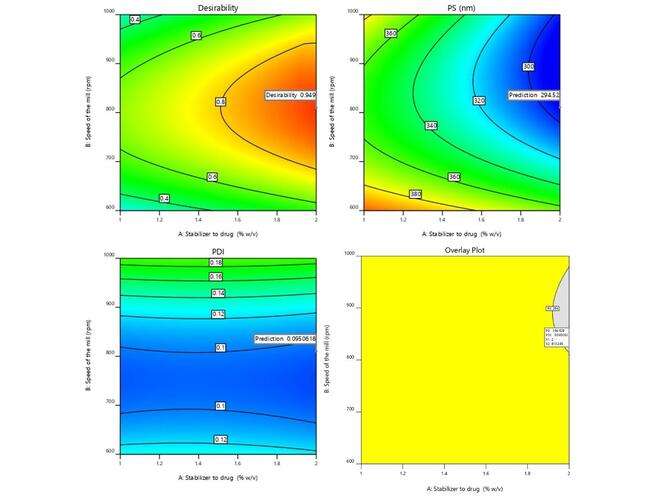
Fig. 4: Graphical illustration of desirability and overlay plot
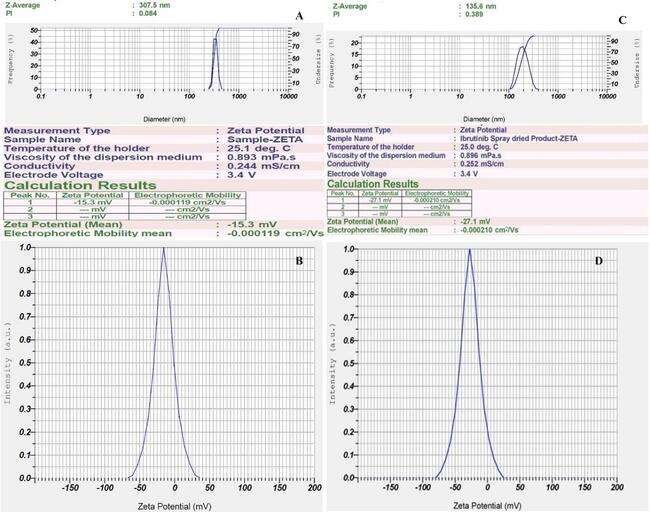
Fig. 5: Malvern image of A) Particle size, PDI after ball milling; B) ZP after ball milling; C) Particle size, PDI after spray drying; D) ZP after spray drying
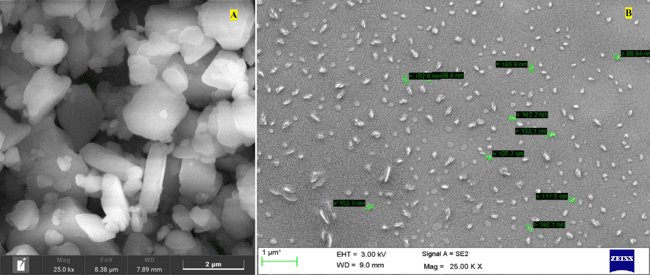
Fig. 6: SEM image of A) pure drug; B) Nanosuspension after spray drying (SD-F)
SEM: scanning electron microscopy
Fig. 6 depicts the surface properties of the formulation and the drug. The drug in its initial state displays a broad range of PSs and irregular cubic shapes with micrometer-sized particles. Conversely, when the drug is transformed into NS, it produces spherical nanoparticles consistently measuring below 200 nm, as verified by the zeta sizer and SEM. This research showcases the successful achievement of nanosizing the drug through nano ball milling followed by spray drying of the formation, resulting in particles within the nanometer scale and exhibiting a low PDI.
FTIR
To determine component compatibility, FTIR was performed for the polymers used in study along with the drug (PD), physical mixture (PM), ball mill formulation (BM-F) and for spray-dried formulation (SD-F) as shown in fig. 7. All the samples were scanned from 400–4000 cm–1 range. The simple drug showed distinct peaks at (1241, 1147, 1100, 986, and 953 cm-1) [13].
The FTIR spectrum of lactose monohydrate displays several prominent peaks. The peak at 3516.35 cm⁻¹ signifies O-H stretching, commonly found in hydroxyl groups. At 2931.90 cm⁻¹, the peak corresponds to C-H stretching, typical of aliphatic hydrocarbons. The peak at 1342.50 cm⁻¹ is linked to C-H bending, often observed in methylene and methyl groups. C-O stretching vibrations are associated with the peak at 1261.49 cm⁻¹, commonly present in alcohols, ethers, and esters. The peak at 1166.97 cm⁻¹ indicates C-O-C stretching, characteristic of glycosidic linkages in carbohydrates. Additionally, the peak at 1141.90 cm⁻¹ is also related to C-O stretching vibrations. The presence of C-H out-of-plane bending vibrations is shown by the peak at 898.86 cm⁻¹, commonly found in aromatic compounds. Lastly, the peak at 978.58 cm⁻¹ is associated with skeletal vibrations of saccharides, indicating the presence of carbohydrate structures [36].
These peaks offer valuable insights into the functional groups and molecular structure of the compound analyzed through FTIR spectroscopy. These peaks provide valuable information about the molecular structure of lactose monohydrate in FTIR spectroscopy. In case of the physical mixture also the prominent peaks of the lactose are seen but as such no additional peaks are seen in the nanoformulation prepared by ball mill and spray drying technique. This clearly indicates that no chemical interaction between the selected stabilizers and drug [13].
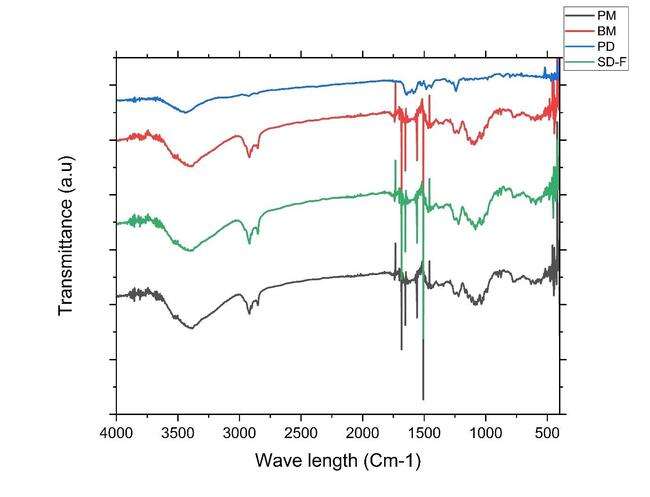
Fig. 7: A) Overlay of FTIR analysis PD (blue line-IBR; PM (black color line-Physical mixture; Ball mill-NS (BM-F red color line-Nanosuspension (NS); and D) Spray dried-NS (SD-F, Green colorline)
DSC: differential scanning colorimetry
The following fig. 8 reveals the DSC analysis of ibrutinib, the stabilizer's physical combination, and the NS: The crystalline nature of ibrutinib was confirmed by a strong melting peak at 158 °C, whereas the stabilizer demonstrated a peak at 197. 64 (SLS) and hypromellose around 101.4 °C. Lactose has a prominent peak at around 159.19 °C. The IBR in the NS was enveloped by stabilizers like HPMC and SLS, as well as lactose, resulting in the absence of the drug peak. This well-documented phenomenon in the literature occurs when the drug's melting peak is not visible due to the influence of excipients [37].
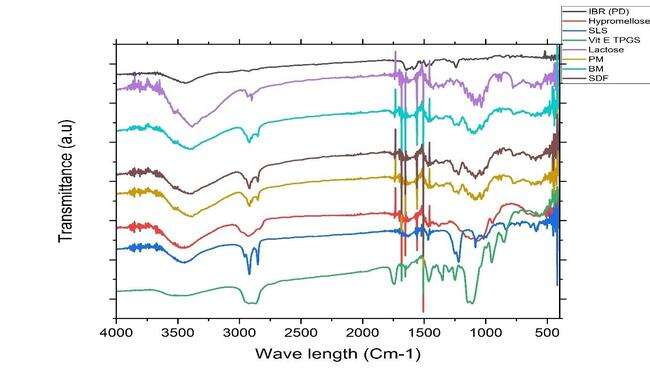
Fig. 7: B) Overlay of FTIR analysis after spray drying. PD (black line-IBR; PM (red line-Physical mixture; Ball mill-NS (BM green line-Nanosuspension (NS); D) Spray dried-NS (SDF, Purple line); E) Lactose (light purple line); F) Vit E TPGS (Light purple line), G) SLS (Light blue line)
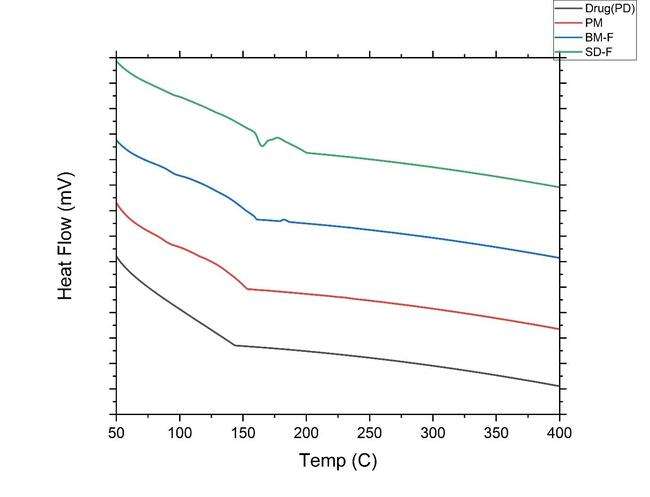
Fig. 8: A) DSC overlay thermograms of pure drug (PD black-color line IBR); PM (red color line-Physical mixture, BM-F NS (Ball mill formulation blue color line-Nanosuspension) and SD-F (spray dried formulation Greencolor line)
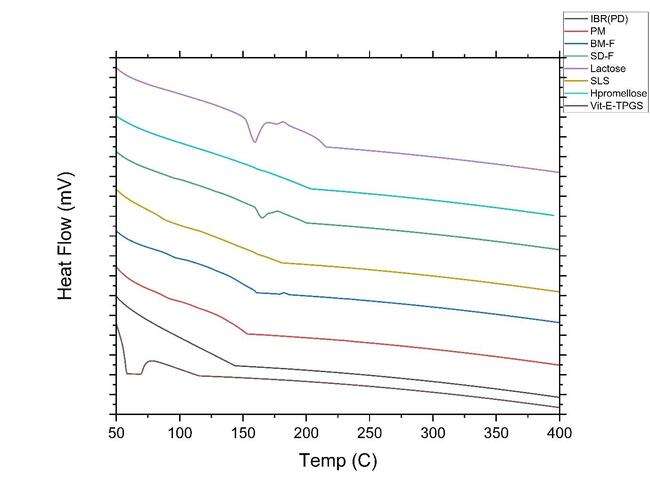
Fig. 8: B) DSC thermogram overlay of pure drug (PD black-line IBR); PM (red line-Physical mixture, BM-F NS (Ball mill formulation blue line-Nanosuspension); SD-F (spray dried formulation Green-line); Lactose (light purple-line); SLS(dark yellow-line); hypromellose (Light blue-line) and Vit E TPGS (dark purple-line)
XRD
The XRD patterns are shown in fig. 9. The crystal properties of drug, physical mixture, NS prepared by ball mill and spray dried formulation along with all the excipients were inspected by XRD. The drug has displayed firm diffraction peaks (2 θ scattered angles of 23. 37, 26. 29, 22.26, 21.33, 19.72, 15.86, 10.63, and 12.22 °) confirming its crystalline nature. Previous studies have also reported similar diffraction peaks in the drug. In case of lactose, it has characteristics diffraction peaks at 2 θ scattered angles of 19.97, 19.12, 19.56, 12.5259, 16.37, 20.83, 21.22, 25.59, and 37.57 respectively. However, in the NS the characteristic diffraction peaks of drug vanished, suggesting the pure drug may have formed a solid-state complex at a molecular level in the NS formulation [13].
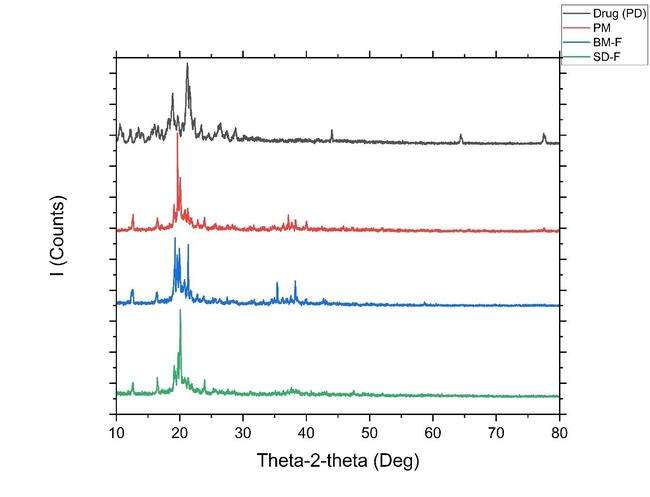
Fig. 9: (A) Overlay of XRD of i) Drug PD (black line); ii) PM (red color line), iii) Formulation-BM-F (Ball mill, bluecolor line); iv) Formulation-SD-F (spray dried green color line)
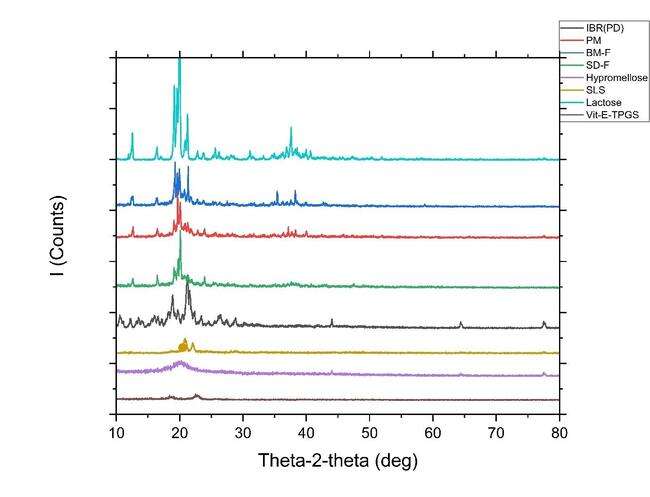
Fig. 9: (B) Overlay of XRD of Drug (PD black-line IBR); PM (red line-Physical mixture, BM-F NS (Ball mill formulation blue line-Nanosuspension); SD-F (spray dried formulation Green-line); Lactose (light purple-line); SLS (dark yellow-line); Hypromellose (Light blue-line) and Vit E TPGS (dark purple-line)
The FTIR results showed no new peak formation, indicating the absence of chemical interaction but possible hydrogen bonding. DSC revealed disappearance of IBR’s sharp melting peak in the spray-dried sample, suggesting a transition to an amorphous state. XRD confirmed this with a loss of crystalline peaks. These structural changes reduce lattice energy barriers, increasing surface wetting and dissolution rate, which contributes to the enhanced bioavailability of the NS.
Study on saturation solubility
The apparent solubility of the final IBR-NS (BM-F) and Spray-Dried Formulation (SD-F) was evaluated by administering a dose identical to 5 mg of the drug along with stabilizers (SLS and Hypromellose). The drug’s pure form’s solubility, NS, and physical mixture (drug and stabilizer) were measured at 5.72±0.089 µg/ml, 74.16±4.03 µg/mland 13.64±2.04 µg/ml, respectively. The NS exhibited a solubility that was 12.96 times higher than that of the pure drug [38].
Dissolution studies
The dissolution profile of the NS and PD is done in both FaSSGF, FeSSGF, FaSSIF, and FeSSIF media, and the release pattern is shown in fig. 10. The drug’s discharge from the NS in FaSSGF reached 82.81±8.48%, while the plain drug (PD) exhibited a release of only 38.14±8.41% within two hours. In FaSSGF, over 90% of the drug was released for both NS and PD. Additionally, PD showed release in both FaSSIF and FeSSIF, 63.02±9.419 % and 58.04±10.91 %, while the formulation dissolved 94.14±7.48 % and 93.87±11.82 % after 2h. Both formulations displayed comparable drug release characteristics in FaSSGF, likely due to IBR's strong solubility in acidic pH. On the other hand, the more negligible solubility of IBR in FeSSGF was caused by the smaller PS, amorphous form conversion, and surfactant action of the stabilizers [39].
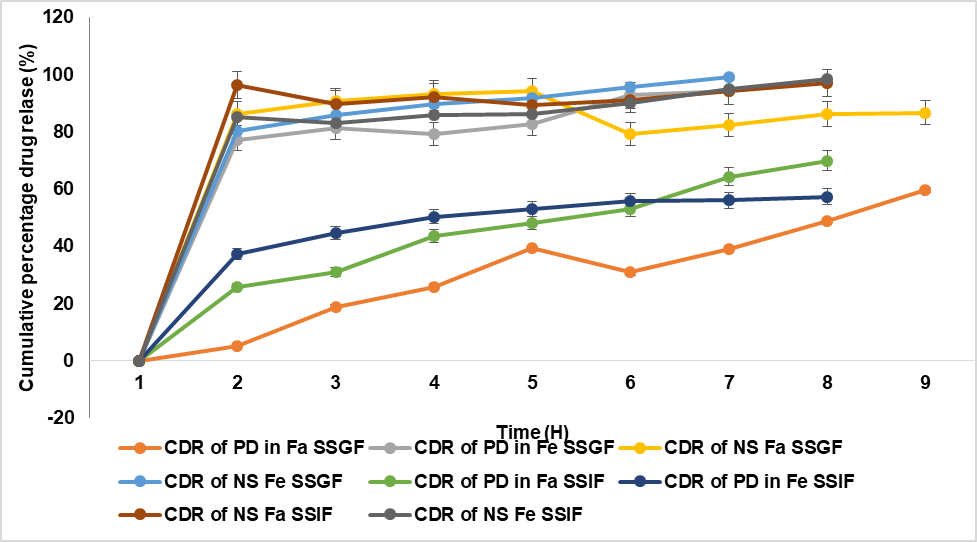
Fig. 10: In vitro release profiles of pure drug (PD) and NS in fast and fed gastric medium, B) Release profiles of IBR pure drug (PD) and NS in fast and fed intestinal medium (mean±S. D; n=3)
The drug release data were fitted to kinetic models using GraphPad Prism. The optimized NS followed Higuchi release kinetics (R² = 0.986), indicating a diffusion-controlled mechanism. First-order kinetics (R² = 0.921) also showed a good fit, supporting sustained release behavior. The improved release can be attributed to reduced PS, enhanced surface area, and partial amorphization.
The transformation of IBR from a crystalline to an amorphous state, as demonstrated by DSC and XRD, are correlated with the observed enhancement in dissolution rates. The higher solubility of the amorphous form, combined with nanosizing effects, leads to improved bioavailability by increasing the drug's surface area for dissolution.
Stability studies
Three different temperature settings were used for ninety days to conduct stability testing on IBR-NS. Three different temperature settings were used for 90 days to conduct stability testing on IBR NS. An analysis was carried out to assess the impact on PS. After the 60th day, the PS rose after remaining constant for the previous 60 days. At a temperature of 2-8 °C, the size grew over 90 days, going from 135.6±8.89 nm to 13.86±12.40 nm. A decrease in stability over time is suggested by the size increase from 135.6±8.89 nm to 146.25±10.22 nm at 40 °C [40].
Under accelerated conditions (40 °C), a slight increase in PS was observed, potentially due to hydrolytic degradation or moisture-induced aggregation. Although chemical stability was not compromised, physicochemical changes like Ostwald ripening and hydrolysis of stabilizers (e. g., HPMC) may contribute to instability. Future studies should include LC-MS analysis to assess oxidative or hydrolytic degradation pathways.
CONCLUSION
The IBR NS was successfully optimized using a Box-Behnken design, integrating nano-ball milling and spray drying techniques. By employing a stabilizer combination of Hypromellose and Sodium Lauryl Sulfate, the NS achieved a PS reduction from 294.52–408.83 nm after ball milling to 135.6 nm following spray drying, resulting in a 12.6-fold enhancement in solubility. This formulation demonstrated improved bioavailability, leading to enhanced efficacy and the potential for lower dosing, thereby reducing side effects. Solid-state characterization confirmed the stability and compatibility of the formulation, with freeze-dried samples remaining stable for six months at room temperature. In vitro drug release studies indicated superior dissolution in FaSSIF compared to conventional formulations, supporting its suitability for clinical translation. However, batch-to-batch consistency remains a key challenge in NS formulations. Future research should focus on in vivo efficacy studies in animal models, exploring combination therapies with other anticancer agents, and optimizing alternative drying techniques to further enhance formulation stability and scalability.
FUNDING
Nil
AUTHORS CONTRIBUTIONS
VD contributed to the study design and collaborated with data collecting and analysis, while RP, supported in paper writing, assuring a collaborative and balanced effort throughout the research process. All Authors reviewed and approved the final draft.
CONFLICT OF INTERESTS
The authors utter no conflict of interest.
REFERENCES
Mehmood Y, Shahid H, Abbas M, Farooq U, Alshehri S, Alam P. Developing nanosuspension loaded with azelastine for potential nasal drug delivery: determination of proinflammatory interleukin IL-4 mRNA expression and industrial scale-up strategy. ACS Omega. 2023 Jun 21;8(26):23812-24. doi: 10.1021/acsomega.3c02186, PMID 37426214.
Debela DT, Muzazu SG, Heraro KD, Ndalama MT, Mesele BW, Haile DC. New approaches and procedures for cancer treatment: current perspectives. Sage Open Med. 2021 Aug 12;9:20503121211034366. doi: 10.1177/20503121211034366, PMID 34408877.
Nikolaou M, Pavlopoulou A, Georgakilas AG, Kyrodimos E. The challenge of drug resistance in cancer treatment: a current overview. Clin Exp Metastasis. 2018 Aug;35(4):309-18. doi: 10.1007/s10585-018-9903-0, PMID 29799080.
Robinson K, Tiriveedhi V. Perplexing role of P-glycoprotein in tumor microenvironment. Front Oncol. 2020 Feb 25;10:265. doi: 10.3389/fonc.2020.00265, PMID 32195185.
Jahan N, Kousar F, Rahman KU, Touqeer SI, Abbas N. Development of nanosuspension of artemisia absinthium extract as novel drug delivery system to enhance its bioavailability and hepatoprotective potential. J Funct Biomater. 2023 Aug 18;14(8):433. doi: 10.3390/jfb14080433, PMID 37623677.
He C, Sun Z, Hoffman RM, Yang Z, Jiang Y, Wang L. P-glycoprotein overexpression is associated with cisplatin resistance in human osteosarcoma. Anticancer Res. 2019 Apr;39(4):1711-8. doi: 10.21873/anticanres.13277, PMID 30952710.
Vidyadhari J, Gayatriramya M, Durga SP, Pavani P, Rajesh K. Nanosuspensions: a strategy to increase the solubility and bioavailability of poorly water-soluble drugs. Asian J Pharm Clin Res. 2023 May;16(5):33-40. doi: 10.22159/ajpcr.2023.v16i5.46617.
Smith MR. Ibrutinib in B lymphoid malignancies. Expert Opin Pharmacother. 2015 Aug;16(12):1879-87. doi: 10.1517/14656566.2015.1067302, PMID 26165513.
Khalifa NE, Nur AO, Osman ZA. Artemether loaded ethyl cellulose nanosuspensions: effects of formulation variables physical stability and drug release profile. Int J Pharm Pharm Sci. 2017 Jun;9(6):90-6. doi: 10.22159/ijpps.2017v9i6.18321.
Shakeel F, Iqbal M, Ezzeldin E. Bioavailability enhancement and pharmacokinetic profile of an anticancer drug ibrutinib by self-nanoemulsifying drug delivery system. J Pharm Pharmacol. 2016 Jun;68(6):772-80. doi: 10.1111/jphp.12550, PMID 27018771.
Davids MS, Brown JR. Ibrutinib: a first-in-class covalent inhibitor of bruton’s tyrosine kinase. Future Oncol. 2014 Jun;10(6):957-67. doi: 10.2217/fon.14.51, PMID 24941982.
Aher SS, Malsane ST, Saudagar RB. Nanosuspension: an overview. Int J Curr Pharm Sci. 2017;9(3):19-23. doi: 10.22159/ijcpr.2017.v9i3.19584.
Sarkar P, Das S, Majee SB. Biphasic dissolution model: novel strategy for developing discriminatory in vivo predictive dissolution model for BCS class II drugs. Int J Pharm Pharm Sci. 2022 Apr;14(4):20-7. doi: 10.22159/ijpps.2022v14i4.44042.
Rangaraj N, Pailla SR, Shah S, Prajapati S, Sampathi S. QbD aided development of ibrutinib loaded nanostructured lipid carriers aimed for lymphatic targeting: evaluation using chylomicron flow blocking approach. Drug Deliv Transl Res. 2020 Oct;10(5):1476-94. doi: 10.1007/s13346-020-00803-7, PMID 32519202.
Mehata AK, Setia A, Vikas, Malik AK, Hassani R, Dailah HG. Vitamin E TPGS-based nanomedicine nanotheranostics and targeted drug delivery: past present and future. Pharmaceutics. 2023 Mar;15(3):722. doi: 10.3390/pharmaceutics15030722, PMID 36986583.
Kesisoglou F, Mitra A. Crystalline nanosuspensions as potential toxicology and clinical oral formulations for BCS II/IV compounds. AAPS J. 2012 Dec;14(4):677-87. doi: 10.1208/s12248-012-9383-0, PMID 22736294.
Mothilal M, Chaitanya KM, Surya Teja SP, Manimaran V, Damodharan N. Formulation and evaluation of naproxen eudragit RS 100 nanosuspension using 32 factorial design. Int J Pharm Pharm Sci. 2014 Jul;6(7):449-55.
Yu LX, Amidon G, Khan MA, Hoag SW, Polli J, Raju GK. Understanding pharmaceutical quality by design. AAPS J. 2014 Oct;16(4):771-83. doi: 10.1208/s12248-014-9598-3, PMID 24854893.
Wang Y, Zheng Y, Zhang L, Wang Q, Zhang D. Stability of nanosuspensions in drug delivery. J Control Release. 2013 Nov 28;172(3):1126-41. doi: 10.1016/j.jconrel.2013.08.006, PMID 23954372.
Andrade Da Silva LH, Vieira JB, Cabral MR, Antunes MA, Lee D, Cruz FF. Development of nintedanib nanosuspension for inhaled treatment of experimental silicosis. Bioeng Transl Med. 2023;8(2):e10401. doi: 10.1002/btm2.10401, PMID 36925690.
Verma S, Kumar S, Gokhale R, Burgess DJ. Physical stability of nanosuspensions: investigation of the role of stabilizers on ostwald ripening. Int J Pharm. 2011 Jan 17;406(1-2):145-52. doi: 10.1016/j.ijpharm.2010.12.027, PMID 21185926.
Dong Z, Wang R, Wang M, Meng Z, Wang X, Han M. Preparation of naringenin nanosuspension and its antitussive and expectorant effects. Molecules. 2022 Jan 24;27(3):741. doi: 10.3390/molecules27030741, PMID 35164006.
Pınar SG, Canpınar H, Tan C, Celebi N. A new nanosuspension prepared with wet milling method for oral delivery of highly variable drug cyclosporine a: development optimization and in vivo evaluation. Eur J Pharm Sci. 2022 Aug 15;171:106123. doi: 10.1016/j.ejps.2022.106123, PMID 35017012.
Amasya G, Aksu B, Badilli U, Onay Besikci A, Tarimci N. QbD guided early pharmaceutical development study: production of lipid nanoparticles by high pressure homogenization for skin cancer treatment. Int J Pharm. 2019 Jun 5;563:110-21. doi: 10.1016/j.ijpharm.2019.03.056, PMID 30935913.
Sampathi S, Prajapati S, Junnuthula V, Dyawanapelly S. Pharmacokinetics and anti-diabetic studies of gliclazide nanosuspension. Pharmaceutics. 2022 Sep;14(9):1947. doi: 10.3390/pharmaceutics14091947, PMID 36145695.
Afifi SA, Hassan MA, Abdelhameed AS, Elkhodairy KA. Nanosuspension: an emerging trend for bioavailability enhancement of etodolac. Int J Polym Sci. 2015;2015:1-16. doi: 10.1155/2015/938594.
Pailla SR, Talluri S, Rangaraj N, Ramavath R, Challa VS, Doijad N. Intranasal zotepine nanosuspension: intended for improved brain distribution in rats. Daru. 2019 Jun;27(2):541-56. doi: 10.1007/s40199-019-00281-4, PMID 31256410.
Sable AA, Kunwar A, Barik A. Alginate and chitosan-based delivery systems for improving the bioavailability and therapeutic efficacy of curcumin. Pharmaceutics. 2024 Mar 19;16(3):423. doi: 10.3390/pharmaceutics16030423, PMID 38543316.
Sampathi S, Haribhau CJ, Kuchana V, Junnuthula V, Dyawanapelly S. Nanosuspension encapsulated chitosan pectin microbeads as a novel delivery platform for enhancing oral bioavailability. Carbohydr Polym. 2023 Nov 1;319:121177. doi: 10.1016/j.carbpol.2023.121177, PMID 37567693.
Liu J, Li S, Ao W, Li Y, Xiao Y, Bai M. Fabrication of an aprepitant nanosuspension using hydroxypropyl chitosan to increase the bioavailability. Biochem Biophys Res Commun. 2022 Nov 26;631:72-7. doi: 10.1016/j.bbrc.2022.09.031, PMID 36179498.
Hashem FM, Abd Allah FI, Abdel Rashid RS, Hassan AA. Glibenclamide nanosuspension inhaler: development in vitro and in vivo assessment. Drug Dev Ind Pharm. 2020 May;46(5):762-74. doi: 10.1080/03639045.2020.1753062, PMID 32250179.
Ugur Kaplan AB, Ozturk N, Cetin M, Vural I, Oznuluer Ozer T. The nanosuspension formulations of daidzein: preparation and in vitro characterization. Turk J Pharm Sci. 2022 Feb 28;19(1):84-92. doi: 10.4274/tjps.galenos.2021.81905, PMID 35227054.
Laxmi BV, Bhikshapathi D, Sailaja Rao P. Optimization and enhancement of oral bioavailability of dabrafenib as nanobubbles using quality by design approach. PharmSci. 2025 Jan;31(1):xx-xx. doi: 10.34172/PS.2024.31.
Reddy KS, Bhikshapathi D, Kumar JP. Unlocking dabrafenib’s potential: a quality by design (QBD) journey to enhance permeation and oral bioavailability through nanosponge formulation. Braz J Pharm Sci. 2025;61:e24209. doi: 10.1590/s2175-97902025e24209.
Palanati M, Bhikshapathi DV. Development characterization and evaluation of entrectinibnanosponges loaded tablets for oral delivery. Int J Appl Pharm. 2023 Nov-Dec;15(6):269-81. doi: 10.22159/ijap.2023v15i6.49022.
Jacob S, Kather FS, Boddu SH, Attimarad M, Nair AB. Nanosuspension innovations: expanding horizons in drug delivery techniques. Pharmaceutics. 2025 Jan 19;17(1):136. doi: 10.3390/pharmaceutics17010136, PMID 39861782.
Tian Y, Wang S, Yu Y, Sun W, Fan R, Shi J. Review of nanosuspension formulation and process analysis in wet media milling using micro hydrodynamic model and emerging characterization methods. Int J Pharm. 2022 Jul 25;623:121862. doi: 10.1016/j.ijpharm.2022.121862, PMID 35671851.
Shi X, Fan B, Zhou X, Chen Q, Shen S, Xing X. Preparation and characterization of ibrutinib amorphous solid dispersions: a discussion of interaction force. J Pharm Innov. 2022 Dec;17(4):1074-83. doi: 10.1007/s12247-021-09585-y.
Elsebay MT, Eissa NG, Balata GF, Kamal MA, Elnahas HM. Nanosuspension: a formulation technology for tackling the poor aqueous solubility and bioavailability of poorly soluble drugs. Curr Pharm Des. 2023;29(29):2297-312. doi: 10.2174/1381612829666230911105922, PMID 37694786.
Chary SS, Bhikshapathi DV, Vamsi NM, Kumar JP. Optimizing entrectinib nanosuspension: quality by design for enhanced oral bioavailability and minimized fast-fed variability. BioNanoScience. 2024 Feb;14(4):4551-69. doi: 10.1007/s12668-024-01462-5.