
Int J App Pharm, Vol 17, Issue 5, 2025, 406-416Original Article
QBD-BASED RP-UPLC METHOD DEVELOPMENT AND VALIDATION FOR THE SIMULTANEOUS ESTIMATION OF ATEZOLIZUMAB AND HYALURONIDASE IN CANCER DRUG FORMULATIONS
KONDURI JAYA SREE1, RAJU MUDHULKAR1*, SREEDHAR GUNDEKARI1, NAVEEN KUMAR KOTTAKKI2, AMRUTHA SRI KONDURI2
1Department of Chemistry, Koneru Lakshmaiah Education Foundation, Bowrampet, Hyderabad-500043, Telangana, India. 2Imptech Scientific, Hyderabad-500016, Telangana, India
*Corresponding author: Raju Mudhulkar; *Email: m.raju@klh.edu.in
Received: 14 Mar 2025, Revised and Accepted: 21 Jun 2025
ABSTRACT
Objective: Atezolizumab and hyaluronidase have been approved for subcutaneous injection for all adult indications as the intravenous formulation of atezolizumab, including non-small cell lung cancer (NSCLC), small cell lung cancer (SCLC), hepatocellular carcinoma (HCC), melanoma, and alveolar soft part sarcoma (ASPS). In this study, a new reverse-phase ultra-performance liquid chromatography (RP-UPLC) method was developed using a Quality by Design (QbD) approach for the simultaneous quantification of hyaluronidase (HYAL) and atezolizumab (ATEZ).
Methods: The method optimisation was performed using a central composite design (CCD) in Design Expert Software, which offers a systematic framework for design of experiments (DOE), facilitating the evaluation of factor-response relationships and ensuring statistically significant results to enhance analytical quality. HYAL and ATEZ were successfully separated using a Waters ACQUITY UPLC HSS C18 Column (100 mm × 2.1 mm, 1.8 µm particle size) with an isocratic mobile phase consisting of trifluoroacetic acid buffer (pH 2.0) and acetonitrile in a 58:42% v/v ratio, at a flow rate of 0.3 ml/min.
Results: In the developed UPLC method, HYAL and ATEZ were detected at 210 nm and 280 nm, respectively. The process was validated in compliance with ICH Q2 (R2) guidelines by evaluating key parameters such as system suitability, linearity, accuracy, precision, robustness, sensitivity, limit of detection (LOD), limit of quantification (LOQ) and analyte stability. The LOD and LOQ were determined using signal-to-noise ratios of 3:1 and 10:1, respectively, yielding values of 0.002 µg/ml (LOD) and 0.006 µg/ml (LOQ) for HYAL and 1.49 µg/ml (LOD) and 4.52 µg/ml (LOQ) for ATEZ, respectively. System suitability results demonstrated excellent reproducibility, with mean% RSD for the theoretical plate number and tailing factor across six replicate injections being 0.39% and 1.98% for HYAL and 0.22% and 0.38% for ATEZ, respectively.
Conclusion: The QbD-based RP-UPLC method developed using central composite design enables precise, sensitive, and robust simultaneous quantification of atezolizumab and hyaluronidase. The technique showed efficient separation, excellent system suitability, and low LOD and LOQ values. Validation as per ICH Q2(R2) confirms its applicability for routine analysis and quality control of ATEZ-and HYAL-loaded nano-hydrogel formulations prepared by ionic gelation.
Keywords: Hyaluronidase, Atezolizumab, Lung cancer drugs, Quality by design, UPLC, Ultra performance liquid chromatography
© 2025 The Authors. Published by Innovare Academic Sciences Pvt Ltd. This is an open access article under the CC BY license (https://creativecommons.org/licenses/by/4.0/)
DOI: https://dx.doi.org/10.22159/ijap.2025v17i5.54200 Journal homepage: https://innovareacademics.in/journals/index.php/ijap
INTRODUCTION
Global cancer statistics show that lung cancer remains the most diagnosed cancer and the leading cause of cancer-related deaths worldwide. In 2022, approximately 2.5 million new cases were reported, making up 12.4% of all cancer diagnoses globally [1]. Tobacco consumption remains the most significant leading cause for lung cancer development, while exposure to passive smoke has been shown to increase the likelihood of developing the disease by up to 26%. Other notable etiological contributors include asbestos exposure, genetic predisposition, and contact with hazardous agents such as radon gas, heavy metals, and polycyclic aromatic hydrocarbons [2]. NSCLC, the most predominant type of lung malignancy, is categorised into three primary histological subtypes: adenocarcinoma, large cell carcinoma and squamous cell carcinoma [3]. Historically, squamous cell carcinoma was the most frequently diagnosed NSCLC subtype [4]. The treatment landscape for NSCLC primarily involves chemotherapeutic agents such as carboplatin, cisplatin, docetaxel, vinorelbine, paclitaxel, gemcitabine, as well as immune checkpoint inhibitors like atezolizumab and enzymatic agents such as hyaluronidase [5].
Atezolizumab, a monoclonal antibody, achieves its therapeutic efficacy by selectively binding to programmed death-ligand 1 on immune and tumour cells, thereby preventing its interaction with programmed death receptor 1 and B7 receptors. This blockade restores T-cell activation and enhances antitumor immune responses, facilitating immune-mediated cancer cell destruction [6-8]. Atezolizumab, alone or in combination with hyaluronidase, is utilised in NSCLC treatment, particularly in cases with elevated programmed death-ligand 1 and normal EGFR or ALK gene status. It serves a vital function in preventing disease recurrence following surgical tumour resection and is a viable option when platinum-based chemotherapy regimens fail. A combined formulation of atezolizumab with recombinant human hyaluronidase enhances drug penetration and immune checkpoint inhibition, potentiating its antineoplastic properties. The Food and Drug Administration (FDA) has recently certified atezolizumab and hyaluronidase for subcutaneous injection across all adult symptoms for which the intravenous formulation of atezolizumab is authorised. These indications include NSCLC, small cell lung cancer, melanoma, hepatocellular carcinoma, and alveolar soft part sarcoma [9].
In pharmaceutical analysis, various analytical methodologies are employed to simultaneously estimate drug molecules in dosage formulations due to their efficiency and time-saving nature. Ultra-performance liquid chromatography has become a highly efficient alternative to conventional high-performance liquid chromatography (HPLC), providing enhanced resolution, speed, and sensitivity, making it indispensable in pharmaceutical quality control [10-13]. Various analytical techniques for multicomponent analysis include spectrophotometric methods (UV-Vis, IR, NMR, and mass spectrometry) and chromatographic techniques (TLC, HPLC, UHPLC, HPTLC, and GC). These methods offer high specificity and selectivity, ensuring accurate identification and quantification of active pharmaceutical ingredients in complex dosage forms. Although these analytical techniques are available for the quantification of pharmaceutical molecules, the application of the QbD approach using UPLC holds significant importance due to its precision, reliability, and efficiency in pharmaceutical analysis [14-16]. When QbD is integrated with Ultra-Performance Liquid Chromatography (UPLC), QbD enhances method development through systematic evaluation of Critical Quality Attributes (CQAs) and Critical Method Parameters (CMPs), offering improved robustness, efficiency, cost-effectiveness, and regulatory compliance [17, 18].
Notably, no studies have been reported so far on the concurrent estimation of atezolizumab and hyaluronidase using this approach. Given the critical role of cancer research in advancing therapeutic strategies, studies like this are essential in improving analytical methodologies and ensuring the quality and efficacy of targeted cancer treatments.
Stability-indicating methodologies are employed to evaluate drug stability under diverse stress conditions, including acidic, basic, oxidative, photolytic, thermal, and neutral degradation to optimise analytical performance. The simultaneous estimation of HYAL and ATEZ helps in therapeutic synergy for enhanced cancer therapy, formulated analysis for stability and compatibility testing, analytical efficiency saving time and cost, data reliability improving reproducibility, regulatory compliance supporting faster method validation and bioanalytical relevance enabling real-time tracking in Pharmacokinetics and Pharmacodynamics studies.
Additionally, the QbD approach has been integrated into analytical method development, adhering to guidelines of the International Council for Harmonisation (ICH) [19-22]. QbD facilitates a systematic, risk-based strategy for ensuring drug quality, minimising product variability, and enhancing process robustness. In this research, a stability-indicating UPLC method was developed to assess drug degradation profiles under diverse stress conditions, reinforcing the robustness and precision of the analytical technique.
MATERIALS AND METHODS
Chemicals and reagents
Pure active pharmaceutical ingredients of HYAL and ATEZ (purity ≥99.0%), along with their combination injection, were procured from Akrivis Pharma Pvt. Ltd. (Hyderabad, India). HPLC-grade acetonitrile (99.8%) was purchased from Rankem (Mumbai, India), while LC-MS grade trifluoroacetic acid (99%) and HPLC-grade methanol (99.8%) were procured from Merck (Mumbai, India). Milli-Q water was used throughout the analysis and obtained from Millipore Technologies, Mumbai, India.
Instrumentation, software analytical configuration
The chromatographic analysis, method validation, and stability studies of HYAL and ATEZ were performed using the Waters ACQUITY UPLC System (Waters, Milford, MA, USA) equipped with an Acquity TUV Detector and controlled by Waters Empower Version 3 software. The separation was attained on an ACQUITY UPLC HSS C18 Column (100 mm × 2.1 mm, 1.8 µm particle size) under optimised chromatographic conditions (HYAL and ATEZ were detected at 210 nm and 280 nm, respectively). The detector was set with a wavelength accuracy of ±1 nm, a response time of 0.1 seconds, and a sampling rate of 20 points/second to ensure signal stability and reproducibility.
The mixture of 20 mmol trifluoroacetic acid aqueous buffer solution (pH 2) and acetonitrile in a 58:42% v/v ratio was used as the mobile phase and was eluted at a flow rate of 0.3 ml/min using an isocratic elution program. The total run time for the experiment was 3 min at a column temperature of 30 °C. The injection volume was set to 1 µl**. The mobile phase was filtered using a 0.45 μm membrane filter (Millipore) while chromatographic samples were filtered using a 0.22 μm syringe filter. The guard column was not used in this analysis. Although guard columns help protect the analytical column by trapping particulates and contaminants, all samples and mobile phases were thoroughly filtered, ensuring column integrity and consistent performance without the need for a guard column.
Additional equipment included a Milli-Q Water System (Millipore Technologies, Mumbai, India) for water purification, a sonicator for dissolving and mixing samples, and a vacuum filtration system for degassing and filtering solutions. Data analysis was performed using Empower Version 3.0 software.
Preparation of stock, working, and quality control solutions
ATEZ and HYAL stock solution was prepared by dissolving an appropriate 1 ml of the drug injection in 10 ml of acetonitrile and water (1:1, v/v). The resultant solution was degassed and filtered through 0.22 mm filters under vacuum before introduction into the system. Standard solution was prepared by accurately weighing and transferring 0.1 mg of HYAL and 250 mg of ATEZ into separate 25 ml volumetric flasks, adding 10 ml of diluent, sonicating, and diluting to the final volume. This resulted in standard stock solutions of 4 ppm for HYAL and 10,000 ppm for ATEZ. Subsequently, 0.5 ml from each stock solution was pipetted into a 10 ml volumetric flask and diluted to obtain final concentrations of 0.2 ppm for HYAL and 500 ppm for ATEZ. For sample solutions, 1 ml of a solution containing 125 mg of ATEZ and 0.05 mg of HYAL was transferred into a 25 ml volumetric flask, followed by the addition of 10 ml of diluent, shaking for 20 min, sonicating for 5 min, and diluting to volume. A 1.0 ml aliquot of the filtered sample was further diluted in a 10 ml volumetric flask, yielding final concentrations of 0.2 ppm for HYAL and 500 ppm for ATEZ. A blank solution was injected before sample analysis to confirm the absence of interference. The working solutions were serially diluted to prepare calibration standards ranging from 0.05-0.3 µg/ml for HYAL and 125-750 µg/ml for ATEZ. Quality control (QC) samples at three levels (low, medium, and high) were formulated using a similar approach and stored under refrigeration.
Initial method development studies
Solubility screening was conducted based on literature data on the analytes' physicochemical properties to determine optimal solvent compatibility, primarily using acetonitrile and water. Method development involved optimising the mobile phase ratio, with pH 2 adjustments using trifluoroacetic acid. Multiple mobile phase compositions were evaluated to achieve optimal chromatographic performance. In initial trials, a higher aqueous content (e. g., 40:60% v/v) resulted in excessive retention times (>10 min) and significant peak broadening due to strong analyte-stationary phase interactions, while higher organic content (e. g., 70:30% v/v) caused premature elution of the analyte, leading to poor resolution from neighboring peaks or impurities. The selected mobile phase composition of 58:42% v/v was optimised based on the analyte's polarity, solubility, and retention behaviour during chromatographic separation.
Assessment of the analytical method using the QbD approach
The Analytical Quality by Design (AQbD) methodology is divided into several phases. The initial phase focuses on defining an analytical target product profile, a key element of the AQbD system that specifies what to measure and how to measure it to ensure the desired quality outcome. The next phase focuses on identifying critical analytical attributes (CAAs), which pertain to method and parameter characteristics such as retention times, resolution, theoretical plates, tailing factor, product identification, peak separation, robustness, accuracy, and precision. Critical method attributes (CMAs) influencing the performance of the analytical technique include flow rate, mobile phase composition, and column oven temperature. CMAs also affect operational factors like sample concentration and the quality of reagents used. The design of experiments (DoE) approach is used to identify key processes and establish a design space through statistical analysis. Method validation offers reliable confirmation of quality results, while a control strategy ensures the method operates as intended [23-26].
Optimisation of the RP-UPLC method using central composite design
The central composite design, a variant of the DoE software (version 11.0), was used to optimize the UPLC method by incorporating both independent and dependent variables. In this research, three independent variables were selected: flow rate (A), mobile phase composition (B), and column oven temperature (C) (table 1). The selection of flow rate, mobile phase composition, and column temperature as independent variables is based on their significant impact on chromatographic performance. Mobile phase composition directly affects analyte retention and resolution; flow rate influences retention time, peak shape, and system pressure; while column temperature alters analyte-stationary phase interactions, improving peak symmetry and reproducibility. Together, these variables allow fine-tuning of separation efficiency, run time, and method robustness during optimisation. The dependent variables for HYAL and ATEZ included retention times (RT), resolution, theoretical plates, and tailing factor. Various interaction effects, quadratic effects, and polynomial calculations were employed to evaluate the results of 20 experimental runs, as illustrated in table 2. Data regarding method validation, polynomial equations, and coefficients are provided in the Results and Discussion Section. Response surface methodology was employed to assess the relationships among the variables, while analysis of variance (ANOVA) was conducted to validate the model’s significance. The range for the dependent parameters was set as follows: flow rate between 0.27 and 0.33 ml/min, mobile phase composition between 50% and 60%, and column temperature between 27 °C and 33 °C, as outlined in table 1.
Analytical method validation
Following the ICH Q2 (R2) guidelines, the established method was assessed for system suitability, linearity, specificity, accuracy, precision, robustness, LOD, LOQ, stability, and forced degradation studies [27].
System suitability test
This test is a crucial aspect of chromatography used to assess the process reproducibility and to check that the procedure is acceptable for the practice. This was executed at MQC concentrations of HYAL (0.2 ppm) and ATEZ (500 ppm) by injecting six replicates. Retention time, resolution, theoretical plates, and tailing factor were assessed. %RSD for retention time and peak area was maintained within 2%. The tailing factor did not exceed 2, and theoretical plates were above 2000 (table 2).
Table 1: Coded values for independent variables
| Factor (independent variable) | Coded values given factor | Levels | ||
| Low (-1) | Intermediate (0) | High (+1) | ||
| Flow rate | A | 0.27 | 0.30 | 0.33 |
| Mobile phase % (v/v) | B | 50 | 55 | 60 |
| Column temperature (°C) | C | 27 | 30 | 33 |
Specificity and linearity range
Specificity is an important parameter that refers to an analytical method's ability to differentiate the analyte(s) from other components present in the sample matrix. This was assessed by comparing the chromatograms of the specific drug and its combination and a blank sample (without HYAL and ATEZ) at MQC concentration. Linearity was assessed using six concentration levels for HYAL (0.05-0.3 µg/ml) and ATEZ (125-750 µg/ml), plotting peak areas against concentrations, and performing regression analysis. The correlation coefficient (R²) exceeded 0.99, ensuring compliance with linearity criteria.
Robustness
The robustness assessment was carried out by examining the influence of flow rate, mobile phase, and column temperature through minor variations in chromatographic settings. Analytes were analysed under minor modifications in mobile phase composition (50-60%), flow rate (0.27-0.33 ml/min), and column temperature (27-33 °C). The impact of these method adjustments was examined, and the results were evaluated. The analysis was carried out at the MQC concentration, with each sample and variation tested in triplicate. The robustness of HYAL and ATEZ was determined using %RSD, with an acceptance criterion of ≤2%. Furthermore, the tailing factor and theoretical plates exhibited no significant alterations. These minor adjustments confirm that the established technique remains robust for the quantification of both components.
Recovery (accuracy) and precision
Recovery, expressed as % accuracy, represents how closely the obtained value aligns with the true value. It was calculated by using the standard addition method, where HYAL and ATEZ standards were spiked into the formulation matrix solution at 50%, 100%, and 150% of the intended QC concentration. Each QC concentration level was analysed in triplicate, % recovery and along with its %RSD were calculated. The acceptable recovery range was maintained between 90% and 110%, with a %RSD threshold of ≤2%.

Precision refers to the reproducibility of a method when applied multiple times under varying conditions. Both analytes underwent interday and intraday QC testing to evaluate precision. Intra-day precision (repeatability) was assessed by preparing and analysing six successive test solutions at three QC concentrations (LQC, MQC and HQC), whereas inter-day precision (intermediate precision) was evaluated by conducting the same study over three different days. The %RSD was measured for both intra-day and inter-day precision to confirm method reliability, with an acceptance limit of %RSD ≤2%.
Table 2: Design of experiments as per the central composite design for optimisation of parameters for analysis of HYAL and ATEZ
| Run | Factor A | Factor B | Factor C | Response 1 retention time (min) | Response 2 retention time (min) |
Response 3 resolution | Response 4 theoretical plates | Response 5 tailing factor |
| 1 | 0.24 | 55 | 30 | 1.083 | 1.782 | 5 | 2889 | 1.22 |
| 2 | 0.3 | 55 | 30 | 0.882 | 1.39 | 3.6 | 2739 | 1.21 |
| 3 | 0.27 | 60 | 27 | 1.032 | 1.64 | 4 | 2686 | 1.43 |
| 4 | 0.27 | 50 | 27 | 1.054 | 2.291 | 7.7 | 3543 | 1.23 |
| 5 | 0.3 | 63.4 | 30 | 0.883 | 1.301 | 3 | 2069 | 1.44 |
| 6 | 0.3 | 55 | 30 | 0.871 | 1.371 | 3.5 | 2738 | 1.21 |
| 7 | 0.33 | 50 | 33 | 0.788 | 1.697 | 6.6 | 2631 | 1.12 |
| 8 | 0.33 | 60 | 27 | 0.836 | 1.32 | 3.6 | 2030 | 1.33 |
| 9 | 0.27 | 60 | 33 | 0.941 | 1.488 | 3.8 | 2191 | 1.32 |
| 10 | 0.3 | 46.5 | 30 | 0.917 | 2.304 | 8.8 | 3116 | 1.13 |
aAbbreviations: A, flow rate (ml/min); B, mobile phase %; C, column temperature (°C)
Sensitivity: LOD and LOQ
The sensitivity of the analytical method was assessed by analysing the LOD and LOQ using the established method. LOD represents the lowest concentration on the calibration curve with a signal-to-noise ratio (S/N) of ≥3, while LOQ is the minimum concentration producing an S/N of ≥10 with a %RSD (n=3) exceeding 10%. LOD was identified as the smallest detectable concentration, whereas LOQ was the concentration that allowed accurate and precise quantification. Both LOD and LOQ were determined by performing triplicate analyses.
The LOD and LOQ of HYAL and ATEZ were determined using the following equations:


To validate these limits, solutions with known concentrations near the LOD and LOQ values were prepared and analysed. The precision at the LOQ level was further evaluated by injecting six separate preparations of HYAL and ATEZ and calculating the %RSD of the peak areas.
Forced degradation studies of analytes
Forced degradation studies were conducted to evaluate the stability of HYAL and ATEZ under various stress conditions including oxidation with 20% H₂O₂ at 60 °C for 30 min, acid degradation with 2N HCl under reflux at 60 °C for 30 min, alkaline degradation with 2N NaOH at 60 °C for 30 min, dry heat exposure at 105 °C for six hours, photolytic degradation by UV light (200 Wh/m²) exposure for seven days, and neutral degradation by water reflux at 60 °C for six hourswith all samples subsequently diluted to specified concentrations and analyzed via UPLC to assess chromatographic stability.
Application of the simultaneous analytical method for ATEZ and HYAL-loaded nano-hydrogel
The synthesis of a chitosan-based hydrogel nanocarrier for ATEZ and HYAL follows three key steps: nanoparticle encapsulation, hydrogel formation, and enzyme incorporation. First, ATEZ is encapsulated into chitosan nanoparticles using an ionic gelation technique, in which 0.5 g of chitosan is dissolved in 100 ml of an acidic aqueous solution and crosslinked with tripolyphosphate (TPP) under continuous stirring at room temperature for 24 h. The resulting nanoparticles were then freeze-dried for further use. Next, hydrogel is prepared by dissolving chitosan in phosphate-buffered saline (PBS, pH 6.5) and incorporating 750 µg of ATEZ in 100 ml under gentle mixing for 10 h at room temperature. Crosslinking was achieved using 0.5% (w/v) Genipin, a natural crosslinker that enhances hydrogel stability while preserving biocompatibility. Finally, 0.3 µg of HYAL was dissolved in 100 ml of PBS at 4 °C and incorporated into the resultant hydrogel system by mixing equal volumes.
RESULTS AND DISCUSSION
Initial method development investigations
This study was carried out to assess the feasibility and suitability of various chromatographic settings for optimal separation. The mobile phase comprised acetonitrile as the organic modifier, while the aqueous phase (pH 2.0) was adjusted using trifluoroacetic acid as a pH regulator, maintaining a volumetric ratio of 58:42% (v/v). Initial experimental trials utilizing this solvent system with 0.3 ml/min flow rate, a column temperature of 30 °C, and a sample injection volume of 1μl resulted in the distinguishing peaks of analytes. However, the peaks lacked symmetry, and some tailing was detected. To address these issues, comprehensive screening of the diverse chromatographic parameters was undertaken to optimise method performance systematically.
Evaluation of the analytical method using the QbD approach
In a QbD paradigm, the analytical target profile (ATP) serves as a framework for method development, akin to the quality target product profile (QTPP) in pharmaceutical formulation. ATP outlines the desired characteristics of CAAs based on the method’s future use and regulatory criteria. It indicates essential parameters, including analyte identification, target concentration range, and technique specifications. Analytical method performance is governed by critical method parameters (CMPs), which influence CAAs through a cause-and-effect interplay with critical quality attributes (CQAs) [28]. Three fundamental CMPs that dictate the UPLC method performance include flow rate, mobile phase composition, and column oven temperature. Column ageing, for instance, may impact tailing factors and plate numbers, affecting the resolution of analytes (CAA). In this experimental design, retention time (RT), resolution, theoretical plates, and tailing factor were identified as CAAs (table 4). A central composite design was implemented to assess these factors at three levels using design software. Three-dimensional (3D) response surface plots were generated to visualise the influence of independent variables. A risk assessment analysis was conducted to identify critical variables impacting the ATP, and the optimisation results are summarised in table 2. Significant variations were observed in the responses. Table 2 presents the dependent variables alongside their expected and actual R² values, demonstrating good agreement. The robustness of the model was further supported by an adjusted R² value, with discrepancies limited to ≤0.2, confirming a strong correlation between experimental data and the predictive model. A polynomial regression equation was employed to describe the relationship between independent and dependent variables. The model’s adequate precision, which measures the signal-to-noise (S/N) ratio, was found to exceed 4, establishing its suitability for defining the analytical design space.
The 3D surface plots provide a comprehensive visualisation of the effects of independent variables on key analytical responses (fig. 1-4). Retention time (RT) was significantly influenced by the flow rate, where an increase in flow rate led to a notable reduction in RT for both analytes. However, the mobile phase ratio and column temperature had no discernible impact on the RT of HYAL, whereas for ATEZ, an increase in these parameters resulted in a gradual decrease in RT. This suggests that while flow rate is the primary determinant of RT, ATEZ is more sensitive to variations in mobile phase composition and temperature. Resolution between the two analytes was also affected by the method variables (fig. 2). An increase in the mobile phase ratio and column temperature led to a reduction in the resolution of both analytes. This trend indicates that excessive organic phase or elevated temperatures may compromise separation efficiency. Furthermore, theoretical plates, an indicator of column efficiency, showed a decreasing trend with increasing values of all independent variables, particularly for HYAL (fig. 3). This suggests that higher flow rates, increased organic solvent concentration, and elevated column temperatures may reduce the efficiency of analyte retention and peak sharpness. Regarding the tailing factor, a slight increase was observed for ATEZ with a higher mobile phase ratio, while flow rate and column temperature exhibited negligible effects (fig. 4). This indicates that excessive organic solvent proportions may contribute to peak asymmetry for ATEZ, whereas the other variables had minimal influence on peak shape.
To date, no analytical methods have been reported for the combination of these drugs; only individual method validations are available in the literature [29-33]. However, developing a method for this combination is highly beneficial, as it offers improved therapeutic efficacy and patient compliance.
A statistical Analysis of Variance (table 12) confirmed that the P-value (<0.05) was statistically significant, signifying that the tested variables had a substantial impact on the resolution of HYAL and ATEZ peaks. This validation underscores the reliability of the model in predicting the performance of the analytical method and optimising chromatographic conditions. Fig. 5 and 6 illustrate composite response surface plots, including 2D contour plots, cube plots, and 3D response surfaces, which highlight the combined effects of method parameters. Among the independent variables, the flow rate, mobile phase composition, and column oven temperature were the most influential in determining the resolution between HYAL and ATEZ peaks. Using Design-Expert software, the optimal chromatographic conditions were established as follows: flow rate of 0.3 ml/min, mobile phase pH of 2.0, and column oven temperature of 30 °C. At these optimised settings, all method responses were within the acceptable range, ensuring robust performance and reproducibility. The minimal estimated error (±5%) between predicted and experimental values further confirmed the model’s predictive accuracy. Under these refined conditions, the chromatographic method successfully achieved excellent peak resolution and analyte separation, as demonstrated in fig. 7 and 8.
Table 3: ATP parameters for method development
| Parameters | Target | Justification |
| Sample | HYAL and ATEZ | Development of an analytical technique for the simultaneous estimation of HYAL and ATEZ |
| Instrument | UPLC | HYAL and ATEZ are non-volatile with UV absorbance; thus, a UPLC method with a UV detector was deemed suitable |
| Method type | RP-UPLC | A non-polar stationary phase enhances molecular retention and resolution |
| Sample nature | Aqueous | Ensures complete miscibility of the analytes in the aqueous phase |
| Standard and sample preparation | Acetonitrile and water (1:1, v/v) | Selection based on the pKa and solubility of HYAL and ATEZ, ensuring buffer compatibility with the diluent |
Table 4: Relationship between CMP and CAA in the method development
| S. No. | CMP | CAA |
| 1 | Flow Rate | Retention time |
| 2 | Mobile Phase | Resolution |
| 3 | Column Oven Temperature | Theoretical plate counts |
| 4 | Tailing factor |
Method validation
System suitability test
System suitability was assessed by determining the relative standard deviation (%RSD) for retention time (RT), theoretical plate number, tailing factor, and resolution for both analytes. The %RSD values remained within the acceptable threshold (±2%), as shown in table 5. The mean %RSD for the theoretical plate number and tailing factor across six replicate injections was 0.39% and 1.98% for HYAL and 0.22% and 0.38% for ATEZ, respectively. System precision parameters confirmed that theoretical plate counts exceeded the benchmark of 2000, validating the method's robustness. The compliance with ICH guidelines attests to the suitability and reliability of the UPLC methodology.
Table 5: Results of system suitability parameters for HYAL and ATEZ
| System suitability parameters | HYAL | ATEZ | ||||||
| RT | Theoretical plates | Tailing factor | RT | Theoretical plates | Tailing factor | |||
| Rep-1 | 0.833 | 4608 | 1.17 | 1.272 | 8195 | 1.09 | ||
| Rep-2 | 0.833 | 4623 | 1.17 | 1.273 | 8210 | 1.08 | ||
| Rep-3 | 0.833 | 4617 | 1.22 | 1.273 | 8239 | 1.08 | ||
| Rep-4 | 0.833 | 4606 | 1.17 | 1.273 | 8228 | 1.08 | ||
| Rep-5 | 0.84 | 4653 | 1.21 | 1.281 | 8192 | 1.08 | ||
| Rep-6 | 0.849 | 4638 | 1.17 | 1.289 | 8216 | 1.08 | ||
| Mean±SD (n=6) | 0.84±0.01 | 4624±18.26 | 1.18±0.02 | 1.28±0.01 | 8213±18.35 | 1.08±0.00 | ||
| RSD (%) | 0.79 | 0.39 | 1.98 | 0.53 | 0.22 | 0.38 | ||
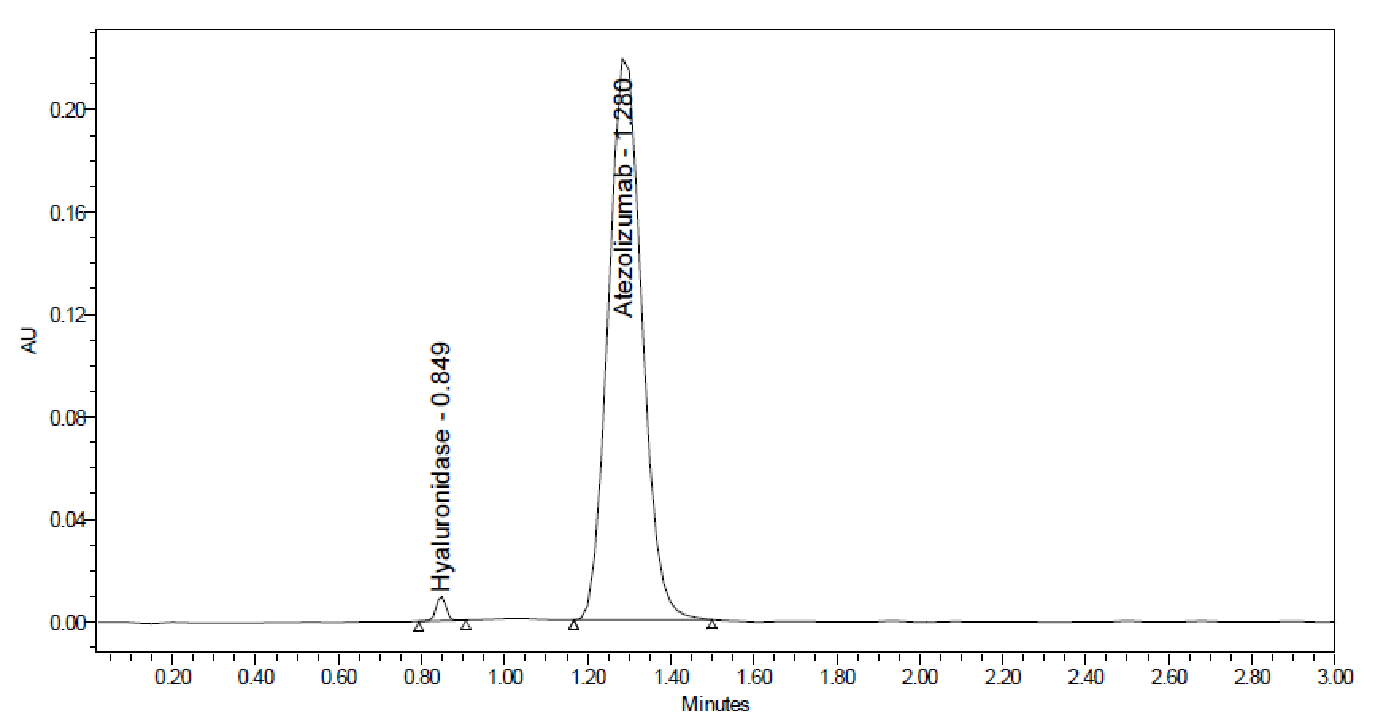
Fig. 1: Representative chromatogram of HYAL and ATEZ at MQC concentration
Specificity
Specificity was determined by evaluating and comparing the chromatograms of HYAL and ATEZ, separately and in combination, at a predetermined concentration (fig. 1). The retention times (RT) of HYAL and ATEZ were 0.849±0.05 min and 1.280±0.06 min, respectively, remaining consistent irrespective of single or mixed analysis. Absence of interfering peaks confirmed that the developed method is extremely selective for the quantification of HYAL and ATEZ.
Linearity
The calibration curve established linearity between peak area and analyte concentration (0.05-0.3 µg/ml for HYAL, 125-750 µg/ml for ATEZ). The linear regression equations were as follows: for HYAL, y = 9450242x+592.78 (R2 = 0.9995), and for ATEZ, y = 13479x+2012.1 (R2 = 0.9996), respectively (fig. 2). These results validate a strong linear correlation for both analytes (fig. 2).
Robustness
This analytical method was evaluated by minor adjustments in UPLC conditions, such as flow rate (0.27, 0.3, 0.33 ml/min), column temperature (27, 30, 33 °C), and mobile phase composition (53:47, 58:42, 63:37). During robustness testing, minor variations in mobile phase composition (±2%) and flow rate (±0.1 ml/min) showed noticeable effects on peak shape and resolution. Slight increases in organic content led to reduced retention times and potential co-elution, while decreases caused broader peaks. Similarly, changes in flow rate affected peak symmetry and resolution: higher flow reduced separation efficiency, while lower flow slightly improved resolution but increased run time. Overall, the method remained robust within the tested variation limits. The %RSD values for RT, theoretical plates, and tailing factor remained within the acceptable range (≤2%), confirming the method's robustness (table 6).
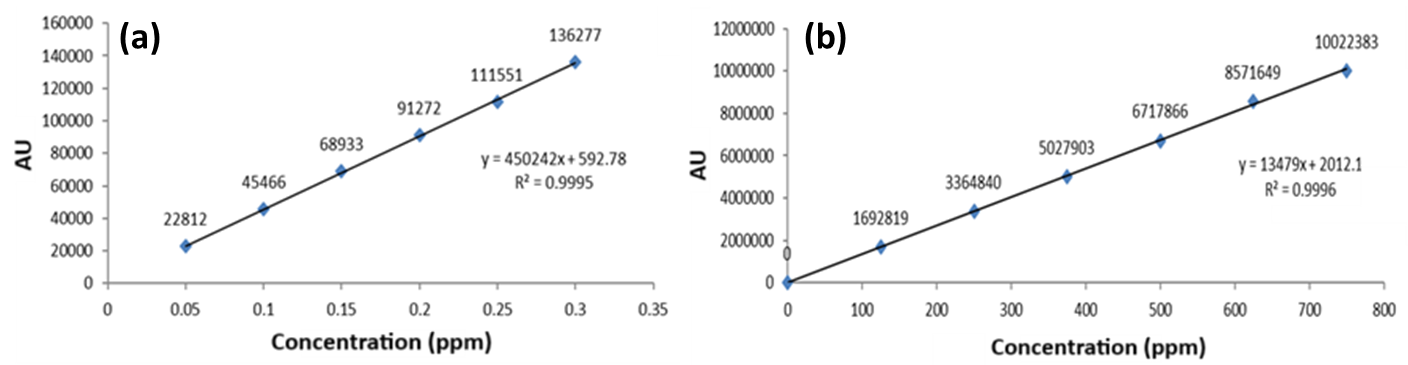
Fig. 2: Calibration plot of (a) HYAL and (b) ATEZ
Table 6: Results of robustness parameters for HYAL and ATEZ
| Chromatographic conditions | HYAL | ATEZ | ||||||
| Peak area | Retention time (RT) | Theoretical plates (N) | Tailing factor (T) | Peak area | Retention time (RT) | Theoretical Plates (N) | Tailing factor (T) | |
| A: Flow rate (±0.1 ml/min) Optimized method: 0.3 ml/min | ||||||||
| 0.27 ml/min | 90562 | 0.884 | 4624 | 1.21 | 6798937 | 1.350 | 8194 | 1.08 |
| 0.3 ml/min | 91239 | 0.833 | 4608 | 1.17 | 6794199 | 1.272 | 8195 | 1.09 |
| 0.33 ml/min | 93925 | 0.795 | 4538 | 1.15 | 6593298 | 1.209 | 7942 | 1.08 |
| Mean±SD | 91908±1778.7 | 0.837±0.04 | 4590±45.7 | 1.18±0.03 | 6728811±117381.9 | 1.28±0.07 | 8110±145.8 | 1.08±0.006 |
| B: Column oven temperature (±3 °C) Optimized method: 30 °C | ||||||||
| 27 °C | 91455 | 0.839 | 4581 | 1.17 | 6665401 | 1.252 | 8047 | 1.09 |
| 30 °C | 91679 | 0.833 | 4623 | 1.17 | 6798740 | 1.273 | 8210 | 1.08 |
| 33 °C | 92168 | 0.836 | 4543 | 1.20 | 6683527 | 1.304 | 7991 | 1.10 |
| Mean±SD | 91767±364.6 | 0.836±0.003 | 4582±40.01 | 1.18±0.01 | 6715889±72320 | 1.28±0.03 | 8082±113.8 | 1.09±0.01 |
| C: Mobile phase composition (5% v/v) Optimized method: 58:42 | ||||||||
| 63:37 | 94209 | 0.837 | 4519 | 1.24 | 6663142 | 1.334 | 7962 | 1.11 |
| 58:42 | 91602 | 0.833 | 4617 | 1.22 | 6775467 | 1.273 | 8239 | 1.08 |
| 53:47 | 91654 | 0.832 | 4573 | 1.17 | 6219973 | 1.220 | 8025 | 1.08 |
| Mean±SD | 92488±1490.4 | 0.834±0.002 | 4569±49.09 | 1.21±0.03 | 6552860±293708.9 | 1.275±0.05 | 8075±145.1 | 1.09±0.01 |
Table 7: Results of method accuracy (recovery) for HYAL and ATEZ
| Spiked concentration (µg/ml) | Recovered concentration (µg/ml) | % Concentration found | Recovery mean %±SD (n=3) | %RSD | ||||
| R1 | R2 | R3 | R1 | R2 | R3 | |||
| HYAL | ||||||||
| 0.1 (50 %) | 0.102 | 0.100 | 0.099 | 100.9 | 100.1 | 99.1 | 100.03± 0.90 | 0.90 |
| 0.2 (100 %) | 0.199 | 0.200 | 0.198 | 99.9 | 100.3 | 99.3 | 99.83± 0.50 | 0.50 |
| 0.3 (150 %) | 0.299 | 0.295 | 0.299 | 99.9 | 98.4 | 99.8 | 99.37±0.84 | 0.84 |
| ATEZ | ||||||||
| 250 (50 %) | 249.03 | 251.09 | 247.56 | 99.61 | 100.43 | 99.02 | 99.69± 0.71 | 0.71 |
| 500 (100 %) | 498.22 | 500.51 | 497.50 | 99.64 | 100.10 | 99.44 | 99.73± 0.34 | 0.34 |
| 750 (150 %) | 745.79 | 741.20 | 746.30 | 99.44 | 98.83 | 99.51 | 99.26± 0.37 | 0.37 |
Accuracy
The accuracy, determined by %recovery, ranged between 98% and 102% for both substances across all QC concentrations (table 7). The method demonstrated high precision and reliability.
Precision
The relative standard deviation (%RSD) recovery for both intraday and interday precision assessments was determined, yielding values within the range of 0.05–0.3 µg/ml for HYAL and 125–750 µg/ml for ATEZ. The obtained data substantiate the method’s high precision and reproducibility, with %RSD consistently remaining below 2%, as outlined in table 8. These findings affirm the method’s robustness, repeatability, and reliability for quantitative analysis. A summary of the method validation data for the proposed analytical method is presented in table 9.
Table 8: Intraday precision and interday precision
| Nominal QC (µg/ml) | Repeatability (Intraday precision) | Intermediate precision (Inter-day) | ||
| Mean±SD | (RSD, %) | Mean±SD | (RSD, %) | |
| HYAL | ||||
| 0.1 | 0.101±0.001 | 0.99 | 0.102±0.002 | 1.96 |
| 0.2 | 0.202±0.003 | 1.49 | 0.205±0.001 | 0.49 |
| 0.3 | 0.299±0.002 | 0.67 | 0.298±0.003 | 1.01 |
| ATEZ | ||||
| 250 | 250.05±2 | 0.80 | 250.29±6 | |
| 500 | 498±3 | 0.60 | 502±4 | 0.80 |
| 750 | 749±4 | 0.53 | 748±5 | 0.67 |
Table 9: Method validation data for the proposed analytical method
| Parameter name | HYAL | ATEZ | |
| System suitability | |||
| USP tailing(less than 2.0) | 1.1 | 1 | |
| USP plate (more than 2000) | 4580 | 8089 | |
| RSD percent (n=6, less than 2.0) | 0.6 | 0.6 | |
| Specificity | |||
| Diluent interference (no peak should be at analyte RT) | No peak | No peak | |
| Placebo interference (no peak should be at analyte RT) | No peak | No peak | |
| Peak purity | Passed | Passed | |
| Linearity | |||
| Range (µg/ml) | 0.05 – 0.3 | 125-750 | |
| Slope | 450242 | 13479 | |
| Intercept | 592.78 | 2012.1 | |
| Correlation coefficient>0.999 | 0.999 | 0.999 | |
| Accuracy (n=6, avg percentage) | |||
| 50% avg±SD | 100±0.7 | 99.6± 0.5 | |
| 100% avg±SD | 99.8±0.4 | 99.7±0.2 | |
| 150% avg±SD | 99.3±0.7 | 99.3±0.3 | |
| Precision | |||
| Inter-day, n=6 %RSD less than 2.0 | 0.5 | 0.2 | |
| Intermediate precision | |||
| Intra-day, n=6 %RSD less than 2.0 | 0.1 | 0.3 |
Sensitivity (LOD and LOQ)
LOD and LOQ were determined using signal-to-noise ratios of 3:1 and 10:1, respectively, yielding values of 0.002 and 0.006 µg/ml for HYAL and 1.49 and 4.52 µg/ml for ATEZ, respectively. These results demonstrate the high sensitivity of the developed method.
Stability studies
Forced degradation studies assessed analyte stability under stress conditions (acidic, alkaline, oxidative, thermal, photolytic, and neutral degradation). No significant degradation products were observed except under UVC exposure, necessitating caution (fig. 9). Stability data across different QC levels are summarised in table 10.
Table 10: Stability study of HYAL and ATEZ at all QC levels under various conditions
| Level | 2N HCl | 2N NaOH | Oxidative | Thermal | Photostability |
| HYAL | |||||
| LQC | 93.18±1.8 | 94.37±1.8 | 94.66±1.7 | 97.83±1.5 | 98.19±1.5 |
| MQC | 95.18±2.0 | 96.18±1.7 | 94.18±2.0 | 98.18±1.8 | 98.18±1.5 |
| HQC | 94.18±1.5 | 97.18±1.8 | 97.18±1.8 | 97.18±1.6 | 98.18±1.8 |
| ATEZ | |||||
| LQC | 93.21±2.0 | 94.09±1.7 | 94.28±1.8 | 98.03±1.5 | 98.31±1.6 |
| MQC | 94.18±1.8 | 95.18±1.8 | 97.18±1.5 | 97.18±1.6 | 98.98±1.5 |
| HQC | 96.18±1.8 | 97.18±1.5 | 96.18±1.5 | 98.18±1.8 | 98.80±1.8 |
Results are given in mean±SD, n=3
Optimized analytical method and pharmaceutical applications
The developed UPLC method was successfully applied to quantify HYAL and ATEZ in nano formulations, ensuring accurate entrapment analysis. The calibration range adequately covered quantification needs in in vitro and ex vivo studies, with no additional peaks interfering at the RT of HYAL and ATEZ. The high specificity and precision confirm the method's suitability for pharmaceutical applications. The quantitative determination of HYAL and ATEZ, when present concomitantly in real samples and nano formulations, is presented in table 11 using the proposed UPLC assay.
Table 11: Quantitative determination of HYAL and ATEZ when present concomitantly in real samples and nano formulation by the proposed UPLC assay
| Sample | HYAL | ATEZ | ||
| Original concentration | This assay (%) | Original concentration | This assay (%) | |
| Sample 1 | 0.75 mg | 0.748 mg (99.74%) | 1875 mg | 1860 mg (99.21%) |
| Sample 2 | 1.5 mg | 1.489 mg (99.3%) | 2500 mg | 2490 mg (99.6) |
| Nano formulation | 0.1 mg | 0.098 mg (98 %) | 250 mg | 249.9 mg (99.96) |
Table 12: ANOVA for resolution among HYAL and ATEZ
| Source | Sum of squares | Degrees of freedom | Mean square | F-value | p-value | |
| Model | 55.94 | 9 | 6.22 | 572.61 | <0.0001 | significant |
| Flowrate | 0.4847 | 1 | 0.4847 | 44.65 | <0.0001 | |
| Mobile phase | 40.28 | 1 | 40.28 | 3711.08 | <0.0001 | |
| Column oven Temp | 0.7413 | 1 | 0.7413 | 68.30 | <0.0001 | |
| Residual | 0.1085 | 10 | 0.0109 | |||
| Cor Total | 56.05 | 19 |
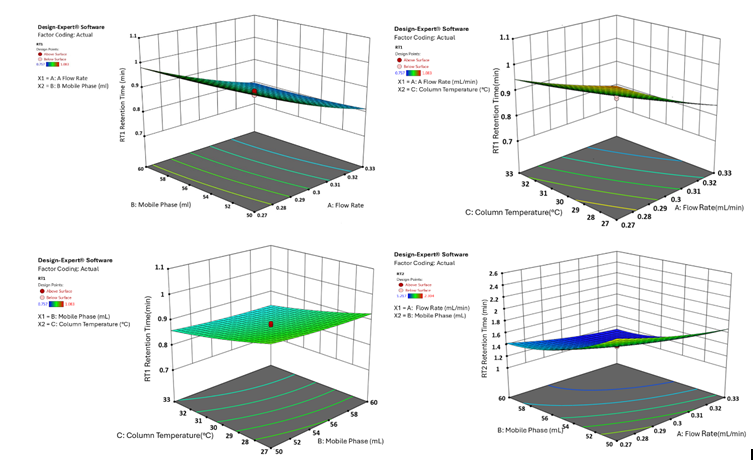
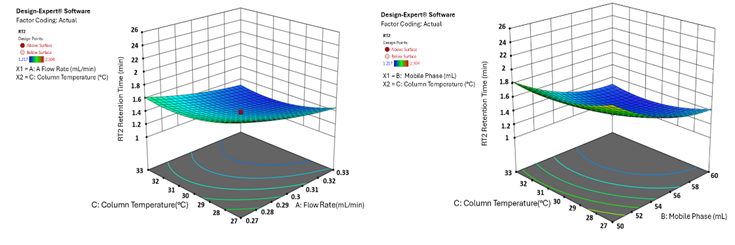
Fig. 3: 3D surface plot illustrating the effect of factor combinations on the retention time of HYAL and ATEZ using CCD
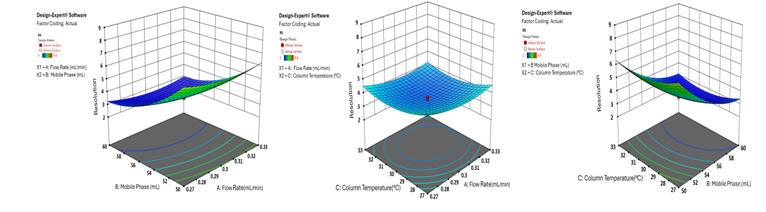
Fig. 4: 3D surface plot illustrating the effect of factor combinations on the resolution between HYAL and ATEZ using CCD
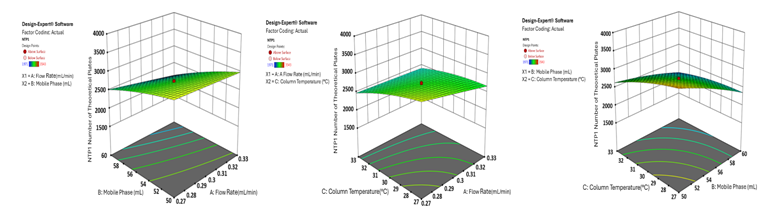
Fig. 5: 3D surface plot depicting the effect of factor combinations on the theoretical plate count of HYAL using CCD
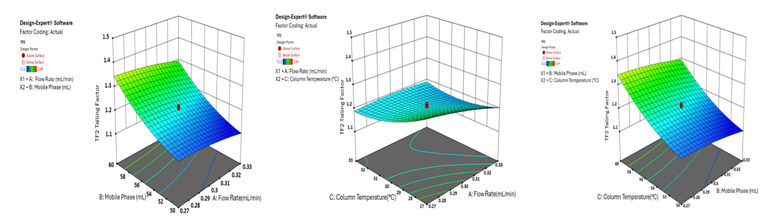
Fig. 6: 3D surface plot demonstrating the effect of factor combinations on the tailing factor (peak asymmetry) of ATEZ using CCD
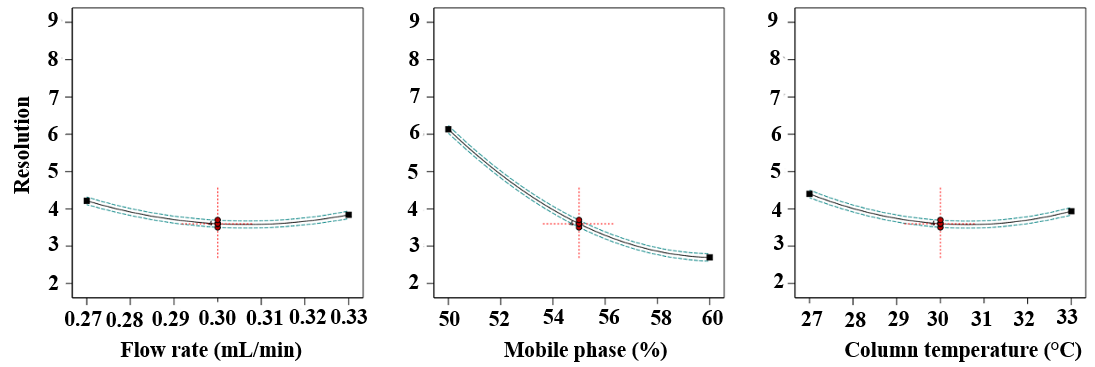
Fig. 7: Plot showing the resolution between HYAL and ATEZ (all factor coding)
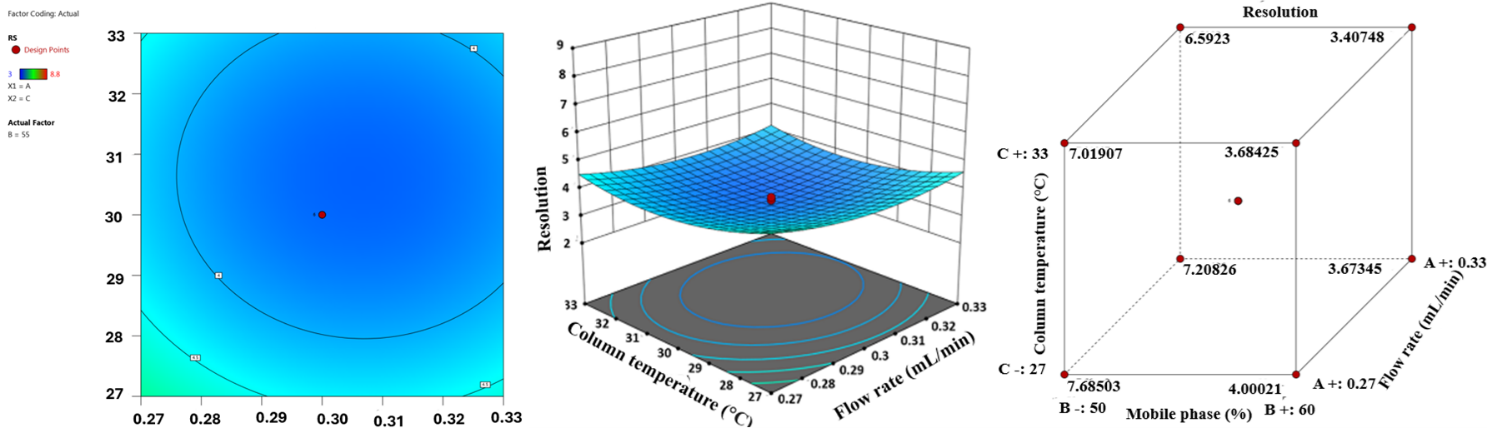
Fig. 8: (a) Contour plot illustrating the resolution between HYAL and ATEZ, (b) 3D plot depicting the resolution between HYAL and ATEZ, and (c) cube plot representing the resolution between HYAL and ATEZ
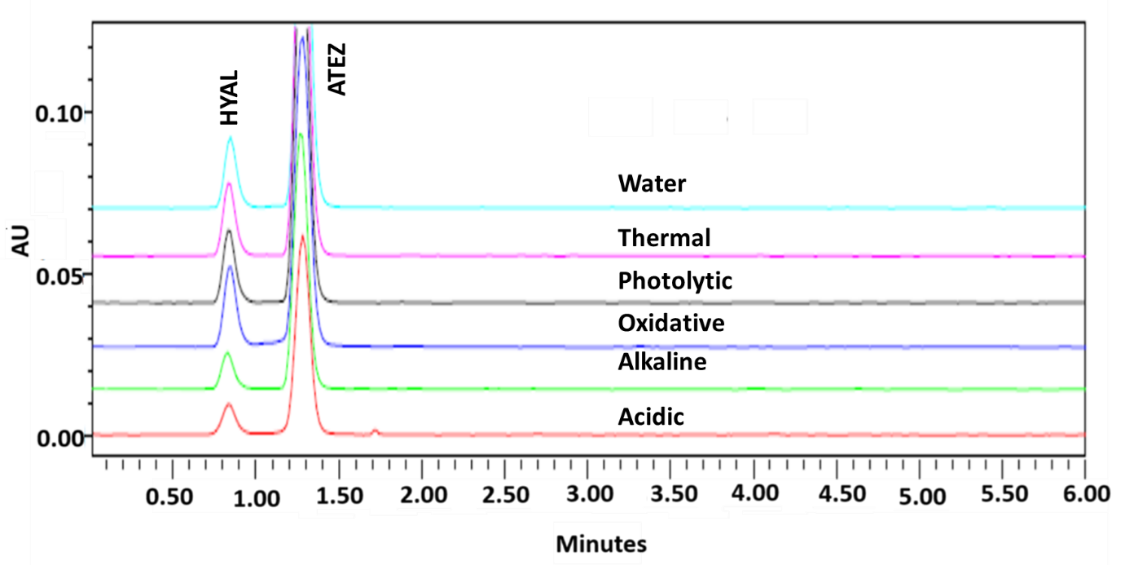
Fig. 9: Overlay RP-UPLC chromatogram of individual samples exposed to various stress conditions
CONCLUSION
The present research proposes a novel RP-UPLC method, successfully developed and validated for the simultaneous estimation of HYAL and ATEZ in nano formulation. The method demonstrated excellent recovery rates, with HYAL ranging from 98% to 99.74% and ATEZ from 99.21% to 99.96%, confirming the method's precision and suitability for routine quality control. These findings validate the UPLC assay as a robust tool for the concurrent determination of HYAL and ATEZ in complex matrices. The integration of anAQbD approach and the CCD significantly enhances the method’s precision, robustness, and reliability, ensuring efficient resolution and accurate quantification of both analytes. The validated technique demonstrates high accuracy, sensitivity, and reproducibility, making it well-suited for routine pharmaceutical analysis. This validated RP-UPLC method is recommended for future application and widespread implementation in pharmaceutical quality control settings to ensure consistent and reliable analysis of HYAL and ATEZ in complex formulations.
ACKNOWLEDGEMENT
The authors acknowledge the management of Imptech Scientific, Hyderabad, for providing laboratory and analytical instrumentation facilities.
FUNDING
Nil
AUTHORS CONTRIBUTIONS
Raju Mudhulkar and JSK (designing the study and writing). NKK (all kinds of analytical support). SG and ASK (technical support). All authors have reviewed and approved the final version of the manuscript.
CONFLICT OF INTERESTS
The authors declare no conflict of interest
REFERENCES
Zaimy MA, Saffarzadeh N, Mohammadi A, Pourghadamyari H, Izadi P, Sarli A. New methods in the diagnosis of cancer and gene therapy of cancer based on nanoparticles. Cancer Gene Ther. 2017 Jun 2;24(6):233-43. doi: 10.1038/cgt.2017.16, PMID 28574057.
World Health Organization. Lung Cancer; 2023. Available from: https://www.who.int/news-room/fact-sheets/detail/lung-cancer.
World Heart Federation. Tobacco; 2023. Available from: https://world-heart-federation.org/what-we-do/tobacco. [Last accessed on 17 Jul 2025].
Chen Z, Fillmore CM, Hammerman PS, Kim CF, Wong KK. Non-small cell lung cancers: a heterogeneous set of diseases. Nat Rev Cancer. 2014 Aug 14;14(8):535-46. doi: 10.1038/nrc3775, PMID 25056707.
Lindeman NI, Cagle PT, Beasley MB, Chitale DA, Dacic S, Giaccone G. Molecular testing guideline for selection of lung cancer patients for EGFR and ALK tyrosine kinase inhibitors: guideline from the college of American pathologists International Association for the study of Lung Cancer and Association for Molecular Pathology. J Thorac Oncol. 2013 Jul;8(7):823-59. doi: 10.1097/JTO.0b013e318290868f, PMID 23552377.
McDermott DF, Huseni MA, Atkins MB, Motzer RJ, Rini BI, Escudier B. Clinical activity and molecular correlates of response to atezolizumab alone or in combination with bevacizumab versus sunitinib in renal cell carcinoma. Nat Med. 2018;24(6):749-57. doi: 10.1038/s41591-018-0053-3, PMID 29867230.
McDermott DF, Sosman JA, Sznol M, Massard C, Gordon MS, Hamid O. Atezolizumab an anti-programmed death ligand 1 antibody in metastatic renal cell carcinoma: long-term safety, clinical activity and immune correlates from a phase Ia study. J Clin Oncol. 2016 Mar;34(8):833-42. doi: 10.1200/JCO.2015.63.7421, PMID 26755520.
Socinski MA, Jotte RM, Cappuzzo F, Orlandi F, Stroyakovskiy D, Nogami N. Atezolizumab for first-line treatment of metastatic nonsquamous NSCLC. N Engl J Med. 2018 Jun 14;378(24):2288-301. doi: 10.1056/NEJMoa1716948, PMID 29863955.
US Food and Drug Administration. FDA approves atezolizumab and hyaluronidase-tqjs for subcutaneous injection; 2024. Available from: https://www.fda.gov/drugs/resources-information-approved-drugs/fdaapproves-atezolizumab-and-hyaluronidase-tqjs-subcutaneous-injection.
Bodke SS, Bhangale CJ, Bhandare SN. Stability indicating UPLC method for estimation of benazepril and hydrochlorothiazide in bulk and combined dosage form. Int J Pharm Pharm Sci. 2024;16(1):22-9. doi: 10.22159/ijpps.2024v16i1.49457.
Bhattacharya K, Randhoni Chanu N, Bhattacharjee A, Jyoti Sahariah B, Melody Devi C, Bordoloi R. Ultra-performance liquid chromatography an updated review. Res J Pharm Technol. 2022 Jan;15(12):5849-53. doi: 10.52711/0974-360X.2022.00987.
Eluru A, Babu KS. A new RP-UPLC method for the separation and simultaneous quantification of dorzolamide HCl and timolol maleate. Int J App Pharm. 2024 Apr;16(3):244-50. doi: 10.22159/ijap.2024v16i3.49491.
Chaitanya SM, Nissankararao S, Gandham SL. A new NP-UPLC method for the separation and simultaneous quantification of ramucirumab and erlotinib. Int J App Pharm. 2021 Nov;13(6):75-81. doi: 10.22159/ijap.2021v13i6.42815.
Tabassum R, Rizwan SH. Stability indicating analytical method development and validation for the estimation of ruxolitinib in bulk and pharmaceutical dosage form using UPLC. Int J Pharm Pharm Sci. 2023 Feb;15(2):40-6. doi: 10.22159/ijpps.2023v15i2.46839.
Dewi MK, Pratama R, Arifka M, Chaerunisaa A. Quality by design: approach to analytical method validation. Sciphar. 2022 Jun;1(1):38-46. doi: 10.58920/sciphar01010033.
Nunsavathu SN, Rajaganapathy K. A review on QBD approach in analytical method development and validation. IJPQA. 2024 Sep;15(3):1707-13. doi: 10.25258/ijpqa.15.3.93.
Xuan DT, Nguyen HM, Hoang VD. Recent applications of analytical quality by design methodology for chromatographic analysis: a review. Chemom Intell Lab Syst. 2024 Nov 15;254:105243. doi: 10.1016/j.chemolab.2024.105243.
Karnam S, Jindal AB, Paul AT. Implementing analytical quality by design in reversed-phase high-performance liquid chromatography for simultaneous estimation of teriflunomide and quercetin: applicability in dual drug-loaded topical microemulsion. J Liq Chromatogr Relat Technol. 2024 Mar;47(6-10):104-21. doi: 10.1080/10826076.2024.2325950.
Pharmaceutical Development International Conference on Harmonization (ICH); 2009;Q8(R2). Available from: https://database.ich.org/sites/default/files/q8_r2_guideline.pdf.
Quality Risk Management International Conference on harmonization (ICH). 2005. p. 9. Available from: https://database.ich.org/sites/default/files/q9_guideline.pdf.
Pharmaceutical quality system, International Conference on Harmonization (ICH). Vol. Q10; 2009. Available from: https://database.ich.org/sites/default/files/Q10%20Guideline.pdf.
Development and manufacture of drug substances International Conference on Harmonization (ICH). Vol. Q11; 2012. Available from: https://database.ich.org/sites/default/files/Q11%20Guideline.pdf.
Kumari N, Singh B, Saini G, Chaudhary A, Verma K, Vyas M. Quality by design: a systematic approach for the analytical method validation. J Drug Delivery Ther. 2019;9(3-s):1006-12. doi: 10.22270/jddt.v9i3-s.3114.
Yadav NK, Raghuvanshi A, Sharma G, Beg S, Katare OP, Nanda S. QBD-based development and validation of a stability indicating HPLC method for estimating ketoprofen in bulk drug and proniosomal vesicular system. J Chromatogr Sci. 2016 Oct;54(3):377-89. doi: 10.1093/chromsci/bmv151, PMID 26514627.
Validation of analytical procedures: text and Methodology International Conference on Harmonization (ICH). Vol. Q2(R1); 2005. Available from: https://database.ich.org/sites/default/files/q2%28r1%29%20guideline.pdf.
Narikimalli A, Galla R. A stability indicating UPLC method development and validation for the simultaneous estimation of nateglinide and metformin hydrochloride in bulk and tablet dosage form. Futur J Pharm Sci. 2023 Jun;9(1):55. doi: 10.1186/s43094-023-00503-2.
Validation of analytical procedures International Conference on Harmonization (ICH). Vol. Q2(R2); 2022. Available from: https://database.ich.org/sites/default/files/ich_q2-r2_document_step2_guideline_2022_0324.pdf.
Sonar P, Shaikh K, Harer S. Development and validation of novel RP-HPLC-DAD method for quantification of lapatinib ditosylate in newer nano-liposome formulation: a quality by design (QBD) approach. Int J App Pharm. 2022 Aug;14(6):239-50. doi: 10.22159/IJAP.2022V14I6.45750.
Hopkins AM, Kichenadasse G, Garrett Mayer E, Karapetis CS, Rowland A, Sorich MJ. Development and validation of a prognostic model for patients with advanced lung cancer treated with the immune checkpoint inhibitor atezolizumab. Clin Cancer Res. 2020;26(13):3280-6. doi: 10.1158/1078-0432.CCR-19-2968, PMID 32086341.
Pauline LM, Karen AM, Leon A, Michiel SH, Alwin DR, Jos HB. A multiplex UPLC-MS/MS method for the quantification of three PD-L1 checkpoint inhibitors atezolizumab avelumab and durvalumab in human serum. 2024 Jun;15(243):116108. doi: 10.1016/j.jpba.2024.116108.
Subbarao Y, Pavani Y, Subbarao M. Simultaneous method development and validation of trastuzumab and hyaluronidase-Oysk and its pharmacokinetic studies with LC-MS/MS. J Pharm Sci Res. 2021 Feb;12(3):375-80.
Babu DC, Chetty CM, Mastanamma SK. Stability indicating RP-HPLC method development and validation for the estimation of atezolizumab in bulk and its injectable dosage form. J Pharm Res Int. 2017 Sep;18(5):1-9. doi: 10.9734/JPRI/2017/35615.
Kallam SD, Rudrapal M, Bodapati A. Simultaneous determination of atezolizumab and bevacizumab by LC–MS/MS in rat plasma and its application to a pharmacokinetic study. Biomed Chromatogr. 2025 Jun;39(7):e70139. doi: 10.1002/bmc.70139, PMID 40525526.