
Int J App Pharm, Vol 17, Issue 5, 2025, 146-158Original Article
QUALITY BY DESIGN (QBD) APPROACH FOR OPTIMIZATION OF MANGIFERIN-LOADED NANOPARTICLES FOR THE SAFE AND EFFECTIVE TREATMENT OF BREAST CANCER
SHIJITH KVa,b, R. NARAYANA CHARYULUa*, SARATH CHANDRAN C.b, PRAKASH PATILc, JOBIN JOSEa
aNITTE (Deemed to be University), NGSM Institute of Pharmaceutical Sciences, Department of Pharmaceutics, Mangaluru-575018, Karnataka, India. bCollege of Pharmaceutical Sciences, Government Medical College, Kannur, Kerala, India. cNITTE (Deemed to be University) KS Hegde Medical Academy (KSHEMA), Central Research Laboratory, India , Kerala, India.
*Corresponding author: R. Narayana Charyulu; *Email: narayana@nitte.edu.in
Received: 07 May 2025, Revised and Accepted: 21 Jun 2025
ABSTRACT
Objective: The primary objective of this investigation was to develop mangiferin (MGF)-loaded bovine serum albumin (BSA) nanoparticles using a Quality by Design (QbD) approach. The study involved characterizing the optimized nanoparticles to confirm their successful formation, assessing their ability to inhibit the growth of MCF-7 breast cancer cell lines, and conducting a toxicity assay following OECD protocol 423.
Methods: MGF-loaded BSA NP was prepared by the modified desolvation method with necessary modification. For the optimization, a QbD framework with a Central Composite Design (CCD) was employed. The optimization was done by evaluating the effect of critical factors such as BSA concentration, MGF loading, and stirring speed on selected responses such as particle size (Ps), polydispersibility index (PDI), zeta potential(Zp) and encapsulation efficiency (EE). The optimized formulation was further analyzed using SEM, FT-IR, and XRD and assessed for in vitro drug release, as well as using the MTT assay, it demonstrated anticancer efficacy against MCF-7 breast cancer cells. Finally, the safety profile of the formulation was established by acute toxicity study in Albino Wistar Rat as per OECD protocol 423.
Results: Successful incorporation of MGF into BSA NP was achieved by modified desolvation technique. 20 formulations were developed as per CCD. The optimized nanoparticles exhibited a Ps of 96.83 nm, PDI of 0.25, Zp of-22.9 mV, and EE of 70.37%. SEM confirmed the spherical morphology, and FT-IR/XRD verified that there are no chemical reactions. The in vitro release study showed 90% drug release within 8 h. In vitro anticancer assays revealed dose-dependent efficacy (ID50:22.32 µg/ml) and comparable with that of doxorubicin. The statistical significance was observed between the optimized formulation and control groups. Acute toxicity studies confirmed its safety (no mortality/toxicity at 2000 mg/kg).
Conclusion: The current investigation shows that MGF-loaded BSANP have a promising release profile for achieving better anti-breast cancer activity.
Keywords: Quality by design, Mangiferin, Nanoparticles, Breast cancer, Optimization, Bovine serum albumin, Cytotoxicity, Sustained release, Stability, Nanomedicine
© 2025 The Authors. Published by Innovare Academic Sciences Pvt Ltd. This is an open access article under the CC BY license (https://creativecommons.org/licenses/by/4.0/)
DOI: https://dx.doi.org/10.22159/ijap.2025v17i5.54215 Journal homepage: https://innovareacademics.in/journals/index.php/ijap
INTRODUCTION
Breast cancer is a widespread and life-threatening disease, highlighting the need for innovative treatment strategies that improve effectiveness while reducing adverse effects. Although effective, conventional chemotherapy is often associated with systemic toxicity and suboptimal drug bioavailability [1]. Nanoparticle (NP) formulations offer advantages such as controlled drug release, enhanced permeability, and targeted drug delivery [2]. Nanotechnology-based drug delivery systems have emerged as a promising alternative to improve therapeutic outcomes by enhancing drug solubility, stability, and targeted delivery to cancerous tissues [3].
Among the various methods utilized for NP preparation, desolvation has attracted interest due to its capability to generate uniform and stable particles. The incorporation of bovine serum albumin (BSA) as a carrier matrix further enhances NP stability, biocompatibility, and drug-loading capacity [4]. Many protein NPs have been developed as ideal drug cargo-loading agents for cancer therapy to reduce drug toxicity and improve therapeutic effects. Compared with conventional drug delivery systems, such as inorganic NPs, protein NPs offer incomparable advantages, including biocompatibility and biodegradability. Additionally, the surface groups and cavities of protein NPs allow for easy surface modification and drug loading [5].
Albumin is one of the most abundant proteins found in blood plasma and includes types such as ovalbumin (OVA), BSA, and human serum albumin (HSA) [6]. Unlike OVA, BSA and HSA are stable in organic solvents and maintain their properties across varying pH levels and temperatures. BSA is especially favored in research contexts due to its low cost, widespread availability, and straightforward purification processes [7]. A notable application of BSA is in Abraxane®, an FDA-approved drug for treating metastatic breast cancer, which comprises BSA-based NPs carrying the chemotherapeutic agent paclitaxel. The reversible affinity of BSA for hydrophobic drugs facilitates their transport in the bloodstream and targeted release at specific cells, enhancing treatment efficacy [8].
Mangiferin (MGF), a naturally occurring bioactive flavonoid, has shown significant anticancer properties, including the ability to induce apoptosis, inhibit cancer cell proliferation, and exert antioxidant effects. However, its clinical application has been hindered by poor aqueous solubility and low bioavailability. To overcome these limitations, the development of MGF-loaded NPs presents a promising strategy. This approach aims to improve drug delivery, sustain drug release, and enhance cellular uptake specifically for breast cancer therapy, potentially leading to better therapeutic outcomes [9-12].
The Quality by Design (QbD) framework is crucial for the systematic creation of pharmaceutical formulations. By identifying critical quality attributes (CQAs) and linking them to critical material attributes (CMAs) and critical process parameters (CPPs), QbD establishes a robust risk management strategy. This approach not only enhances the robustness of the formulation but also ensures that the final product consistently meets quality standards and performs effectively [13]. Implementing QbD in NP formulations enables precise control over several critical parameters, including particle size (Ps), polydispersity index (PDI), zeta potential (Zp), and encapsulation efficiency (EE). These factors are essential as they significantly influence both the therapeutic efficacy and safety of the formulated NPs, ensuring that the final product meets the desired performance criteria [14].
This study utilized a QbD framework to optimize the formulation of MGF-loaded NPs aimed at the safe and effective treatment of breast cancer. QbD provides a systematic, science-based approach to formulation development that goes beyond traditional trial-and-error methods. Unlike empirical approaches that may rely on repetitive testing and often lack predictive capabilities, QbD incorporates risk assessment, design of experiments (DoE), and statistical modeling to identify and control critical formulation and process parameters.
By doing so, QbD facilitates a better understanding of how factors such as polymer concentration, drug loading, and processing conditions impact key quality attributes such as Ps, EE, and stability. Consequently, the implementation of QbD not only enhances product quality and reproducibility but also boosts resource efficiency by reducing development time and minimizing the occurrence of failed batches [15].
Statistical design tools, particularly Central Composite Design (CCD), were employed to systematically evaluate key formulation variables such as MGF loading, BSA concentration, crosslinking agent, stirring speed, and stirring time. This approach enabled the identification of an optimal balance between stability, bioavailability, and anticancer activity. Furthermore, in vitro drug release studies and cytotoxicity assays were conducted on MCF-7 breast cancer cells to assess the therapeutic efficacy of the optimized formulation. This comprehensive evaluation ensures that the developed NPs are not only effective in delivering the therapeutic agent but also exhibit desirable bioactive properties against breast cancer cells [16, 17]. By incorporating the QbD framework into the formulation process, this study sought to create a scientifically robust and scalable method for developing MGF-loaded NPs. The insights gained from this research will help advance NPbased drug delivery strategies, providing a safer and more effective treatment option for patients with breast cancer. The structured approach of QbD not only enhances the formulation's reliability but also paves the way for future innovations in targeted cancer therapies.
MATERIALS AND METHODS
Materials used in this study include MGF, a pure drug supplied by Tokyo Chemical Industry Co. Ltd., BSA provided by Smart Laboratories Pvt. Ltd., Ahmedabad. All other chemicals used in the formulation were sourced from Nice Chemicals Pvt. Ltd., Kochi, Kerala. This selection of materials ensures high quality and consistency for the development of MGF-loaded NPs.
QbD framework
The QbD framework emphasizes predefined objectives, risk assessment, and statistical optimization to facilitate robust formulation development. Essential elements of QbD include identifying CQAs and linking them to CMAs and CPPs. Additionally, it involves establishing a Quality Target Product Profile (QTPP) that outlines the desired quality attributes of the product. This methodology provides a science-based understanding of formulation variables, ensuring reproducibility, scalability, and adherence to regulatory standards. By systematically evaluating these components, QbD enhances the overall quality and safety of pharmaceutical formulations, contributing to more effective therapeutic outcomes [11, 12].
Key targets for this study include
Intended Use: The goal is to formulate NPs suitable for oral administration that feature uniform particle distribution, prevent aggregation, enhance colloidal stability, maximize drug loading, and minimize drug waste. These targets were chosen for their direct influence on bioavailability, safety, and efficacy, ensuring that the developed NP provide an effective delivery system for the therapeutic agent while maintaining patient safety [14].
CQAs were identified as physicochemical properties critical to the performance of NPs. A risk-based analysis categorized the following as CQAs: Ps, which directly influences cellular uptake, bio distribution, and tumor accumulation; PDI, which reflects the homogeneity of the formulation, with a higher PDI (>0.3) indicating aggregation or inconsistent particle formation; Zp, which governs electrostatic repulsion between particles and helps prevent aggregation during storage; and EE, which ensures sufficient drug loading to achieve therapeutic efficacy. Non-critical attributes, such as color and appearance, were excluded from the CQAs due to their negligible impact on safety or efficacy [14]. CMAs and CPPs were identified using Ishikawa (fishbone) diagrams and risk assessments according to ICH Q9 guidelines [15]. A Fractional Factorial Design (FFD) was employed to screen five factors at two levels to identify significant variables impacting the CQAs, as detailed in table 1. Numerous factors could potentially influence NP formulation, including crosslinking time, pH, and temperature. However, the choice to focus on BSA concentration, MGF loading, concentration of the crosslinking agent, stirring time, and stirring speed was driven by a combination of preliminary trials, existing literature, and their direct relevance to key parameters such as Ps, PDI, Zp, and EE. This strategic selection allows for a targeted investigation into how these variables affect the overall performance of the NPs [18]. The design minimized the number of experimental runs while effectively capturing the interactions between variables [19].
Table 1: FFD levels and factors
| Factor | Unit | Level (-1) | Level (+1) |
| MGF | mg | 25 | 100 |
| BSA | mg | 50 | 250 |
| Crosslinking agent (Sucrose) | % | 0.1 | 1 |
| Stirring time | hours | 4 | 24 |
| Stirring speed | rpm | 500 | 1500 |
Response: Ps (≤200 nm), PDI (≤0.3), Zp (±30 mV), and EE (≥50%) were used.
Formulation of MGF-loaded NPs
The formulation of BSA NP was achieved through a modified desolvation technique. Initially, the amounts of BSA, MGF, and the crosslinking agent were determined using a screening experimental design created with Stat-Ease Design Expert software. The required quantity of BSA powder was precisely weighed and then dissolved in 4 ml of filtered water. Concurrently, MGF was dissolved in 8 ml of 90% v/v ethanol and gradually mixed into the BSA solution at a controlled rate of 2 ml/min, utilizing a specially designed apparatus while stirring continuously at room temperature (25±5 °C). The onset of turbidity in the solution indicated the successful formation of MGF-loaded NPs. To stabilize these NPs, a crosslinking agent was introduced at concentrations ranging from 0.1% to 1% w/w of BSA, which facilitated the cross-linking of the desolvated particles. This crosslinking process was conducted under stirring, with both the stirring speed and duration tailored according to the experimental design. Subsequently, the synthesized MGF-loaded BSA NPs were purified through three cycles of ultracentrifugation at 20,000 rpm for 15 min at room temperature (25±5 °C), before being redispersed in purified water. The resulting nanosuspension was then freeze-dried using 5% w/v sorbitol as a cryoprotectant to obtain a fine NP powder [4].
Assessment of CQA
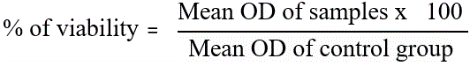
The Ps, and PDI of the prepared MGF-NPs were evaluated using a Malvern Zetasizer. Prior to analysis, all samples were diluted, sonicated externally, and filtered through a 0.45-micron filter. 1 ml sample was measured in duplicate using a four-sided transparent glass cuvette. To prevent multiple scattering effects, each sample was placed in a disposable sizing cuvette after being suitably diluted with filtered distilled water. The homogeneity of Ps distribution was assessed using the PDI. Three independent size measurements were taken, and the results were expressed as mean size±standard deviation (SD). Zp was also determined using a Malvern Zetasizer. Each sample was transferred into a disposable zeta cell after appropriate dilution with filtered distilled water. Zp was calculated from electrophoretic mobility (µm/sec), with the final value reported as the average of three measurements [20, 21]. EE plays a crucial role in minimizing the formulation bulk required for administration and in preventing drug wastage during the formulation process. Therefore, it was recognized as a CQA that requires optimization to achieve high EE. Following the preparation of the MGF-NP dispersion in purified water, the supernatant was collected and mixed with 90% v/v ethanol to precipitate the protein. The concentration of MGF in the supernatant was then determined using UV spectrophotometry [22, 23]. EE was calculated using the following equation:

Formulation of NP for optimization as per CCD
CCD was chosen for optimization due to its flexibility and robustness in modeling both linear and quadratic effects, which are crucial for accurately representing the complex relationships among formulation variables. In contrast to the box-behnken design (BBD), CCD permits the inclusion of axial points that extend beyond the factorial space, allowing for a more thorough investigation of extreme variable levels. This capability is particularly beneficial when curvature in response surfaces is anticipated. Additionally, while the Taguchi method is effective for initial screening and quality improvement, it does not facilitate the development of predictive quadratic models or in-depth response surface analyses. Therefore, CCD emerged as the most appropriate methodology for this study, as it provides a balanced approach that maximizes experimental efficiency while accurately modeling interactions and curvature [24, 25]. CCD optimized three critical factors: BSA concentration, MGF loading and stirring speed. The chosen factors and their corresponding levels are presented in table 2. The CQAs were found to be Ps, PDI, Zp, and EE. NPs were formulated using the same desolvation methodology as previously described [12, 15].
Table 2: CCD factors and levels
| Factor | Unit | Level (-1) | Level (+1) |
| BSA Concentration | mg | 50 | 250 |
| MGF Loading | mg | 25 | 100 |
| Stirring Speed | rpm | 500 | 1500 |
Characterization of NPs for optimization
The same process outlined earlier was employed to analyze the Ps,PDI, Zp, and EE. The results from these analyses were statistically evaluated to identify an optimized formulation. Based on the gathered data, CQA was assessed using various tools, including transformation techniques, fit summary reports, f(x) models, and ANOVA. This comprehensive statistical analysis enabled a thorough understanding of the factors influencing the formulation and helped in fine-tuning it for optimal performance [27]. Model graphs, such as contour plots and 3D surface plots, were generated as design space elements of QbD and revealed the effect of each factor along with their interaction effect on each CQA separately [26].
Optimisation of formulation using DoE
Both numerical and graphical tools were utilized for the optimization process. The selection criteria for the factors and responses were determined based on the QTPP. Utilizing these established criteria, the software proposed three possible solutions. Among these, the solution with the highest desirability was chosen for numerical optimization. For graphical optimization, the same response criteria used during the numerical phase were applied. The outcomes of the graphical optimization were illustrated as an overlay plot. In this plot, the yellow region represents the control space, highlighting formulations that align with the desired QTPP and CQA. This visual representation aids in identifying optimal formulations effectively [27].
Development of OF1
The optimized MGF NP, referred to as OF1, was prepared following the same procedure, specifically a modified desolvation technique. Validation of OF1 was conducted by comparing the predicted CQA with the experimental results. The experimental CQA values were reported as mean±standard deviation (SD) with n=3 replicates. For additional characterization, Scanning Electron Microscopy (SEM) was performed using the JEOL JSM-6390LV to assess the surface morphology of the NPs. The samples underwent gold sputtering and were imaged at magnifications ranging from 500 to 5000x. Size distribution analysis was carried out utilizing Image J software to further evaluate the characteristics of the NPs [28]. Fourier Transform Infrared Spectroscopy (FT-IR)The chemical interactions between BSA and MGF were assessed (Shimadzu FT-IR 8300)[29]. Powder X-ray Diffraction (PXRD): A Bruker D8 Advance diffractometer (Cu Kα radiation, 40 kV, 30 mA) was used to assess the crystallinity [30].
Evaluation of OF1
In vitro drug release study
A dialysis bag with a molecular weight cutoff (MWCO) of 1000 Da was chosen for this investigation. This dialysis bag allows small molecules, such as MGF (molecular weight 422.38), to pass through the membrane while retaining larger BSA NPs (molecular weight greater than 10000) inside the bag. Utilizing the dialysis bag method for the dissolution of MGF NPs helps prevent the loss of NPs during sampling. In the dissolution tester, the vessels were filled with a dialysis bag containing 20 mg of MGF and 7 ml of medium (phosphate buffer, pH 7.4), with each vessel holding 900 ml of the same medium. The bath temperature was maintained at 37.0±0.5 °C, and the paddle speed was set to 100 rpm. Samples of 5 ml were periodically withdrawn and analyzed using a UV-Vis spectrophotometer (Hitachi U-2000, Japan) at a wavelength of 239 nm. Each experiment was replicated three times (n=3) [8, 14]. To gain a deeper understanding of the mechanism governing the drug release from the formulation, the dissolution data were fitted to various kinetic models such as zero order, first order, Higuchis model, and Korsmeyer-Peppas. The best model was selected on the basis of R2 value [31, 32].
Cell line studies
In vitro cytotoxicity (MTT assay)
The National Center for Cell Sciences (NCCS), located in Pune, India, provided the MCF-7 human breast cancer cell line, which was cultivated in Dulbecco's Modified Eagle's Medium (DMEM). Ten percent fetal bovine serum (FBS), L-glutamine, sodium bicarbonate (Merck, Germany), and an antibiotic solution comprising Penicillin (100 U/ml), Streptomycin (100 µg/ml), and Amphotericin B (2.5 µg/ml) were added to the cells, which were kept in a 25 cm² tissue culture flask. The cultivated cells (NBS Eppendorf, Germany) were maintained at 37 °C in a humidified incubator with 5% CO₂. The MTT assay was used to measure cell viability after direct microscopic examination with an inverted phase-contrast microscope.
Freshly made test compounds were added to DMEM at concentrations of 100 µg/ml, 50 µg/ml, 25 µg/ml, 12.5 µg/ml, and 6.25 µg/ml after a 24-hour period. Doxorubicin was the standard medication. While untreated control cells were kept, each concentration was applied in triplicate to the corresponding well and incubated at 37 °C in a humidified 5% CO₂ incubator. Following a 24-hour treatment period, microscopic observations were recorded and the entire plate was inspected using an Olympus CKX41 with Optika Pro5 CCD camera, inverted phase-contrast tissue culture microscope. After being sterilized by filter sterilization, 15 mg of MTT solution was mixed in 3 ml of PBS and applied to the wells. All test and control wells received 30 µl** of the prepared MTT solution after the medium had been withdrawn from the wells after a 24-hour incubation period. After giving the plate a gentle shake, it was incubated for four hours at 37 °C in a humidified 5% CO₂ incubator. After incubation, 100 µl** of MTT solubilization solution (dimethyl sulfoxide, DMSO) was added, and the supernatant was disposed away. The formazan crystals were dissolved by pipetting up and down to gently mix the wells. A microplate reader was used to quantify absorbance at 540 nm [33]. The following formula was used to determine the percentage of growth inhibition.
To ensure the rigor of the cytotoxicity comparison, statistical significance was assessed using Student’s t-test for two groups with a significance threshold set at p<0.05 [34].
Studies on acute toxicity
The animal house of the College of Pharmaceutical Sciences, Government Medical College, Kannur, Pariyaram, Kerala, was the site of the toxicity investigation. The Institutional Animal Ethics Committee (IAEC) granted consent for this investigation under approval number CPS-GMC/IAEC-01/23-03 [31]. The animals were housed in a temperature-controlled room maintained at 22±2 °C, with a relative humidity of 55±10% and a 12/12 hour light/dark photoperiod. They underwent an acclimatization period of one week prior to the commencement of the experiment. A single-dose level of OF1 at 2000 mg/kg body weight was administered to Albino Wistar rats via gastric intubation following the Acute Toxic Class (ATC) method outlined in OECD Protocol 423. OF1 was suspended in 0.5% carboxymethyl cellulose (CMC) and administered at a dose of 10 ml/kg. The animals were weighed on day 1 (prior to administration), as well as on days 8 and 15. A thorough clinical examination was conducted multiple times on the day of dosing, including at least once within the first 30 min, with particular focus on the first four hours after treatment. The animals were then monitored every day for clinical symptoms for the duration of the observation period. Observations conducted from the cage included tracking alterations in the mucous membranes, eyes, and skin and fur. Moreover, somatomotor activity, behavioral patterns, and the functions of the respiratory, circulatory, autonomic, and central neurological systems were evaluated. Particular focus was placed on identifying symptoms like coma, sleep disorders, diarrhea, salivation, tremors, convulsions, and lethargy [35].
Stability studies
Optimized NPs were stored at 5±3 °C, 25±2 °C, and 40±2 °C for three months. The Ps, PDI, and EE were monitored at 0, 1, 2, and 3 mo to assess the physical and chemical stability. The results were presented as mean±SD (n=3) [36].
RESULTS AND DISCUSSION
The QbD framework was applied to create the experimental screening design. Different QbD tools were employed to define the QTPP, CQA, CMA and CPP. A systematic risk assessment was conducted to establish the connections between CPP, CMA, and CQA. The QTPP serves as a forward-looking summary of the essential quality characteristics that a pharmaceutical product must achieve to ensure optimal quality while considering safety and efficacy [15]. Based on the quality profile of traditional products, QTPPs and CQAs were clearly outlined in table 3 and table 4.
Table 3: QTPP of the proposed NP formulation
| QTPP element | Target | Justification |
| Target patient population | Women. | The formulation is intended for breast cancer. |
| Dosage form | NP formulation. | To improve the safety, efficacy, and stability of the formulation. |
| Route of administration | Oral. | Patient compliance. |
| Pharmacokinetics. | Appropriate parameters to establish therapeutic efficacy. | Essential for assessing bioavailability following oral administration. |
| Stability | Minimum of one year stability in a lyophilized state. | Ensuring product quality and effectiveness throughout its shelf life. |
Table 4: CQAs of MG-loaded NPs
| CQA | Target | Justification | References |
| Ps | ≤ 200 nm | Needed for enhancing the effective permeability of the drug through the GI cell membrane. | [13] |
| PDI | ≤ 0.3 | To ensure proper particle distribution. | [13] |
| Zp | In the range of±30 | Ensures the stability of NPs. | [37] |
| EE | ≥ 50% | Essential for enhancing drug loading, thereby minimizing the formulation bulk for administration and preventing drug wastage. | [38] |
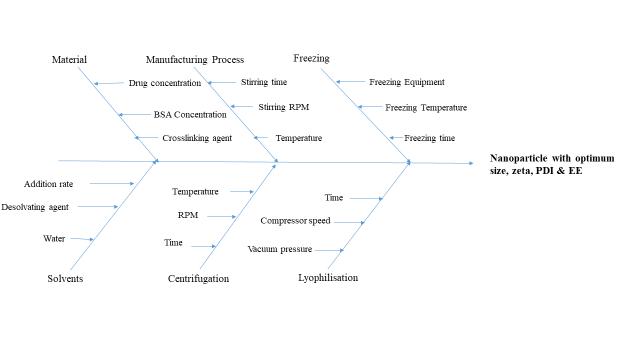
Fig. 1: Ishikawa diagram for MGF-loaded NPs
The material attributes and process parameters were thoroughly evaluated and documented. Through a systematic risk assessment process, the CMA and CPP, which significantly influence the CQA, were selected. To design a NP formulation that meets the required CQA and QTPP, an Ishikawa diagram was created, encompassing all relevant material and process factors. Certain parameters, including the volume of water, volume of the desolvating agent, addition rate, freeze-drying conditions, and centrifugation parameters, were kept constant, as they are well-established and validated in the process [2, 13, 14]. However, parameters such as the concentration of MGF, concentration of BSA, crosslinking agent concentration, stirring time, and stirring speed were evaluated, as these factors have not been well validated. These factors were selected and subjected to a risk analysis process to identify the extent of their influence on the CQA. A fractional factorial screening design was selected for the risk analysis. An Ishikawa diagram is shown in fig. 1.
Pragallapati P et al. [13] conducted similar research and reflect an accurate summary of the QbD framework employed in the development of NP formulations. The article outlines that the QbD approach was initiated by defining the QTPP, which guides the identification of CQAs, CMAs, and CPPs. This process ensures that all essential quality factors are systematically addressed during development. Poddar A and Sawant K. [14] demonstrated the use of an Ishikawa diagram to visualize potential factors affecting quality, supporting the structured risk assessment process. YuL., [37] and Vanaja Kand Rani R., [38] explained that the selection of a fractional factorial screening design for the initial experimentation is consistent with standard QbD practices, enabling efficient evaluation of multiple variables with minimal experimental runs. This supports the statement that a risk analysis process was employed to identify parameters with a significant impact on CQAs, facilitating focused optimization. This risk-based approach ensures that the most impactful parameters are identified for further evaluation.
Formulation of MGF-loaded NPs
MGF-NPs were prepared using a modified desolvation technique. 21 formulations were prepared according to an experimental fractional factorial screening design. A FFD screening design with five factors was selected, and its influence on the selected response was analyzed. StatEase Design-Expert software (version 22.0.1) was used to develop the experimental design. The CQA of 21 formulations was evaluated [35].
Assessment of CQA
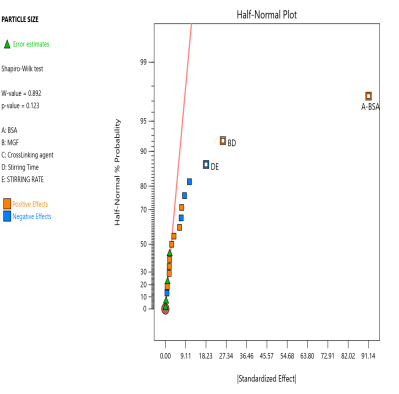
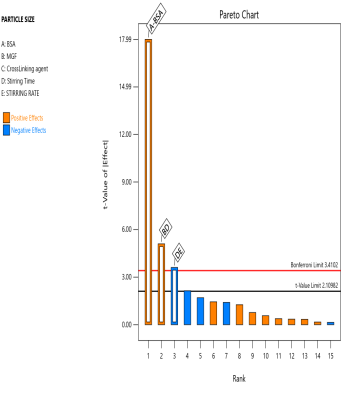
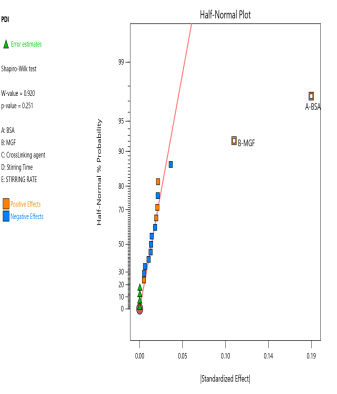
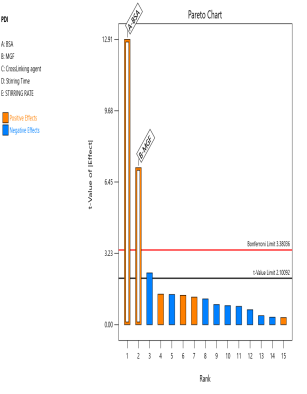
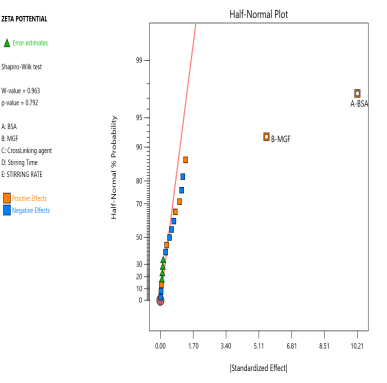
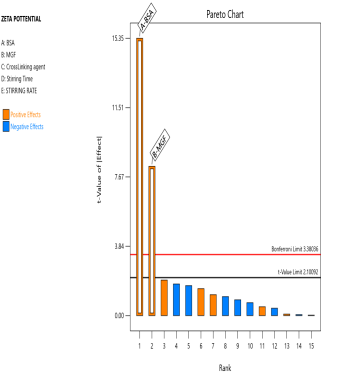
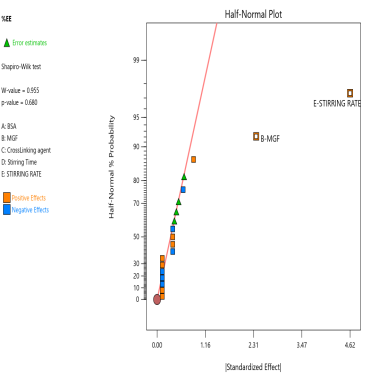
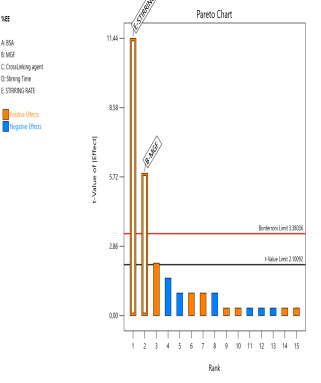
The prepared MGF-NPs were evaluated to assess the link between the selected factors and the critical responses. An analysis of the screening design was performed to establish a link between factors and responses. The results were expressed as a half-normal plot and Pareto chart, as shown in fig. 2.
 |
 |
 |
 |
| (A) | (B) | ||
 |
 |
 |
 |
| (C) | (D) |
Fig. 2: Half-normal plot and pareto chart illustrating the influence of screened factors on selected CQAs: (A) PS, (B) PDI, (C) Zp, and (E) EE
The overall results showed that the concentration of BSA, Concentration of MGF, and stirring time were the most influential factors affecting CQA. Therefore, the above-mentioned three factors were selected as CMA and CPP. As the screening study indicated the presence of a curvature effect on all responses, a suitable Response Surface Methodology (RSM) should be adopted for the development of an optimized NP formulation. Poddar A and Sawant K., [14] adopted a data-driven approach that utilized statistical screening tools for the selection of critical parameters to optimize formulation characteristics. They successfully demonstrated a QbD-based optimization process. Compared to polymeric and lipid-based systems, the BSA-based NPs developed in their study exhibited superior EE along with acceptable Ps and PDI. This work reflects a growing trend in nanomedicine, where rational design and statistical rigor play a central role in achieving robust and effective drug delivery systems.
Formulation and characterization of NP for optimization as per CCD
Twenty experimental runs (MNP1-MNP220) were conducted following the CCD experimental framework, consisting of eight factorial, six axial, and six center points. Predictive models were developed by analyzing responses, such as Ps, PDI, Zp, and EE-using Design Expert® software. The Ps of all formulations ranged from 65.83±0.105 nm to 242.14±0.864 nm, Most formulations demonstrated moderate PDI values, except for MNP1, MNP4, MNP5, MNP7, MNP8, MNP9, MNP13, and MNP14. The Zp values varied from-14.4 to-32.1, indicating that the developed NP formulations exhibited moderate to stable suspension properties. This range is generally considered suitable for biomedical applications, as it facilitates interaction with cells and tissues [20]. The EE values ranged from 62% to 73%, suggesting that all formulations had reasonably high EE. Furthermore, the results indicated the significant influence of MGF concentration and stirring time on the EE.
The CQA were statistically analyzed separately. Results from the analysis indicated that the developed model was satisfactory for creating model graphs and further optimization. The transformation tabs provided insights into the need for data transformation based on response ranges. With a ratio of maximum to minimum greater than 10, the models required appropriate transformation, while all CQAs had ratios of less than 10, indicating no need for data transformation [35]. The fit summary, based on regression calculations, suggested a highest-order polynomial model with large extra terms and no aliasing [39]. A quadratic polynomial model was suggested for all CQAs except for EE, for which a modified quadratic model (quadratic with significant model terms) was chosen. ANOVA statistics were applied to the selected polynomial models to determine their significance. The ANOVA analyses for all four CQAs were found to be satisfactory, confirming the models as significant, with lack-of-fit (LOF) deemed insignificant. This means the LOF is statistically insignificant compared to pure error, reinforcing the reliability of the models. The LOF analysis evaluated whether the selected regression model adequately described the experimental data. A non-significant LOF (p-value>0.05) indicates a good model fit, with residuals within the expected range of experimental variability. In this study, all response models showed LOF p-values greater than 0.05, suggesting that the variation in data is well captured by the models without systematic deviations between predicted and observed responses. This reinforces the appropriateness of the polynomial regression models for optimization [24, 25]. The ANOVA analysis revealed that variables with p-values below 0.0500 significantly impacted the responses, while those above 0.0500 had negligible effects, leading to their removal from the model to enhance accuracy. Each CQA achieved good R² values greater than 0.95, with reasonable agreement among adjusted R² and predicted R² values, all differing by less than 0.2. Table 5 summarizes the overall findings of the experimental design study. These statistical analyses culminated in the development of the regression equation for all CQAs in coded terms.
Ps =+84.80+46.27A+12.93C+54.79 A2+26.03 C2
PDI =+0.2037 – 0.0288A+0.0135B+0.0635 AB+0.0282 BC+0.0462 A2+0.0898C2
Zp =-21.56+2.80A+0.7781C-1.85AB-2.90AC-1.63BC+1.73 A²-2.02 B²+2.80 C²
EE =+66.35+0.3765A+2.81B+1.30C+0.3750 AB+0.3750 AC+0.8750 BC.
Table 5: Analysis of the experimental design
| Analysis tool | P. size | PDI | Zeta potential | %EE | |
| Transformation | No Transformation | No Transformation | No Transformation | No Transformation | |
| Fit Summery | Quadratic | Quadratic | Quadratic | 2FI | |
| F (x) Model | Modified Quadratic | Modified Quadratic | Modified Quadratic | 2FI | |
| ANOVA | MODEL | Significant | Significant | Significant | Significant |
| Lack of Fit | Not Significant | Not Significant | Not Significant | Not Significant | |
| R² | 0.9568 | 0.9826 | 0.9667 | 0.9792 | |
| Adjusted R² | 0.9452 | 0.9746 | 0.9425 | 0.9696 | |
| Predicted R² | 0.9309 | 0.9506 | 0.8591 | 0.8866 | |
| Adeq. Precision | 23.5952 | 32.1920 | 22.8154 | 37.4813 |
(A) |
(C) |
(E) |
 |
 |
 |
| (B) | (D) | (F) |
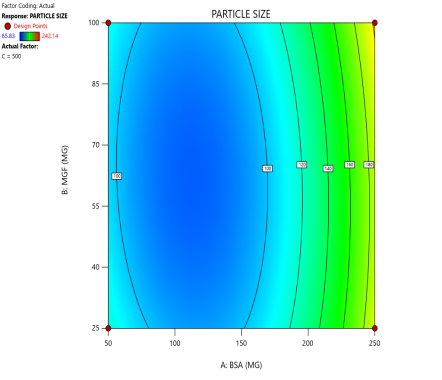
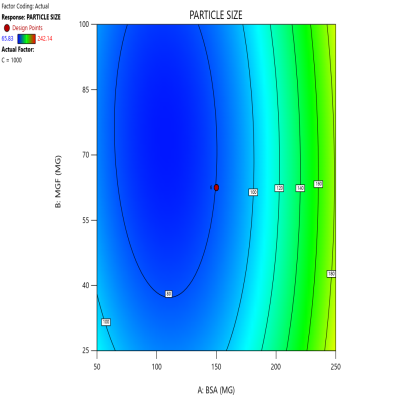
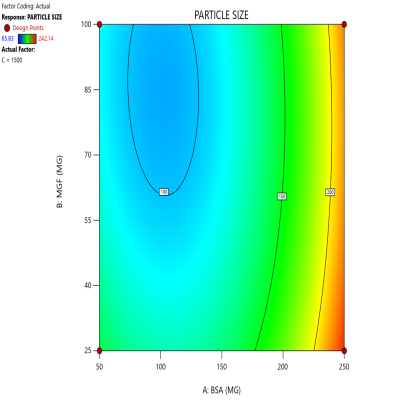
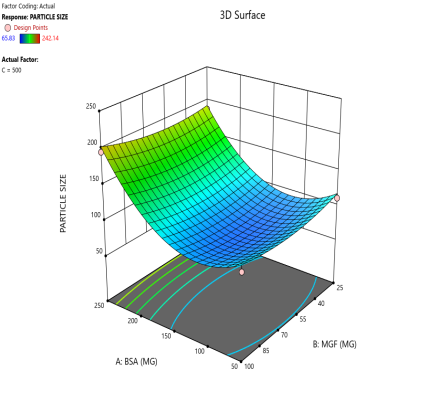
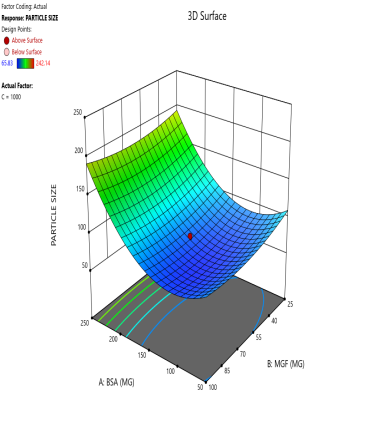
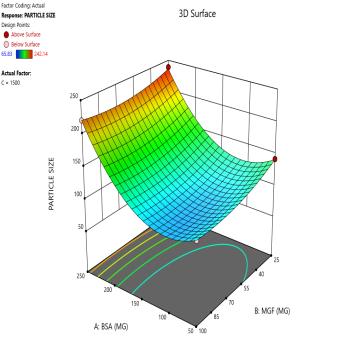
Fig. 3: Contour plots (A, C, E) and 3D response surface plots (B, D, F) showing the effects of formulation factors on Ps at different stirring speeds: 500 rpm (A and B), 1000 rpm (C and D), and 1500 rpm (E and F)
Poddar A and Sawant K., [14] implemented statistical experimental design methods to optimize NP formulation parameters. The researchers used Design Expert® software to evaluate the influence and interaction of various formulation variables. Their analysis involved ANOVA, which confirmed the adequacy and statistical significance of the model, with a non-significant lack-of-fit indicating a good model fit. Sebastian G et al., [35] adopted a similar DoE approach. They employed model reduction strategies and selected suitable polynomial models, including quadratic and two-factor interaction (2FI) models. Key statistical indicators such as R², adjusted R², and predicted R² were analyzed to ensure the robustness of the predictive model. Their findings also emphasized the critical influence of formulation variables like polymer concentration and stirring time on EE and Ps. Patel M and Khan M et al., [39] conducted a methodical optimization of NP formulation using a statistical design approach. They validated their models through ANOVA and reported high model significance with non-significant lack-of-fit, confirming the predictive power of their equations. Their study highlighted that variables such as the concentration of active agents, BSA/polymer ratio, and process parameters played significant roles in influencing CQAs.
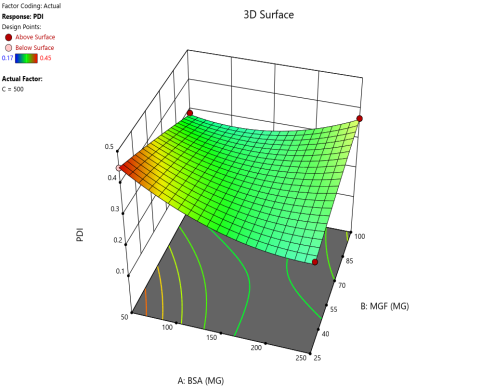
Statistical models derived from these data predict how these factors interact to affect the CQAs [36]. The 2D counter plot and 3D response surface plots shown in fig. 3 were developed to interpret the factors affecting the PS. Contour plots map these interactions in two dimensions, where contour lines delineate the regions of constant response. For instance, the blue regions in the graphs (Ps<120 nm) define the optimal combination of BSA and MGF at specific stirring speeds. Similarly, 3D surface plots extend this visualization to three dimensions, illustrating how the Ps changes dynamically across the entire experimental domain. These plots highlight nonlinear interactions, such as how high stirring speeds (1500 RPM) may destabilize NP despite adequate BSA levels, enabling formulators to identify the boundaries of the design space where quality is assured.
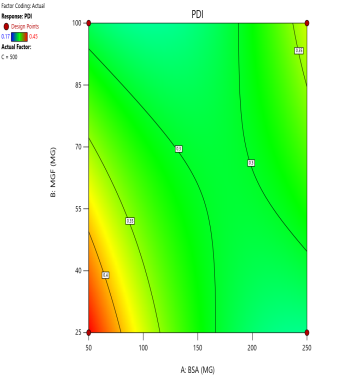
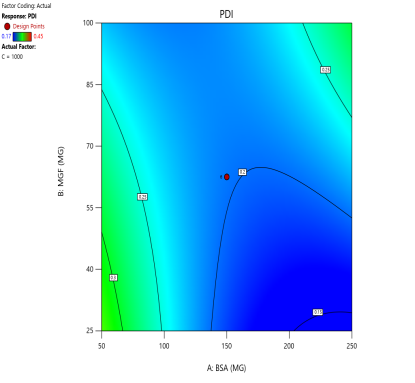
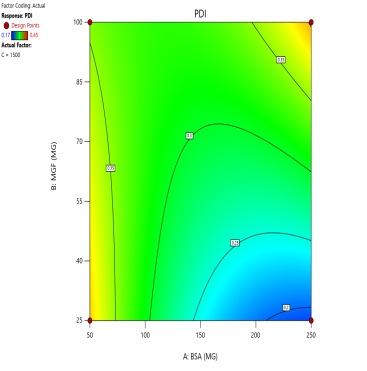
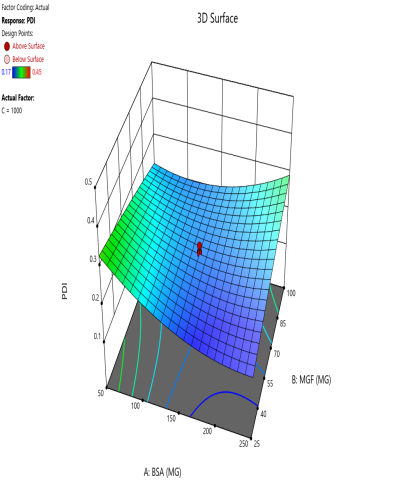
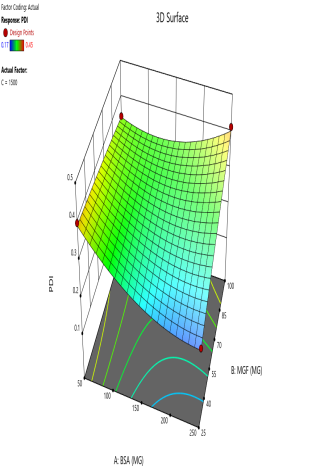
The effect of the combinations of BSA and MGF concentrations at varying stirring speeds on PDI is shown in fig. 4. The blue zones (low PDI) in these plots highlight optimal conditions, such as moderate-to-high BSA and MGF at 1000 RPM, where the mixing efficiency balances stabilization and shear forces. These regions define the design space and ensure robustness to minor process variations. Similarly, 3D surface plots illustrate nonlinear interactions, such as how excessive stirring (1500 RPM) destabilizes NPs despite adequate BSA, revealing steep transitions to red zones (high PDI) that mark the edges of acceptable operating ranges.
 |
 |
 |
| (A) | (C) | (E) |
 |
 |
 |
| (B) | (D) | (F) |
Fig. 4: Contour plots (A, C, E) and 3D response surface plots (B, D, F) depicting the impact of formulation factors on PDI at different stirring speeds: 500 rpm (A and B), 1000 rpm (C and D), and 1500 rpm (E and F)
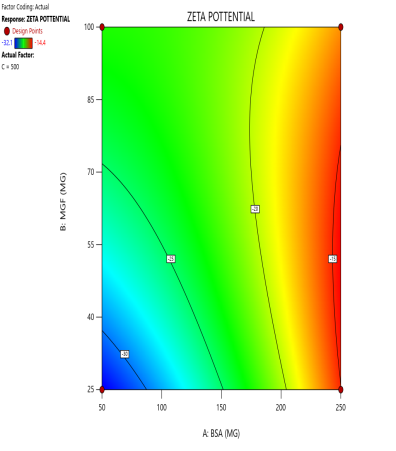
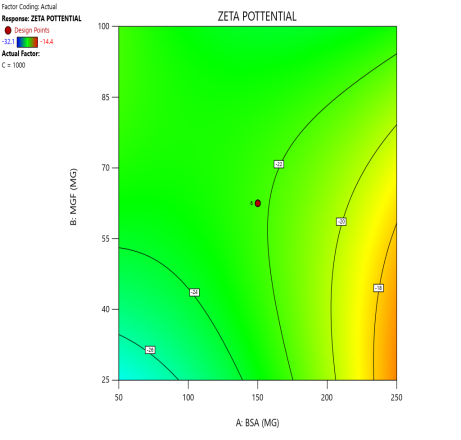
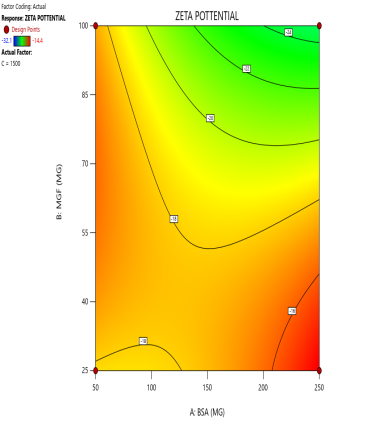
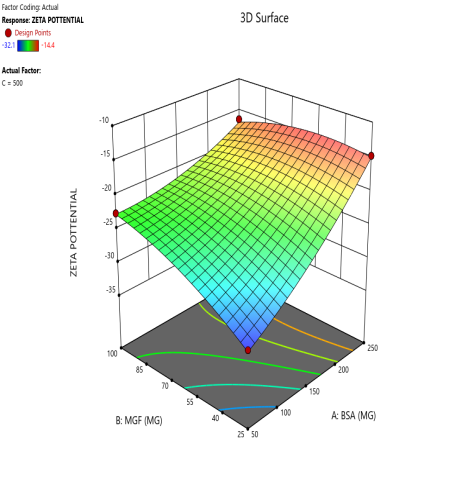
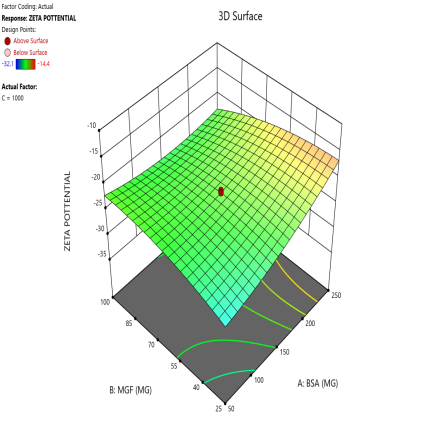
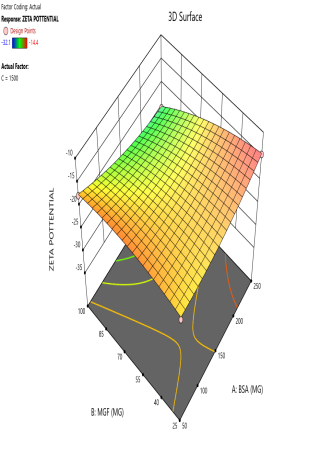
During the optimization of Zp (±30 mV), contour plots were used to identify regions where specific combinations of BSA and MGF, under varying stirring speeds, achieved the target CQA (fig. 5). The blue, green, and red zones denote low, moderate, and high Zp values, respectively. At 1000 RPM, broad red plateaus in contour plots (indicating ±30 mV) span moderate BSA and MGF concentrations, defining the robust design space where quality is assured even with minor process variability. Conversely, tightened contours at 1500 RPM highlight the fragility of the system, where excessive shear forces destabilize the Nps unless the MGF is strictly limited. These visualizations demarcate the boundaries of acceptable operating ranges, aligning with the QbD’s goal of identifying controllable and reproducible parameters.
 |
 |
 |
| (A) | (C) | (E) |
 |
 |
 |
| (B) | (D) | (F) |
Fig. 5: Contour plots (A, C, E) and 3D response surface plots (B, D, F) illustrating the impact of formulation factors on Zp at different stirring speeds: 500 rpm (A and B), 1000 rpm (C and D), and 1500 rpm (E and F)
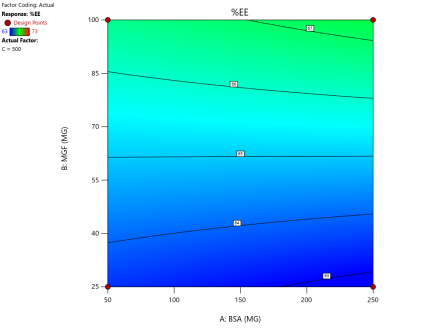
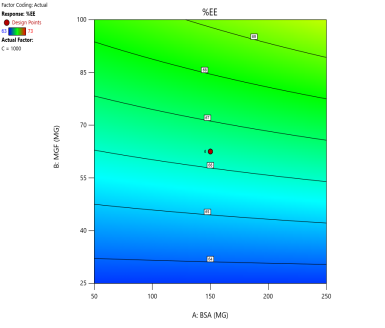
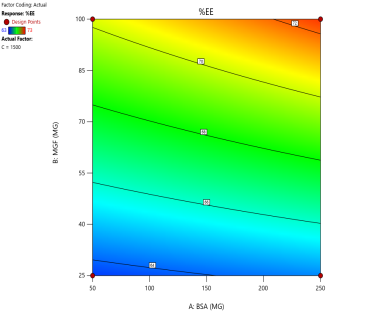
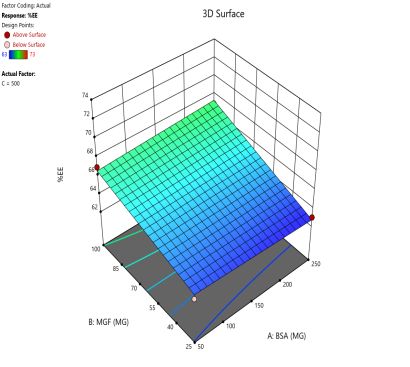
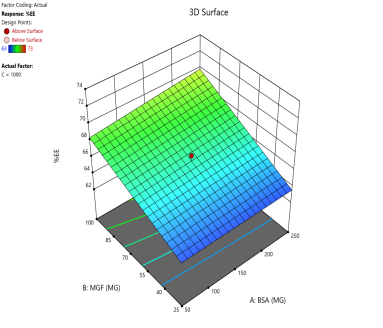
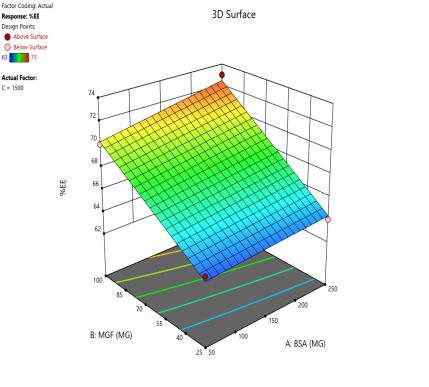
In optimizing EE, contour plots map regions where specific combinations of BSA and MGF at varying stirring speeds achieve high encapsulation. The varying combinations of input factors, their interactions, and their influences on the EE are depicted in fig. 6. At 500 and 1000 RPM, both counter and 3D surface plots showed a predominant blue to green area, indicating low to moderate EE at all BSA and MGF concentrations. Conversely, at 1500 RPM, moderate to high levels of BSA and high levels of MGF showed high EE, as indicated by the red region as a sweet spot. By overlaying the acceptance criteria of high EE on these plots, the design space becomes a visual guarantee of quality, facilitating risk assessment and regulatory compliance.
 |
 |
 |
| (A) | (C) | (E) |
 |
 |
 |
| (B) | (D) | (F) |
Fig. 6: Contour plots (A, C, E) and 3D response surface plots (B, D, F) showing the effect of formulation factors on EEat different stirring speeds: 500 rpm (A and B), 1000 rpm (C and D), and 1500 rpm (E and F)
Poddar A and Sawant K., [14] implemented statistical experimental design methods to optimize NP formulation parameters. The researchers used Design Expert® software to evaluate the influence and interaction of various formulation variables. Their analysis involved ANOVA, which confirmed the adequacy and statistical significance of the model, with a non-significant lack-of-fit indicating a good model fit. Sebastian G et al., [35] adopted a similar DoE approach. They employed model reduction strategies and selected suitable polynomial models, including quadratic and two-factor interaction (2FI) models. Key statistical indicators such as R², adjusted R², and predicted R² were analyzed to ensure the robustness of the predictive model. Their findings also emphasized the critical influence of formulation variables like polymer concentration and stirring time on EE and Ps. Patel M and Khan M et al., [39] conducted a methodical optimization of NP formulation using a statistical design approach. They validated their models through ANOVA and reported high model significance with non-significant lack-of-fit, confirming the predictive power of their equations. Their study highlighted that variables such as the concentration of active agents, BSA/polymer ratio, and process parameters played significant roles in influencing CQAs.
Statistical models derived from these data predict how these factors interact to affect the CQAs [36]. The 2D counter plot and 3D response surface plots shown in fig. 3 were developed to interpret the factors affecting the PS. Contour plots map these interactions in two dimensions, where contour lines delineate the regions of constant response. For instance, the blue regions in the graphs (Ps<120 nm) define the optimal combination of BSA and MGF at specific stirring speeds. Similarly, 3D surface plots extend this visualization to three dimensions, illustrating how the Ps changes dynamically across the entire experimental domain. These plots highlight nonlinear interactions, such as how high stirring speeds (1500 RPM) may destabilize NP despite adequate BSA levels, enabling formulators to identify the boundaries of the design space where quality is assured.
Pragallapati P et al., [13] utilized a four-factor Box–Behnken Design (BBD) to model CQAs such as Ps, EE, and drug release rate. They interpreted contour plots and 3D response surface plots to examine the influence of formulation variables. Their study fit quadratic and interaction regression equations, validated through ANOVA with high R² values and non-significant LOF, ensuring model adequacy prior to optimization. Poddar A and Sawant K., [14] adopted a two-stage design approach. They first screened influential variables using a Plackett–Burman design, followed by the application of BBD to model Ps and EE. They emphasized the utility of 2D contour plots and 3D surface plots to visualize the effects of two independent variables on each CQA. One example cited in their study demonstrated a direct relationship between selected formulation factors and EE, thereby aiding in precise formulation optimization. Patamsetti A et al., [36] applied BBD to optimize four CQAs: Ps, PDI, Zp, and EE. Like other studies, they fit quadratic models validated by ANOVA. For each CQA, paired contour and 3D plots were presented. Notably, the response surface for PDI remained relatively flat (PDI<0.3) across most design space but exhibited a rising trend at very high stirring speeds. In contrast, Zp and EE showed highly curved surfaces, reflecting complex interactions among variables. Sebastian G et al., [35] employed a 3² factorial design to optimize PLGA-based polymeric nanoparticles loaded with Nebivolol Hydrochloride. Their study demonstrated the use of DoE and contour mapping to analyze the impact of formulation variables on Zp. However, the exclusion of high-shear processing conditions limited insights into mechanical fragility. Compared to other studies, their approach focused more on drug and polymer concentration, whereas the current study adds depth by integrating stirring speed as a key mechanical variable within the QbD framework.
Optimization
In the numerical optimization, the required criteria for the input parameters were set with the goal designated as “in range.” For the responses, the goal was established to “minimize” Ps within a range of 65.83 to 150 nm, “in range” for PDI between 0.17 to 3, and Zp targets of -28.1 to -13.7. Additionally, the goal for EE was set to “maximize” within the range of 68 to 73. Using the Design Expert® software, three solutions were suggested for these criteria. Among them, a solution with a high desirability value of 0.785, comprising specific amounts of BSA-128 mg and MGF-100 mg, along with a stirring speed of 1300 RPM, was chosen as the optimized formulation (OF1) for further validation and evaluation. The graphical optimization results are presented as an overlay plot (fig. 7), where the yellow region indicates the factorial condition that yields a product meeting the desired CQA. This visualization helps in understanding the effectiveness of the optimization and the conditions that lead to the best formulation outcome.
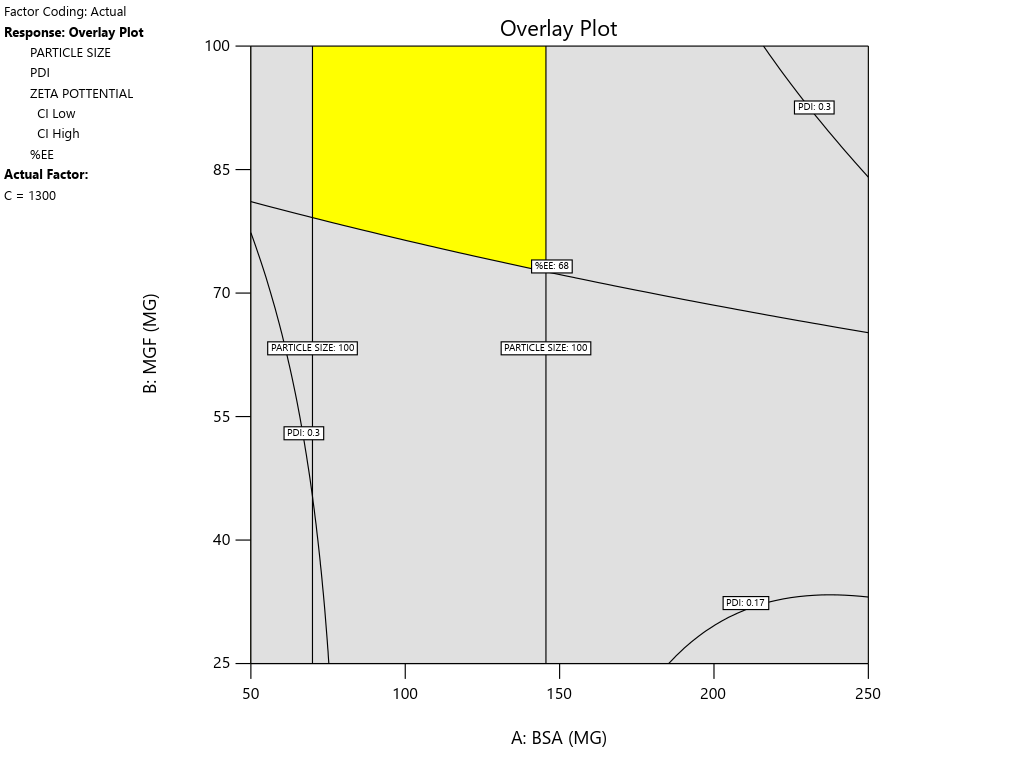
Fig. 7: Overlay plot highlighting the yellow region, which represents the combination of factors and levels that yield a product meeting the desired CQAs
Pragallapati P et al., [13] also utilized design expert to generate an overlay plot for multiple CQAs. Their approach involved combining individual response plots to identify the intersecting region where all performance goals were simultaneously satisfied. This feasible region was visualized as a colored zone on the graph, indicating acceptable ranges for key formulation variables. Their study reinforced the utility of overlay plots in defining a visually intuitive design space. Poddar A and Sawant K., [14] defined a “design space” by overlaying contour plots of Ps and EE. They set target constraints, Ps<140 nm and EE>75%, and used Design Expert software to superimpose the respective contour plots. The resulting overlay highlighted a yellow region representing the combination of factor settings that met both criteria. They explicitly describe this yellow region as the feasible area within the design space where optimal formulation conditions exist. Patamsetti A et al., [36] produced a similar overlay plot to demarcate the safe formulation region for their nanoparticle system. While the visual representation of the design space was included, their discussion focused more heavily on statistical validation and model robustness. The overlay chart served to support their identification of a viable operating window, but was presented with less graphical emphasis compared to the other studies.
Development of OF1
OF1 was developed and evaluated in terms of the Ps, PDI, Zp, and EE. The results (table 6) lie between the 95% high and low prediction intervals, indicating the reliability of the developed model. In addition, the optimized formulation satisfied the predetermined CQA and the objective set in the QTPP. Therefore, the optimized formulation of OF1 can be used for further characterization and evaluation, including surface morphology, cell line, toxicity, and stability studies.
Table 6: Statistical confirmation of optimized formulation OF1
| Analysis | Predicted mean | Predicted median | S. E Pred | 95% Pred. Inter. low | Data mean | 95% Pred. Inter. low |
| Ps | 94.401 | 94.401 | 7.51324 | 84.7734 | 96.8333±10.85 | 108.2361 |
| PDI | 0.2528 | 0.2528 | 0.00926402 | 0.2259 | 0.25±0.013 | 0.27347 |
| Zp | -22.2137 | -22.2137 | 0.449382 | -23.215 | -22.9±065 | -21.2124 |
| EE | 70.37 | 70.37 | 0.273998 | 68.7581 | 70.37±0.442 | 76.9419 |
The results were presented as mean±SD (n=3).
Characterization of OF1
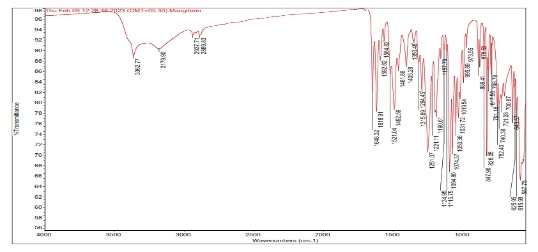
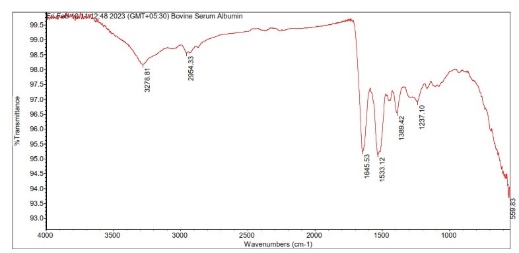
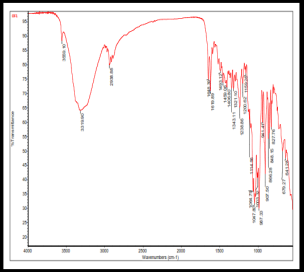
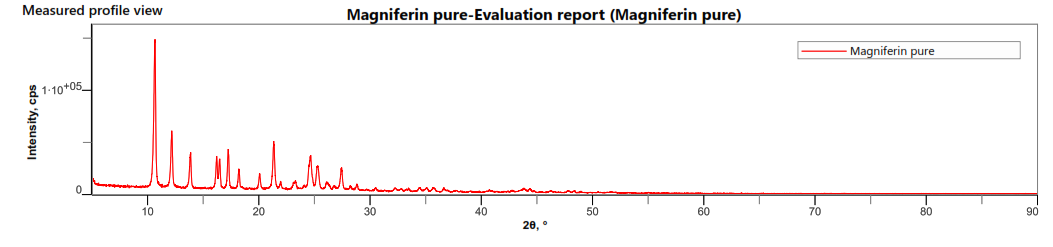
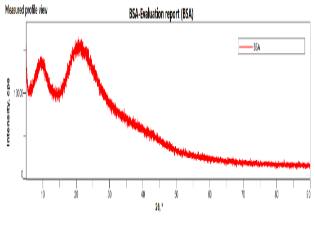
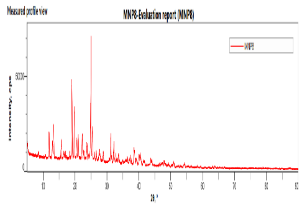
The SEM images of OF1 are shown in fig. 8(A). The NP appeared roughly spherical and agglomerated, indicating their successful formation [28]. The scale bar indicates that the NPs are in the nanometer range. The size distribution analysis using ImageJ software showed that the Ps distribution is uniform, with a mean Ps of 88.53 nm. The size ranges from 70.48 nm to 95.34 nm, which is beneficial for consistent drug release [40]. The FTIR spectrum of OF1 contained characteristic peaks from both BSA and MGF without major shifts, suggesting that no significant chemical interactions, such as covalent bonding, occurred (fig. 7B). FTIR analysis confirmed that the formulation method did not induce unwanted chemical modifications [29]. XRD analysis demonstrated that while pure MGF was crystalline, its incorporation into BSA NP significantly reduced crystallinity, as evidenced by broader, less intense diffraction peaks and possible peak shifts, as shown in fig. 9(C). In contrast, BSA alone exhibited an amorphous structure, suggesting that the NP formulation may improve MGF solubility and bioavailability by disrupting its crystalline structure [30].
The characterization results of OF1 align well with observations reported across the attached articles Zhang and Wang. [28] similarly presented SEM images demonstrating spherical NP structures with minimal aggregation, supporting effective NP formation. ImageJ-based Ps measurement parallels their approach to assessing particle distribution and consistency. The FTIR analysis, revealing the presence of characteristic peaks of BSA and MGF without significant peak shifts, corroborates the findings of Rani K., [29], who interpreted similar spectra to confirm the absence of covalent bonding, indicating that drug loading into the carrier did not alter the chemical identity of the components. Kumar Met al., [30] reported that the transition from a crystalline to a more amorphous state upon NP encapsulation by an XRD analysis is a feature known to enhance solubility and bioavailability. Similar peak broadening and intensity loss were used as evidence of successful molecular dispersion in the carrier matrix, confirming the intended modification of physicochemical properties through formulation.
In vitro drug release study
The in vitro release investigation of OF1 was conducted over a 24-hour period, as shown in fig. 9. According to the findings, OF1 had a 20% release in the first 2 h and a 90% release in the next 8 h. The highest release was observed within 12 h, after which it became negligible. The drug release from the optimized formulation OF1 follows Korsmeyer-Peppas kinetics (R²= 0.996), indicating a diffusion-controlled mechanism with significant influence from matrix erosion or swelling [23]. The in vitro drug release profile of formulation OF1, which demonstrated 20% release within the first 2 h and up to 90% within the next 8 h, showing a plateau after 12 h and fitting Korsmeyer-Peppas kinetics (R² = 0.996), aligns closely with the in vitro behavior observed in the carvedilol-loaded BSA NPs from the referenced study reported by Attia M et al., [23]. In both studies, a biphasic release pattern was observed, characterized by a gradual increase in release followed by sustained release. For OF1, the release transitioned from 20% at 2 h to 90% at 10 h, reaching maximum release within 12 h, indicative of efficient diffusion and matrix erosion/swelling dynamics. Similarly, in the reference study, various formulations (e. g., F5 and F6) also showed substantial initial release within the first few hours, followed by a slower, prolonged release phase. Moreover, both studies indicated Korsmeyer–Peppas model as the best fit for release kinetics. In OF1, the high R² value and model fitting suggest diffusion-dominated release with matrix involvement similar to the reference, where the optimized formulation also followed the Korsmeyer–Peppas model (R² = 0.9959, n = 0.348), implying Fickian diffusion behavior.
A |
   |
| B | |
   |
|
| C |
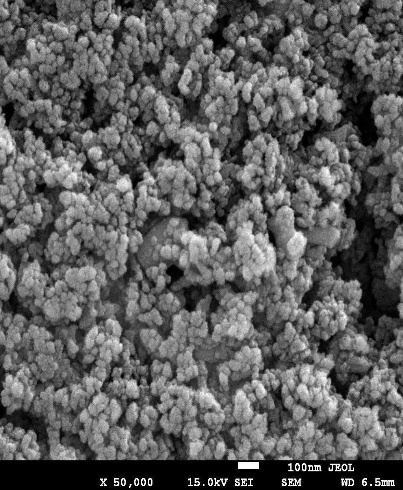
Fig. 8: Evaluation of OF1 (A) SEM image, (B) FTIR spectra, (C) XRD spectra
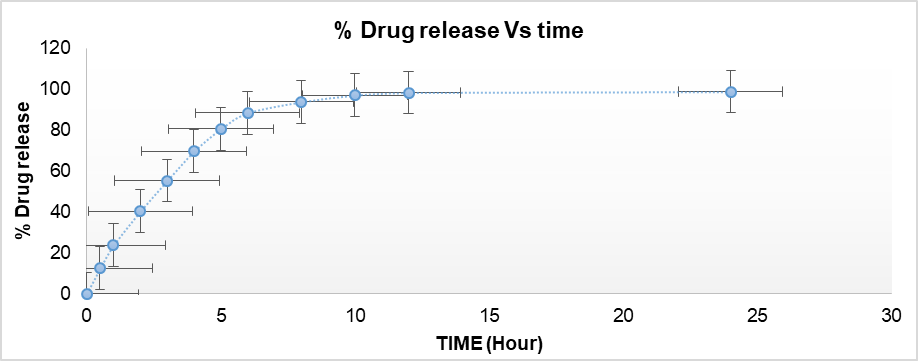
Fig. 9: % drug release from OF1
In vitro cytotoxicity (MTT assay)
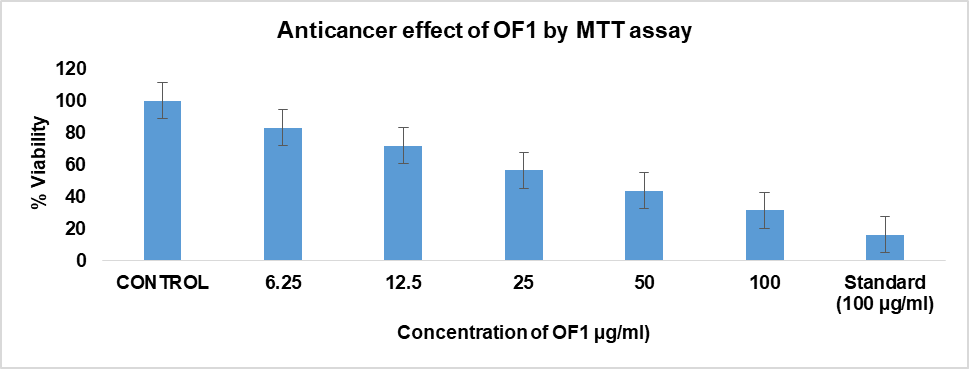
The anticancer activity of OF1 at varying concentrations, in comparison with the control and the standard drug doxorubicin, is graphically represented in fig. 10(A). The Y-axis denotes the percentage of cell viability, while the X-axis represents different concentrations of OF1. The results are shown as mean±SE, and each experiment was carried out in triplicate (n=3). Dunnett's test and one-way ANOVA were used for data analysis [41]. The cytotoxic effect of OF1 was found to be dose-dependent and comparable to that of the standard anticancer drug doxorubicin. Microscopic evaluation was conducted at different concentrations of OF1, with detectable morphological changes, such as cell rounding, shrinkage, cytoplasmic vacuolization, and granulation, are regarded as markers of cytotoxicity. Direct microscopic observations confirmed that OF1 exerts a significant cytotoxic effect on cancer cells, potentially inducing apoptosis and necrosis. Additionally, the IC50 value of OF1 was determined to be 22.32 µg/ml, whereas that of doxorubicin was 12.191 µg/ml. Direct microscopic observation (fig. 9B-G) suggests that OF1 has a significant cytotoxic effect on cells, leading to apoptosis and possible necrosis. The statistical analysis by Student’s t-test revealed that the optimized formulation (OF1) showed statistically comparable cytotoxic activity relative to free doxorubicin at suggesting enhanced cellular uptake or sustained release behavior of the NP system [27].
(A)
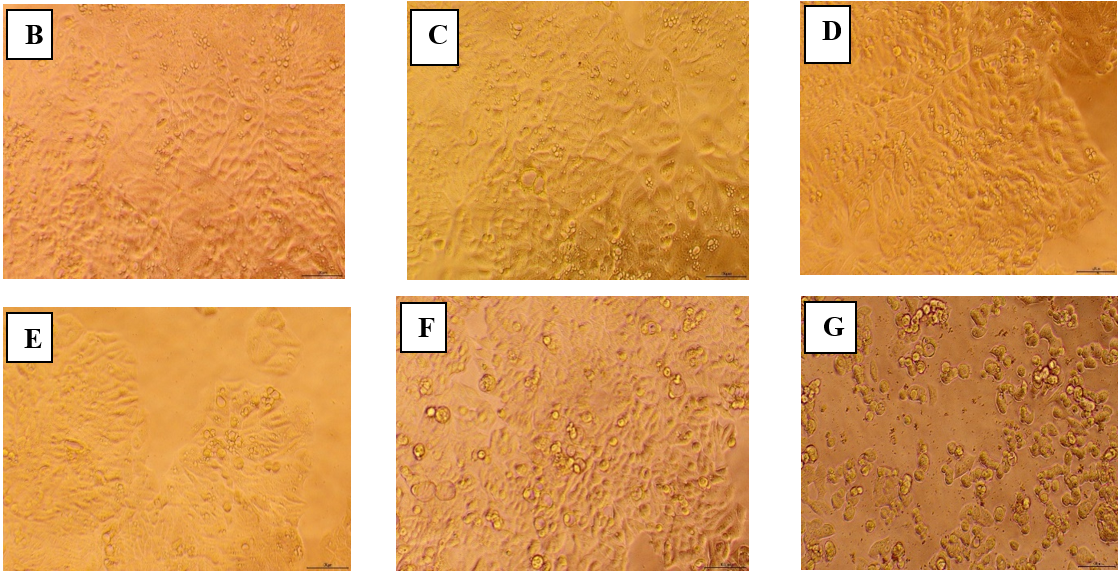
Fig. 10: Anticancer assay by MTT assay and direct microscopic observation. (A) Graphical representation depicting the anticancer effect of OF1 using MTT assay. B-G Direct microscopic observation at different concentrations(B)-Control, (C)-Sample 6.25 µg/ml, (D) 12.5 µg/ml, (E) 25 µg/ml, (F) 50 µg/ml, (G) 100 µg/ml
Gokul M et al. [41] reported similar finding by MTT assay of compound FMCu NPs. In both studies, the MTT assay was used to evaluate anticancer activity against specific cell lines, and cytotoxicity was found to be dose-dependent. For OF1, the IC50 value was 22.32 µg/ml, demonstrating strong cytotoxic potential close to that of doxorubicin (12.191 µg/ml), a well-known chemotherapeutic agent. Similarly, the green-synthesized FMCu NPs displayed promising cytotoxic activity, with IC50 values of 57.56 µg/ml for HepG2 cells and 56.41 µg/ml for MCF-7 cells, which, although higher than OF1, still indicated selective and effective cytotoxic potential. Both results also reported key morphological changes in cells, such as rounding, shrinkage, and vacuolization, suggesting apoptosis and/or necrosis, as visually confirmed by microscopic analysis. These consistent cytological markers across both experiments support the claim that NP based delivery enhances anticancer efficacy, likely through improved cellular uptake or sustained drug release. Statistical analyses (ANOVA and Dunnett’s test) further reinforce the reliability of both findings, highlighting a shared conclusion that NP formulations can provide targeted, efficient anticancer action with potential for therapeutic application.
Studies on acute toxicity
Many natural products, such as herbal extracts and plant-based compounds, have been historically used in traditional medicine. This long history of safe use suggests that these substances are unlikely to be acutely toxic at lower doses. Therefore, instead of beginning with a low dose and gradually increasing it (which requires more animal usage), researchers often start directly at 2000 mg/kg to confirm safety at a high dose, and reduce unnecessary testing at lower, less informative dose levels [31, 32]. All animals used in the study were given a minimum of five days to acclimate to the laboratory conditions upon arrival. The animals were observed on delivery, on inclusion in the study, and before administration for mortality/morbidity and other clinical signs. Their body weights were recorded on day 1 (before the administration) and days 8 and 15. Every day during the observation period and several times on the day of treatment, all animals were checked for clinical symptoms. No test-item-related signs of toxicity were observed, and every animal persisted to the end of the investigation. Body weight gain for this strain stayed within the typical range over the course of the 14-day observation period. None of the animals showed any weight loss during the observation period. The provided acute toxicity study aligns well with the findings reported Prado Y et al., [31]. In both cases, a single oral dose of 2000 mg/kg was selected for the initial toxicity assessment, consistent with the approach recommended by regulatory guidelines such as OECD 423. This high-dose method reflects confidence in the historical safety of natural products and minimizes unnecessary animal testing. In the present study, no test-item-related clinical signs, mortality, or weight loss were observed during the 14-day observation period, indicating no signs of acute toxicity. Similarly, the reference study on MGF also reported survival of all animals at the 2000 mg/kg oral dose, with only transient signs like piloerection and reduced motor activity, which resolved without further complications. Both studies reported normal weight gain during the observation period, and necropsy revealed no pathological findings attributable to the test compound. These consistent results support the notion that certain plant-derived substances, including MGF and the compound in the current study, exhibit low acute toxicity at high doses. They reinforce the validity of initiating acute toxicity assessments at 2000 mg/kg for natural products with a history of traditional use, provided preliminary safety data exists. This similarity underlines the low acute toxicity risk associated with the tested substances and supports the ethical and scientific rationale for high-dose limit testing in such cases.
Stability studies
OF1 underwent stability assessments under various storage conditions (5 °C, 25 °C, and 40 °C) over a period of 0, 1, 2, and 3 mo. At both 5 °C and 25 °C, minimal changes in drug content indicated stability, with only slight variations in EE, suggesting effective protection against degradation. However, at elevated temperatures, a significant decline in EE was noted, dropping from 70.37±2.01% to 64.80±3.60% (results presented as mean±SD with n=3), which indicated structural instability. Throughout the entire duration of the experiment, the Ps of the formulation remained below 150 nm, and the Zp measured approximately-22.9±2.36 mV, underscoring the stability and uniformity of the MGF NP. The stability profile of OF1 closely resembles the findings reported by Patamsetti A et al., [36]. In both studies, formulations were stored under various temperature conditions, such as 5 °C, 25 °C, and 40 °C, for up to three months, and monitored for changes in Ps, EE, and Zp. OF1 consistently maintained a Ps below 150 nm and a stable Zp of approximately −22.9±2.36 mV throughout the study, indicating good colloidal stability. Likewise, the sunitinib-loaded nanobubbles in the reference study showed a stable Ps below 200 nm and a Zp around −21.1±0.43 mV, confirming formulation stability under standard storage. The EE for OF1 exhibited a minor decline at 5 °C and 25 °C, demonstrating good stability, while a significant decrease at 40 °C from 70.37±2.01% to 64.80±3.60% indicated temperature-induced structural disruption. Similarly, the reference formulation's EE decreased from 69.12±1.41% to 61.10±3.60% under the same elevated temperature condition, also indicating reduced encapsulation stability at higher stress levels.
CONCLUSION
The study highlights the importance of using a QbD approach to optimize MGF-loaded BSA NPs, ensuring controlled and reproducible formulation. Compared to conventional dosage forms, this nano formulation offers enhanced drug delivery, targeted action, and reduced systemic toxicity for safer and more effective breast cancer treatment. Utilizing CCD, critical formulation variables were optimized to achieve desirable Ps, Zp, PDI, and EE, aligning with the defined QTPP and CQAs. The NP demonstrated strong colloidal stability, efficient drug loading, and biocompatibility due to BSA’s amphiphilic nature, eliminating the need for harsh cross-linkers. In vitro assays confirmed a dose-dependent anti-proliferative effect against MCF-7 cells, while in vivo toxicity studies indicated safety, supporting their clinical promise. Stability testing under varied conditions further reinforced the robustness of the formulation. Overall, this work validates QbD as a structured, reproducible approach for NP design and positions MGF-BSA NPs as a viable, safer alternative to conventional therapies. Further clinical trial studies are required to evaluate its safety and efficacy.
FUNDING
This study did not receive any external financial support.
AUTHORS CONTRIBUTIONS
SKV carried out the experimental work, analyzed and documented the results, and prepared the initial draft of the manuscript. RNC supervised the execution of the study and the analysis of results. SCS conceptualized and designed the work plan, monitored day-to-day activities, and contributed to manuscript development. PP supervised the execution and interpretation of in vitro cell line studies and assisted in data analysis. JJ contributed to result analysis, manuscript writing, and performed gmatical and language corrections.
CONFLICTS OF INTERESTS
No conflict of interest
REFERENCES
Das J, Debbarma A, Lalhlenmawia H. Formulation and in vitro evaluation of poly-(d, l-lactide-co-glycolide) (plga) nanoparticles of ellagic acid and its effect on human breast cancer mcf-7 cell line. Int J Curr Pharm Sci. 2021;13(5):56-62. doi: 10.22159/ijcpr.2021v13i5.1887.
Jaiswal PK, Keserwani S, Chakrabarty T. Lipid polymer hybrid nanocarriers as a novel drug delivery platform. Int J Pharm Pharm Sci. 2022;14(4):1-12. doi: 10.22159/ijpps.2022v14i4.44038.
Sarkar T, Ahmed AB. Development and in vitro characterisation of chitosan-loaded paclitaxel nanoparticle. Asian J Pharm Clin Res. 2016;9(9):145. doi: 10.22159/ajpcr.2016.v9s3.12894.
Jahanban Esfahlan A, Dastmalchi S, Davaran S. A simple improved desolvation method for the rapid preparation of albumin nanoparticles. Int J Biol Macromol. 2016;91:703-9. doi: 10.1016/j.ijbiomac.2016.05.032, PMID 27177461.
Lohcharoenkal W, Wang L, Chen YC, Rojanasakul Y. Protein nanoparticles as drug delivery carriers for cancer therapy. BioMed Res Int. 2014;2014:180549. doi: 10.1155/2014/180549, PMID 24772414.
Elzoghby AO, Samy WM, Elgindy NA. Albumin-based nanoparticles as potential controlled-release drug delivery systems. J Control Release. 2012;157(2):168-82. doi: 10.1016/j.jconrel.2011.07.031, PMID 21839127.
Prajapati R, Somoza A. Albumin nanostructures for nucleic acid delivery in cancer: current trend emerging issues and possible solutions. Cancers. 2021;13(14):3454. doi: 10.3390/cancers13143454, PMID 34298666.
Miao Y, Yang T, Yang S, Yang M, Mao C. Protein nanoparticles directed cancer imaging and therapy. Nano Converg. 2022;9(1):2. doi: 10.1186/s40580-021-00293-4, PMID 34997888.
Deng Q, Tian YX, Liang J. Mangiferin inhibits cell migration and invasion through rac1/wave2 signalling in breast cancer. Cytotechnology. 2018;70(2):593-601. doi: 10.1007/s10616-017-0140-1, PMID 29455393.
Gold Smith F, Fernandez A, Bishop K. Mangiferin and cancer: mechanisms of action. Nutrients. 2016;8(7):396. doi: 10.3390/nu8070396, PMID 27367721.
B D, Mitra A, Manjunatha M. Studies on the anti-diabetic and hypolipidemic potentials of mangiferin (Xanthone glucoside) in streptozotocin-induced type 1 and type 2 diabetic model rats. Int J Adv Pharm Sci. 2010;1(1):75-85. doi: 10.5138/ijaps.2010.0976.1055.01009.
Madhavi M, Reddy YN. A study of pharmacokinetic interaction between mangiferin and atorvastatin in hyperlipidemic rats. Int J App Pharm. 2025;17(1):453-6. doi: 10.22159/ijap.2025v17i1.52248.
Pragallapati P, Lakshmi Ponnuri RN, Murthy Kollapalli VR. Quality by design approach for development and optimization of chitosan-based floating microspheres for topotecan HCl. Int J App Pharm. 2023;15(6):153-62. doi: 10.22159/ijap.2023v15i6.48850.
Poddar A, Sawant KK. Optimization of galantamine-loaded bovine serum albumin nanoparticles by quality by design and its preliminary characterizations. J Nanomed Nanotechnol. 2017;8(5):2-10. doi: 10.4172/2157-7439.1000459.
Stocker E, Becker K, Hate S, Hohl R, Schiemenz W, Sacher S. Application of ich q9 quality risk management tools for advanced development of hot melt coated multiparticulate systems. J Pharm Sci. 2017;106(1):278-90. doi: 10.1016/j.xphs.2016.09.025, PMID 27842971.
Comsa S, Cimpean AM, Raica M. The story of mcf-7 breast cancer cell line: 40 years of experience in research. Anticancer Res. 2015;35(6):3147-54. PMID 26026074.
Harbeck N, Penault Llorca F, Cortes J, Gnant M, Houssami N, Poortmans P. Breast cancer. Nat Rev Dis Primers. 2019;5(1):66. doi: 10.1038/s41572-019-0111-2, PMID 31548545.
Sharma S, Cheng SF, Bhattacharya B, Chakkaravarthi S. Efficacy of free and encapsulated natural antioxidants in oxidative stability of edible oil: special emphasis on nanoemulsion-based encapsulation. Trends Food Sci Technol. 2019 Sep;91:305-18. doi: 10.1016/j.tifs.2019.07.030.
Fukuda IM, Pinto CF, Moreira CS, Saviano AM, Lourenço FR. Design of experiments (doe) applied to pharmaceutical and Analytical Quality by design (QBD). Braz J Pharm Sci. 2018;54(SPE):e01006. doi: 10.1590/s2175-97902018000001006.
Pochapski DJ, Carvalho Dos Santos C, Leite GW, Pulcinelli SH, Santilli CV. Zeta potential and colloidal stability predictions for inorganic nanoparticle dispersions: effects of experimental conditions and electrokinetic models on the interpretation of results. Langmuir. 2021;37(45):13379-89. doi: 10.1021/acs.langmuir.1c02056, PMID 34637312.
Shelake SS, Patil SV, Patil SS. Formulation and evaluation of fenofibrate-loaded nanoparticles by precipitation method. Pharmaceutical Sciences. 2018;80(3):420-7. doi: 10.4172/pharmaceutical-sciences.1000374.
Amighi F, Emam Djomeh Z, Labbafi Mazraeh Shahi M. Effect of different cross-linking agents on the preparation of bovine serum albumin nanoparticles. J Iran Chem Soc. 2020;17(5):1223-35. doi: 10.1007/s13738-019-01850-9.
Attia MS, Radwan MF, Ibrahim TS, Ibrahim TM. Development of carvedilol-loaded albumin-based nanoparticles with factorial design to optimize in vitro and in vivo performance. Pharmaceutics. 2023;15(5):1425. doi: 10.3390/pharmaceutics15051425, PMID 37242667.
Montgomery DC. Design and analysis of experiments. 9th ed. Hoboken, NJ: John Wiley & Sons, Inc; 2017.
Jensen WA. Response surface methodology: process and product optimization using designed experiments 4th edition. J Qual Technol. 2017;49(2):186-8. doi: 10.1080/00224065.2017.11917988.
N Politis S, Colombo P, Colombo G, M Rekkas D. Design of experiments (doe) in pharmaceutical development. Drug Dev Ind Pharm. 2017;43(6):889-901. doi: 10.1080/03639045.2017.1291672, PMID 28166428.
Nadendla RR, Priyanka PV. Optimizing transdermal patch formulation for enhanced delivery of rivaroxaban: a comprehensive design of experiments approach. Int J Pharm Pharm Sci. 2024;16(12):8-20. doi: 10.22159/ijpps.2024v16i12.51075.
Zhang S, Wang C. Precise analysis of nanoparticle size distribution in tem image. Methods Protoc. 2023;6(4):63. doi: 10.3390/mps6040063, PMID 37489430.
Rani K. Fourier transform infrared spectroscopy (FTIR) spectral analysis of BSA nanoparticles (BSA NPs) and egg albumin nanoparticles (EA NPs). Res J Chem Sci. 2016;1(6):29–36.
Kumar M. Xrd analysis for characterization of green nanoparticles: a mini review. GJPPS. 2022;10(1):555779. doi: 10.19080/GJPPS.2022.10.555779.
Prado Y. Acute and 28 d subchronic toxicity studies of mangiferin a glucosylxanthone isolated from Mangifera indica l. stem bark. Journal of Pharmacy & Pharmacognosy Research. 2025;3(1):13-23.
Test No. 420: acute oral toxicity–fixed dose procedure. OECD; 2002. doi: 10.1787/9789264070943-en.
Suharti N, Dachriyanus D, Lucida H, Sri Wahyuni F, Hefni D, Pontana Putra P. In silico prediction and in vitro cytotoxic activity of arbuscular mycorrhizal fungi induced Zingiber officinale Var. Rubrum. RJPT. 2022 Nov;15(11):4913-8. doi: 10.52711/0974-360X.2022.00825.
Jerard C, Michael BP, Chenicheri S, Vijayakumar N, Ramachandran R. Rosmarinic acid-rich fraction from mentha arvensis synchronizes Bcl/Bax expression and induces Go/G1 arrest in hepatocarcinoma cells. Proc Natl Acad Sci India Sect B Biol Sci. 2020;90(3):515-22. doi: 10.1007/s40011-019-01122-9.
Sebastian G, Priya S, James JP, Sannidhi M, Sannidhi VK, Prabhu VK. Computational tools assisted formulation optimization of nebivolol hydrochloride-loaded PLGA nanoparticles by 32 factorial designs. Int J App Pharm. 2022;14(4):251-8. doi: 10.22159/ijap.2022v14i4.44865.
Patamsetti A, Gubbiyappa KS. Optimizing oral bioavailability of sunitinib: quality by design in nanobubble formulation. Int J App Pharm. 2025;17(1):141-52. doi: 10.22159/ijap.2025v17i1.52462.
Yu LX. Pharmaceutical quality by design: product and process development, understanding and control. Pharm Res. 2008;25(4):781-91. doi: 10.1007/s11095-007-9511-1, PMID 18185986.
Vanaja K, Shobha Rani RH. Design of experiments: concept and applications of plackett burman design. Clin Res Regul Aff. 2007;24(1):1-23. doi: 10.1080/10601330701220520.
Patel M, Khan MA. Optimization, development and evaluation of repaglinide controlled release gastroretentive floating tablet using central composite design. Int J App Pharm. 2023;15(1):218-26. doi: 10.22159/ijap.2023v15i1.46493.
Singh R, Lillard JW. Nanoparticle-based targeted drug delivery. Exp Mol Pathol. 2009;86(3):215-23. doi: 10.1016/j.yexmp.2008.12.004.
Gokul M, GU, Esakki A. Green synthesis and characterization of isolated flavonoid mediated copper nanoparticles by using Thespesia populnea leaf extract and its evaluation of anti-oxidant and anti-cancer activity. Int J Chem Res. 2022;6(1):15-32. doi: 10.22159/ijcr.2022v6i1.197.