
Int J App Pharm, Vol 17, Issue 4, 2025, 471-482Original Article
AN INVESTIGATION ON CERVICAL CANCER DRUGS THROUGH QSPR MODEL EMPLOYING DEGREE-RELATED TOPOLOGICAL INDICES
PRIYADARSHINI S.*, S. KOPPERUNDEVI
Department of Mathematics, Dr. M. G. R. Educational and Research Institute, Maduravoyal, Chennai-600095, India
*Corresponding author: Priyadarshini S.; *Email: priyasundar2404@gmail.com
Received: 18 Mar 2025, Revised and Accepted: 20 May 2025
ABSTRACT
Objective: To explore the relationship between topological indices and physical properties of the drugs administered for the treatment of cervical cancer using Quantitative Structure–Property Relationship (QSPR) modelling. The present study hopes to determine whether mathematical descriptors of drug molecules can predict physical properties without needing laboratory testing.
Methods: Topological index, used as a molecular descriptor, was employed to describe the molecular structure of gemcitabine, vinblastine, irinotecan, and topotecan, among other cervical cancer drugs. QSPR was just about to find a mathematical relationship between their molecular descriptors and the physical properties like boiling point, molar refractivity, and flash point. Topological Indices: Nine topological indices were used for the molecular structure analysis of each drug. The correlation coefficients and *p-values were calculated to test the significance of these relationships statistically.
Results: The statistical analysis defined the relationships between topological indices and physical properties to be statistically significant when the correlation coefficient referred to was more than 0.7, with a *p-value of less than 0.05. The conditions for the results of this study were satisfied, thus ensuring strong and meaningful correlations.
Conclusion: The study shows that topological indices can be effectively incorporated into QSPR modelling to predict the physical properties of drugs against cervical cancer. If provided with mathematical tools, chemists and medical practitioners may find it useful for drug design and development, thereby decreasing the dependence on long-duration, tedious, and expensive laboratory experiments.
Keywords: Cervical cancer drugs, Topological indices (TIs) based on degree, QSPR analysis, Linear regression model
© 2025 The Authors. Published by Innovare Academic Sciences Pvt Ltd. This is an open access article under the CC BY license (https://creativecommons.org/licenses/by/4.0/)
DOI: https://dx.doi.org/10.22159/ijap.2025v17i4.54256 Journal homepage: https://innovareacademics.in/journals/index.php/ijap
INTRODUCTION
Cervical cancer is a common malignancy in women, causing abnormal behaviour in cells at the cervix due to small DNA changes. In 2022, cervical cancer could have advanced more rapidly in women with untreated HIV and impaired immunity, with 660,000 new cases and 350,000 deaths due to the disease. Human Papillomavirus (HPV) is implicated in about 95% of cervical cancer cases. Other risk factors include smoking, obesity, multiple pregnancies, young age, hormonal contraceptives, and a weak immune system. Early detection and treatment can help recover from cervical cancer.
There are four basic stages of cervical cancer: Stage I, where the cervix is the only affected area; Stage II, where the uterine tissues are affected; Stage III, where kidney issues or the lower part of the vagina are affected; and Stage IV, where cancer has spread irrespective of the pelvis [1]. Cervical cancer can be treated through various forms of therapy, which include radiotherapy, chemotherapy, and surgery. There are also new classes of therapies, targeted treatments, and immunotherapy [2]. HPV, which can be prevented through vaccination, like Cervarix and Gardasil. Effective treatment starts with early diagnosis through screening tests. It is through awareness and risk assessment that prevention and timely interventions can be done. Advances in pharmaceutical sciences will continue to improve outcomes in treatment by creating more potent medications and therapies for cervical cancer.
Significant impact is made in improving patient care and survival rates by these developments [3]. There are also studies done on various anticancer medicinal plants, their active compounds, and mechanisms of action, including apoptosis induction and immune modulation, and they suggest that the efficacy of herbal therapy in cervical cancer is enhanced when it is integrated with conventional treatments to offset side effects and improve patient outcomes [4].
It is a representation in which structural descriptors expressed as numerical indices are translated from the molecular structure. Predicting physical properties is aided by these numerical values. There are degree, distance, and spectral-related topological indices. Broadly, these topological indices are applied in Quantitative Structure-Property Relationship (QSPR) and Quantitative Structure-Activity Relationship (QSAR) modelling, providing information that scientists need to know about the characteristics of molecular structures that are useful for manufacturing any drugs. Physical, biological, and chemical attributes can be learned from this approach.
Degree-based topological indices have been selected over other TIs for this investigation due to their intrinsic simplicity, intuitive interpretability, and ease of calculation, which is extremely useful in QSPR modelling. The computational efficiency of these indices has allowed for rapid screening of molecular structures without the necessity for a comprehensive 3D conformational analysis. Moreover, in the recent past, these TIs have been reported to accurately predict physical and chemical properties, especially concerning drug development modelling. This study extends the earlier QSPR efforts in oncology by focusing only on molecules that treat cervical cancer, using a unique combination of degree-based metrics that have not been thoroughly explored in earlier studies. The selected anticancer drugs and the modelling framework are customized for this application and offer a more focused and possibly effective approach than more general or less specific oncology QSPR models.
This article inspects the physical characteristics of cervical cancer drugs using degree-based TIs. A detailed evaluation is performed using the QSPR model. Utilizing the linear regression model, these TIs and drug features have been estimated; refer to fig. 1. This method shows good correlation with the physical qualities of cervical cancer drugs and TIs using a regression model.
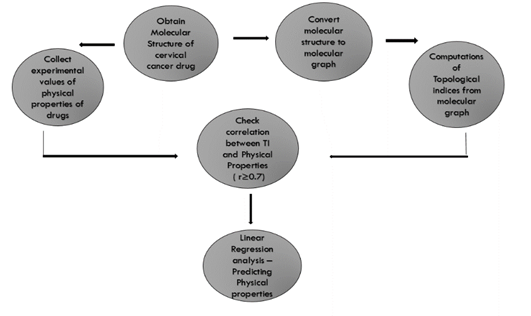
Fig. 1: Technique for results computation
Articles about various drugs to treat different kinds of disorders are published in many places using TI based on degree and linear regression analysis. The articles inspired me to work on cervical cancer treatments using this approach. Recently, focusing on QSPR modelling employing degree-based indices to predict physicochemical attributes of twenty eye infection drugs, operated on nine indices, where the first and second revised Randic indices had a good correlation with the essential drug properties [5]. QSPR analysis studied the properties of 21 breast cancer drugs and worked on eleven indices, which established strong correlations between selected indices and six drug properties [6].
Also performed on different drugs that are used in anti-cancer and anti-malaria disorders by the QSPR model with the same strategy, seventeen drugs on thirteen TIs and nine drugs on seven TIs, respectively [7], [8]. With the application of linear regression and degree-related TIs, in the prediction of the physicochemical characteristics of the ten drugs applied in the rheumatoid arthritis treatment, nine TIs provided a significant range and were highly correlated with polarity, refractive index, molar volume, and complexity [9]. The highly correlated also predicted all the physicochemical properties with the help of nine indices of the eleven drugs used in vitiligo disease [10]. The article works towards analyzing thirteen Human Immunodeficiency Virus (HIV) treatment drugs. By utilizing nine degree-based TIs, the research establishes a correlation between the physicochemical attributes of these drugs, such as melting and boiling points, and their structural characteristics [11]. Effective usage of a linear regression model to relate the treatment indicators to drug attributes for sixteen medications used in treating hepatitis [12].
MATERIALS AND METHODS
As seen in fig. 2, chemical graph theory uses a molecular graph to represent the molecular structure of a drug developed for treating cervical cancer. In this model, the vertices represent atoms, and the edges denote the bonds between them. A vertex's degree in the molecular graph is associated with the valence in the molecular structure of the compound. The molecular graph thus consists of a vertex set V(G) and edge set E(G) given by G(V, E), and it is simple and connected, with no loops. The degree of a vertex in graph G, denoted by dm, is determined by all the edges connecting it [13], [14]. The list below contains the degree-related TIs that were used in this paper:
Definition 2.1, 2.2: The first and second Zagreb indices, initiated by Gutman et al., are used to determine the molecules’ total pi-electron energy [15].
M1(G)= ……. (1)
M2(G)= ………. (2)
Definition 2.3: The Randic index aids in estimating the saturated hydrocarbons' carbon atoms' branching extent. It was introduced by Randic [16].
R(G) =  ………. (3)
Definition 2.4: An additional Randic index variant is the harmonic index proposed by Fajtlowicz [17].
H(G) =  ………. (4)
Definition 2.5: An Atom Bond Connectivity (ABC) index is used to research the formation heat of heptanes and octanes framed by Estrada et al. [18].
ABCG) =  ….. (5)
Definition 2.6: Gutman has introduced the sombor index to provide a geometrical approach to degree-based topological indices [19].
SO(G) =  ………. (6)
Definitions 2.7, 2.8, 2.9: V. R. Kulli recently proposed the Nirmala index, which was inspired by the Sombor index [20]. Further, V. R. Kulli et al. introduced the first inverse nirmala index and the second inverse nirmala index, and also performed studies on certain antiviral drugs [21, 22].
N(G) = …………. (7)
N1(G) = ………. (8)
N2(G) = ………. (9)
This article involves statistical analysis and topological indices computed and required in research on drugs. The techniques include vertex degree labelling and vertex and edge partitioning to derive topological indices. Calculations of such findings are done using a scientific calculator. ChemSpider was used to extract experimental data (table 2) and the structure of drugs (fig. 2) in treating cervical cancer, and both the experimental and predicted data were compared using a linear regression model.
The selection of 14 drugs in this study rested upon two main bases: clinical relevance and availability of data. Only those drugs having an established therapeutic purpose in treating cervical cancer and their structural and physicochemical information available in reliable databases were taken into account. This assures that compounds for which credible experimental records exist for characteristics mentioned below are considered on equal grounds for assessing the topological indices presented.
(a) |
(b) |
(c) |
(d) |
(e) |
(f) |
(g) |
(h) |
(i) |
(j) |
(k) |
(l) |
(m) |
(n) |
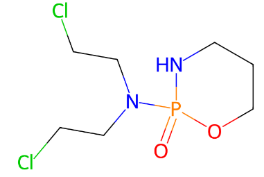

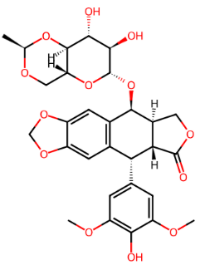
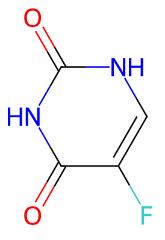
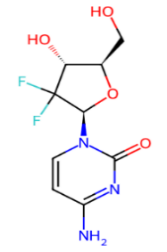
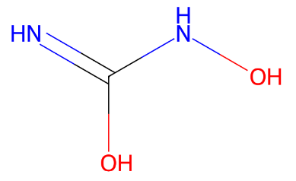
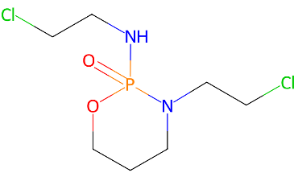
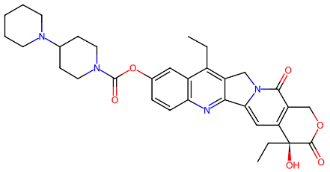
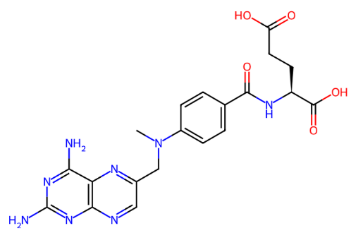
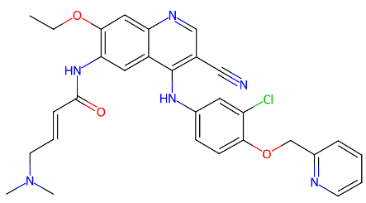
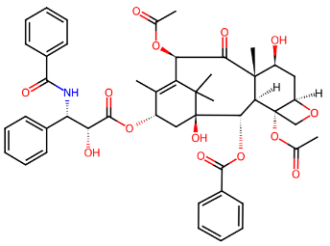
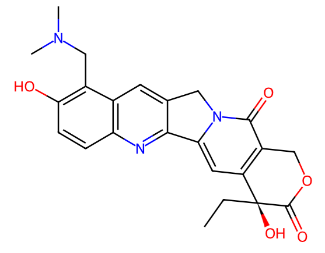
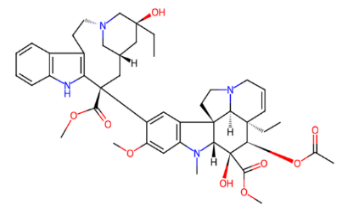
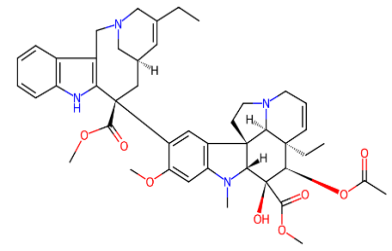
Fig. 2: (a) Ciclophosphamide (b) Doxorubicin (c) Etoposide (d) Fluorouracil (e) Gemcitabine (f) Hydroxyurea (g) Ifosfamide (h) Irinotecan (i) Methotrexate (j) Neratinib (k) Paclitaxel (l) Topotecan (m) Vinblastine (n) Vinorelbine
The molecular formulas for various compounds are as follows: Ciclophosphamide (C₇H₅ClNOP),, Doxorubicin (C₂₇H₂₉NO₁₁), Etoposide (C₂₉H₃₂O₁₃), Fluorouracil (C₄H₃FN₂O₂), Gemcitabine (C₉HFNO), Hydroxyurea (CH₄N₂O₂), Ifosfamide (C₇H₁₅Cl₂N₂O₂P), Irinotecan (C₃₃H₃₈N₄O₆), Methotrexate (C₂₀H₂₂N₈O₅), Neratinib (C₃₀H₂₉ClN₆O₃), Paclitaxel (C₄₇H₅₁NO₁₄), Topotecan (C₂₃H₂₃N₃O₅), Vinblastine (C₄₆H₅₈N₄O₉), and Vinorelbine (C₄₅H₅₄N₄O₈).
These chemotherapeutic agents work by inhibiting DNA synthesis, preventing cancer cell replication, and inducing apoptosis. Combination therapy is beneficial in enhancing efficacy; targeting advanced or recurrent cervical cancer can improve patient outcomes.
RESULTS AND DISCUSSION
TIsbased on the degree of the drugs used for cervical cancer will be calculated. These calculatedindices used in QSPR analysis will be studied in this research, and these indices reveal that a strong correlation is present with the physical characteristics of the drugs used in cervical cancer treatment.
The drugs used in this study are ciclophosphamide, doxorubicin, etoposide, fluorouracil, gemcitabine, hydroxyurea, ifosfamide, irinotecan, methotraxate, neratinib, paclitaxel, topotecan, vinblastine, vinorelbine. Here, we considered these molecular structures as graphs where the drug elements are considered as vertices and the bonds connecting them are represented as edges.
Theorem 1
Evaluate a molecular graph G for topotecan; then M1(G) = 180, M2(G) = 226, R(G) = 14.74,H(G) = 14.071, ABC(G) = 24.966, SO(G) = 130.961, N(G) = 79.059, N1(G) = 32.639, N2(G) = 38.173.
Proof

Fig. 3: Transformation of molecular depiction to molecular graph of Topotecan
In fig. 3, we can observe the transformation of molecular structure to molecular graph; there are eight different kinds of edges, altogether 35, and 31 vertices. They are as follows:
E1,3 = { e = mn E(G)| dm = 1, dn= 3} = 5
E1,4 = { e = mn E(G)| dm = 1, dn= 4} = 1
E2,3 = { e = mn E(G)| dm = 2, dn = 3} = 1
E1,2 = { e = mn E(G)| dm = 1, dn = 2} = 1
E2,3 = { e = mn E(G)| dm = 2, dn = 3} = 14
E2,2 = { e = mn E(G)| dm = 2, dn = 2} = 2
E3,3 = { e = mn E(G)| dm = 3, dn = 3} = 9
E3,4 = { e = mn E(G)| dm = 3, dn = 4} = 2
By using Definition 2.1,
M1(G) = 5(1+3)+(1+4)+(2+4)+(1+2)+14(2+3)+2(2+2)+9(3+3)+2(3+4)
=180 ……… (10)
By using Definition 2.2
M2(G) = 5(1 × 3)+(1 × 4)+(2 × 4)+(1 × 2)+14(2 × 3)+2(2 × 2)+9(3 × 3)+2(3 × 4)
= 226 ………. (11)
By using Definition 2.3
R(G) =
= 14.74 …….. (12)
By using Definition 2.4
H(G) =
= 14.071 …….. (13)
By using Definition 2.5
ABC(G) =
= 24.966 ………. (14)
By using Definition 2.6
SO(G) =
=130.961 ……….. (15)
By using Definition 2.7
N(G) =
=79.059 ………. (16)
By using Definition 2.8
N1(G) =
By using Definition 2.8
N1(G) =
=32.639 …………. (17)
By using Definition 2.9
N2(G) =
= =38.173 ………. (18)
Thus, TIs for all the other unexpended drugs can be obtained by making use of the process in Theorem 1 and applying the definitions from 1 to 9. The corresponding values for each medication are given in table 1.
Table 1: Topological indices values for the drugs for other drugs that are taken into consideration in the study and worked on by this method
| Drugs | M1 (G) | M2(G) | R(G) | H(G) | ABC(G) | SO(G) | N(G) | N1(G) | N2(G) |
| Ciclophosphamide | 64 | 72 | 6.726 | 6.486 | 9.996 | 46.721 | 29.717 | 13.889 | 14.336 |
| Doxorubicin | 220 | 275 | 18.428 | 17.486 | 30.77 | 160.4 | 96.82 | 40.501 | 46.589 |
| Etoposide | 242 | 302 | 20.282 | 19.63 | 33.88 | 174.559 | 107.399 | 44.553 | 52.434 |
| Fluorouracil | 42 | 46 | 4.198 | 3.933 | 6.651 | 30.98 | 19.393 | 8.931 | 9.205 |
| Gemcitabine | 96 | 119 | 8.374 | 7.354 | 13.835 | 70.764 | 42.496 | 18.292 | 20.164 |
| hydroxyurea | 16 | 14 | 2.27 | 2.067 | 3.047 | 12.167 | 7.968 | 4.447 | 4.052 |
| Ifosfamide | 64 | 72 | 6.726 | 6.486 | 9.996 | 46.721 | 29.717 | 13.889 | 14.336 |
| Irinotecan | 237 | 290 | 20.762 | 20.171 | 34.737 | 171.124 | 106.197 | 45.023 | 51.842 |
| methotrexate | 168 | 192 | 15.617 | 14.833 | 25.462 | 122.865 | 76.519 | 33.761 | 39.046 |
| Neratinib | 202 | 233 | 19.371 | 18.8 | 30.64 | 145.94 | 92.904 | 41.233 | 45.321 |
| paclitaxel | 346 | 429 | 29.377 | 27.783 | 48.99 | 253.05 | 152.62 | 62.69 | 75.286 |
| topotecan | 180 | 226 | 14.74 | 14.071 | 24.966 | 130.961 | 79.059 | 32.639 | 38.173 |
| vinblastine | 355 | 460 | 28.609 | 27.476 | 47.906 | 257.982 | 154.407 | 63.075 | 74.749 |
| Vinorelbine | 338 | 463 | 27.385 | 26.376 | 45.666 | 245.054 | 147.295 | 60.234 | 71.511 |
Table 2: The physical properties of the drugs utilised for cervical cancer
| Drugs | Boiling point (°C at 760 mmHg) | Flash point (°C) | Molar volume (cm3) | Enthalpy of vaporization (kj/mol) | Molar refraction (cm3) | Polarizability (cm3) |
| Ciclophosphamide | 336.1 | 157.1 | 195.7 | 57.9 | 58.1 | 23 |
| Doxorubicin | 810.3 | 443.8 | 336.6 | 123.5 | 131.5 | 52.1 |
| Etoposide | 798.1 | 263.6 | 378.5 | 121.7 | 140.1 | 55.5 |
| Fluorouracil | 84.8 | 25.9 | 10.2 | |||
| Gemcitabine | 482.7 | 245.7 | 142.3 | 86.2 | 52.1 | 20.6 |
| Hydroxyurea | 222.1 | 88.1 | 43.9 | 53.3 | 13.8 | 5.5 |
| Ifosfamide | 336.1 | 157.1 | 195.7 | 57.9 | 58.1 | 23 |
| Irinotecan | 873.4 | 482 | 416.8 | 133 | 159.2 | 63.1 |
| Methotrexate | 295.7 | 119 | 47.2 | |||
| Neratinib | 757 | 411.6 | 416.8 | 110.3 | 155.1 | 61.5 |
| Paclitaxel | 957.1 | 532.6 | 610.6 | 146 | 219.3 | 86.9 |
| Topotecan | 782.9 | 427.3 | 281.3 | 119.5 | 112.7 | 44.7 |
| Vinblastine | 590 | 220.7 | 87.5 | |||
| Vinorelbine | 569.7 | 214.2 | 84.9 |
In this article, table 1 presents data that reflects a normal distribution. The fact that statistical data is significant when the*p-value is less than 0.005 and the r-value is more than 0.7. So, as a direct consequence of these results, all the concerned properties are found to be significant.
Therefore, the ideal model to look at and apply in this analysis is the linear regression model. We recommend [5-12, 23, 25] for more information on TIs.
Regression models
The examination workout was done on 9 indices: such as M1(G), M2(G), R(G), H(G), ABC(G), SO(G), N(G), N1(G), and N2(G). The six physical properties are used to model these indices: boiling point (BP) °C at 760 mmHg, flash point (FP) °C, molar volume (MV)cm3, enthalpy of vaporization (EV) kj/mol, molar refractivity (MR) cm3, polarizability (POL) 10-[24] cm3. For the drugs, regression analysis has been conducted, and the linear regression model has been evaluated using this equation.
P = A+b (TI) …. (19)
Where P is Physical property, TI is topological indices, A is a constant, and b is a regression coefficient. Nine topological indices of the defined molecular structure are regarded as independent variables, while the six physical characteristics of the drugs used to treat cervical cancer are regarded as dependent variables.
The linear regression equation's A and b are determined using the training set in tables 1 and 2 when the linear regression model is calculated using SPSS software. The models are available below for the linear regression equation for each index (19).
(I) Regression model of M1(G): Boiling point = 223.655+2.471 [M1 (G)] Flash Point = 94.432+1.358[M1 (G)] Molar volume = 39.474+1.559 [M1 (G)] Enthalpy of vaporization=47.459+0.321[M1 (G)] Molar Refraction = 8.921+0.605 [M1 (G)] Polarization = 3.514+0.24 [M1 (G)] |
(V) Regression model of ABC(G): Boiling point = 209.78+17.679 [ABC (G)] Flash Point= 85.29+9.782[ABC (G)] Molar volume= 22.046+11.594[ABC (G)] Enthalpy of vaporization= 45.826+2.288[ABC (G)]Molar Refraction= 2.146+4.501[ABC (G)] Polarization= 0.828+1.785[ABC (G)] |
(II) Regression model of M2(G): Boiling point = 236.936+1.962[M2 (G)] Flash Point= 102.628+1.074[M2 (G)] Molar volume= 59.334+1.167[M2 (G)] Enthalpy of vaporization= 49.009+0.256 [M2 (G)] Molar Refraction = 16.666+0.453[M2 (G)] Polarization= 6.586+0.18[M2 (G)] |
(VI) Regression model of SO(G): Boiling point = 223.478+3.399[SO (G)] Flash Point= 93.812+1.873[SO (G)] Molar volume= 38.7+2.149[SO (G)] Enthalpy of vaporization=47.397+0.442 [SO (G)]Molar Refraction= 8.632+0.834[SO (G)] Polarization= 3.4+0.331[SO (G)] |
(III) Regression model of R(G): Boiling point = 195.489+29.927 [RA (G)] Flash Point= 76.88+16.593[RA (G)] Molar volume=10.216+19.812 [RA (G)] Enthalpy of vaporization= 44.195+3.858[RA (G)]Molar Refraction=-2.236+7.678[RA (G)] Polarization=-0.91+3.044[RA (G)] |
(VII) Regression model of N(G): Boiling point = 216.901+5.621 [N (G)] Flash Point= 90.598+3.092[N (G)] Molar volume= 32.14+3.596 [N (G)] Enthalpy of vaporization = 46.697+0.728[N (G)] Molar Refraction= 6.075+1.396[N (G)] Polarization= 2.386+0.553[N G)] |
(IV) Regression model of H(G): Boiling point = 199.599+31.067[H (G)] Flash Point= 80.08+17.16[H (G)] Molar volume= 12.916+20.557[H (G)] Enthalpy of vaporization= 44.885+3.994[H (G)]Molar Refraction=-1.166+7.965[H (G)] Polarization=-0.486+3.158[H (G)] |
(VIII) Regression model of N1(G) Boiling point = 195.419+13.878[N1 (G)] Flash Point= 77.947+7.66[N1 (G)] Molar volume=15.415+8.988[N1 (G)] Enthalpy of vaporization= 44.135+1.791[N1 (G)] Molar Refraction=-0.444+3.49[N1 (G)] Polarization=-0.2+1.384[N1 (G)] |
(IX) Regression model of N2(G) Boiling point = 222.832+11.385[N2 (G)] Flash Point= 93.937+6.26[N2 (G)] Molar volume=32.648+7.363[N2 (G)] Enthalpy of vaporization= 47.444+1.475[N2 (G)] Molar Refraction= 6.25+2.858[N2 (G)] Polarization= 2.455+1.133[N2 (G)] |
Comparison of topological indices based on the correlation statistical description of physical property coefficient
A computation of these degree-based TIs was performed for 14 cervical cancer drugs in table 1; table 2 presents their physical properties. From table 13, it can be concluded that there is an interdependence of these indices with six physical features, which considerably supports the findings here. The correlation between the topological indices and the physical characteristics of the drug, graphical representation is illustrated in fig. 4.
Table 3-11 lists various statistical parameters associated with QSPR models on TIs. Several drugs taken into consideration, constant, regression coefficient, correlation coefficient, Fisher's statistic, and possible value of significance for the QSPR model concerning all topological indices and physical properties put into consideration constitute the parameters N, A, b, r, F, and P. It will help in comparative assessments and model improvements.
Table 3: QSPR models are composed of statistical parameters for M1(G)
| Physical property | N | A | b | r | r2 | F | P | Indicator |
| Boiling point | 10 | 223.655 | 2.471 | 0.966 | 0.933 | 111.727 | 0.000 | Significant |
| Flash point | 10 | 94.432 | 1.358 | 0.892 | 0.796 | 31.182 | 0.001 | Significant |
| Molar volume | 14 | 39.474 | 1.559 | 0.978 | 0.956 | 257.724 | 0.000 | Significant |
| Enthalpy of Vaporization | 10 | 47.459 | 0.321 | 0.963 | 0.928 | 103.448 | 0.000 | Significant |
| Molar Refraction | 14 | 8.921 | 0.605 | 0.987 | 0.975 | 470.451 | 0.000 | Significant |
| Polarization | 14 | 3.514 | 0.24 | 0.987 | 0.975 | 467.992 | 0.000 | Significant |
Table 4: QSPR models are composed of statistical parameters for M2(G)
| Physical property | N | A | b | r | r2 | F | P | Indicator |
| Boiling Point | 10 | 236.936 | 1.962 | 0.966 | 0.934 | 113.13 | 0.000 | Significant |
| Flash Point | 10 | 102.628 | 1.074 | 0.889 | 0.79 | 30.094 | 0.001 | Significant |
| Molar Volume | 14 | 59.334 | 1.167 | 0.969 | 0.939 | 186.258 | 0.000 | Significant |
| Enthalpy of Vaporization | 10 | 49.009 | 0.256 | 0.967 | 0.935 | 115.533 | 0.000 | Significant |
| Molar Refractivity | 14 | 16.666 | 0.453 | 0.979 | 0.958 | 274.362 | 0.000 | Significant |
| Polarization | 14 | 6.586 | 0.18 | 0.979 | 0.958 | 273.318 | 0.000 | Significant |
Table 5: QSPR models are composed of statistical parameters for R(G)
| Physical property | N | A | b | r | r2 | F | P | Indicator |
| Boiling Point | 10 | 195.489 | 29.927 | 0.957 | 0.915 | 86.31 | 0.000 | Significant |
| Flash Point | 10 | 76.88 | 16.593 | 0.891 | 0.794 | 30.81 | 0.001 | Significant |
| Molar Volume | 14 | 10.216 | 19.812 | 0.986 | 0.973 | 434.348 | 0.000 | Significant |
| Enthalpy of Vaporization | 10 | 44.195 | 3.858 | 0.948 | 0.898 | 70.31 | 0.000 | Significant |
| Molar Refractivity | 14 | -2.236 | 7.678 | 0.995 | 0.99 | 1169.521 | 0.000 | Significant |
| Polarization | 14 | -0.91 | 3.044 | 0.995 | 0.99 | 1158.858 | 0.000 | Significant |
Table 6: QSPR models are composed of statistical parameters for H(G)
| Physical property | N | A | b | r | r2 | F | P | Indicator |
| Boiling Point | 10 | 199.599 | 31.067 | 0.957 | 0.915 | 86.1 | 0.000 | Significant |
| Flash Point | 10 | 80.08 | 17.16 | 0.888 | 0.788 | 29.676 | 0.001 | Significant |
| Molar Volume | 14 | 12.916 | 20.557 | 0.988 | 0.976 | 478.488 | 0.000 | Significant |
| Enthalpy of Vaporization | 10 | 44.885 | 3.994 | 0.945 | 0.893 | 66.46 | 0.000 | Significant |
| Molar Refractivity | 14 | -1.166 | 7.965 | 0.996 | 0.992 | 1470.618 | 0.000 | Significant |
| Polarization | 14 | -0.486 | 3.158 | 0.996 | 0.992 | 1456.932 | 0.000 | Significant |
Table 7: QSPR models are composed of statistical parameters for ABC(G)
| Physical property | N | A | b | r | r2 | F | P | Indicator |
| Boiling point | 10 | 209.78 | 17.679 | 0.964 | 0.928 | 103.809 | 0.000 | Significant |
| Flash point | 10 | 85.29 | 9.782 | 0.896 | 0.802 | 32.418 | 0.000 | Significant |
| Molar volume | 14 | 22.046 | 11.594 | 0.982 | 0.964 | 322.916 | 0.000 | Significant |
| Enthalpy of Vaporization | 10 | 45.826 | 2.288 | 0.958 | 0.918 | 89.464 | 0.000 | Significant |
| Molar Refraction | 14 | 2.146 | 4.501 | 0.992 | 0.984 | 743.403 | 0.000 | Significant |
| Polarization | 14 | 0.828 | 1.785 | 0.992 | 0.984 | 738.398 | 0.000 | Significant |
Table 8: QSPR models are composed of statistical parameters for SO(G)
| Physical property | N | A | b | r | r2 | F | P | Indicator |
| Boiling Point | 10 | 223.478 | 3.399 | 0.965 | 0.93 | 106.918 | 0.000 | Significant |
| Flash Point | 10 | 93.812 | 1.873 | 0.893 | 0.797 | 31.43 | 0.001 | Significant |
| Molar Volume | 14 | 38.7 | 2.149 | 0.977 | 0.955 | 254.795 | 0.000 | Significant |
| Enthalpy of Vaporization | 10 | 47.397 | 0.442 | 0.963 | 0.927 | 101.288 | 0.000 | Significant |
| Molar Refractivity | 14 | 8.632 | 0.834 | 0.987 | 0.974 | 457.203 | 0.000 | Significant |
| Polarization | 14 | 3.4 | 0.331 | 0.987 | 0.974 | 454.834 | 0.000 | Significant |
Table 9: QSPR models are composed of statistical parameters for N(G)
| Physical property | N | A | b | r | r2 | F | P | Indicator |
| Boiling Point | 10 | 216.901 | 5.621 | 0.966 | 0.933 | 110.592 | 0.000 | Significant |
| Flash Point | 10 | 90.598 | 3.092 | 0.892 | 0.796 | 31.238 | 0.001 | Significant |
| Molar Volume | 14 | 32.14 | 3.596 | 0.98 | 0.961 | 293.345 | 0.000 | Significant |
| Enthalpy of Vaporization | 10 | 46.697 | 0.728 | 0.961 | 0.924 | 96.828 | 0.000 | Significant |
| Molar Refractivity | 14 | 6.075 | 1.396 | 0.99 | 0.98 | 600.367 | 0.000 | Significant |
| Polarization | 14 | 2.386 | 0.553 | 0.99 | 0.98 | 596.767 | 0.000 | Significant |
Table 10: QSPR models are composed of statistical parameters for N1(G)
| Physical property | N | A | b | r | r2 | F | P | Indicator |
| Boiling Point | 10 | 195.419 | 13.878 | 0.965 | 0.931 | 107.134 | 0.000 | Significant |
| Flash Point | 10 | 77.947 | 7.66 | 0.894 | 0.8 | 31.975 | 0.000 | Significant |
| Molar Volume | 14 | 15.415 | 8.988 | 0.983 | 0.967 | 349.829 | 0.000 | Significant |
| Enthalpy of Vaporization | 10 | 44.135 | 1.791 | 0.956 | 0.915 | 85.633 | 0.000 | Significant |
| Molar Refractivity | 14 | -0.444 | 3.49 | 0.994 | 0.987 | 918.36 | 0.000 | Significant |
| Polarization | 14 | -0.2 | 1.384 | 0.993 | 0.987 | 912.06 | 0.000 | Significant |
Table 11: QSPR models are composed of statistical parameters for N2(G)
| Physical property | N | A | b | r | r2 | F | P | Indicator |
| Boiling Point | 10 | 222.832 | 11.385 | 0.962 | 0.926 | 99.554 | 0.000 | Significant |
| Flash Point | 10 | 93.937 | 6.26 | 0.889 | 0.79 | 30.036 | 0.001 | Significant |
| Molar Volume | 14 | 32.648 | 7.363 | 0.981 | 0.962 | 301.289 | 0.000 | Significant |
| Enthalpy of Vaporization | 10 | 47.444 | 1.475 | 0.958 | 0.918 | 89.026 | 0.000 | Significant |
| Molar Refractivity | 14 | 6.25 | 2.858 | 0.991 | 0.982 | 646.976 | 0.000 | Significant |
| Polarization | 14 | 2.455 | 1.133 | 0.991 | 0.982 | 643.412 | 0.000 | Significant |
Table 12: Standard error of estimate for the physical features of drugs used in cervical cancer
| Drugs | Boiling point | Flash point | Molar volume | Enthalpy of vaporization | Molar refractivity | Polarization |
| M1 (G) | 72.36839 | 75.30847 | 40.28891 | 9.762642 | 11.57514 | 4.601425 |
| M2(G) | 71.94825 | 76.37654 | 46.99262 | 9.272824 | 15.02433 | 5.968222 |
| R(G) | 81.53923 | 75.66871 | 31.31902 | 11.64645 | 7.396604 | 2.946167 |
| H(G) | 81.6303 | 76.7991 | 29.87658 | 11.94378 | 6.602955 | 2.630321 |
| ABC(G) | 74.887 | 74.14803 | 36.15571 | 10.43953 | 9.250468 | 3.680135 |
| SO(G) | 73.86722 | 75.07196 | 40.50945 | 9.858617 | 11.73742 | 4.665821 |
| N(G) | 72.71383 | 75.25545 | 37.86601 | 10.06619 | 10.27418 | 4.085866 |
| N1(G) | 73.79794 | 74.5577 | 34.78509 | 10.65093 | 8.33542 | 3.316344 |
| N2(G) | 76.35413 | 76.43507 | 37.38287 | 10.46308 | 9.904175 | 3.93779 |
Table 13: Correlation coefficient of physical features of drugs utilized in cervical cancer
| Drugs | Boiling point | Flash point | Molar volume | Enthalpy of vaporization | Molar refraction | Polarizability |
| M1 (G) | 0.966 | 0.892 | 0.978 | 0.963 | 0.987 | 0.987 |
| M2(G) | 0.966 | 0.889 | 0.969 | 0.967 | 0.979 | 0.979 |
| R(G) | 0.957 | 0.891 | 0.986 | 0.948 | 0.995 | 0.995 |
| H(G) | 0.957 | 0.888 | 0.988 | 0.945 | 0.996 | 0.996 |
| ABC(G) | 0.964 | 0.896 | 0.982 | 0.958 | 0.992 | 0.992 |
| SO(G) | 0.965 | 0.893 | 0.977 | 0.963 | 0.987 | 0.987 |
| N(G) | 0.966 | 0.892 | 0.98 | 0.961 | 0.99 | 0.99 |
| N1(G) | 0.965 | 0.894 | 0.983 | 0.956 | 0.994 | 0.993 |
| N2(G) | 0.962 | 0.889 | 0.981 | 0.958 | 0.991 | 0.991 |
The correlation coefficients (r>0.7) and *p values (p<0.001) observed in this study confirm strong and statistically significant relationships between computed TIs and the physical properties of the analyzed cervical cancer drugs. However, R(G), SO(G), N1(G), and N2(G) have slightly weaker correlations with certain properties when compared with other indices. This variation in performance can be attributed to the mathematical nature and structural information of each index that captures the chemical features that conduct the specific physical properties prediction. Conversely, the Boiling Point and enthalpy of vaporization are determined by the overall size and branching of a molecule, which helps some of the indices show superior correlations for Physical characteristics listed in the conclusion.
Table 14: Comparison of results with the survey
| Indices | Boiling point | Flash point | Enthalpy of vaporization | Molar refractivity |
| Results of the cervical cancer drugs | ||||
| M1(G) | 0.966 | 0.892 | 0.963 | 0.987 |
| M2(G) | 0.966 | 0.889 | 0.967 | 0.979 |
| H(G) | 0.957 | 0.888 | 0.945 | 0.996 |
| Results of schizophrenia drugs-Zhang X et al. (2023) | ||||
| M1(G) | 0.840 | 0.840 | 0.778 | 0.881 |
| M2(G) | 0.800 | 0.800 | 0.726 | 0.865 |
| H(G) | 0.915 | 0.915 | 0.885 | 0.896 |
| Results of anti-malaria drugs-Zhang X et al.(2022) | ||||
| M1(G) | 0.961 | 0.961 | 0.968 | 0.838 |
| M2(G) | 0.962 | 0.963 | 0.978 | 0.76 |
| H(G) | 0.908 | 0.908 | 0.894 | 0.963 |
| Results of breast cancer drugs-Shanmukha et al. (2022). | ||||
| M1(G) | 0.895 | 0.898 | 0.845 | 0.977 |
| M2(G) | 0.887 | 0.892 | 0.849 | 0.958 |
| H(G) | 0.873 | 0.874 | 0.793 | 0.993 |
| Results of anticancer drugs-Shanmukha et al. (2022). | ||||
| M1(G) | 0.849 | 0.754 | 0.836 | 0.919 |
| M2(G) | 0.844 | 0.749 | 0.837 | 0.877 |
| H(G) | 0.806 | 0.723 | 0.788 | 0.941 |
There are many articles that focus on degree–based TIs and linear regression in the area of drugs. From table 14 above, we can observe the comparison of various drugs and their outcomes, and we can notice that the correlation coefficient of cervical cancer is excessive and appropriate for use as a substitute for drug experimental values.
Our analysis of cervical cancer drugs using QSPR correlates with many recent studies across various therapeutic areas that have employed degree-based topological indices. As discussed on breast cancer drugs, SO (G) and the forgotten index showed a strong correlation with the boiling point and enthalpy of vaporization, respectively. Likewise, the other study shown predictive reliability of M1 (G) and M2 (G) for similar properties, even for more broadly termed anticancer compounds. In this current study, these indices also provided strong predictive power, especially towards boiling point and enthalpy, during the present study, reconfirming their flexibility. The polarizability property was again well supported by our results, with correlation to H (G), which agrees with findings from the discussion on anti-malaria drugs. In addition, the correlation of ABC (G) with molar volume in our cervical cancer data parallels the results studied schizophrenia drugs that successfully employed ABC (G) and the forgotten indices.
Undoubtedly, while there are notable similarities, our study introduces novel insights by exploring the performance of N(G) and its inverse index, not received much credit in earlier QSPR investigations. These indices seem to have an extraordinarily high correlation with boiling point values, suggesting they would be good predictors for cervical cancer drug agents. The broader mapping of properties to indices implies unique structural features for cervical cancer drugs and hints at the importance of considering a more diverse range of topological descriptors for better modelling.
(i) |
(ii) |
(iii) |
(iv) |
(v) |
(vi) |
(vii) |
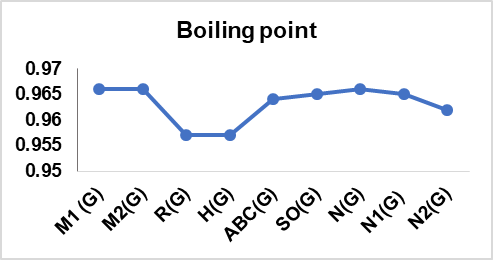
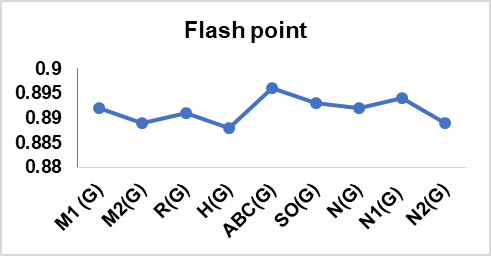
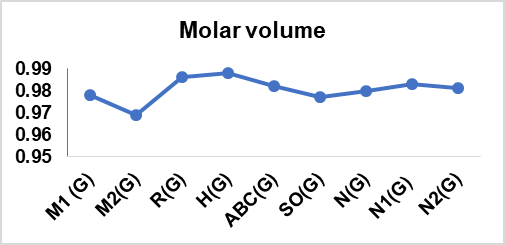
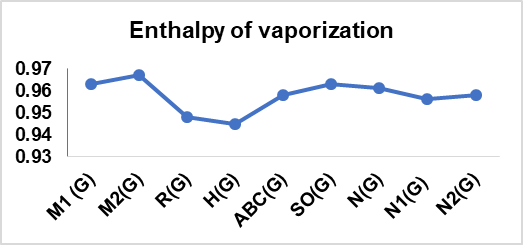
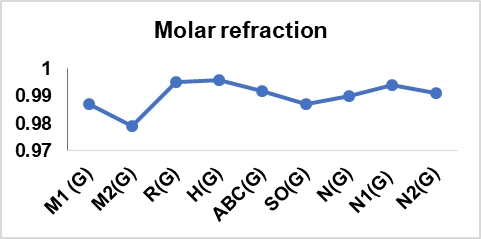
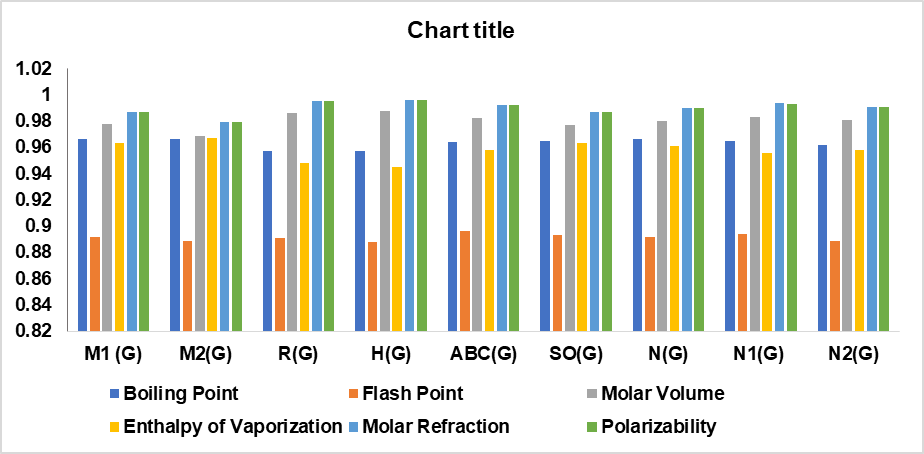
Fig. 4: Graphical depiction of the correlation between Topological indices and physical properties of drugs
The standard error estimate is a measure of variance for consideration in table 12, which lies around the predicted regression line. It checks the precision of the predictions regarding the calculated regression line. Tables 15 to 20 indicate the differences between actual values and calculated values for all the physical properties of pharmaceuticals for cervical cancer.
In addition to validating the proposed models theoretically, the outcome of this study has some tangible implications for drug discovery and pharmaceutical research. The strong correlations found between topological indices and physical properties of cervical cancer treatment indicate that the established models could find application as predictive tools in the early stage of drug development.
Once molecular structure information of a new compound is obtained, it allows one to compute the topological indices of the compound. This would enable an approximate prediction of some of its important characteristics without the necessity of immediate laboratory synthesis or testing. This predictive ability greatly enhances the rapid screening of new drug candidates against the desired physical characteristics.
Moreover, these models would help in the optimization of existing compounds by facilitating the rational design of their structural modifications to improve those properties that are directly related to efficacy, safety, and stability in formulation. Therefore, these models are justified as cost-effective and efficient computational tools for lead optimization, formulation development, and screening of new drugs in pharmaceutical research.
Table 15: Contrast of actual and predicted values for Boiling point based on regression models
| Drugs | BP (°C at 760 mmHg) | M1(G) | M2(G) | R(G) | H(G) | ABC(G) | SO(G) | N(G) | N1(G) | N2(G) |
| Ciclophosphamide | 336.1±52.0 | 381.799 | 378.200 | 396.778 | 401.100 | 386.499 | 382.283 | 383.940 | 388.171 | 386.047 |
| Doxorubicin | 810.3±65.0 | 767.275 | 776.486 | 746.984 | 742.837 | 753.763 | 768.678 | 761.126 | 757.492 | 753.248 |
| Etoposide | 798.1±60.0 | 821.637 | 829.460 | 802.468 | 809.444 | 808.745 | 816.804 | 820.591 | 813.726 | 819.793 |
| Fluorouracil | 327.437 | 327.188 | 321.123 | 321.786 | 327.363 | 328.779 | 325.909 | 319.363 | 327.631 | |
| Gemcitabine | 482.7±55.0 | 460.871 | 470.414 | 446.098 | 428.066 | 454.369 | 464.005 | 455.771 | 449.275 | 452.399 |
| Hydroxyurea | 222.1±23.0 | 263.191 | 264.404 | 263.423 | 263.814 | 263.648 | 264.834 | 261.689 | 257.134 | 268.964 |
| Ifosfamide | 336.1±52.0 | 381.799 | 378.200 | 396.778 | 401.100 | 386.499 | 382.283 | 383.940 | 388.171 | 386.047 |
| Irinotecan | 873.4±65.0 | 809.282 | 805.916 | 816.833 | 826.251 | 823.895 | 805.128 | 813.834 | 820.248 | 813.053 |
| Methotrexate | 638.783 | 613.640 | 662.859 | 660.416 | 659.923 | 641.096 | 647.014 | 663.954 | 667.371 | |
| Neratinib | 757.0±60.0 | 722.797 | 694.082 | 775.205 | 783.659 | 751.465 | 719.528 | 739.114 | 767.651 | 738.812 |
| Paclitaxel | 957.1±65.0 | 1078.621 | 1078.634 | 1074.654 | 1062.733 | 1075.874 | 1083.595 | 1074.778 | 1065.431 | 1079.963 |
| Topotecan | 782.9±60.0 | 668.435 | 680.348 | 636.613 | 636.743 | 651.154 | 668.614 | 661.292 | 648.383 | 657.432 |
| Vinblastine | 1100.860 | 1139.456 | 1051.671 | 1053.196 | 1056.710 | 1100.359 | 1084.823 | 1070.774 | 1073.849 | |
| Vinorelbine | 1058.853 | 1145.342 | 1015.040 | 1019.022 | 1017.109 | 1056.417 | 1044.846 | 1031.346 | 1036.985 |
Table 16: Contrast of actual and predicted values for Flash point based on regression models
| Drugs name | FP (°C) | M1(G) | M2(G) | R(G) | H(G) | ABC(G) | SO(G) | N(G) | N1(G) | N2(G) |
| Ciclophosphamide | 157.1±30.7 | 181.344 | 243.892 | 188.485 | 191.380 | 183.071 | 181.320 | 182.483 | 184.337 | 183.680 |
| Doxorubicin | 443.8±34.3 | 393.192 | 642.178 | 382.656 | 380.140 | 386.282 | 394.241 | 389.965 | 388.185 | 385.584 |
| Etoposide | 263.6±26.4 | 423.068 | 695.152 | 413.419 | 416.931 | 416.704 | 420.761 | 422.676 | 419.223 | 422.174 |
| Fluorourcil | 151.468 | 192.880 | 146.537 | 147.570 | 150.350 | 151.838 | 150.561 | 146.358 | 151.560 | |
| Gemcitabine | 245.7±31.5 | 224.800 | 336.106 | 215.830 | 206.275 | 220.624 | 226.353 | 221.996 | 218.064 | 220.164 |
| Hydroxyrea | 88.1±22.6 | 116.160 | 130.096 | 114.546 | 115.550 | 115.096 | 116.601 | 115.235 | 112.011 | 119.303 |
| Ifosfamide | 157.1±30.7 | 181.344 | 243.892 | 188.485 | 191.380 | 183.071 | 181.320 | 182.483 | 184.337 | 183.680 |
| Irinotecan | 482±34.3 | 416.278 | 671.608 | 421.384 | 426.214 | 425.087 | 414.327 | 418.959 | 422.823 | 418.468 |
| Methotrexate | 322.576 | 479.332 | 336.013 | 334.614 | 334.359 | 323.938 | 327.195 | 336.556 | 338.365 | |
| Neratinib | 411.6±32.9 | 368.748 | 559.774 | 398.303 | 402.688 | 385.010 | 367.158 | 377.857 | 393.792 | 377.646 |
| Paclitaxel | 532.6±34.3 | 564.300 | 944.326 | 564.333 | 556.836 | 564.510 | 567.775 | 562.499 | 558.152 | 565.227 |
| Topotecan | 427.3±32.9 | 338.872 | 546.040 | 321.461 | 321.538 | 329.507 | 339.102 | 335.048 | 327.962 | 332.900 |
| Vinblastine | 576.522 | 1005.148 | 551.589 | 551.568 | 553.906 | 577.012 | 568.024 | 561.102 | 561.866 | |
| Vinorelbine | 553.436 | 1011.034 | 531.279 | 532.692 | 531.995 | 552.798 | 546.034 | 539.339 | 541.596 |
Table 17: Contrast of actual and predicted values for molar volume based on regression models
| Drugs name | MV (cm3) | M1(G) | M2(G) | R(G) | H(G) | ABC(G) | SO(G) | N(G) | N1(G) | N2(G) |
| Ciclophosphamide | 195.7±5.0 | 139.250 | 143.358 | 143.472 | 146.249 | 137.940 | 139.103 | 139.002 | 140.249 | 138.204 |
| Doxorubicin | 336.6±5.0 | 382.454 | 380.259 | 375.312 | 372.376 | 378.793 | 383.400 | 380.305 | 379.438 | 375.683 |
| Etoposide | 378.5±5.0 | 416.752 | 411.768 | 412.043 | 416.450 | 414.851 | 413.827 | 418.347 | 415.857 | 418.720 |
| Fluorouracil | 84.8±5.0 | 104.952 | 113.016 | 93.387 | 93.767 | 99.158 | 105.276 | 101.877 | 95.687 | 100.424 |
| Gemcitabine | 142.3±7.0 | 189.138 | 198.207 | 176.122 | 164.092 | 182.449 | 190.772 | 184.956 | 179.823 | 181.116 |
| Hydroxyurea | 43.9±7.0 | 64.418 | 75.672 | 55.189 | 55.407 | 57.373 | 64.847 | 60.793 | 55.385 | 62.483 |
| Ifosfamide | 195.7±5.0 | 139.250 | 143.358 | 143.472 | 146.249 | 137.940 | 139.103 | 139.002 | 140.249 | 138.204 |
| Irinotecan | 416.8±5.0 | 408.957 | 397.764 | 421.553 | 427.571 | 424.787 | 406.445 | 414.024 | 420.082 | 414.361 |
| Methotrexate | 295.7±3.0 | 301.386 | 283.398 | 319.620 | 317.838 | 317.252 | 302.737 | 307.302 | 318.859 | 320.144 |
| Neratinib | 416.8±5.0 | 354.392 | 331.245 | 393.994 | 399.388 | 377.286 | 352.325 | 366.223 | 386.017 | 366.347 |
| Paclitaxel | 610.6±5.0 | 578.888 | 559.977 | 592.233 | 584.051 | 590.036 | 582.504 | 580.962 | 578.873 | 586.979 |
| Topotecan | 281.3±5.0 | 320.094 | 323.076 | 302.245 | 302.174 | 311.502 | 320.135 | 316.436 | 308.774 | 313.716 |
| Vinblastine | 590±5.0 | 592.919 | 596.154 | 577.018 | 577.740 | 577.468 | 593.103 | 587.388 | 582.333 | 583.025 |
| Vinorelbine | 569.7±5.0 | 566.416 | 599.655 | 552.768 | 555.127 | 551.498 | 565.321 | 561.813 | 556.798 | 559.183 |
The results of this specific research will be highly useful to academics who are investing a lot of effort in modelling the intricacies of drug science in the pharmaceutical field. In addition, these findings provide a realistic approach that makes it possible to predict physical attributes associated with new findings in cervical cancer drugs, which can also be used to treat and cure a vast range of other specific medical diseases.
Here, fourteen compounds remain a meaningful starting point for validation, but in the future, an expanded dataset will be greatly beneficial to increase the robustness and generalizability of the models. In addition, applying cross-validation techniques on larger studies will help to further strengthen the predictive reliability of these models across structurally diverse drug candidates.
Over and above the shortcomings, the current results demonstrate the stated potential of the proposed approach to assist in early drug screening and structural optimization in drug research.
Table 18: Contrast of actual and predicted values for the enthalpy of vaporization based on regression models
| Drugs name | EV (kj/mol) | M1(G) | M2(G) | R(G) | H(G) | ABC(G) | SO(G) | N(G) | N1(G) | N2(G) |
| Ciclophosphamide | 57.9±3.0 | 68.003 | 67.441 | 70.144 | 70.790 | 68.697 | 68.048 | 68.331 | 69.010 | 68.590 |
| Doxorubicin | 123.5±3.0 | 118.079 | 119.409 | 115.290 | 114.724 | 116.228 | 118.294 | 117.182 | 116.672 | 116.163 |
| Etoposide | 121.7±3.0 | 125.141 | 126.321 | 122.443 | 123.287 | 123.343 | 124.552 | 124.883 | 123.929 | 124.784 |
| Fluorouracil | 60.941 | 60.785 | 60.391 | 60.593 | 61.043 | 61.090 | 60.815 | 60.130 | 61.021 | |
| Gemcitabine | 86.2±6.0 | 78.275 | 79.473 | 76.502 | 74.257 | 77.480 | 78.675 | 77.634 | 76.896 | 77.186 |
| Hydroxyurea | 53.3±6.0 | 52.595 | 52.593 | 52.953 | 53.141 | 52.798 | 52.775 | 52.498 | 52.100 | 53.421 |
| Ifosfamide | 57.9±3.0 | 68.003 | 67.441 | 70.144 | 70.790 | 68.697 | 68.048 | 68.331 | 69.010 | 68.590 |
| Irinotecan | 133±3.0 | 123.536 | 123.249 | 124.295 | 125.448 | 125.304 | 123.034 | 124.008 | 124.771 | 123.911 |
| Methotrexate | 101.387 | 98.161 | 104.445 | 104.128 | 104.083 | 101.703 | 102.403 | 104.601 | 105.037 | |
| Neratinib | 110.3±3.0 | 112.301 | 108.657 | 118.928 | 119.972 | 115.930 | 111.902 | 114.331 | 117.983 | 114.292 |
| Paclitaxel | 146±3.0 | 158.525 | 158.833 | 157.531 | 155.850 | 157.915 | 159.245 | 157.804 | 156.413 | 158.491 |
| Topotecan | 119.5±3.0 | 105.239 | 106.865 | 101.062 | 101.085 | 102.948 | 105.282 | 104.252 | 102.591 | 103.749 |
| Vinblastine | 161.414 | 166.769 | 154.569 | 154.624 | 155.435 | 161.425 | 159.105 | 157.102 | 157.699 | |
| Vinorelbine | 155.957 | 167.537 | 149.846 | 150.231 | 150.310 | 155.711 | 153.928 | 152.014 | 152.923 |
Table 19: Contrast of actual and predicted values for molar refraction based on regression models
| Drugs name | MR (cm3) | M1(G) | M2(G) | R(G) | H(G) | ABC(G) | SO(G) | N(G) | N1(G) | N2(G) |
| Ciclophosphamide | 58.1±0.4 | 47.641 | 49.282 | 49.406 | 50.495 | 47.138 | 47.597 | 47.560 | 48.029 | 47.222 |
| Doxorubicin | 131.5±0.4 | 142.021 | 141.241 | 139.254 | 138.110 | 140.642 | 142.406 | 141.236 | 140.904 | 139.401 |
| Etoposide | 140.1±0.4 | 155.331 | 153.472 | 153.489 | 155.187 | 154.640 | 154.214 | 156.004 | 155.046 | 156.106 |
| Fluorouracil | 25.9±0.4 | 34.331 | 37.504 | 29.996 | 30.160 | 32.082 | 34.469 | 33.148 | 30.725 | 32.558 |
| Gemcitabine | 52.1±0.5 | 67.001 | 70.573 | 62.060 | 57.409 | 64.417 | 67.649 | 65.399 | 63.395 | 63.879 |
| Hydroxyurea | 13.8±0.5 | 18.601 | 23.008 | 15.193 | 15.298 | 15.861 | 18.779 | 17.198 | 15.076 | 17.831 |
| Ifosfamide | 58.1±0.4 | 47.641 | 49.282 | 49.406 | 50.495 | 47.138 | 47.597 | 47.560 | 48.029 | 47.222 |
| Irinotecan | 159.2±0.4 | 152.306 | 148.036 | 157.175 | 159.496 | 158.497 | 151.349 | 154.326 | 156.686 | 154.414 |
| Methotrexate | 119±0.3 | 110.561 | 103.642 | 117.671 | 116.979 | 116.750 | 111.101 | 112.896 | 117.382 | 117.843 |
| Neratinib | 155.1±0.4 | 131.131 | 122.215 | 146.495 | 148.576 | 140.057 | 130.346 | 135.769 | 143.459 | 135.777 |
| Paclitaxel | 219.3±0.4 | 218.251 | 211.003 | 223.321 | 220.126 | 222.650 | 219.676 | 219.133 | 218.344 | 221.417 |
| Topotecan | 112.7±0.4 | 117.821 | 119.044 | 110.938 | 110.910 | 114.518 | 117.853 | 116.441 | 113.466 | 115.348 |
| Vinblastine | 220.7±0.4 | 223.696 | 225.046 | 217.424 | 217.680 | 217.771 | 223.789 | 221.627 | 219.688 | 219.883 |
| Vinorelbine | 214.2±0.4 | 213.411 | 226.405 | 208.026 | 208.919 | 207.689 | 213.007 | 211.699 | 209.773 | 210.628 |
Table 20: Contrast of actual and predicted values for polarization based on regression models
| Drugs name | POL(10-[24]cm3) | M1(G) | M2(G) | R(G) | H(G) | ABC(G) | SO(G) | N(G) | N1(G) | N2(G) |
| Ciclophosphamide | 23±0.5 | 18.874 | 19.546 | 19.564 | 19.997 | 18.671 | 18.865 | 18.820 | 19.022 | 18.698 |
| Doxorubicin | 52.1±0.5 | 56.314 | 56.086 | 55.185 | 54.735 | 55.752 | 56.492 | 55.927 | 55.853 | 55.240 |
| Etoposide | 55.5±0.5 | 61.594 | 60.946 | 60.828 | 61.506 | 61.304 | 61.179 | 61.778 | 61.461 | 61.863 |
| Fluorouracil | 10.2±0.5 | 13.594 | 14.866 | 11.869 | 11.934 | 12.700 | 13.654 | 13.110 | 12.161 | 12.884 |
| Gemcitabine | 20.6±0.5 | 26.554 | 28.006 | 24.580 | 22.738 | 25.523 | 26.823 | 25.886 | 25.116 | 25.301 |
| Hydroxyurea | 5.5±0.5 | 7.354 | 9.106 | 6.000 | 6.042 | 6.267 | 7.427 | 6.792 | 5.955 | 7.046 |
| Ifosfamide | 23±0.5 | 18.874 | 19.546 | 19.564 | 19.997 | 18.671 | 18.865 | 18.820 | 19.022 | 18.698 |
| Irinotecan | 63.1±0.5 | 60.394 | 58.786 | 62.290 | 63.214 | 62.834 | 60.042 | 61.113 | 62.112 | 61.192 |
| Methotrexate | 47.2±0.5 | 43.834 | 41.146 | 46.628 | 46.357 | 46.278 | 44.068 | 44.701 | 46.525 | 46.694 |
| Neratinib | 61.5±0.5 | 51.994 | 48.526 | 58.055 | 58.884 | 55.520 | 51.706 | 53.762 | 56.866 | 53.804 |
| Paclitaxel | 86.9±0.5 | 86.554 | 83.806 | 88.514 | 87.253 | 88.275 | 87.160 | 86.785 | 86.563 | 87.754 |
| Topotecan | 44.7±0.5 | 46.714 | 47.266 | 43.959 | 43.950 | 45.392 | 46.748 | 46.106 | 44.972 | 45.705 |
| Vinblastine | 87.5±0.5 | 88.714 | 89.386 | 86.176 | 86.283 | 86.340 | 88.792 | 87.773 | 87.096 | 87.146 |
| Vinorelbine | 84.9±0.5 | 84.634 | 89.926 | 82.450 | 82.809 | 82.342 | 84.513 | 83.840 | 83.164 | 83.477 |
CONCLUSION
In this article, nine topological indices were used to develop a QSPR model for fourteen cervical cancer drugs. The model quantifies the correlation between six physical characteristics of the drugs and the TIs having been selected, as depicted in table 13. The linear regression model is validated, confirming the reliability and the extent of prediction attained. The result revealed that the boiling point has the highest correlation with M1 (G), M2 (G), and N (G), with r = 0.966. Flashpoint shows a good correlation with ABC (G) with r = 0.896, also molar volume has a high correlation with H (G) with r = 0.988. Also, the enthalpy of vaporization good correlation with M2 (G) = 0.967. Both molar refraction and polarizability have a high correlation with H (G), with r = 0.996. The correlation coefficients above 0.7 and the *p-value ≤ 0.001 (**p ≤ 0.005) in all instances confirmed the statistical significance of the models, control, and indicated the robustness and reliability of the developed QSPR models.
The drugs used in cervical cancer treatment are examined in this research. Finding information about the topology of a structure using topological indices (TIs) in a shorter amount of time and at a lower cost is the goal of this effort. Using different excipients based on topological indices aids researchers and chemists in creating new drugs. By creating new medications with high correlation values, chemists can select the ideal composition for new diseases.
ACKNOWLEDGEMENT
We acknowledge the Department of Mathematics, Dr. M. G. R. Educational and Research Institute, for providing research support, and we also thank ChemSpider, https://www.chemspider.com/, for data availability for my research work.
FUNDING
Nil
AUTHORS CONTRIBUTIONS
Methodology and original draft preparation were handled by Priyadarshini S, while conceptualization and supervision were conducted by Dr. S. Kopperundevi. Both authors have reviewed and approved the final manuscript.
CONFLICT OF INTERESTS
The authors assert that they have no conflicts of interest.
REFERENCES
World Health Organization. Cervical cancer. In: Geneva: World Health Organization; 2024 Mar 5. Available from: https://www.who.int/news-room/fact-sheets/detail/cervical-cancer. [Last accessed on 12 Apr 2025].
Gadekar S, Bhadake T, Sanap G. Review on cervical cancer associated risk staging screening tests therapies and vaccination. Int J Pharm Sci. 2024;2(12):3348-65. doi: 10.5281/zenodo.14575154.
Jyothi BD, Sai SB, Lakshmi BC, Begum SS, Kumar DA. Awareness of cervical cancer risk assessment. Int J Pharm Pharm Sci. 2018 Feb 1;10(2):15-23. doi: 10.22159/ijpps.2018v10i2.18882.
Joseph AN, Dhanraj KI, Ramalingam SI, Saravanan RE. Treating cervical cancer with herbs: a review. Asian J Pharm Clin Res. 2018;11(7):4-10. doi: 10.22159/ajpcr.2018.v11i7.25580.
Rasheed MW, Mahboob A, Hanif I. On QSAR modeling with novel degree-based indices and thermodynamics properties of eye infection therapeutics. Front Chem. 2024 May 27;12:1383206. doi: 10.3389/fchem.2024.1383206, PMID 38860235.
Shanmukha MC, Usha A, Praveen BM, Douhadji A. Degree based molecular descriptors and QSPR analysis of breast cancer drugs. J Math. 2022;2022(1):5880011. doi: 10.1155/2022/5880011.
Shanmukha MC, Basavarajappa NS, Shilpa KC, Usha A. Degree based topological indices on anticancer drugs with QSPR analysis. Heliyon. 2020 Jun 23;6(6):e04235. doi: 10.1016/j.heliyon.2020.e04235, PMID 32613116.
Zhang X, Reddy HG, Usha A, Shanmukha MC, Farahani MR, Alaeiyan M. A study on anti-malaria drugs using degree-based topological indices through QSPR analysis. Math Biosci Eng. 2023 Jan;20(2):3594-609. doi: 10.3934/mbe.2023167, PMID 36899594.
Parveen S, Farooq FB, Awan NU, Fanja R, Choudhary MF. Topological indices of drugs used in rheumatoid arthritis treatment and its QSPR modeling. J Math. 2022 Aug;2022(1):1-11. doi: 10.1155/2022/1562125.
Parveen S, Awan NU, Farooq FB, Fanja R, Anjum QU. Topological indices of novel drugs used in autoimmune disease vitiligo treatment and its QSPR modeling. BioMed Res Int. 2022 Nov 15;2022:6045066. doi: 10.1155/2022/6045066, PMID 36425334.
Farooq FB, Parveen S, Hassan Awan NU, Fanja R. Topological descriptors and QSPR modelling of HIV/AIDS disease treatment drugs. Discrete Dynamics in Nature and Society. 2023;2023:1-13. doi: 10.1155/2023/9963241.
Mahboob A, Rasheed MW, Dhiaa AM, Hanif I, Amin L. Quantitative structure property relationship (QSPR) analysis of physicochemical properties and anti-hepatitis prescription drugs using a linear regression model. Heliyon. 2024 Feb 12;10(4):e25908. doi: 10.1016/j.heliyon.2024.e25908.
Trinajstic N. Chemical graph theory. 2nd ed. Boca Raton (FL): CRC Press; 1992.
Harary F. Graph theory. 1st ed. Reading: Addison Wesley; 1969.
Gutman I, Trinajstic N, Trinajstic N, Wilcox CF. Graph theory and molecular orbitals. XII. Acyclic polyenes. J Chem Phys. 1975 May;62(9):3399-405. doi: 10.1063/1.430994.
Randic M. Characterization of molecular branching. J Am Chem Soc. 1975 Nov;97(23):6609-15. doi: 10.1021/ja00856a001.
Fajtlowicz S. On conjectures of graffiti. Discrete Math. 1988;72(1-3):113-8. doi: 10.1016/0012-365X(88)90199-9.
Estrada E, Torres L, Rodriguez L, Gutman I. An atom-bond connectivity index: modelling the enthalpy of formation of alkanes. Indian J Chem Sec A. 1998 Oct;37A:849-55.
Gutman I. Geometric approach to degree-based topological indices: Sombor Indices. MATCH Commun Math Comput Chem. 2021;86(1):11-6.
VR K. Nirmala index. Int J Math Trends Technol. 2021 Mar;67(3):8-12. doi: 10.14445/22315373/IJMTT-V67I3P502.
Kulli VR, Lokesha V, Nirupadi K. Computation of inverse Nirmala indices of certain nanostructures. International Journal of Mathematics and Combinatorics. 2021 Jun 1;2:33-40.
S R, Kulli VR, Niranjan KM, Goudar VM. Nirmala indices of certain antiviral drugs. Int J Math Comput Res. 2023 Nov;11(11):3862-6. doi: 10.47191/ijmcr/v11i11.05.
Arockiaraj M, Greeni AB, Kalaam AR. Comparative analysis of reverse degree and entropy topological indices for drug molecules in blood cancer treatment through QSPR regression models. Polycyclic Aromatic Compounds. 2023;44(9):6024-41. doi: 10.1080/10406638.2023.2271648.
Zhang X, Saif MJ, Idrees N, Kanwal S, Parveen S, Saeed F. QSPR analysis of drugs for treatment of schizophrenia using topological indices. ACS Omega. 2023 Oct 24;8(44):41417-26. doi: 10.1021/acsomega.3c05000, PMID 37970009.
Parveen S, Hassan Awan NU, Mohammed M, Farooq FB, Iqbal N. Topological indices of novel drugs used in diabetes treatment and their QSPR modeling. J Math. 2022;2022(1):5209329. doi: 10.1155/2022/5209329.