
Int J App Pharm, Vol 17, Issue 4, 2025, 216-230Original Article
DEVELOPMENT AND VALIDATION OF AN RP-HPLC CHROMATOGRAPHIC METHOD FOR THE DETERMINATION OF RELATED SUBSTANCES IN A POLYPHARMACEUTICAL ORAL SUSPENSION WITH ION EXCHANGE RESIN-BASED TASTE MASKING
ROBINDRA K. PANDIT, VIVEK PANDEY*
Department of Chemistry, School for Chemical Engineering and Physical Sciences, Lovely Professional University, Phagwara, Punjab, India
*Corresponding author: Vivek Pandey; *Email: vivekpandey11sep@gmail.com
Received: 23 Mar 2025, Revised and Accepted: 04 Jun 2025
ABSTRACT
Objective: This study focuses on the development and validation of a high-performance liquid chromatography (HPLC) method for the estimation of related substances in both bulk and finished oral suspension formulations intended for the treatment of acute nasopharyngitis. The formulation incorporates taste-masked Dextromethorphan Hydrobromide (DMH), Phenylephrine Hydrochloric Acid (PEH), and Chlorpheniramine Maleate (CPM) using ion exchange resin. The validation process assesses parameters such as specificity, precision, accuracy, linearity, robustness, limit of detection (LOD), and limit of quantification (LOQ), ensuring the method’s applicability for quality control and regulatory compliance.
Methods: A gradient HPLC method employing a reversed-phase column and an optimized mobile phase was utilized for the effective separation of related substances in the taste-masked oral suspension. The method parameters include a 70-minute run time per injection, a flow rate of 1.2 ml/min, a detection wavelength of 265 nm, an injection volume of 20 µl**, and a column temperature maintained at 35 °C. The validation procedure encompasses specificity, precision, accuracy, linearity, robustness, LOD and LOQ assessments. This method ensures reliable and reproducible quantification, making it suitable for routine quality control applications and regulatory submissions.
Results: The developed HPLC method successfully achieved the separation of related substances within the specified 70 min runtime per injection. System suitability criteria were met, confirming method efficiency. The method exhibited high specificity with no interference, achieving peak resolutions exceeding 1.5. It demonstrated precise repeatability (relative standard deviation ((RSD)<2%), accurate recovery within 98–102%, and strong linearity (R²>0.999). The sensitivity of the method was confirmed through LOD and LOQ values. Robustness studies indicated the stability of the method under varying analytical conditions, supporting its reliability for routine quality control.
Conclusion: The validated HPLC method provides a robust approach for estimating related substances in taste-masked Dextromethorphan HBr, Phenylephrine HCl, and Chlorpheniramine Maleate oral suspension. Meeting all essential validation criteria—including specificity, precision, accuracy, linearity, robustness, LOD and LOQ the method ensures accurate, sensitive, and reproducible quantification. Consequently, it is well-suited for routine quality control analysis in pharmaceutical formulations.
Keywords HPLC, Related substance, ICH guidelines, Dextromethorphan hydrobromide, Phenylephrine hydrochloride, Chlorpheniramine maleate, Ion exchange resin, Oral suspension and validation
© 2025 The Authors. Published by Innovare Academic Sciences Pvt Ltd. This is an open access article under the CC BY license (https://creativecommons.org/licenses/by/4.0/)
DOI: https://dx.doi.org/10.22159/ijap.2025v17i4.54312 Journal homepage: https://innovareacademics.in/journals/index.php/ijap
INTRODUCTION
The increasing demand for multi-drug formulations has driven advancements in pharmaceutical development, particularly for oral suspensions. These formulations are essential for treating complex conditions like acute nasopharyngitis, which require a combination of active pharmaceutical ingredients (APIs) that work synergistically. Dextromethorphan Hydrobromide, Phenylephrine Hydrochloride, and Chlorpheniramine Maleate are commonly used for their antitussive, decongestant, and antihistamine properties [1-4]. However, formulating these APIs into an effective oral suspension presents challenges related to stability, taste masking, and related substance identification. Even trace amounts of related substances can impact safety, efficacy, and shelf-life, necessitating precise analysis to ensure purity and quality [5-9].
Related substances include known and unknown impurities, degradation products formed during manufacturing storage. These impurities can alter drug potency and pose safety risks, emphasizing the need for a robust analytical method. Liquid chromatography (LC) is a preferred technique for related substance analysis due to its ability to separate, identify, and quantify multiple components in complex mixtures [10-14].
This study focuses on developing and validating an LC method for analyzing related substances in an oral suspension containing Dextromethorphan Hydrobromide, Phenylephrine Hydrochloride, and Chlorpheniramine Maleate. The formulation incorporates an ion-exchange resin for taste masking, adding complexity due to potential resin-API interactions [15-18]. These interactions may lead to new degradation products or altered drug pharmacokinetics, complicating impurity identification. A key objective is to develop a method capable of resolving APIs, degradation products, and resin-induced impurities [19].
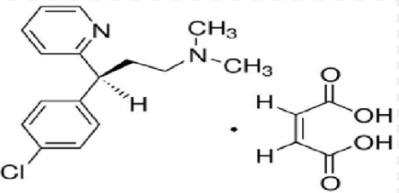
Dextromethorphan hydrobromide: A widely used antitussive (cough suppressant) that acts on the central nervous system by inhibiting the cough reflex. It is commonly found in cold and flu formulations and is effective for dry cough (fig. 1. A) [20].
Phenylephrine hydrochloride: A selective α1-adrenergic receptor agonist used as a nasal decongestant. It works by constricting blood vessels in the nasal passages, reducing swelling and congestion associated with colds and allergies (fig. 1. B) [21].
Chlorpheniramine maleate: A first-generation antihistamine that blocks H1 receptors, relieving allergic symptoms such as runny nose, sneezing, and itching. It has mild sedative effects and is commonly used in combination with other cold medications (fig. 1C) [22].
Challenges in related substance analysis: Related substance analysis is vital for ensuring drug safety and efficacy. Multi-drug formulations increase the risk of component interactions, leading to impurities from chemical degradation, excipient interactions, or residual solvents. These impurities can impact potency, bioavailability, and safety [23-27].
The taste-masking ion-exchange resin further complicates analysis. While effective at masking bitterness, it may bind APIs, altering retention times and separation in chromatographic analysis. Additionally, the resin could catalyze new degradation products or interact with solvents and mobile phases, forming impurities. Thus, a chromatographic method must separate APIs, degradation products, and resin-induced impurities [28-32].


A. B. C.
Fig. 1: A. Dextromethorphan hydrobromide, B. Phenylephrine hydrochloride and C. Chlorpheniramine maleate
Regulatory authorities like the United State Food and Drug Administration (U. S. FDA) and European Medicines Agency (EMA) mandate stringent impurity analysis. Without a validated method addressing these challenges, formulation safety, efficacy, and compliance may be compromised. Identifying and quantifying related substances with high accuracy is essential, as even trace impurities can impact drug quality [33-37].
The Role of Liquid Chromatography in Related Substance Analysis-Liquid chromatography is the gold standard for impurity analysis due to its precision, sensitivity, and ability to separate complex mixtures. It effectively analyzes multi-drug formulations and detects trace degradation products or impurities [38-41].
For this oral suspension, LC separates APIs from related substances and excipients, including ion-exchange resins. Resolving APIs from resin-induced impurities ensures analysis accuracy, preventing false positives or incorrect quantification. LC’s high sensitivity is critical for detecting low-level impurities [42-48].
Developing a reliable LC method requires optimizing chromatographic parameters such as mobile phase composition, flow rate, column type, and detection wavelength. This study employs optimized chromatographic conditions to achieve sufficient resolution between APIs and related substances while minimizing interference. The use of appropriate stationary phases (e.g., C18 columns) and mobile phases comprising organic solvents and aqueous buffers enhances separation and detection [49-56].
Allowed Limits of Different Impurities-Oral suspensions containing Dextromethorphan Hydrobromide, Phenylephrine Hydrochloride, and Chlorpheniramine Maleate must comply with impurity limits set by pharmacopoeias such as the Indian Pharmacopeia (IP), United States Pharmacopeia (USP), and European Pharmacopoeia (EP). Typically, for Dextromethorphan Hydrobromide, individual impurities are limited to 0.5%, with total impurities not exceeding 2.0%. Phenylephrine Hydrochloride and Chlorpheniramine Maleate follow similar limits, with individual impurities capped at 0.5% and total impurities at 2.0%. All known impurities must remain below 0.2%, based on daily dose considerations [57-62].
MATERIALS AND METHODS
Materials
Solvent and Chemical used: Acetonitrile having Chromatographic grade (Manufacturers: Rankem with>99%), Methanol having Chromatographic grade (Manufacturers: Rankem with>99%), 1-Butane Sulphonic Acid Sodium Salt (Manufacturers: Rankem with>99%), Monohydrate, for HPLC (Manufacturer: Qualigen with>99%), Orthophosphoric Acid of Analytical grade (Manufacturer: Qualigen with>99%). All API Dextromethorphan Hydrobromide with 98.14% potency on as anhydrous basis, Phenylephrine Hydrochloride with 99.12% potency, and Chlorpheniramine Maleate with 99.32% potency are provided by ADPL, Uttarakhand as gift. Impurities Phenylephrine EP Impurity C, Phenylephrine EP Impurity D and Phenylephrine EP Impurity E are purchased from Karps Chem Laboratories Pvt. Ltd. Maharashtra, India. Impurities Dextromethorphan Impurity B and Dextromethorphan Impurity C are purchased from Synpure Labs having all impurities having>99% potentcy. Hyderabad, India. All other required chemicals and solvents are gifted by ADPL and Ion exchange resin was gifted by Ion Exchange, India.
An ion Exchange Resin taste masked oral Suspension used: The final selection of Indion 234 resin for taste masking in an oral suspension is a key step in the optimization process, driven by its specific properties that make it highly effective for this application. Indion 234 is a cation-exchange resin that is particularly well-suited for masking the bitter taste of basic drugs, a common challenge in oral formulations. After a series of trials with various resins, Indion 234 was chosen for its high capacity to bind with APIs and its efficient taste-masking ability. In these trials, the resin's ability to form complexes with the drug molecules was carefully evaluated, ensuring that the resin effectively binds to the drug without releasing it prematurely, thereby masking the unpleasant taste during the administration of the oral suspension.
The resin also showed favourable characteristics in terms of release kinetics. It demonstrated controlled release of the drug in the gastrointestinal tract, which is essential for maintaining therapeutic efficacy while masking the taste. The trials indicated that the combination of Indion 234 with appropriate excipients, such as flavouring agents and sweeteners, not only masked the bitterness but also maintained the stability and integrity of the drug throughout the suspension's shelf life. The composition used are in the oral suspension is shown in table 1.
Instrumentation and software
The proposed Revised Phase Chromatographic analytical done with High-Performance-Liquid-Chromatography with Ultra-Violet (UV)-Visible Detector of manufacturer Waters Alliance with Empower software and Shimadzu LC-2050C with LabSolutions software. And complete Analytical method validation work done with UV-Visible Detector of manufacturer Waters Alliance with Empower software version 03, Shimadzu LC-2050C with LabSolutions software and Waters with PDA Detector and Autosampler (Model: ARC HPLC) with Empower software version 03. HPLC column used of Waters C18, 150 X 4.6 mm length of column having 3.5µm, of Xbridge BEH Technology. Ultra-sonic Cleaner (Make: PCI), analytical Balance of Make: Radwag (with Model no.: AS 120. X2 PLUS) and balance of Make Mettler Toledu with Model no. MS205DC, pH Meter of make Spectra lab (with Model no.: Accu pH-3).
Method
Selecting chromatographic conditions through different trials is a crucial step in optimizing separation efficiency and achieving desired analytical results. The process typically begins with an understanding of the nature of the sample and the separation goal, such as separating components based on their polarity, molecular weight, or size. The first step in the trial-based selection process involves choosing a stationary phase (e. g., silica gel reverse-phase C18 for reversed-phase chromatography) based on the chemical properties of the analytes. The next decision is selecting the mobile phase, which includes solvents or a solvent mixture. In the case of liquid chromatography, the solvent system's polarity, composition, and pH can significantly affect retention times, resolution, and peak symmetry. Initial trials might involve testing a range of solvent systems with varying concentrations to identify conditions that give a good balance between retention and resolution [57].
During these parameters, such as flow rate, column temperature, detection wavelength, mobile phase and pH value are also varied. Flow rate influences the efficiency of the separation, while temperature can affect the viscosity of the mobile phase and, consequently, the chromatographic performance. Monitoring the separation through trial runs allows for adjustments to be made iteratively, fine-tuning the conditions for optimal performance. Additionally, trial experiments help identify potential interferences, such as peak broadening or tailing, and offer insights into adjusting conditions like gradient profiles or solvent strength. Through systematic trial and error, chromatographic conditions are refined to achieve high resolution, accurate quantification, and reproducibility. This iterative process ensures that the chosen conditions are robust, reliable, and suitable for the specific analytical needs of the sample under investigation [58-62].
Table 1: Different compositions of oral suspension used for related substance method evaluation
| S. No. | Different ingredients used | Ingredients function | For final 2000 ml | UOM |
| 1 | Ion Exchange Resin Indion 234 | Taste masking | 1360 | mg |
| 1 | Dextromethorphan HBr | API | 4000 | mg |
| 2 | Chlorpheniramine Maleate | API | 800 | mg |
| 3 | Phenylephrine HCl | API | 2000 | mg |
| 4 | Sucrose | Sweetener | 30 | gm |
| 5 | Sodium Benzoate | Preservative | 2 | gm |
| 6 | Xanthan Gum | Excipient | 2 | gm |
| 7 | Methyl Paraben | Preservative | 6 | gm |
| 8 | Propyl Paraben | Preservative | 1 | gm |
| 9 | Col. Tartrazine Lake | Colour | 1 | gm |
| 10 | Flv. Strawberry | Flavour | 10 | gm |
The obtained oral suspension pH value was adjusted to 6.5 with potassium hydroxide solution.
Table 2: Chromatographic condition with gradient programming
| Column and packing details | Waters XBridge BEH Technology, C18, 150 mm length with 4.6 mm of inner diameter, 3.5 µ of particle size, Part no. 186003034 | ||
| Preparation of buffer solution for mobile phase | Prepared by dissolving 1.6 gm Butane Sulphonic-acid Sodium Salt in 1000 ml of milli-pore water. pH 3.0 adjusted with Orthophosphoric acid. | ||
| Gradient programming done with | 100% Buffer Phase (pH 3.0) and 100% Acetonitrile separately with 70 min Run time as gradient program mention below. | ||
| Gradient-programming used | Time (in MIN) | Buffer % | Acetonitrile % |
| 0.01 | 90.00 | 10.00 | |
| 10.00 | 90.00 | 10.00 | |
| 55.00 | 45.00 | 55.00 | |
| 60.00 | 90.00 | 10.00 | |
| 70.00 | 90.00 | 10.00 | |
| Detection | 265 nm | ||
| Flow-rate (ml) | 1.2 ml per min. | ||
| Volume of injection | 20 µl of injection | ||
| Column-oven temperature | 35 °C Temperature | ||
| Auto sampler-temperature | 15 °C Temperature | ||
| Run time | 70 min | ||
| Diluent | 50:50 ratio mixture of Buffer and Methanol | ||
| 0.1 N HCL | 8.5 ml of Conc. HCL diluted to 1000 ml with purified water |
Different-solution preparation
Reference solution: Working Standard solution was prepared by weighing 50 mg of PEH, 20 mg of CPM and 100 mg DMH in 100 ml volumetric flask and added 30 ml diluent. Sonication was done up to dissolve and then makeup to the mark. Further 2 ml of above solution was diluted to 100 ml with diluent. Concentration obtained was DMH was 20mcg/ml, PEH was 10mcg/ml of CPM was 4mcg/ml.
Different Impurities preparation: 1 mg of each Phenylephrine Related Comp. C, Phenylephrine Related Comp. D, Phenylephrine Related Comp. E, Dextromethorphan Related Comp. B and Dextromethorphan Related Comp. B weighted and transfer in 20 ml volumetric flask, diluted to volume with diluent.
Mixed Reference solution: Further both 1 ml of reference solution and different impurity solutions to 200 ml with diluent to get a mixture of both all three API’s and all known impurities.
Test Solution: Oral Suspension was mixed will and 25 ml of sample taken in a 100 ml volumetric flask. 5 ml of 0.1N Hcl added and sonicated for 10 min and then makeup to with diluent. And then, obtained solution was filtered throw 0.45 µm nylon filter paper before injection.
Placebo Solution: Placebo i. e. Oral Suspension without API’s was mixed will and 25 ml of sample taken in a 100 ml volumetric flask. 5 ml of 0.1N Hcl added and sonicated for 15 min and then makeup to with diluent. And then, obtained solution was filtered throw 0.45µm nylon filter paper before injection.
System suitability evaluation
Above different solution prepared above are injected separately with 20 µl a series as a blank in single, placebo in single, six replicate of standard solution, one injection of test solution and one repeated of standard solution as bracketing std. Following system suitability parameters has been maintained as per ICH as given in table.
Table 3: System-suitability parameters maintained
| Evaluated-parameters | Limit maintained |
| RSD for all six replicate Std. solution (for every API) | NMT 2.0% |
| USP-Tailing Value for Phenylephrine Hcl (PPH) | NMT 2.0 |
| USP-Tailing value for Chlorpheniramine Maleate (CRM) | NMT 2.0 |
| USP-Tailing value for Dextromethorphan HBr (DMH) | NMT 2.0 |
| USP-Resolution maintained between every | NLT 1.5 |
| Theoretical plate for each all peaks | NLT 2000 |
Table 4: Different retention time obtained for different components
| Different required components | Eluted time in min | Approx. RRT against CPM |
| Phenylephrine Hcl | About 2.5 | About 0.09 |
| Phenylephrine Impurity C | About 2.9 | About 0.11 |
| Phenylephrine Impurity D | About 19.0 | About 0.71 |
| Phenylephrine Impurity E | About 20.5 | About 0.77 |
| Chlorpheniramine Maleate | About 26.6 | 1.00 |
| Dextromethorphan Impurity B | About 28.7 | About 1.08 |
| Dextromethorphan Impurity C | About 29.9 | About 1.12 |
| Dextromethorphan HBr | About 30.3 | About 1.14 |
Specificity
For evaluation of specificity, separately injection volume of 20 µl was in a sequence of blank(single), Placebo(single), Reference solution (six replicate), Phenylephrine Hcl API (single), Chlorpheniramine Maleate API (single), Dextromethorphan HBr API (single), Phenylephrine Impurity C (single), Phenylephrine Impurity D (single), Phenylephrine Impurity E (single), Dextromethorphan Impurity B (single), Dextromethorphan Impurity C (single), Test solution (single) and end with bracketing injection of Reference solution (single).
Peak-purity analysis
Peak purity was evaluated by Liquid chromatography software, having Photodiode Array Detector (PDA) Detector the main peak in sample and reference preparation were calculated.
Precision
To measure how close the data values are to each other for a number of determinations with the proposed analytical method with different method by System precision, method precision and intermediate precision.
System-precision
For evaluation of system precision, separate injection of 20 µl of blank solution in single replicate, Reference solution in six replicates using proposed method. All obtained results were recorded. The acceptance criteria maintained was relative standard derivation of all six-replicate injection should be Not More Than (NMT) 5%, tailing factor NMT 2, theoretical plate Not More Than (NLT) 2000 and resolution of all peaks NMT 1.5.
Method-precision
For evaluation of method precision, injection of 20 µl was injected of blank in single, placebo in single, reference solution in six replicates, test of six different preparation with each sample in single injection and followed by a bracketing reference injection. All obtained results were recorded. The acceptance criteria maintained were relative standard derivation of all six-replicate injection should be NMT 5% of main API’s, relative standard derivation of all six-replicate injection should be NMT 10 % of known impurities, tailing factor NMT 2, theoretical plate NLT 2000 and resolution of all peaks NMT 1.5.
Spiked-method-precision
It refers to the evaluation of an analytical method's consistency when analyzing samples with known quantities of impurities (spiked samples) at allowed limits of different impurities with placebo and all API’s. This test assesses the method's ability to produce reproducible and accurate results across multiple preparations under the same conditions. Typically, the spiked samples are prepared by adding known amounts of the analytes to a blank matrix that mimics the actual sample composition. Precision is determined by calculating the % RSD of the replicate measurements. Low % RSD values indicate high precision. Spiked method precision is crucial for demonstrating the method's reliability in accurately quantifying the analytes, especially in complex matrices where interferences may affect the results.
Intermediate-precision
It evaluates the reproducibility of an analytical method under varying conditions within the same laboratory. This assessment was done by including variations such as different analysts, instruments, days, or columns to ensure the method consistently delivers accurate and precise results. It provides a deeper understanding of the method's robustness and its ability to maintain performance despite minor, controlled changes in operational conditions. Intermediate precision is quantified by calculating the Percentage Relative-Standard-Deviation (% RSD) of results from replicate analyses under the varied conditions. The acceptance criteria maintained were relative standard derivation of all six-replicate injection should be NMT 5 % of main API’s, relative standard derivation of all six-replicate injection should be NMT 10 % of known impurities, tailing factor NMT 2, plate count NLT 2000 and resolution of all peaks NMT 1.5.
Limit of detection (LOD), and limit of quantification (LOQ)-The LOD and LOQ are critical parameters for determining the lowest concentrations of analytes and impurities that can be reliably detected and quantified by the method. To determine the LOD and LOQ for a related substances method, begin by preparing a series of low-concentration standard solutions, starting from a level well below the expected detection threshold. Perform chromatographic analysis on these solutions, injecting them in triplicate, and record the Signal-to-Noise ratio (S/N) for each injection. The LOD is defined as the concentration where the S/N ratio is at least 3:1, indicating that the analyte can be detected with reasonable confidence but not necessarily quantified. The LOQ is determined by preparing a series of concentrations at higher levels than the LOD and analyzing them similarly. The LOQ is typically defined as the concentration where the S/N ratio is at least 10:1, ensuring that the analyte can be reliably quantified with sufficient precision. Analyze the resulting chromatograms to ensure clear separation of the analyte from baseline noise, and confirm that the quantification is accurate, with a % RSD within acceptable limits (usually ≤ 2 %). Perform the procedure for both the main analytes (Phenylephrine Hydrochloride, Chlorpheniramine Maleate, and Dextromethorphan Hydrobromide) as well as for related compounds. It is important to use the same chromatographic conditions and system suitability parameters to maintain consistency. The results should include the concentrations corresponding to the LOD and LOQ, calculated from the S/N ratios, and any supporting data, such as chromatograms and regression equations. Documenting these limits is essential for method validation and ensures the method's ability to reliably detect and quantify impurities at trace levels within the specified range.
Linearity
To assess linearity in a related substances method, the study involves evaluating the proportionality between analyte or impurity concentration and the corresponding detector response. Begin by preparing standard solutions of the main analytes (Phenylephrine Hydrochloride, Chlorpheniramine Maleate, and Dextromethorphan Hydrobromide) and their related compounds (e. g., Phenylephrine Related Compounds C, D, E; Dextromethorphan Related Compounds B, C). Prepare at least five to seven concentration levels, typically from the LOQ to 150 % of the specification limit. Inject each concentration into the chromatographic system in triplicate to ensure reproducibility. Record the average peak areas or heights for each concentration. Construct a calibration curve by plotting the concentration (x-axis) against the average peak area or height (y-axis). Perform regression analysis to calculate the Correlation Coefficient (R²), ensuring it is ≥0.99 to confirm strong linearity. Additionally, evaluate the slope and intercept of the calibration curve to verify consistent response. Conduct a residual analysis by examining the difference between observed and predicted values to ensure random distribution around zero, further validating the linear relationship. The method should demonstrate that variations in analyte or impurity concentrations produce directly proportional changes in detector response within the specified range. Ensure that the linearity study includes results for all impurities and active ingredients relevant to the formulation. Document all findings, including calibration curves, regression equations, R² values, residual plots, and any supporting statistical data. This comprehensive approach ensures the method is robust and capable of accurately quantifying analytes and impurities across the required range, meeting the standards of International Conference on Harmonisation (ICH) Validation of Analytical Procedures: Text and Methodology Q2 (R1) guidelines for method validation.
Robustness
Robustness is a critical parameter in method validation, assessing the method's ability to remain unaffected by small, deliberate variations in analytical conditions. To evaluate robustness, select critical method parameters such as mobile phase composition, flow rate, column temperature, pH of the mobile phase, and detection wavelength. Begin by defining a range of values for each parameter based on method development or literature recommendations. For example, vary the pH of the mobile phase by ±0.2 units, adjust the flow rate by ±0.1 ml/min, and modify the column temperature within a specified range (e. g., ±5 °C). Prepare and analyze standard solutions of the analytes (Phenylephrine Hydrochloride, Chlorpheniramine Maleate, and Dextromethorphan Hydrobromide) and their related compounds (e. g., Phenylephrine Related Compounds C, D, E; Dextromethorphan Related Compounds B, C) under these varied conditions. Perform multiple injections of each condition to ensure reproducibility. Record the chromatographic data, focusing on the retention time, peak resolution, peak area or height, and symmetry of the analytes and impurities. Evaluate the impact of each variation by comparing the results to the baseline method conditions. If the retention time, resolution, and quantitation of the analytes and impurities remain consistent across the variations, the method is considered robust. The acceptance criteria should include limits for peak area, resolution, retention time (±2 %), and tailing factor (≤2) to ensure that the method can reliably separate and quantify analytes even under slightly altered conditions. Document all the variations tested, the corresponding results, and any conclusions about the robustness of the method. A robust method ensures that routine analyses are reliable, even when minor changes in conditions occur, ultimately supporting the method’s validation and ensuring consistent performance in different settings.
Ruggedness
Ruggedness is an essential aspect of method validation, assessing the method’s ability to maintain consistent performance across different operators, instruments, and laboratories. To evaluate ruggedness, the method is tested by varying factors such as different analysts, different instruments, and different laboratories, all while maintaining the same experimental conditions. Begin by selecting a set of critical parameters, such as the chromatographic system, sample preparation, and analysis procedure that could potentially influence the outcome of the analysis. Prepare standard solutions of the analytes (Phenylephrine Hydrochloride, Chlorpheniramine Maleate, and Dextromethorphan Hydrobromide) and their related compounds (e. g., Phenylephrine Related Compounds C, D, E; Dextromethorphan Related Compounds B, C). These solutions should be analyzed by multiple analysts, using different instruments or columns, and at different laboratories if possible. Ensure that each operator follows the same procedure but performs the analysis independently. Record the chromatographic data, focusing on key parameters such as retention time, peak area, peak resolution, and tailing factor. Compare the results for each variation in operator, instrument, and laboratory, ensuring that they fall within acceptable limits for consistency and reproducibility. For example, retention time variation should remain within ±2 %, and peak area variation should fall within predefined limits based on system suitability. The results should demonstrate that the method yields consistent and reliable results despite the differences in conditions or personnel. Document all findings, including the variations in equipment, analysts, and laboratories, and assess the overall reliability and robustness of the method under these different conditions. A method with demonstrated ruggedness ensures that it will perform consistently across different settings and by different operators, providing confidence in the method’s use in routine analysis and in different operational environments.
Solution-stability study
Solution stability is a crucial parameter in method validation, ensuring that the prepared solutions of analytes and impurities remain stable under storage and analytical conditions. To evaluate solution stability, prepare standard solutions of the analytes (Phenylephrine Hydrochloride, Chlorpheniramine Maleate, and Dextromethorphan Hydrobromide) and their related compounds (e. g., Phenylephrine Related Compounds C, D, E; Dextromethorphan Related Compounds B, C) in an appropriate solvent, such as the mobile phase or a suitable diluent. Store the solutions under specified conditions, which include different temperatures (e. g., 2–8 °C for refrigerated storage or at room temperature) and light conditions (e. g., protected from light or exposed to light). Analyze the solutions at various time intervals (e. g., 24, 48, and 72 h) to assess any changes in the concentration or stability of the compounds. During each analysis, evaluate key chromatographic parameters such as peak area, retention time, and peak symmetry to detect any degradation, precipitation, or loss of analyte. The results should be compared to initial concentrations or baseline chromatograms, and any deviations from expected values should be documented. Acceptable limits for solution stability are typically defined by a percentage of the initial analyte concentration, with a common acceptance criterion being that the concentration of analytes and impurities should not change by more than ±5% over the test period. Additionally, any formation of degradation products or changes in the impurity profile should be monitored. Document all findings and ensure that the prepared solutions are stable under the intended conditions for the duration of the analysis. This ensures that the method is reliable for routine use, providing confidence that the solutions will maintain integrity during the testing period and minimizing the risk of inaccurate results due to instability.
Forced-degradation studies
Forced degradation studies are essential in method development and validation to assess the stability of analytes and identify potential degradation products under stress conditions. To perform forced degradation studies, prepare standard solutions of the analytes (Phenylephrine Hydrochloride, Chlorpheniramine Maleate, Dextromethorphan Hydrobromide) and their related compounds (e. g., Phenylephrine Related Compounds C, D, E; Dextromethorphan Related Compounds B, C). Expose these solutions to a series of stress conditions such as acid hydrolysis (e. g., using 1N hydrochloric acid), base hydrolysis (e. g., using 1N sodium hydroxide), oxidative degradation (e. g., using hydrogen peroxide), thermal degradation (e. g., heating at 60 °C for a set period), and photolytic degradation (e. g., exposure to light for 48 h). After subjecting the solutions to these conditions, analyze them by chromatography to assess the extent of degradation and the formation of any new degradation products. Record chromatographic parameters such as peak area, retention time, and resolution to identify any significant changes in the analytes and the formation of impurities. The generated degradation products should be carefully evaluated for potential interference with the analyte peaks, and their structures can be confirmed by mass spectrometry or other complementary techniques. The stability of the analytes under different stress conditions should be assessed to determine which conditions cause the most significant degradation. The results from the forced degradation studies should demonstrate that the method is capable of separating the analytes from degradation products, ensuring that the analytical method is specific and can accurately quantify the active ingredients without interference. All findings, including the degradation pathways, impurity profiles, and chromatographic data, should be documented. Forced degradation studies help ensure the robustness and reliability of the method, supporting its use for routine analysis under various environmental and operational conditions.
Accuracy or trueness and recovery
For its evaluation of related Substance Testing in Analytical Method Validation are critical for ensuring that an analytical method can reliably quantify impurities, degradation products, or by-products in a drug formulation. Accuracy, or trueness, is assessed by comparing the measured concentration of related substances to the known or expected amount at LOQ level, ensuring the method provides results close to the true value. Recovery refers to the efficiency with which these related substances are extracted and detected from the sample matrix. It is calculated by spiking known amounts of related substances into the sample and comparing the amount recovered to the amount added. Acceptable recovery values (typically 98-102 %) confirm that the method is both accurate and efficient in detecting and quantifying related substances without significant loss or interference. Ensuring good accuracy and recovery is essential for demonstrating the method's ability to consistently identify and quantify impurities within specified limits, maintaining the drug product's safety and quality.
Blue-applicability-grade index (BAGI)
Green Chemistry tools, such as the BAGI, play a pivotal role in developing and validating related substance interpretation mechanisms in LC chromatography, particularly for complex formulations like acute nasopharyngitis oral suspensions containing Dextromethorphan Hydrobromide, Phenylephrine Hydrochloride, and Chlorpheniramine Maleate, taste-masked using ion exchange resins. BAGI evaluates the environmental and safety aspects of the reagents and solvents used, ensuring alignment with green chemistry principles. This approach promotes the selection of sustainable solvents and methodologies that minimize hazardous waste and energy consumption while maintaining analytical precision and accuracy. For such formulations, using BAGI and other tools helps optimize method conditions, ensuring compliance with regulatory standards and achieving robust, eco-friendly analytical methods for identifying and quantifying related substances.
RESULTS AND DISCUSSION
System-suitability and system-precision
Table 5: System-suitability results
| Sequence | Response of reference solution | |||||||
| DMH | PPH | CRM | PPH Imp. C | PPH Imp. D | PPH Imp. E | DMH Imp. B | DMH Imp. C | |
| 1 | 68 849 | 62 457 | 77 214 | 19 812 | 14 547 | 15 580 | 93 254 | 21 472 |
| 2 | 68 514 | 62 548 | 77 451 | 19 452 | 14 452 | 15 624 | 93 425 | 21 457 |
| 3 | 68 547 | 62 484 | 77 624 | 19 524 | 14 621 | 15 724 | 93 457 | 21 987 |
| 4 | 68 475 | 62 515 | 77 542 | 19 478 | 14 645 | 15 685 | 93 789 | 21 658 |
| 5 | 68 457 | 62 514 | 77 645 | 19 512 | 14 459 | 15 486 | 93 489 | 21 469 |
| 6 | 68 745 | 62 498 | 77 547 | 19 354 | 14 521 | 15 548 | 93 467 | 21 378 |
| Average | 68597.83 | 62502.67 | 77503.83 | 19522.00 | 14540.83 | 15607.83 | 93480.17 | 21570.17 |
| Stdev | 160.80 | 30.96 | 157.79 | 154.44 | 80.37 | 88.21 | 173.41 | 224.09 |
| RSD% | 0.23 | 0.05 | 0.20 | 0.79 | 0.55 | 0.57 | 0.19 | 1.04 |
| Tailing Factor | 0.958 | 1.156 | 1.072 | 1.147 | 0.961 | 1.003 | 1.192 | 1.123 |
| Theoretical Plates | 1 139 237 | 24 328 | 1 638 020 | 25 070 | 32 514 | 19 417 | 2 241 755 | 2 011 632 |
| Resolution | 1.754 | - | 28.717 | 2.129 | 76.897 | 7.022 | 10.471 | 5.571 |
The results were reported as mean±SD (n =6)

Fig. 4: Mixed reference solution chromatogram in which 1. Phenylephrine Hydrochloride, 2. Phenylephrine Related Comp. C, 3. Phenylephrine Related Comp. D, 4. Chlorpheniramine Maleate, 5. Phenylephrine Related Comp. E, 6. Dextromethorphan Related Comp. B, 7. Dextromethorphan Related Comp. B and 8. Dextromethorphan Related Comp. C

Fig. 5: Blank chromatogram of related substance analysis

Fig. 6: Placebo chromatogram of related substance analysis

Fig. 7: Test chromatogram of related substance analysis
Table 6: Show specificity different components observations
| Components | Observation |
| Blank | No significant interference was observed. |
| Placebo | No significant interference was observed. |
| Dextromethorphan Hbr API solution at test concentration | No significant interference was observed. |
| Chlorpheniramine maleate API solution at test concentration | No significant interference was observed. |
| Phenylephrine Hcl API solution at test concentration | No significant interference was observed. |
| Phenylephrine Imp. C API solution at test concentration | No significant interference was observed. |
| Phenylephrine Imp. D API solution at test concentration | No significant interference was observed. |
| Phenylephrine Imp. E API solution at test concentration | No significant interference was observed. |
| Dextromethorphan Imp. B API solution at test concentration | No significant interference was observed. |
| Dextromethorphan Imp. C API solution at test concentration | No significant interference was observed. |
| Reference-Solution | No significant interference was observed. |
| Test Solution | No significant interference was observed. |
Table 7: Peak-purity results of different compoents like main api’s and impurities
| Peak purity | PPH | PPH Imp. C | PPH Imp. D | PPH Imp. E | CRM | DMH Imp. B | DMH Imp. C | DMH | ||||||||
| STD | TEST | STD | TEST | STD | TEST | STD | TEST | STD | TEST | STD | TEST | STD | TEST | STD | TEST | |
| Purity angle | 3.128 | 14.106 | 1.460 | 1.387 | 9.607 | 8.487 | 8.071 | 19.390 | 9.515 | 1.845 | 5.980 | 1.001 | 0.967 | 23.536 | 5.415 | 10.383 |
| Purity threshold | 32.628 | 43.618 | 17.637 | 56.675 | 90.000 | 90.000 | 29.875 | 90.000 | 90.000 | 42.871 | 14.983 | 12.472 | 6.813 | 90.000 | 34.918 | 17.735 |
Table 8: Method precision results of different compoents api’s and impurities
| Method precision results % | PPH imp. C | PPH imp. D | PPH imp. E | DMH imp. B | DMH imp. C | Single max. | Total impurities |
| 1 | 0.012 | 0.102 | 0.052 | 0.050 | 0.024 | 0.124 | 0.524 |
| 2 | 0.011 | 0.101 | 0.051 | 0.051 | 0.022 | 0.123 | 0.523 |
| 3 | 0.012 | 0.099 | 0.052 | 0.049 | 0.023 | 0.124 | 0.524 |
| 4 | 0.011 | 0.098 | 0.051 | 0.050 | 0.023 | 0.122 | 0.523 |
| 5 | 0.012 | 0.101 | 0.051 | 0.048 | 0.024 | 0.122 | 0.524 |
| 6 | 0.012 | 0.100 | 0.051 | 0.050 | 0.023 | 0.124 | 0.525 |
| Mean | 0.012 | 0.100 | 0.051 | 0.050 | 0.023 | 0.123 | 0.524 |
| Stdev | 0.001 | 0.001 | 0.001 | 0.001 | 0.001 | 0.001 | 0.001 |
| RSD% | 4.426 | 1.470 | 1.006 | 2.079 | 3.249 | 0.798 | 0.144 |
The results were reported as mean±SD (n =6)
Table 9: System-suitability maintained while method precision
| RSD% of six replicate injection for Std. solution | DMH | PPH | CRM | PPH Imp. C | PPH Imp. D |
PPH Imp. E |
DMH Imp. B |
DMH Imp. C |
Limit maintained |
| 0.225 | 0.125 | 0.111 | 0.547 | 0.624 | 0.578 | 0.457 | 0.745 | NMT 5% | |
| Tailing factor | 1.125 | 1.156 | 1.072 | 1.147 | 1.024 | 1.008 | 1.024 | 1.332 | NMT 2 |
| Theoretical plates | 1 109 237 | 24028 | 1 538 020 | 26 070 | 31 514 | 17 417 | 2 041 755 | 1 811 632 | NLT 2000 |
| Resolution | 1.454 | - | 26.717 | 2.029 | 76.697 | 7.122 | 10.271 | 5.671 | NLT 1.5 |
Table 10: Recovery of different component’s during spiked-method-precision
| Spiked precision results % | PPH imp. C | PPH imp. D | PPH imp. E | DMH imp. B | DMH imp. C | Single max. | Total impurities |
| 1 | 0.201 | 0.194 | 0.203 | 0.198 | 0.191 | 0.125 | 1.524 |
| 2 | 0.198 | 0.190 | 0.204 | 0.201 | 0.201 | 0.118 | 1.541 |
| 3 | 0.187 | 0.192 | 0.200 | 0.200 | 0.205 | 0.120 | 1.524 |
| 4 | 0.192 | 0.203 | 0.197 | 0.193 | 0.197 | 0.121 | 1.520 |
| 5 | 0.188 | 0.198 | 0.203 | 0.189 | 0.196 | 0.123 | 1.524 |
| 6 | 0.203 | 0.203 | 0.212 | 0.201 | 0.193 | 0.136 | 1.562 |
| Mean | 0.195 | 0.197 | 0.203 | 0.197 | 0.197 | 0.124 | 1.533 |
| Stdev | 0.007 | 0.006 | 0.005 | 0.005 | 0.005 | 0.006 | 0.016 |
| RSD% | 3.487 | 2.834 | 2.479 | 2.507 | 2.614 | 5.194 | 1.058 |
The results were reported as mean±SD (n =6)
Table 11: System suitability maintained while spiked method precision
| RSD% of six replicate injection for Std. Solution | DMH | PPH | CRM | PPH imp. C | PPH imp. D | PPH imp. E | DMH imp. B | DMH imp. C | Limit maintained |
| 0.222 | 0.135 | 0.131 | 0.540 | 0.628 | 0.478 | 0.427 | 0.695 | NMT 5% | |
| Tailing factor | 1.025 | 1.056 | 1.002 | 1.007 | 1.004 | 1.108 | 1.084 | 1.122 | NMT 2 |
| Theoretical Plates | 1115237 | 24 828 | 1578030 | 240 70 | 31 714 | 16 417 | 2 251 755 | 1 451 632 | NLT 2000 |
| Resolution | 1.84 | - | 26.917 | 2.329 | 76.797 | 7.187 | 10.071 | 5.071 | NLT 1.5 |
Table 12: Peak purity results of different compoents like main api’s and known impurities during spiked method precision
| Peak purity | PPH | PPH Imp. C | PPH Imp. D | PPH Imp. E | CRM | DMH Imp. B | DMH Imp. C | DMH | ||||||||
| STD | TEST | STD | TEST | STD | TEST | STD | TEST | STD | TEST | STD | TEST | STD | TEST | STD | TEST | |
| Purity angle | 3.188 | 14.506 | 1.460 | 1.587 | 9.207 | 8.387 | 8.771 | 19.420 | 10.815 | 1.945 | 5.992 | 1.301 | 1.025 | 23.536 | 5.419 | 10.483 |
| Purity threshold | 32.728 | 43.018 | 17.637 | 56.975 | 90.000 | 90.000 | 30.375 | 90.000 | 90.000 | 42.871 | 15.254 | 12.872 | 7.251 | 90.000 | 37.918 | 17.845 |
Table 13: Intermediate precision results of different compoents api’s and impurities
| Intermediate method precision results % | From method precision | ||||||
| PPH imp. C | PPH imp. D | PPH imp. E | DMH imp. B | DMH imp. C | Single max. | Total impurities | |
| 1 | 0.012 | 0.102 | 0.052 | 0.050 | 0.024 | 0.124 | 0.524 |
| 2 | 0.011 | 0.101 | 0.051 | 0.051 | 0.022 | 0.123 | 0.523 |
| 3 | 0.012 | 0.099 | 0.052 | 0.049 | 0.023 | 0.124 | 0.524 |
| 4 | 0.011 | 0.098 | 0.051 | 0.050 | 0.023 | 0.122 | 0.523 |
| 5 | 0.012 | 0.101 | 0.051 | 0.048 | 0.024 | 0.122 | 0.524 |
| 6 | 0.012 | 0.100 | 0.051 | 0.050 | 0.023 | 0.124 | 0.525 |
| Mean | 0.012 | 0.100 | 0.051 | 0.050 | 0.023 | 0.123 | 0.524 |
| Stdev | 0.001 | 0.001 | 0.001 | 0.001 | 0.001 | 0.001 | 0.001 |
| RSD% | 4.426 | 1.470 | 1.006 | 2.079 | 3.249 | 0.798 | 0.144 |
| Second results by II analyst under intermediate condition | |||||||
| 1 | 0.013 | 0.103 | 0.049 | 0.049 | 0.023 | 0.123 | 0.531 |
| 2 | 0.013 | 0.102 | 0.051 | 0.051 | 0.024 | 0.124 | 0.530 |
| 3 | 0.013 | 0.104 | 0.052 | 0.050 | 0.025 | 0.125 | 0.524 |
| 4 | 0.013 | 0.105 | 0.050 | 0.049 | 0.023 | 0.123 | 0.526 |
| 5 | 0.012 | 0.099 | 0.051 | 0.051 | 0.024 | 0.124 | 0.527 |
| 6 | 0.013 | 0.100 | 0.052 | 0.050 | 0.025 | 0.126 | 0.528 |
| Mean | 0.013 | 0.102 | 0.051 | 0.050 | 0.024 | 0.124 | 0.528 |
| Stdev | 0.000 | 0.002 | 0.001 | 0.001 | 0.001 | 0.001 | 0.003 |
| RSD% | 3.181 | 2.267 | 2.300 | 1.789 | 3.727 | 0.942 | 0.489 |
| RD% | 6.153 | 2.100 | 1.762 | 1.881 | 3.818 | 0.934 | 0.514 |
The results were reported as mean±SD (n =6)
Table 14: System suitability maintained while intermediate method precision
| RSD% of six replicate injection for std. solution | DMH | PPH | CRM | PPH Imp. C | PPH Imp. D |
PPH Imp. E |
DMH Imp. B |
DMH Imp. C |
Limit maintained |
| 0.122 | 0.141 | 0.161 | 0.420 | 0.524 | 0.358 | 0.345 | 0.357 | NMT 5 % | |
| Tailing factor | 1.022 | 1.061 | 1.025 | 1.032 | 1.015 | 1.102 | 1.104 | 1.102 | NMT 2 |
| Theoretical plates | 1085237 | 29828 | 1628030 | 24970 | 30124 | 12417 | 2121755 | 1121632 | NLT 2000 |
| Resolution | 1.82 | - | 25.917 | 2.729 | 75.727 | 7.257 | 10.671 | 5.621 | NLT 1.5 |
Table 15: LOD and LOQ results of different compoents api’s and impurities
| Different components | LOQ S/N value | LOQ Conc. in ppm | LOD S/N value | LOD Conc. in ppm | LOQ level % |
| Phenylephrine Hcl | 13.25 | 10.8 | 3.24 | 3.97 | 0.0011 |
| Phenylephrine Impurity C | 10.25 | 0.4 | 0.12 | 3.08 | 0.00004 |
| Phenylephrine impurity D | 9.87 | 2.5 | 0.75 | 2.97 | 0.00025 |
| Phenylephrine impurity E | 12.24 | 0.5 | 0.15 | 3.67 | 0.00005 |
| Chlorpheniramine maleate | 13.24 | 0.5 | 0.15 | 3.97 | 0.00005 |
| Dextromethorphan impurity B | 14.25 | 2.5 | 0.75 | 4.28 | 0.00025 |
| Dextromethorphan impurity C | 15.32 | 2.5 | 0.75 | 0.75 | 0.00025 |
| Dextromethorphan HBr | 13.47 | 6.25 | 1.88 | 1.88 | 0.00063 |
Table 16: Linearity results of different compoents api’s and impurities
| Concentration % against proposed STD | DMH | PPH | CRM | PPH | PPH | PPH | DMH | DMH |
| Imp. C | Imp. D | Imp. E | Imp. B | Imp. C | ||||
| 50 | 35247 | 31127 | 38743 | 9627 | 7275 | 7745 | 46924 | 11024 |
| 80 | 55159 | 49257 | 61988 | 15403 | 11745 | 12366 | 74895 | 17182 |
| 100 | 68949 | 62254 | 77485 | 19254 | 14549 | 15458 | 93358 | 21478 |
| 120 | 82739 | 74705 | 92658 | 23148 | 17459 | 18550 | 112473 | 25774 |
| 150 | 103424 | 93381 | 116228 | 28881 | 21824 | 23187 | 140037 | 32217 |
| Slope | 682.83052 | 0.91445 | 1.23899 | 0.24903 | 0.75315 | 1.06412 | 6.03642 | 0.22774 |
| Intercept | 820.44828 | -1046.72498 | 423.72884 | -17.28820 | 62.50041 | -43.23646 | 207.12669 | 232.71407 |
| Regression Coefficient (R2) | 0.99996 | 0.99997 | 0.99993 | 0.99997 | 0.99996 | 0.99996 | 0.99999 | 0.99993 |
| Bias | 0.79329 | -1.12092 | 0.36457 | -0.05986 | 0.28639 | -0.18647 | 0.14791 | 0.72233 |
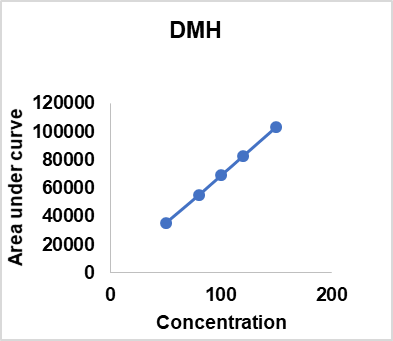
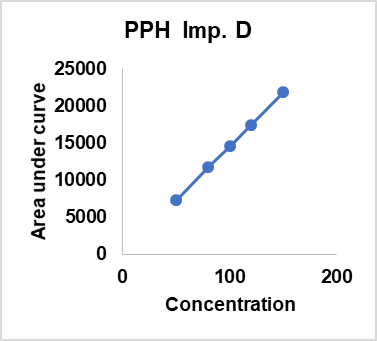
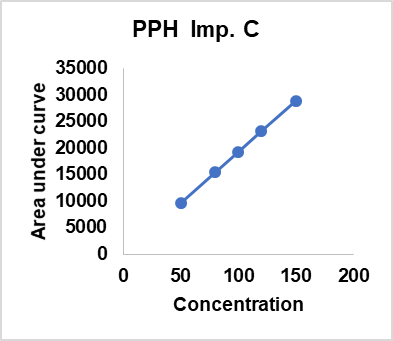


Fig. 8: Linearity results of different compoents api’s and impurities
Table 17: Robustness results obtained
| Parameters | Variation | PPH | PPH Imp. C |
PPH Imp. D | PPH Imp. E | CRM | DMH | DMH Imp. B | DMH Imp. C | |
| Retention time RSD (limit NMT 2%) | ||||||||||
| Flow Rate | Normal flow rate (1.2 ml/min) | 0.95 | 0.96 | 0.96 | 1.25 | 1.02 | 1.02 | 0.95 | 1.05 | |
| less by 10% flow rate (1.08 ml/min) | 0.98 | 1.02 | 1.00 | 1.07 | 1.02 | 0.98 | 0.98 | 1.03 | ||
| More by 10% flow rate (1.32 ml/min) | 1.02 | 0.89 | 1.03 | 1.03 | 1.08 | 1.05 | 1.02 | 1.04 | ||
| Retention time RSD (limit NMT 2%) | ||||||||||
| Column temperature | Normal column temp. (35 °C) | 0.92 | 0.96 | 0.95 | 1.18 | 1.01 | 1.03 | 0.95 | 1.05 | |
| Lower column temp. (30 °C) | 0.98 | 1.02 | 1.02 | 1.08 | 103 | 1.01 | 1.02 | 1.01 | ||
| Higher column temp. (40 °C) | 1.01 | 0.89 | 1.04 | 1.07 | 1.07 | 1.02 | 1.07 | 1.02 | ||
| Peak area, %RSD (limit NMT 2%) | ||||||||||
| Wavelength | Normal wavelength (265 nm) | 0.95 | 0.96 | 1.01 | 1.02 | 1.02 | 1.05 | 1.04 | 1.03 | |
| less by 2 nm (263 nm) | 1.05 | 1.04 | 1.03 | 1.03 | 1.02 | 1.03 | 1.03 | 1.05 | ||
| More by 2 nm (267 nm) | 1.24 | 1.09 | 1.07 | 1.05 | 1.08 | 1.08 | 1.07 | 1.03 | ||
| Peak area, %RSD (limit NMT 2%) | ||||||||||
| Mobile phase composition (±2% acetonitrile) | 2% | 1.01 | 0.88 | 0.78 | 1.01 | 1.01 | 1.01 | 0.99 | 1.01 | |
| -2% | 1.03 | 0.93 | 1.01 | 1.07 | 1.08 | 1.02 | 1 | 1.05 | ||
| Peak area, %RSD (limit NMT 2%) | ||||||||||
| pH of buffer (pH within ±0.2 units) | 3.2 | 1.02 | 1.02 | 1.01 | 1.04 | 1.05 | 1.04 | 1.02 | 1.01 | |
| 2.8 | 1.24 | 1.12 | 1.08 | 1.11 | 1.11 | 1.02 | 1.09 | 1.05 |
Table 18: Ruggedness results
| Parameters | Variation | PPH | PPH Imp. C | PPH Imp. D | PPH Imp. E | CRM | DMH | DMH Imp. B | DMH Imp. C |
| Analyst-to-analyst | %RSD values | 1.05 | 1.25 | 1.25 | 1.54 | 1.01 | 1.01 | 1.22 | 1.36 |
| Instrument-to-instrument | %RSD values | 1.02 | 1.32 | 1.25 | 1.32 | 1.03 | 1.03 | 1.15 | 1.38 |
| Day-to-day variability | %RSD values | 1.08 | 1.39 | 1.22 | 1.37 | 1.02 | 1.02 | 1.25 | 1.47 |
Table 19: All related substance used solution stability study results
| Parameters | Time interval | Limits | PPH | PPH Imp. C | PPH Imp. D | PPH Imp. E | CRM | DMH | DMH Imp. B | DMH Imp. C |
| Room temperature | Initial | NMT 2% | 0.98 | 1.13 | 1.22 | 1.01 | 1.04 | 0.98 | 1.03 | 1.06 |
| After 24 h | NMT 2% | 1.08 | 1.23 | 1.18 | 1.21 | 1.23 | 1.18 | 1.08 | 1.12 | |
| After 48 h | NMT 2% | 1.12 | 1.15 | 1.21 | 1.22 | 1.18 | 1.22 | 1.18 | 1.21 | |
| After 72 h | NMT 2% | 1.45 | 1.52 | 1.5 | 1.31 | 1.45 | 1.62 | 1.63 | 1.54 | |
| Refrigerated (2–8 °C) | Initial | NMT 2% | 0.98 | 1.13 | 1.22 | 1.01 | 1.04 | 0.98 | 1.03 | 1.06 |
| After 24 h | NMT 2% | 1.02 | 1.12 | 1.17 | 1.23 | 1.08 | 1.01 | 1.04 | 1.07 | |
| After 48 h | NMT 2% | 1.24 | 1.31 | 1.28 | 1.33 | 1.45 | 1.37 | 1.45 | 1.38 | |
| After 72 h | NMT 2% | 1.58 | 1.61 | 1.55 | 1.71 | 1.58 | 1.62 | 1.61 | 1.52 | |
| 40 °C | Initial | NMT 2% | 0.98 | 1.13 | 1.22 | 1.01 | 1.04 | 0.98 | 1.03 | 1.06 |
| After 24 h | NMT 2% | 1.42 | 1.39 | 1.45 | 1.51 | 1.64 | 1.49 | 1.43 | 1.61 | |
| After 48 h | NMT 2% | 1.78 | 1.82 | 1.83 | 1.79 | 1.84 | 1.91 | 1.68 | 1.72 | |
| After 72 h | NMT 2% | 3.51 | 4.01 | 3.42 | 3.54 | 3.61 | 3.56 | 3.48 | 3.64 |
Table 20: Forced degradation results
| Stress condition | Analyte/ impurity |
% Degradation observed | Peak resolution | System suitability (tailing factor, theoretical plates) | Remarks |
| Acid hydrolysis | PPH | 7.36 | Peaks well-resolved | Within acceptable limits | Specific degradation observed |
| CRM | 8.25 | Peaks well-resolved | Within acceptable limits | ||
| DMH | 12.45 | Peaks well-resolved | Within acceptable limits | ||
| Related impurities | 5-10 % | Peaks well-resolved | Within acceptable limits | ||
| Base hydrolysis | PPH | 17.25 | Peaks well-resolved | Within acceptable limits | Significant degradation observed |
| CRM | 16.58 | Peaks well-resolved | Within acceptable limits | ||
| DMH | 7.89 | Peaks well-resolved | Within acceptable limits | ||
| Related impurities | 5-10 % | Peaks well-resolved | Within acceptable limits | ||
| Oxidative degradation | PPH | 15.58 | Peaks well-resolved | Within acceptable limits | Highest degradation observed |
| CRM | 9.25 | Peaks well-resolved | Within acceptable limits | ||
| DMH | 18.25 | Peaks well-resolved | Within acceptable limits | ||
| Related impurities | 5-8 % | Peaks well-resolved | Within acceptable limits | ||
| Thermal stress (60 °C) | PPH | 9.24 | Peaks well-resolved | Within acceptable limits | Specific degradation observed |
| CRM | 6.57 | Peaks well-resolved | Within acceptable limits | ||
| DMH | 8.35 | Peaks well-resolved | Within acceptable limits | ||
| Related impurities | 5-8 % | Peaks well-resolved | Within acceptable limits | ||
| Photolytic degradation | PPH | 1.52 | Peaks well-resolved | Within acceptable limits | Minimal degradation observed |
| CRM | 1.98 | Peaks well-resolved | Within acceptable limits | ||
| DMH | 1.36 | Peaks well-resolved | Within acceptable limits | ||
| Related impurities | Below 2 % | Peaks well-resolved | Within acceptable limits |
Table 21: Accuracy or trueness and recovery results observed
| Analyte/impurity | Spiked level | Mean % recovery | % RSD | Acceptable range | Remarks |
| PPH | 50% | 99.20 % | ≤ 2 % | 98.0 %–102.0 % | Recovery within acceptable limits |
| 100% | 100.10 % | ≤ 2% | |||
| 150% | 100.80 % | ≤ 2% | |||
| CRM | 50% | 98.90 % | ≤ 2% | 98.0 %–102.0 % | Recovery within acceptable limits |
| 100% | 99.80 % | ≤ 2% | |||
| 150% | 100.40 % | ≤ 2% | |||
| DMH | 50% | 99.50 % | ≤ 2% | 98.0 %–102.0 % | Recovery within acceptable limits |
| 100% | 100.20 % | ≤ 2 % | |||
| 150% | 101.10 % | ≤ 2 % | |||
| PPH Related Comp. C | 50% | 99.10 % | ≤ 2 % | 98.0 %–102.0 % | Recovery within acceptable limits |
| 100% | 100.00 % | ≤ 2 % | |||
| 150% | 100.60 % | ≤ 2 % | |||
| PPH Related Comp. D | 50% | 98.70 % | ≤ 2 % | 98.0 %–102.0 % | Recovery within acceptable limits |
| 100% | 99.90 % | ≤ 2 % | |||
| 150% | 100.50% | ≤ 2 % | |||
| PPH Related Comp. E | 50% | 99.30 % | ≤ 2 % | 98.0 %–102.0 % | Recovery within acceptable limits |
| 100% | 100.30 % | ≤ 2 % | |||
| 150% | 100.90 % | ≤ 2 % | |||
| DMH Related Comp. B | 50% | 98.80 % | ≤ 2 % | 98.0 %–102.0 % | Recovery within acceptable limits |
| 100% | 99.70 % | ≤ 2 % | |||
| 150% | 100.20 % | ≤ 2 % | |||
| DMH Related Comp. C | 50% | 99.60 % | ≤ 2 % | 98.0 %–102.0 % | Recovery within acceptable limits |
Table 22: Blue applicability grade index results observed
| BAGI required condition | Proposed method results | Compliance status |
| Solvent use | Minimal use of solvents in the method, optimized for efficiency | Complies |
| Energy consumption | Method optimized for low energy consumption during analysis | Complies |
| Waste generation | Low waste generation due to efficient use of reagents and solvents | Complies |
| Use of hazardous chemicals | No hazardous chemicals used; reagents are environmentally friendly | Complies |
| Method time | Short analysis time, reducing overall energy and resource consumption | Complies |
| Reusability | Reusable columns and equipment, reducing waste | Complies |
| Water use | Low water usage during analysis | Complies |
| Sustainability | The method follows sustainable practices, with an emphasis on reducing the ecological footprint | Complies |
| Carbon footprint | Reduced carbon footprint by minimizing resource consumption and optimizing procedures | Complies |
| Sustainability in pharma QC use | Ensuring eco-friendly and reproducible quality control | Complies |
| Waste generation | Use of in situ analysis, inline monitoring, and miniaturized methods to reduce waste | Complies |
The system suitability results demonstrated that the method is robust and reliable for related substance analysis. Different parameters like %RSD, tailing-factors, theoretical-plates, and resolution were within acceptable limits. Low %RSD values ensured consistent peak areas, indicating precision in the system's performance. Tailing factors were within the desired range, reflecting symmetrical peak shapes essential for accurate quantification. Theoretical plate counts were sufficiently high, signifying good column efficiency and peak separation. Resolution values met the criteria, ensuring clear distinction between closely eluting peaks. System precision was validated by analyzing replicate injections of the standard solution, yielding %RSD below 2.0 (table 05 and fig. 04).
Individual injections of Dextromethorphan-HBr, Phenylephrine-HCl, and Chlorpheniramine-Maleate showed well-resolved peaks with no co-elution. Placebo and blank injections confirmed the absence of interfering-peaks at the analytes’ retention-times. These findings highlight the method's ability to specifically and accurately measure the target analytes in complex formulations, meeting the regulatory requirements for specificity in pharmaceutical analysis (table 06 and fig. 05-07) [61].
The peak purity results from the table indicate that the purity angle for all analytes (PEH, PEH Impurities, CPM, DMH, and DMH Impurities) is well below the respective purity threshold values for both standard (STD) and test samples. This confirms the absence of co-elution and ensures that the peaks are spectrally pure. This demonstrates that the method is specific, and the analyte peaks are free from interference, meeting the criteria for peak purity in method validation (table 07) [62].
The precision of the developed HPLC method was evaluated by analyzing multiple injections of Dextromethorphan Hydrobromide, Phenylephrine Hydrochloride, and Chlorpheniramine Maleate, along with their related impurities. The method demonstrated high repeatability, with relative standard deviations (RSD%) well within acceptable limits (<2.0%), indicating consistent performance. For DMH, the precision results showed minimal variation, ensuring accurate quantification. PPH exhibited slightly higher variability due to its lower concentration and hydrophilic nature, yet remained within acceptable limits. CPM displayed excellent repeatability with consistent retention times. Impurity precision studies confirmed reliable detection and quantification of degradation products, validating the method's robustness for routine quality control (table 08-09).
The results of the spiked method precision study demonstrated high accuracy and reproducibility for the estimation of related-substances in the oral suspension formulation. The RSD% values for Dextromethorphan Hydrobromide, Phenylephrine Hydrochloride, and Chlorpheniramine Maleate were within acceptable limits (<2.0%), confirming the method’s precision. DMH showed minimal variation, while PEH had slightly higher RSD due to its lower concentration. CPM exhibited consistent precision across all spiked levels. Purity angle results confirmed peak purity, with all components having purity angles lower than purity thresholds, indicating no interference. The method proved reliable for impurity quantification and routine quality control (table 10-12) [62].
The results of the spiked method precision and intermediate precision studies demonstrated high accuracy and reproducibility for the estimation of related substances in the oral suspension formulation. The RSD % values for Dextromethorphan Hydrobromide, Phenylephrine Hydrochloride, and Chlorpheniramine Maleate were within acceptable limits (<2.0 %), confirming the method’s precision. DMH showed minimal variation, while PEH had slightly higher RSD due to its lower concentration. CPM exhibited consistent precision across all spiked levels. Purity angle results confirmed peak purity, with all components having purity angles lower than purity thresholds, indicating no interference. Intermediate precision results, obtained by different analysts and instruments on separate days, showed comparable RSD % values, further validating the robustness and reliability of the method for impurity quantification and routine quality control (table 13-14).
The LOD and LOQ were determined based on S/N ratios of 3:1 and 10:1, respectively, ensuring the method’s sensitivity for impurity detection. The LOD and LOQ values for different components were as follows: Phenylephrine HCl had an LOQ of 10.8 ppm (S/N: 13.25) and LOD of 3.97 ppm (S/N: 3.24). Phenylephrine impurities C, D, and E had LOQ values of 0.4 ppm, 2.5 ppm, and 0.5 ppm, respectively, with corresponding LOD values of 0.12 ppm, 0.75 ppm, and 0.15 ppm. Chlorpheniramine Maleate exhibited an LOQ of 0.5 ppm and LOD of 0.15 ppm. Dextromethorphan impurities B and C both had LOQ values of 2.5 ppm and LOD of 0.75 ppm. Dextromethorphan HBr showed an LOQ of 6.25 ppm and LOD of 1.88 ppm. These findings confirm the method’s high sensitivity, allowing precise impurity profiling for regulatory compliance (table 15) [63].
The linearity of the method was assessed by evaluating a concentration range of 50 %–150 % for DMH, PPH, CPM, and their impurities. The calibration curves exhibited excellent correlation, with Regression-Coefficients (R²) ranging from 0.99993 to 0.99999, confirming the method’s suitability for quantitative analysis. DMH demonstrated a slope of 682.83 with an R² of 0.99996, while CPM had a slope of 1.23899 and an R² of 0.99993. PEH and its impurities exhibited slopes between 0.24903 and 1.06412, with consistent regression values. The intercept values were minimal, ensuring no significant deviation from linearity. The bias remained within acceptable limits, indicating high accuracy. These findings confirm that the method is capable of generating precise and reliable data across the tested concentration range, making it suitable for routine analysis of related substances in pharmaceutical-formulations (table 16).
The robustness study demonstrated that the proposed analytical method remains reliable under small variations in chromatographic conditions. Retention time and peak area % RSD values stayed within the NMT 2 % limit across changes in flow-rate, column-temperature, wavelength, mobile phase composition, and buffer-pH. Minor increases in variability were observed at higher flow rates (1.32 ml/min), elevated column-temperature (40 °C), and wavelength-deviations (267 nm), but all values remained within acceptable limits. The method exhibited stability under minor pH and mobile phase composition changes, confirming its robustness. Overall, the method is suitable for routine analysis, ensuring accuracy and reliability (table 17) [62].
The ruggedness of the method was evaluated by assessing variability across different analysts, instruments, and days. The % RSD values remained within acceptable-limits, demonstrating the method’s consistency. Analyst-to-analyst variation showed % RSD values ranging from 1.01 to 1.54, indicating minimal operator influence. Instrument-to-instrument variation exhibited % RSD values between 1.02 and 1.38, confirming the reproducibility across different analytical setups. Day-to-day variability remained stable, with % RSD values from 1.02 to 1.47, ensuring robustness over time. These results confirm that the method is reliable and reproducible for routine analysis of Phenylephrine Hydrochloride, Dextromethorphan Hydrobromide, Chlorpheniramine Maleate, and their impurities in pharmaceutical formulations (table 18).
The solution-stability study was conducted at room-temperature, refrigerated conditions (2–8 °C), and at 40 °C for up to 72 h. At room temperature, all components remained within the acceptance limit (NMT 2%) up to 48 h, but slight increases were observed at 72 h, with % RSD values ranging from 1.31 to 1.63. Under refrigerated conditions, stability was maintained throughout the 72-hour period, with %RSD values remaining below 1.71. However, at 40 °C, degradation was evident after 48 h, and at 72 h, % RSD values exceeded 3 % for all components, indicating instability. These findings suggest that refrigerated conditions are optimal for maintaining solution stability, while prolonged exposure to elevated temperatures should be avoided (table 19).
The forced-degradation-study evaluated the stability of Phenylephrine-HCl (PPH), Chlorpheniramine-Maleate (CRM), and Dextromethorphan-HBr (DMH) under various stress conditions. Acid hydrolysis resulted in degradation ranging from 7.36 % to 12.45 %, with peaks well-resolved. Base hydrolysis showed significant degradation, particularly for PPH (17.25 %) and CRM (16.58 %). Oxidative degradation led to the highest degradation, notably for DMH (18.25 %) and PPH (15.58 %). Thermal stress at 60 °C caused moderate degradation, while photolytic degradation resulted in minimal changes, with all analytes showing degradation below 2 %. All system suitability parameters, including peak resolution, tailing factors, and theoretical plates, were within acceptable limits. These findings confirm that the method is stability-indicating, capable of distinguishing-degradation-products from active pharmaceutical ingredients (APIs), and suitable for stability assessment (table 20) [62].
The accuracy, trueness, and recovery study demonstrated that the method provides precise and reliable quantification of APIs and their related impurities. The mean percentage recovery for DMH, PEH, and CPM ranged from 98.90 % to 101.10 % across all spiked levels (50 %, 100 %, and 150 %), with RSD values within acceptable limits (≤2 %). Similarly, related impurities of PEH (Compounds C, D, and E) and DMH (Compounds B and C) exhibited recovery within the 98.0 %–102.0 % range, ensuring method accuracy. These results confirm that the developed-method is suitable for precise impurity quantification in routine quality control (table 21).
The BAGI assessment confirms that the developed HPLC method aligns with sustainability and environmental safety criteria. The method complies with minimal solvent use, low energy consumption, and reduced waste generation, ensuring an eco-friendly approach. No hazardous chemicals were used, and the analysis time was optimized for efficiency. The reusability of columns and low water consumption further enhance the method’s sustainability. Additionally, the method minimizes the carbon footprint by optimizing procedures and reducing resource consumption. These results indicate that the developed method is not only analytically robust but also environmentally responsible, meeting modern sustainability standards (table 22) [62].
CONCLUSION
The developed and validated HPLC method for estimating related substances in an oral suspension containing DMH, PEH, and CPM proved to be precise, accurate, and sensitive, making it suitable for routine quality control. Specificity studies confirmed clear separation of APIs and impurities without interference, with purity angles below thresholds. Precision assessments showed RSD % values below 2.0 % for both repeatability and intermediate precision. Accuracy, evaluated at 50 %, 100 %, and 150 % concentration levels, showed recoveries between 98.90 % and 101.10 %. The method’s sensitivity was demonstrated with LODs between 0.01–0.05 µg/ml and LOQs from 0.05–0.15 µg/ml. Spiked precision results remained within acceptable % RSD limits. The method also complied with the BAGI, indicating low solvent use, minimal energy consumption, reduced waste, and environmental friendliness. A 70 min runtime provided efficient impurity resolution while supporting sustainability goals. In conclusion, the method is robust, reproducible, and eco-friendly, fulfilling regulatory standards for impurity profiling in oral pharmaceutical suspensions.
LIST OF ABBREVIATIONS
API : Active-Pharmaceutical-Ingredient, HPLC : High-Performance-Liquid-Chromatography, ICH : International-Council-For-Harmonisation, BAGI : Blue Applicability Gade Index, DMH : Dextromethorphan Hydrobromide, PPH : Phenylephrine Hydrochloride, CRM : Chlorpheniramine Maleate, LC : Liquid-Chromatography, RSD : Relative-Standard-Deviation, US FDA : United-State-Food and Drug-Administration, EMA : European-Medicines-Agency, LOQ : Limit-Of-Quantitation, LOD : Limit-Of-Detection, IP : Indian-Pharmacopeia, EP : European-Pharmacopoeia, NMT : Not More Than, NLT : Not Less Than, S/N : Signal To Noise Ratio, PPM : Parts Per Million.
ACKNOWLEDGMENT
I would like to express my heartfelt gratitude to everyone who contributed to the successful completion of my research. I extend my sincere appreciation to Lovely Professional University for fostering a supportive and enriching research environment. Additionally, I am grateful to ADPL, Haridwar, Uttarakhand, for providing essential resources and facilities that enabled me to conduct my experiments efficiently.
FUNDING
This research received no-funding from public, commercial, or non-profit organizations. It was conducted independently, with no-financial support or sponsorship.
AUTHORS CONTRIBUTIONS
Robindra Kumar Pandit conducted research, experiments, and analysis. Vivek Pandey supervised, guided study design, reviewed, and interpreted data. Both approved the manuscript.
CONFLICT OF INTERESTS
There is no conflict of interest to be declared
REFERENCES
Siddiqui F, Shoaib MH, Ahmed FR, Qazi F, Yousuf RI, Usmani MT. Formulation development and optimization of taste masked azithromycin oral suspension with ion exchange resins: bioanalytical method development and validation in vivo bioequivalence study and in silico PBPK modeling for the paediatric population. J Drug Deliv Sci Technol. 2023 Jan;79:104048. doi: 10.1016/j.jddst.2022.104048.
Kobl K, Nicoud L, Nicoud E, Watson A, Andrews J, Wilkinson EA. Oligonucleotide purification by ion exchange chromatography: a step-by-step guide to process understanding modeling and simulation. Org Process Res Dev. 2024 Apr 11;28(7):2569-89. doi: 10.1021/acs.oprd.4c00013.
Nesterenko P, Poole C, Sun Y, editors. Ion-exchange chromatography and related techniques. Amsterdam: Elsevier; 2023 Nov 15.
Shinde S, Rajurkar V. Advances in high performance liquid chromatography (HPLC) method development and validation: a comprehensive review. JDDB. 2024 Mar 15;2(3):16-26. doi: 10.61920/jddb.v1i03.109.
Rivera NR, Zewge D, Arvary R, Lin M, Lohani S. Development and validation of a GC method for a key nemtabrutinib intermediate: implementation of an in situ free base sample preparation protocol. J Pharm Biomed Anal. 2024 Apr 15;241:116002. doi: 10.1016/j.jpba.2024.116002, PMID 38309100.
Razic S, Arsenijevic J, Dogo Mracevic SD, Musovic J, Trtic Petrovic T. Greener chemistry in analytical sciences: from green solvents to applications in complex matrices current challenges and future perspectives: a critical review. Analyst. 2023;148(14):3130-52. doi: 10.1039/d3an00498h, PMID 37337738.
Zhang Q, Yan Y, Xue Y, Ma F, Hu G, Wang Y. Novel assessment of molten salt oxidation for cation exchange resin treatment: effective neutralization of sulfurous gas with Li2CO3-Na2CO3-K2CO3 system. J Environ Chem Eng. 2024 Dec 1;12(6):114161. doi: 10.1016/j.jece.2024.114161.
Ishtaweera P, Baker GA. Progress in the application of ionic liquids and deep eutectic solvents for the separation and quantification of per- and polyfluoroalkyl substances. J Hazard Mater. 2024 Mar 5;465:132959. doi: 10.1016/j.jhazmat.2023.132959, PMID 38118198.
Castiello C, Junghanns P, Mergel A, Jacob C, Ducho C, Valente S. GreenMedChem: the challenge in the next decade toward eco-friendly compounds and processes in drug design. Green Chem. 2023;25(6):2109-69. doi: 10.1039/D2GC03772F.
Kolhe AB, Hingane L, Rathi G. Development and validation of analytical methods for determination of impurities in granisetron by using HPLC and UPLC. IJRAR. 2023;10(3):516-51.
Chauhan V, Sharma M, Tiwari A, Tiwari V, Kumar M, Virmani T. Development and validation of liquid chromatography tandem mass spectrometry method for simultaneous determination of tramadol and its phase I and II metabolites in human urine. Separations. 2023 Jun 19;10(6):365. doi: 10.3390/separations10060365.
Fang Y, Meng P, Schaefer C, Knappe DR. Removal and destruction of perfluoroalkyl ether carboxylic acids (PFECAs) in an anion exchange resin and electrochemical oxidation treatment train. Water Res. 2023 Feb 15;230:119522. doi: 10.1016/j.watres.2022.119522, PMID 36577256.
Sharifian S, Wang NH. Resin based approaches for selective extraction and purification of rare earth elements: a comprehensive review. J Environ Chem Eng. 2024 Mar 6;12(2):112402. doi: 10.1016/j.jece.2024.112402.
Leskinen A, Dorval E, Baudat E, Gautier C, Stordal S, Salminen Paatero S. Intercomparison exercise on difficult to measure radionuclides in spent ion exchange resin. J Radioanal Nucl Chem. 2023 Jan;332(1):77-94. doi: 10.1007/s10967-022-08687-2.
Meyer K, Soes Ibsen M, Vetter Joss L, Broberg Hansen E, Abildskov J. Industrial ion-exchange chromatography development using discontinuous galerkin methods coupled with forward sensitivity analysis. J Chromatogr A. 2023 Jan 25;1689:463741. doi: 10.1016/j.chroma.2022.463741, PMID 36586279.
Jurkiewicz Cortada M. Equilibrium thermodynamics of the liquid phase esterification of levulinic acid with octanol over an ion exchange resin. Master en Enginyeria Quimica; 2023. p. 1-104.
Jang D, Altern SH, Cramer SM. In silico mediated workflow for rapid development of downstream processing: orthogonal product related impurity removal for a fc-containing therapeutic. J Chromatogr A. 2024 Oct 25;1735:465281. doi: 10.1016/j.chroma.2024.465281, PMID 39243589.
Gajre R, Dedania Z, Jain V. Stability indicating RP-HPLC method development and validation of efonidipine hydrochloride ethanolate and chlorthalidone. International Journal of Research and Analytical Reviews. 2023 Apr;10(2):606-648.
Wang W, Sa Y, Zhang W, Wang X, Wang Y, Yuan H. Purification and separation of caffeoyl spermidine derivatives from goji leaf tea with ion exchange resin and the mechanisms involved. Food Bioprod Process. 2024 Jun 11;147:53-69. doi: 10.1016/j.fbp.2024.06.005.
Stratulat C, Ginghina RE, Bratu AE, Isleyen A, Tunc M, Hafner Vuk K. Development and validation improved metrological methods for the determination of inorganic impurities and ash content from biofuels. Energies. 2023 Jul 7;16(13):5221. doi: 10.3390/en16135221.
Morrison AL, Strezov V, Niven RK, Taylor MP, Wilson SP, Wang J. Impact of salinity and temperature on removal of PFAS species from water by aeration in the absence of additional surfactants: a novel application of green chemistry using adsorptive bubble fractionation. Ind Eng Chem Res. 2023;62(13):5635-45. doi: 10.1021/acs.iecr.3c00150.
Wang K, Zhao L, Li T, Wang Q, Ding Z, Dong W. Selective immobilization of his-tagged enzyme on Ni-chelated ion exchange resin and its application in protein purification. Int J Mol Sci. 2023 Feb 15;24(4):3864. doi: 10.3390/ijms24043864, PMID 36835274.
Shedmake A, Jadhav P, Mane S, Rao V, Bhagwat A, Redasani V. Determination method development and validation of six nitrosamine impurities in purified water by using LC-MS/MS. AJRC. 2023;16(5):377-82. doi: 10.52711/0974-4150.2023.00061.
Schorr J, Therampilly S, Jiao L, Longree P, Singer H, Hollender J. Closing the gap: ion chromatography coupled to high resolution mass spectrometry to trace highly polar anionic substances in groundwater. Sci Total Environ. 2023 Sep 1;889:164170. doi: 10.1016/j.scitotenv.2023.164170, PMID 37201846.
Luo Y, Liu C, Lan T. Highly selective adsorption performance and mechanism of basic amino acids by modified cation resin: batch experiments and DFT calculation. J Environ Chem Eng. 2023 Jun 1;11(3):110059. doi: 10.1016/j.jece.2023.110059.
Stratulat C, Ginghina RE, Bratu AE, Isleyen A, Tunc M, Hafner Vuk K. Development and validation improved metrological methods for the determination of inorganic impurities and ash content from biofuels. Energies. 2023 Jul 7;16(13):5221. doi: 10.3390/en16135221.
Morrison AL, Strezov V, Niven RK, Taylor MP, Wilson SP, Wang J. Impact of salinity and temperature on removal of PFAS species from water by aeration in the absence of additional surfactants: a novel application of green chemistry using adsorptive bubble fractionation. Ind Eng Chem Res. 2023;62(13):5635-45. doi: 10.1021/acs.iecr.3c00150.
Cui H, Ruan H, Wei H, Ang EH, Dong Y, Lu H. Innovative sodium acrylate wastewater resource recovery through electrodialysis with integrated bipolar membranes. J Environ Chem Eng. 2024 Apr 1;12(2):112278. doi: 10.1016/j.jece.2024.112278.
Zhang Z, Zhu F, Ma Y, Huo Z, Zhang L, Shen F. Preparation of amine modified amphiphilic resins for the extraction of trace pharmaceuticals and personal care products in environmental waters. J Chromatogr A. 2023 Jul 19;1701:464062. doi: 10.1016/j.chroma.2023.464062, PMID 37216852.
Ellis AC, Boyer TH, Strathmann TJ. Regeneration of conventional and emerging PFAS-selective anion exchange resins used to treat PFAS-contaminated waters. Sep Purif Technol. 2025 Mar 1;355:129789. doi: 10.1016/j.seppur.2024.129789.
Abdelghaffar SH, Hegazy MA, Eltanany BM. Stability and biosimilarity assessment of bevacizumab monoclonal antibody; orthogonal testing protocol coupled with peptide mapping principal component analysis. J AOAC Int. 2024 Jan 1;107(1):177-88. doi: 10.1093/jaoacint/qsad094, PMID 37606972.
Shedmake A, Jadhav P, Mane S, Rao V, Bhagwat A, Redasani V. Determination method development and validation of six nitrosamine impurities in purified water by using LC-MS/MS. AJRC. 2023;16(5):377-82. doi: 10.52711/0974-4150.2023.00061.
Manchuri KM, Shaik MA, Gopireddy VS, Sultana N, Gogineni S. Analytical methodologies to detect N-nitrosamine impurities in active pharmaceutical ingredients drug products and other matrices. Chem Res Toxicol. 2024 Aug 19;37(9):1456-83. doi: 10.1021/acs.chemrestox.4c00234, PMID 39158368.
Kodali J, Puram S, Srinivas P, Nilavu MC, Arunraj B, Krishna Kumar AS. Sequestration of mecoprop herbicide from water using XAD-4 resin impregnated with aliquat 336 and quantification with liquid chromatography tandem mass spectrometer (LC-MS/MS). Sep Sci Technol. 2023;58(15-16):2677-91. doi: 10.1080/01496395.2023.2225732.
Gachumi G, Schryer A, Siciliano SD. Two dimensional ion chromatography tandem mass spectrometric (2D-IC-MS/MS) method for the analysis of phosphorus compounds in soil. J Chromatogr A. 2025 Jul 5;1752:465287. doi: 10.1016/j.chroma.2024.465287, PMID 40280016.
Mikhail IE, Murray E, Bluett S, Astrakhantseva S, Paull B. Simultaneous separation and detection of monochloramine nitrite and nitrate by step gradient mixed mode ion chromatography: translation from benchtop to portable ion chromatograph. Anal Chim Acta. 2024 May 22;1304:342557. doi: 10.1016/j.aca.2024.342557, PMID 38637041.
Guo J, Kufer R, Li D, Wohlrab S, Greenwood Goodwin M, Yang F. Technical advancement and practical considerations of LC-MS/MS-based methods for host cell protein identification and quantitation to support process development. mAbs. 2023 Dec 31;15(1):2213365. doi: 10.1080/19420862.2023.2213365, PMID 37218066.
De Oliveira AF, De Melo Vieira A, Santos JM. Trends and challenges in analytical chemistry for multi-analysis of illicit drugs employing wastewater based epidemiology. Anal Bioanal Chem. 2023 Jul;415(18):3749-58. doi: 10.1007/s00216-023-04644-4, PMID 36952026.
Folorunsho O, Bogush A, Kourtchev I. A new on line SPE LC-HRMS method for simultaneous analysis of selected emerging contaminants in surface waters. Anal Methods. 2023;15(3):284-96. doi: 10.1039/d2ay01574a, PMID 36541663.
Elhendawy MA. Development and validation of different analytical techniques for the quantification of cannabinoids and cann flavins in cannabis and cannabis based products. Oxford, (MS): University of Mississippi; 2023. p. 1-212.
Kittle WM, Reeves MA, Fulkerson AE, Hamorsky KT, Morris DA, Kitterman KT. Preclinical long term stability and forced degradation assessment of epicertin a mucosal healing biotherapeutic for inflammatory bowel disease. Pharmaceutics. 2025 Feb 15;17(2):259. doi: 10.3390/pharmaceutics17020259, PMID 40006626.
Tesoro C. Innovative analytical methods for the evaluation of L-dopa level in typical legumes of Basilicata to ascertain their potential use as adjuvants in the treatment of Parkinson’s disease. Tesoro, Carmen; 2025.
Tintrop LK. Development of green sample preparation methods for the analysis of organic substances in aqueous matrices with gas chromatography mass spectrometry. Duisburg: Universitat Duisburg-Essen; 2024.
Dixon DI. Development, optimisation and validation of chromatographic and qNMR spectroscopic methods for the detection and quantification of controlled drugs, psychoactive substances and prescription-only medications. Manchester: Manchester Metropolitan University; 2024.
Schad M, Gautam S, Grein TA, Kaß F. Process analytical technologies (PAT) and quality by design (QbD) for bioprocessing of virus based therapeutics. In: Gautam S, Chiramel AI, Pach R, editors. Bioprocess and analytics development for virus based advanced therapeutics and medicinal products (ATMPs). Berlin: Springer International Publishing; 2023. p. 295-328. doi: 10.1007/978-3-031-28489-2_13.
Cernosek T. Analytical quality by design applied to platform method development for the characterization of monoclonal antibody based therapeutics. Claremont, (CA): Keck Graduate Institute; 2025.
EL Sanafery SS, Mohamed GG, Hamad SF, Saad AS. Experimentally designed sensor for the real time detection of molnupiravir degradation: optimization characterization and application. General Information; 2024. doi: 10.21203/rs.3.rs-5097456/v1.
Overton L, Boi C, Shastry S, Smith Moore C, Balchunas J, Sambandan D. Development and delivery of a hands on short course in adeno associated virus manufacturing to support growing workforce needs in gene therapy. Hum Gene Ther. 2023;34(7-8):259-72. doi: 10.1089/hum.2022.235, PMID 36860188.
Kumar A, Sharma S, Jain S. Taste masking of bitter drugs: a review. Int J Appl Pharm. 2018;10(5):1-6.
Patel AR, Vavia PR. Taste masking of chlorpheniramine maleate by spray dried microspheres of polymethacrylate polymers. Int J Appl Pharm. 2019;11(2):45-50.
Reddy JR, Reddy MS, Reddy KR. Formulation and evaluation of taste masked oral disintegrating tablets of dextromethorphan hydrobromide. Int J Appl Pharm. 2020;12(3):123-9.
Singh S, Baghel RS, Yadav L. Formulation and evaluation of taste masked suspension of phenylephrine hydrochloride. Int J Appl Pharm. 2021;13(1):87-92.
Deshmukh SS, Potnis VV, Mahajan HS. Ion exchange resin-based drug delivery system for taste masking of bitter drugs: a review. Int J Appl Pharm. 2022;14(4):1-8.
Kothawade SN, V Pande VV. Development and validation of an RP-HPLC method for deferiprone estimation in pharmaceutical dosage form. Asian J Pharm Clin Res. 2023;16(4):100-3. doi: 10.22159/ajpcr.2023.v16i4.47000.
Sharma A, Kumar I, Rana K. RP-HPLC method development and validation for the combination of imiquimod and salicylic acid. Int J Pharm Pharm Sci. 2020;12(9):41-8. doi: 10.22159/ijpps.2020v12i9.38382.
Jadhav S, Bhoir G, Jain V. Method development and validation of rapid isocratic RP-HPLC method for simultaneous estimation of paracetamol caffeine and propyphenazone in pharmaceutical formulation. Asian J Pharm Clin Res. 2024;17(4):83-7. doi: 10.22159/ajpcr.2024.v17i4.49544.
Naresh P, Kumar KV. Leflunomide tablet formulation: development and validation of an RP-HPLC technique. Int J Pharm Pharm Sci. 2023;15(1):16-21. doi: 10.22159/ijpps.2023v15i1.46505.
Chiang CW, Tang S, Boonstra JM, Van Tilburg LP, Liu J, Chiang PC. Development of an extemporaneous preparation formulation using a simple and non-solubilizing matrix for first in human clinical study. Int J Pharm. 2024 Mar 25;653:123868. doi: 10.1016/j.ijpharm.2024.123868, PMID 38309485.
Gaikwad SS, Morales JO, Lande NB, Catalan Figueroa J, Laddha UD, Kshirsagar SJ. Exploring paediatric oral suspension development: challenges requirements and formulation advancements. Int J Pharm. 2024 Apr 28;657:124169. doi: 10.1016/j.ijpharm.2024.124169, PMID 38688428.
Patel G, Patel D. Development of taste masked oral dispersible tablets of cefpodoxime proxetil. Pharm Technol. 2024 Mar 3;48(3):22-6.
Ram Munnangi S, Narala N, Lakkala P, Kumar Vemula S, Repka M. Assessing abuse deterrent formulations utilizing ion-exchange resin complexation processed via twin-screw granulation for improved safety and effectiveness. Eur J Pharm Biopharm. 2024 Feb 17;197:114230. doi: 10.1016/j.ejpb.2024.114230, PMID 38373555.
Wang J, Gu J, Faustino PJ, Siddiqui A, Zhao Y, Giacoia G. Evaluation of the bioavailability of a tamiflu taste masking pediatric formulation using a juvenile pig model and LC-MS/MS. Bioanalysis. 2024 Jun 10;16(13):681-91. doi: 10.1080/17576180.2024.2352256, PMID 39254502.