
Int J App Pharm, Vol 17, Issue 5, 2025, 168-180Original Article
A GREENNESS EVALUATED BIOANALYTICAL METHOD FOR QUANTIFICATION OF SPARSENTAN IN RAT PLASMA AND ITS APPLICATION TO PHARMACOKINETIC STUDIES BY LC-MS
KRANTHI YALLA1,2*, A. KRISHNAMANJARI PAWAR1, KIRAN MANDA2
1AU College of Pharmaceutical Sciences, Andhra University, Visakhapatnam, Andhra Pradesh, India. 2Shri Vishnu College of Pharmacy, Bhimavaram, West Godavari, Andhra Pradesh, India
*Corresponding author: Kranthi Yalla; *Email: ykranti@gmail.com
Received: 27 Mar 2025, Revised and Accepted: 23 Jul 2025
ABSTRACT
Objective: A simple, accurate, reproducible, greenness-evaluated method for bioanalytical estimation of sparsentan in rat plasma and its application to pharmacokinetic studies by liquid chromatography mass spectrometry (LC-MS) using macitentan as internal standard.
Methods: The current work sought to develop and estimate sparsentan by Chromatograph, Waters 2695 high performance liquid chromatography (HPLC) with auto sampler, column oven, and degasser, and SCIEX QTRAP 5500 mass spectrometer, and with class Empower-2 software. The Mobile Phase used was acetonitrile with trifluoroacetic acid buffer (50:50) with a run time of 5 min and a flow rate of 1 ml/min.
Results: Retention times of 1.933 for sparsentan and 3.270 for macitentan were found. This method was validated over a linear range of 6.0-240.0 ng/ml with a correlation coefficient of 0.9989. The intra-batch and inter-batch precision percentage coefficient of variation (%CV) across five levels of Quality parameters is less than 15.00. Bench top stability, short-term, and long-term stability studies were performed, and % CVs were found below 15%. Pharmacokinetic studies were performed by administering to rats and reported the maximum concentration (Cmax) and time to maximum concentration (Tmax). Green analysis was also performed.
Conclusion: The optimized sample preparation and chromatographic conditions ensured high sensitivity and minimal matrix interference, allowing reliable quantification of sparsentan even at low concentrations. Future research can focus on method modifications to enable simultaneous quantification of sparsentan and its metabolites.
Keywords: Benchtop stability, Macitentan, LC-MS, Cmax, Tmax, etc
© 2025 The Authors. Published by Innovare Academic Sciences Pvt Ltd. This is an open access article under the CC BY license (https://creativecommons.org/licenses/by/4.0/)
DOI: https://dx.doi.org/10.22159/ijap.2025v17i5.54341 Journal homepage: https://innovareacademics.in/journals/index.php/ijap
INTRODUCTION
Sparsentan's action. The erratic but dangerous glomerulonephritis mediated by the immunological complex known as immunoglobulin a nephropathy, or Berger's disease, is typified by mesangial deposition of aberrantly structured IgA and a range of histopathologic abnormalities. IgA builds up in the kidney, resulting in glomerular damage and inflammation, which causes urine to leak protein (proteinuria) and blood (haematuria) [1–3]. Optimal supportive care has long been the cornerstone of treatment for IgA nephropathy, with the goals of lowering blood pressure, proteinuria, and lifestyle risk factors. Despite its safety concerns, immunosuppressive treatment with corticosteroids may potentially be useful in the treatment of this illness. For individuals with IgA nephropathy at high risk has progressive decrease in kidney functioning activity, there is a huge unmet medical need for well-tolerated and effective therapies [4]. According to clinical research, individuals with chronic kidney disease experienced nephron protection with decreased proteinuria once the Renin-Angiotensin-Aldosterone System (RAAS), a hormone that regulates blood pressure and fluid balance, and endothelin-1 were dual inhibited [5]. Travere Therapeutics (formerly Retrophin) is developing Sparsentan (FILSPARITM), a mono, tiny-molecule, Dual Endothelin Angiotensin Receptor Antagonist (DEARA), a drug that reduces blood pressure and protects organ function, and is used to treat FSGS and IgA nephropathy. On February 17, 2023, sparsentan got accelerated approval in the United States for the treatment of proteinuria, which, in patients with IgA nephropathy who have rapid disease development, is generally defined as a Urine Protein-to-Creatinine ratio (UP/C) ≥ 1.5 g/g [6, 7]. For IgA nephropathy, it is the first and only licensed non-immunosuppressive treatment. Interim findings from the ongoing phase III PROTECT study served as the basis for the approval. For 14 d, a dose of 200 mg once a day is recommended; after that, as tolerated, it needs to be increased to 400 mg once a day. It is necessary to adjust the dosage of sparsentan to account for the increase in aminotransferase levels when administered in conjunction with a potent CYP3A inhibitor. Sparsentan is only accessible in the USA through the FILSPARI REMS Risk Evaluation and Mitigation Strategy (REMS) program due to the possible rise in liver and embryo-foetal toxicity concerns [7]. Sparsentan has been submitted for approval in the EU to treat IgA nephropathy [8]. Sparsentan is both an inhibitor and inducer of CYP3A and induces CYP2B6, CYP2C9, and CYP2C19. It also inhibits p-glycoprotein, BCRP, OATP1B3, and OAT3, because sparsentan elevates the risk of hypotension, syncope, hyperkalaemia, and renal impairment; hence, it should not be administered concurrently with angiotensin receptor blockers, endothelin receptor antagonists, or aliskiren (a renin inhibitor). Co-administration of sparsentan with CYP2B6, CYP2C9 and CYP2C19 substrates, sensitive p-glycoprotein and BCRP substrates, antacids, acid-reducing agents, nonsteroidal anti-inflammatory drugs (including selective cyclooxygenase inhibitors), strong CYP3A inhibitors, moderate CYP3A inhibitors, strong CYP3A inducers, and agents that raise serum potassium may result in clinically significant drug interactions [9]. No clinically significant drug-drug interactions were seen when sparsentan was administered concurrently with the sodium-glucose co-transporter II inhibitor dapagliflozin. Before its commercialization, sparsentan was made available in several European countries via the managed access programme (MAP), which commenced in November 2023. As a result, before sparsentan was officially approved in Europe, it was available for use in regular clinical practice for high-risk IgAN patients (as defined by the PROTECT trial inclusion criteria). The chemical formula for sparsentan is C32H40N4O5S, and the fig. 1, shows its structure [10].
A Literature review indicated that very few analytical methods were proposed for estimation of Sparsentan HPLC analysis of bulk and dosage forms [12, 13], and Pharmacokinetic studies were conducted on healthy volunteers and patients with focal segmental glomerulosclerosis [14]. Previous studies primarily focused on the development of validated RP-HPLC methods for quantifying Sparsentan in pharmaceutical dosage forms, not in biological matrices like plasma, and have no application to pharmacokinetic studies. Wada R and co-authors focused on data modelling but not on detailed method development, optimization, and full regulatory–compliant validation [14]. The LC-MS/MS method has higher sensitivity and suitable for detecting low plasma concentrations after therapeutic dosing. When compared to HPLC, LC-MS/MS selectivity is superior with multiple reaction monitoring (MRM) transitions ensuring highly specific detection even in the presence of complex biological interferences. It is indicated that apart from the mentioned, no approaches were made for bioanalytical estimation in rat plasma with Validation and application to a pharmacokinetic Study. The current work sought to develop and estimate sparsentan by LC-MS with high sensitivity. Accuracy and precision of the approach were validated in accordance with USFDA (United States Food and Drug Administration) requirements.
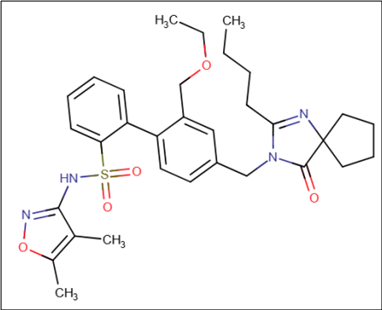
Fig: 1: Showing structure of sparsentan [10]
MATERIALS AND METHODS
The experiment was carried out as a chromatographic technic on waters 2695 HPLC chromatograph provided with high-speed auto sampler, column oven, and degasser and SCIEX QTRAP 5500 mass spectrometer with class Empower-2 software [15-17].
Reagents and chemicals
The reference sample was obtained as Sparsentan samples from Zydus Cadila Health care Ltd, Secunderabad. LC-MS grade acetonitrile and remaining Chemicals were obtained from Merck Chemicals. HPLC-grade water from the Milli-Q was used all through the Analysis.
Diluent: 0.1% Trifluoroacetic acid was used as diluents. pH of TFA buffer: 2.2 (observed pH).
Preparation of mobile phase
Mix acetonitrile with buffer (50:50) and filter through 0.45µ membrane filter paper.
Method optimization
To optimize the chromatographic conditions, different ratios of Trifluoroacetic acid, acetonitrile, and Perchloric acid, acetonitrile were the mobile phase in isocratic mode were tested. However, the mobile phase composition was modified at each trial to enhance the resolution and also to achieve acceptable retention times. Finally, a mixture of acetonitrile and Trifluoroacetic acid with isocratic elution was selected as the mobile phase because it results in a greater response of active pharmaceutical ingredients. During the optimization of the method, various stationary phases such as C8, C18, and phenyl columns were tested. From these trials, the peak shapes were relatively good with symmetry, a C18 column of 150 x 4.6 mm dimensions and 3.5 µ particle size. The mobile phase flow rate is 1 ml/min. Run time was 5 min and the injection volume is 10 μl.
As Sparsentan belongs to endothelin and angiotensin II receptor antagonists category. So, we were selected the same category drug as internal standard (Macitentan has similar structural properties with Sparsentan).
Sparsentan stock solution (480ng/ml)
Weigh 6 mg of Sparsentan working standard and transfer into a 10 ml volumetric flask, diluted to volume with diluent. Further diluted 0.8 ml to 10 ml with diluent. Take 0.1 ml of the above stock solution into a 10 ml volumetric flask and make up to the mark with diluents.
Preparation of internal standard stock solution (400ng/ml)
Weigh 5 mg of macitentan working standard and transfer into a 10 ml volumetric flask, diluted to volume with diluent. Further diluted 0.8 ml to 10 ml with diluent. Take 0.1 ml of the above solution into a 10 ml volumetric flask and make up to the mark with diluents.
Preparation of stock and standard solutions
Stock solutions of sparsentan and Internal standard macitentan were prepared to a concentration of 480ng/ml and 400ng/ml, respectively using buffer as a diluent. Standard solutions of sparsentan (120ng/ml) and macitentan (100ng/ml) were prepared by transferring 500μL of standard stock solution into 2 ml centrifuge tube. Transferred 200μl of plasma solution into 2 ml centrifuged tube. To this, add 300μl of Acetonitrile and vortex for 10 min. After that, add 500μl of diluent, 500μl of standard stock, and 500μl of internal standard stock. Centrifuged swing-out rotar at 4000 RPM (at room temperature) for 20 min, filtered the supernatant liquid, and transferred it into an HPLC vial.
Preparation of linearity solution
Concentrations ranging from 6ng to 240ng per ml of sparsentan were prepared as above mentioned procedure. Centrifuged for 20 min at 4000 RPM, supernatant was collected in LC vial to inject into the chromatographic system.
Extraction procedure
The samples which were Centrifuged and treated were labelled according to their time intervals. To precipitate proteins in 200μl of plasma, add 300μl of Acetonitrile and 500μl of diluent vortexed. Centrifuged for 20 min at 4000 rpm. Supernatant solution was collected in vial and injected into chromatographic system.
Methodology for analysis
After the extraction from plasma the sample, blank, linearity solutions were injected into the chromatographic system and recorded their chromatograms. Peak areas of sparsentan and macitentan were measured and calculated the concentration of sparsentan in the plasma from linearity curve derived equation.
Validation of bioanalytical method
The Method was validated for parameters like specificity, sensitivity, linearity, Accuracy, Precision, Matrix effect, recovery and stability [18, 19].
Specificity
Six different rat plasma samples were injected into system to check any interference at retention time of sample and internal standard [20].
Sensitivity
Six replicate injections of the lower limit of quantification nominal concentration (LLOQ) of 6ng/ml were injected; % mean accuracy and percent coefficient of variation (%CV) were calculated. This method reflects superior sensitivity compared to previously reported RP-HPLC methods for sparsentan. Siva Krishna et al. (2024) and Haritha Gali's (2024) methods typically required higher concentrations and had a sensitivity problem for application to biological matrices like plasma. Compared to this, our method is suitable for pharmacokinetic studies in rats as it can accurately quantify low plasma concentrations of sparsentan following in vivo dosing.
Matrix effect
At high quality control sample (HQC) and at low quality control sample (LQC), six different lots were examined for three replicates each, and then %CV and % mean accuracy were calculated. By comparing the peak zone fraction in the post-extract plasma sample of six separate plasma samples devoid of medicine and slick recovery samples, we were able to assess the effect matrix for sparsentan. Six different lots of plasma were tested at MQC (middle quality control) levels in duplicate, with satisfactory accuracy (% Coefficient of variation (CV) 15%).
Linearity
A concentration range of 6ng/ml to 240ng/ml of sparsentan was examined for linearity and found its regression coefficient.
Accuracy and precision
Six replicates each of sparsentan at four different quality control levels (QCs) were determined for intra-assay precision and accuracy. The inter-assay precision was evaluated by examining four levels of QC samples across four runs and %CV and % mean accuracy was calculated. The higher %CV (1.96) at LLOQ due to matrix effect and signal-to-noise ratio which are more common near the LLOQ.
Recovery
These studies for drug and ISTD were estimated at low, medium, and high quality controls, and results were shown in table No. 8. Recovery was calculated by comparing with that of the standard solution. The extraction efficiency is a comparison of the analytical response to an amount of analyte added versus that estimated from the sample matrix. Despite the fact that Sparsentan is a basic compound, extraction was performed using mobile phase solvent. The recoveries for sparsentan at LQC, MQC, and HQC levels the results demonstrated that the bioanalytical method had good extraction efficiency. This also showed that the recovery wasn’t hooked into concentration. The recoveries for sparsentan (96.10%-98.12%) at LQC, MQC, and HQC levels and % CV ranged from 0.08-0.83. The results demonstrated that the bioanalytical method had good extraction efficiency.
Stability
Stability studies include bench top, Auto sampler, long term, short term, freeze thaw, wet extract and Dry extract were performed and evaluated for % CV and mean accuracy [21]. Comparing the area response of the analyte in the stability samples with the region response of the sample obtained from the fresh stock solution allowed us to conclude the stock solution's stability. The effects of LQC and HQC concentrations on plasma stability were tested using six dose replicates. The USFDA defines stability as a coefficient of variation less than 15% for an analyte. Injected rat plasma samples were tested for 24 h of shelf life (bench top stability) after being kept at room temperature. The auto sampler stability of increased rat plasma was measured over 24 h at 2-8 °C. Extracted plasma samples were injected immediately or stored in the auto sampler at 2-8 °C for 24 h to assess the stability of the auto sampler. Freeze-thaw stability was evaluated by contrasting newly infused quality control samples with those frozen at-30 °C and thawed thrice. Six aliquots were utilized to test the freeze-thaw stability of both the low and high-quality control concentrations. To evaluate the long-term stability, the 24 h concentration was compared to the starting concentration.
Pharmacokinetic studies
Six healthy rats weighing about 250 g were procured from Biological E Limited in Hyderabad, India, for the purpose of conducting in vivo pharmacokinetic investigations. Institutional Animal Ethics Committee approval (Reg. No: 1074/PO/Re/S/28/CPCSEA) was obtained for the animal research protocol. The animals live in controlled environments with access to fresh corn, endive, and carrots. Their diet should be maintained at a temperature of 21-24 ᵒC and a humidity level of 50-55%. There was an overnight fast and free access to water for all animals before the experiment. Sparsentan was given orally to all of the rats at a dose of 6.67 mg/kg. 12 h sampling cutoff (we collected the blood from the rat for every 2 h. At 12 h, we did not detect the drug. So, we cut off the sampling at 12 h). Incurred sample reanalysis (ISR) acceptance criteria ≤ 20% difference. The extraction technique used was liquid-liquid extraction to isolate sparsentan from rat plasma. Plasma samples of 200μl of respective concentrations were added into polypropylene tubes, which were previously labelled vortexed, then 500μl of stock standard solution and 500 μl of internal stock standard solutions were added. For 10 min, the tubes were vortexed and centrifuged at 4000 rpm, maintaining the temperature at 20 °C. Supernatant liquid from each tube was collected and transferred into other labelled tubes and evaporated at 40 °C till complete solvent evaporation. Then the samples were reconstituted with 300μl of Acetonitrile and 500μl of diluents, vortexed, and then transferred the sample into injection vials of the autosampler. Sparsentan sample from rat body collected at different time intervals like 1.0, 2.0, 3.0, 4.0, 6.0, 8.0, 10.0, and 12.0 H in six rats as shown in table 13. Later samples were prepared as per the test method and injected into the chromatograph.
Green assessment of the method
A tool called the Analytical Greenness Metric tool called, AGREE, an assessment method introduced for green evaluation of method by Pena-Pereira et al. This method details about 12 principles.
They includes: 1) Use direct analysis to minimize sample treatment 2) Minimal sample size and number, 3) Relocating the analytical device closer to the sample: numerical scoring, 4) Integrating analytical processes saves energy and reagents, 5) Selecting Automated and Scale down Methods, 6) Evade Derivatization, 7) Avoid excess analytical waste and proper management, 8) Preferring multianalyte methods over single-analyte analysis, 9) Minimize energy use 10) Prefer renewable reagents, 11) Elimination or replace of toxic reagents. 12) Safety of Operator [22]. When compared with other methods in the literature, we found the run time was shorter, which in turn gives less consumption of solvents like acetonitrile and buffers. Some methods, like Siva Krishna et al., used only acetonitrile as a diluent. In spite of experimenting with bioanalysis, our method scores good score as compared to other existing methods.
RESULTS AND DISCUSSION
Sparsentan and Internal standard Macitentan were determined by mass spectrometer fig. 2, represents the multiple reactions monitoring of Macitentan and fig. 3, represents the multiple reaction monitoring of sparsentan.
System suitability
Table 1 shows the reference standards set analysed to determine the performance of instrument was piloted erstwhile to the time of analytical run. Fig. 4 represents the chromatogram for system suitability.
Table 1: Showing sparsentan system suitability
| Sample name MQC (120ng/ml) | Analyte area (cps) | Analyte RT (min) | ISTD area (100ng/ml) | ISTD RT (min) | Area ratio |
| MQC-1 | 2.559x10⁵ | 1.915 | 2.125x10⁵ | 3.251 | 1.2042 |
| MQC-2 | 2.551x10⁵ | 1.917 | 2.119x10⁵ | 3.259 | 1.2039 |
| MQC-3 | 2.547x10⁵ | 1.913 | 2.121x10⁵ | 3.256 | 1.2008 |
| MQC-4 | 2.555x10⁵ | 1.915 | 2.129x10⁵ | 3.250 | 1.2001 |
| MQC-5 | 2.549x10⁵ | 1.911 | 2.127x10⁵ | 3.254 | 1.1984 |
| MQC-6 | 2.557x10⁵ | 1.918 | 2.130x10⁵ | 3.256 | 1.2005 |
| Mean | 2.553x10⁵ | 1.915 | 2.125x10⁵ | 3.254 | 1.2013 |
| ±SD | 0.00473 | 0.00256 | 0.00440 | 0.00339 | 0.00228 |
| %CV | 0.19 | 0.13 | 0.21 | 0.10 | 0.19 |
*Middle quality control concentration (MQC) *Retention time (RT) *Internal standard (ISTD) mean±SD (n=6). Results shows that the percentage coefficient of variation (%CV) for sparsentan and ISTD area ratio was 0.21 and the system is suitable for analysis.
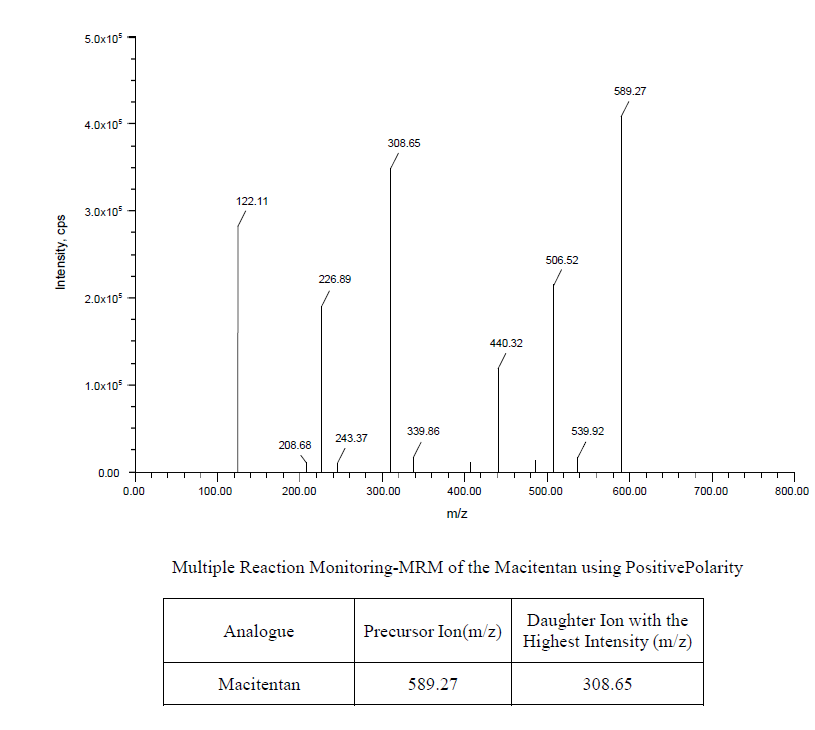
Fig. 2: Showing the MRM (Multiple reaction monitoring) of the macitentan
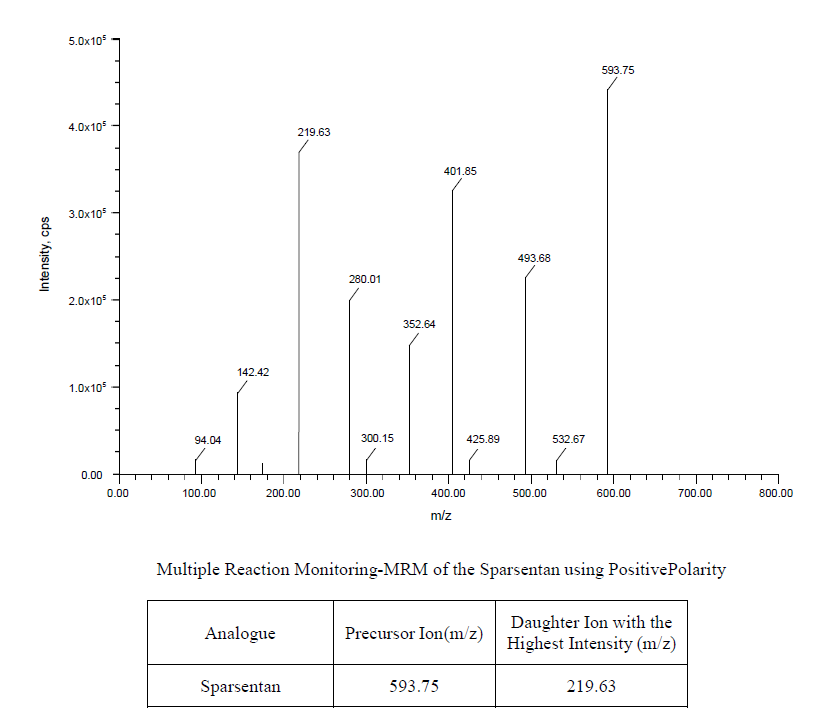
Fig. 3: Showing the MRM of the sparsentan
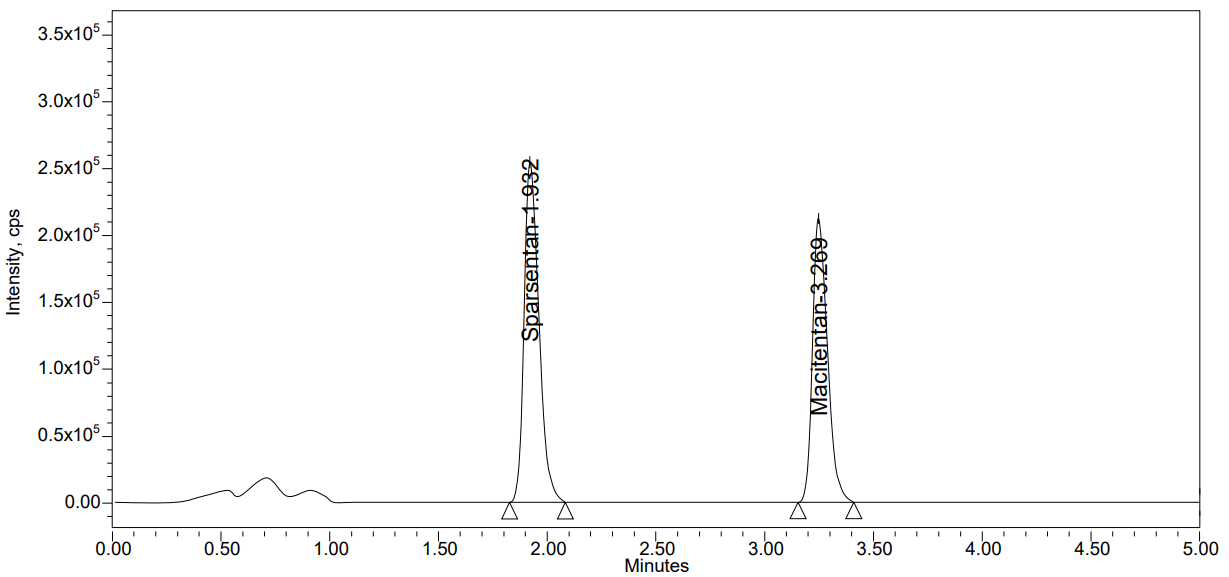
Fig. 4: Chromatogram of system suitability
Auto sampler carryover
Subsequent injections have a carryover area response of less than 20%. Hence, the approach passed the carryover effect. The results were mentioned in table 2.
Specificity and screening of biological matrix
No interfering peaks were found at the retention durations of either Sparsentan or internal standard (ISTD). The results were shown in table no: 3. the chromatogram of blank with ISTD was shown in the fig. 5.
Table 2: Showing auto sampler carryover of sparsentan
| Sample ID | Peak area | % Recovery | ||
| Drug | ISTD | Drug | ISTD | |
| Unextracted samples | ||||
| Std | 0 | 0 | N/A | N/A |
| HQC | 0.00 | 0.00 | ||
| Std | 0 | 0 | ||
| LLOQ | N/A | N/A | ||
| Extracted samples | ||||
| Std | 0 | 0 | N/A | N/A |
| HQC | 0.00 | 0.00 | ||
| Std | 0 | 0 | ||
| LLOQ | N/A | N/A | ||
*High Quality Control Concentration (MQC) *Lower Quality Control Concentration (MQC) *Lower limit of quantification (LLOQ). *Standard (Std) mean±SD (n=6).
Table 3: Specificity and screening of biological matrix of sparsentan
| S. No. | Sample ID | Intensity (cps) | % Interference | Pass (P)/fail (F) | |
| Drug | ISTD | Drug | ISTD | ||
| 1. | Std 1 | 0 | 0 | 0 | 0 |
| 2. | LLOQ 1 (6ng/ml) | 0.123x10⁵ | 2.125x10⁵ | 0 | 0 |
| 3. | Std 2 | 0 | 0 | 0 | 0 |
| 4. | LLOQ 2 (6ng/ml) | 0.120x10⁵ | 2.121x10⁵ | 0 | 0 |
| 5. | Std 3 | 0 | 0 | 0 | 0 |
| 6. | LLOQ 3 (6ng/ml) | 0.119x10⁵ | 2.117x10⁵ | 0 | 0 |
| 7. | Std 4 | 0 | 0 | 0 | 0 |
| 8. | LLOQ 4 (6ng/ml) | 0.122x10⁵ | 2.123x10⁵ | 0 | 0 |
| 9. | Std 5 | 0 | 0 | 0 | 0 |
| 10. | LLOQ 5 (6ng/ml) | 0.118x10⁵ | 2.127x10⁵ | 0 | 0 |
| 11. | Std 6 | 0 | 0 | 0 | 0 |
| 12. | LLOQ 6 (6ng/ml) | 0.123x10⁵ | 2.119x10⁵ | 0 | 0 |
*Identification number (ID) *Counts Per Second (cps), n=6.
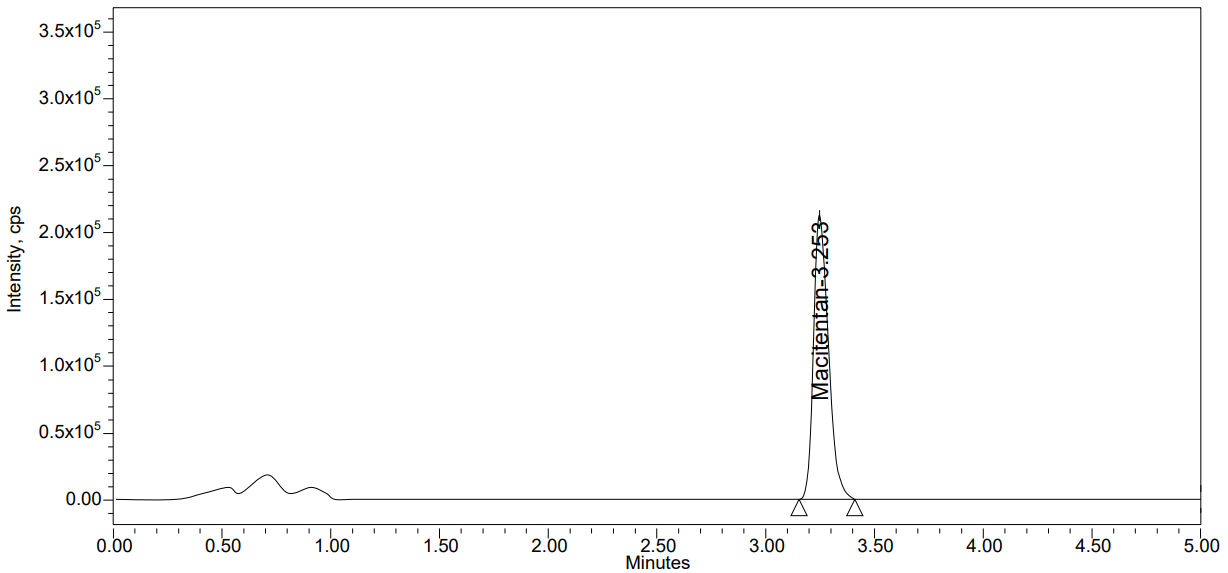
Fig. 5: Specificity chromatogram of internal standard
Sensitivity
The %CV for sparsentan was found to be 1.65% and its % mean accuracy was 93.22% which shows good sensitivity. Table 4, shows the results data and fig. 6 was the chromatogram for sensitivity chromatogram of LLOQ.
Matrix effect
Determined by comparing the response of post-extracted plasma standard MQC samples (120ng/ml Sparsentan) (n = 6) to the response of the analyte from standard response at comparable concentrations, as shown in table 5. The matrix effect intended technique was tested with chromatographically screened rat plasma. Fig. 7 and fig. 8 represent the chromatogram for the Matrix effect.
Table 4: Sensitivity results of sparsentan
| Replicate number | LLOQ |
| Concentration (ng/ml) | |
| 6 | |
| Area of analyte | |
| 1 | 0.121x10⁵ |
| 2 | 0.118x10⁵ |
| 3 | 0.120x10⁵ |
| 4 | 0.117x10⁵ |
| 5 | 0.122x10⁵ |
| 6 | 0.118x10⁵ |
| Mean | 0.119x10⁵ |
| Standard Deviation (±SD) | 0.00197 |
| % CV | 1.65 |
| % mean Accuracy | 93.22% |
n=6.
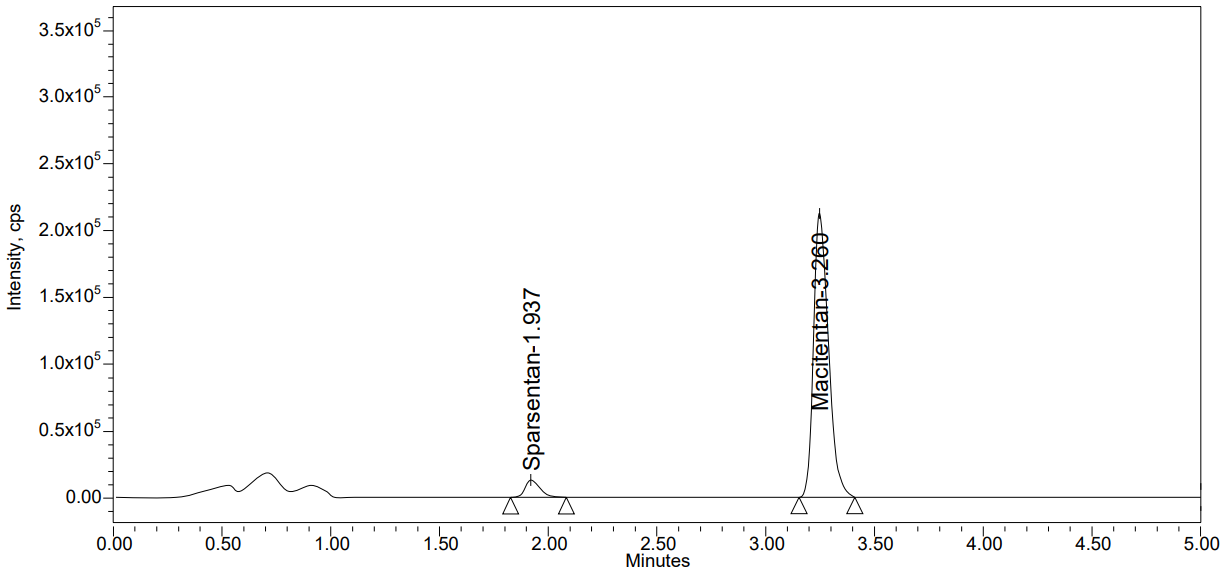
Fig. 6: Sensitivity chromatogram of LLOQ
Table 5: Matrix effect of sparsentan (HQC-180ng/ml, LQC-18ng/ml)
| S. No. | Plasma lot no. | HQC | LQC |
| Nominal concentration (ng/ml) | |||
| 180 | 18 | ||
| Analyte peak area | |||
| 1. | Lot 1 | 3.759x10⁵ | 0.369x10⁵ |
| 3.751x10⁵ | 0.363x10⁵ | ||
| 3.755x10⁵ | 0.367x10⁵ | ||
| 2. | Lot 2 | 3.766x10⁵ | 0.368x10⁵ |
| 3.762x10⁵ | 0.375x10⁵ | ||
| 3.765x10⁵ | 0.372x10⁵ | ||
| 3. | Lot 3 | 3.754x10⁵ | 0.370x10⁵ |
| 3.767x10⁵ | 0.368x10⁵ | ||
| 3.757x10⁵ | 0.366x10⁵ | ||
| 4. | Lot 4 | 3.752x10⁵ | 0.362x10⁵ |
| 3.748x10⁵ | 0.359x10⁵ | ||
| 3.749x10⁵ | 0.361x10⁵ | ||
| 5. | Lot 5 | 3.756x10⁵ | 0.364x10⁵ |
| 3.758x10⁵ | 0.371x10⁵ | ||
| 3.763x10⁵ | 0.365x10⁵ | ||
| 6. | Lot 6 | 3.755x10⁵ | 0.377x10⁵ |
| 3.753x10⁵ | 0.374x10⁵ | ||
| 3.766x10⁵ | 0.366x10⁵ | ||
| Mean | 3.758x10⁵ | 0.368x10⁵ | |
| ± SD | 0.00607 | 0.00496 | |
| %CV | 0.16 | 1.35 | |
| % mean accuracy | 98.13% | 96.10% | |
| No. of QC failed | 0 | 0 |
n=18.
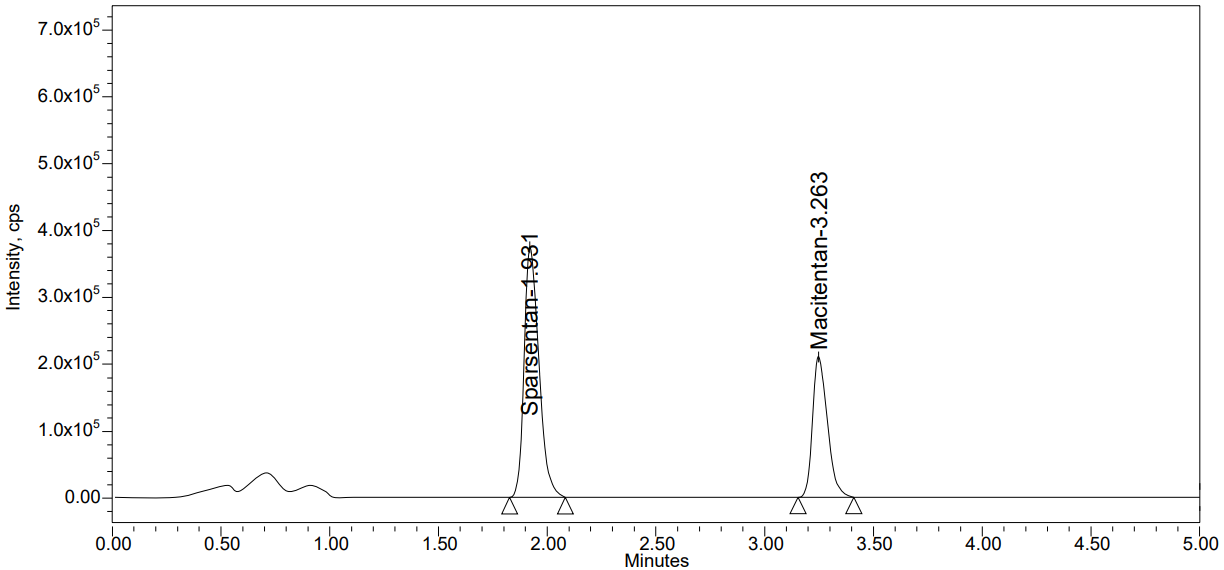
Fig. 7: Matrix effect chromatogram of HQC
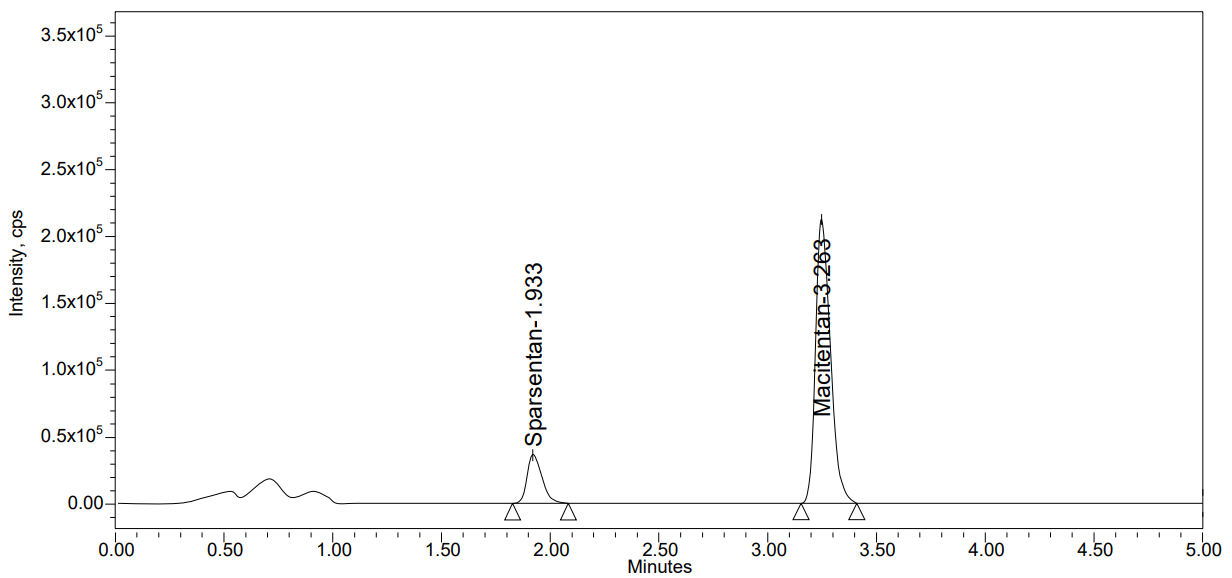
Fig. 8: Matrix effect chromatogram of LQC
Linearity
The concentration range of 6.0 to 240.0 ng/ml of sparsentan was linear on the standard curve. The % CV was 0.9989, which was shown in table No. 6. Samples were measured by comparing the analyte peak area to that of IS. Peak area ratios were shown versus plasma concentration in fig. 9.
Precision and accuracy
Replicates of 6 sparsentan injections at four different Quality Control levels (QCs) were determined for intra-assay precision and accuracy. The inter-assay precision was evaluated by examining four levels of QC samples across four runs shown in table 7. Accuracy ranges between 85-115% of actual values, with a precision of ±15% Relative Standard Deviation (RSD) except for LLQC. However, for precision, it should be between 80 and 120%, with an RSD of less than 20%.
Recovery of analyte
Recovery was calculated by comparing the response with that of the neat standard. The extraction efficiency is a comparison of the analytical response to an amount of analyte added versus that estimated from the sample matrix. Even though sparsentan is a basic compound, extraction was performed using mobile phase solvent. Fig. 10 shows the recovery of different QC samples.
Table 6: Linearity results of sparsentan
| Final conc. in ng/ml | Response | Area response ratio |
| 0 | 0 | 0.0 |
| 6.00 | 0.128 | 0.060 |
| 18.00 | 0.383 | 0.181 |
| 30.00 | 0.639 | 0.300 |
| 60.00 | 1.277 | 0.602 |
| 90.00 | 1.916 | 0.896 |
| 120.00 | 2.554 | 1.202 |
| 150.00 | 3.193 | 1.497 |
| 180.00 | 3.831 | 1.791 |
| 240.00 | 5.108 | 2.405 |
| Slope | 0.0100 | |
| Intercept | 0.00020 | |
| R2 Value | 0.9989 |
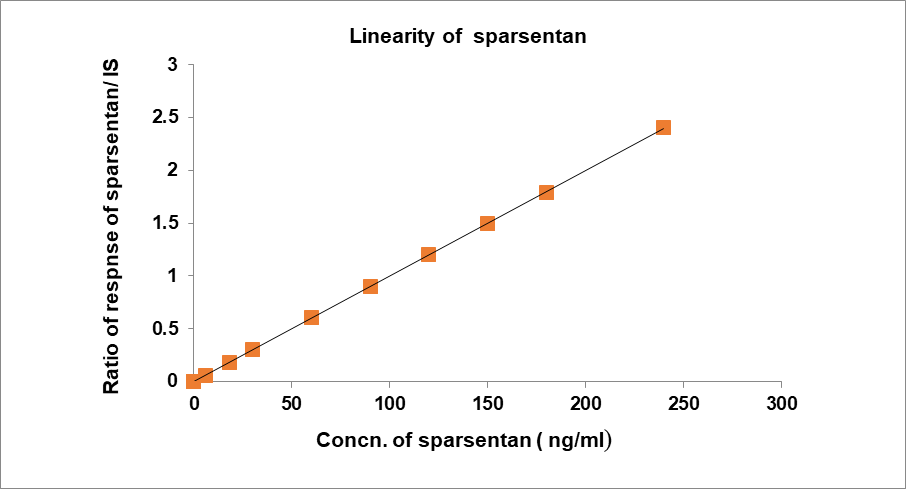
Fig. 9: Calibration plot for concentration v/s area ratio of sparsentan
Table 7: Showing precision and accuracy for sparsentan
| Replication no | HQC | MQC | LQC | LLQC |
| Concentration (ng/ml) | ||||
| 180 | 120 | 18 | 6 | |
| Analyte peak area | ||||
| 1 | 3.759x10⁵ | 2.488x10⁵ | 0.369x10⁵ | 0.122x10⁵ |
| 2 | 3.752x10⁵ | 2.484x10⁵ | 0.366x10⁵ | 0.120x10⁵ |
| 3 | 3.753x10⁵ | 2.487x10⁵ | 0.372x10⁵ | 0.118x10⁵ |
| 4 | 3.758x10⁵ | 2.482x10⁵ | 0.368x10⁵ | 0.123x10⁵ |
| 5 | 3.751x10⁵ | 2.486x10⁵ | 0.373x10⁵ | 0.119x10⁵ |
| 6 | 3.757x10⁵ | 2.481x10⁵ | 0.371x10⁵ | 0.124x10⁵ |
| Mean | 3.755x10⁵ | 2.485x10⁵ | 0.370x10⁵ | 0.121x10⁵ |
| ± SD | 0.00341 | 0. 00280 | 0.00264 | 0.00237 |
| % CV | 0.09 | 0.11 | 0.71 | 1.96 |
| % mean Accuracy | 98.05% | 97.34% | 96.62% | 94.79% |
n=6. All QC samples are within the acceptable limits. Intra-batch and inter-batches % mean accuracy criteria for LQC, MQC, HQC (85.00-115.00%) and LLOQ QC (80.00-120.00%) are met.
Table 8: Recovery of analyte of sparsentan
| HQC (180 ng/ml) | |||
| Replicate number | Extracted | Un extracted | Matrix factor |
| Mean | 3.715x10⁵ | 3.752x10⁵ | 0.9903 |
| ± SD | 0.00322 | 0.00308 | 0.00086 |
| %CV | 0.09 | 0.08 | 0.09 |
| %mean Recovery | 97.01% | 97.98% | - |
| MQC (120 ng/ml) | |||
| Mean | 2.481x10⁵ | 2.505x10⁵ | 0.9905 |
| ± SD | 0.00314 | 0.00288 | 0.00128 |
| %CV | 0.13 | 0.12 | 0.13 |
| %mean Recovery | 97.18% | 98.12% | - |
| LQC (18 ng/ml) | |||
| Mean | 0.368x10⁵ | 0.371x10⁵ | 0.9919 |
| ± SD | 0.00306 | 0.00264 | 0.00656 |
| %CV | 0.83 | 0.71 | 0.66 |
| %mean Recovery | 96.10% | 96.88% | - |
| n=6 | |||
Table 9: Results of macitentan (100ng/ml)
| S. No. | Ratio of unextracted area | Ratio of extracted area |
| 1. | 2.081x10⁵ | 2.063x10⁵ |
| 2. | 2.077x10⁵ | 2.058x10⁵ |
| 3. | 2.079x10⁵ | 2.061x10⁵ |
| 4. | 2.083x10⁵ | 2.059x10⁵ |
| 5. | 2.078x10⁵ | 2.065x10⁵ |
| 6. | 2.082x10⁵ | 2.064x10⁵ |
| Mean | 2.080x10⁵ | 2.062x10⁵ |
| ± SD | 0.00237 | 0.00280 |
| % CV | 0.11 | 0.14 |
| %mean Recovery | 97.88% | 97.04% |
n=6
Internal standard
For Internal standard, Macitentan unextracted area ratio and extracted area ratios were calculated and reported as mentioned in table 9.
Ruggedness on precision accuracy
The %CV for sparsentan confirms it is in limits for ruggedness on precision accuracy as shown in table 10.
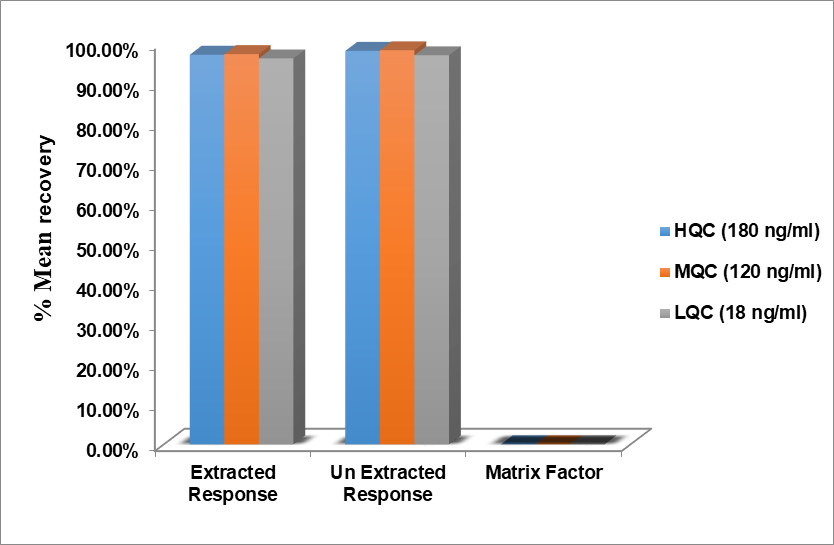
Fig. 10: Recovery of sparsentan
Table 10: Ruggedness on precision accuracy of results of sparsentan
| P and A ID | Acquisition sample batch ID | HQC | MQC | LQC |
| Nominal concentration (ng/ml) | ||||
| 180 | 120 | 18 | ||
| Analyte peak area | ||||
| Different column | 3.751x10⁵ | 2.478x10⁵ | 0.368x10⁵ | |
| 3.759x10⁵ | 2.481x10⁵ | 0.370x10⁵ | ||
| 3.753x10⁵ | 2.484x10⁵ | 0.371x10⁵ | ||
| 3.752x10⁵ | 2.477x10⁵ | 0.366x10⁵ | ||
| 3.758x10⁵ | 2.482x10⁵ | 0.372x10⁵ | ||
| 3.756x10⁵ | 2.474x10⁵ | 0.367x10⁵ | ||
| Mean | 3.755x10⁵ | 2.479x10⁵ | 0.369x10⁵ | |
| ±SD | 0.00331 | 0.00367 | 0.00237 | |
| % CV | 0.09 | 0.15 | 0.64 | |
| % mean accuracy | 98.05% | 97.10% | 96.36% |
*Precision and Accuracy (PandA), n=6
Bench top stability
The results show that the % mean accuracy is within limits to badge bench top stability as shown in table 11.
Auto sampler stability
The results confirm that the % mean accuracy is within limits to pass Auto sampler stability as shown in table 12.
Table 11: Benchtop stability of sparsentan
| QC injection | HQC | LQC | MQC |
| Concentration (ng/ml) | |||
| 180 | 18 | 120 | |
| Peak area of analyte | |||
| Mean | 3.715x10⁵ | 0.367x10⁵ | 2.504x10⁵ |
| ±SD | 0.00306 | 0.00346 | 0.00280 |
| %CV | 0.08 | 0.94 | 0.11 |
| % mean Accuracy | 97.01% | 95.83% | 98.08% |
n=6
Table 12: Auto sampler stability of sparsentan
| QC injection | HQC | MQC | LQC |
| Concentration (ng/ml) | |||
| 180 | 120 | 18 | |
| Peak area of analyte | |||
| Mean | 3.756x10⁵ | 2.484x10⁵ | 0.370x10⁵ |
| ±SD | 0.00604 | 0.00602 | 0.0588 |
| %CV | 0.16 | 0.24 | 1.59 |
| % mean Accuracy | 98.08% | 97.30% | 96.62% |
n=24
Freeze-thaw stability
As shown in fig. 11, the % mean accuracy at HQC, LQC and MQC were 97.04%, 96.88%, and 98.04% respectively. This shows acceptability of Freeze-thaw stability.
Wet extract
The % CV and mean accuracy for sparsentan were within limits. % mean accuracy at HQC, LQC, and MQC were 98.11%, 96.88%, and 97.96% respectively for 12 h and 97.06%, 96.10%, and 97.34% respectively for 18 h.
Dry extract
% mean accuracy at HQC, LQC, and MQC were 98%, 96.62%, and 98.12% respectively for 12 h and 97.27%, 95.83%, and 97.02% for 18 h.
Short term
Sparsentan's %CV and mean accuracy met the short-term stability threshold. As shown in fig. 12, the %mean accuracy at HQC, LQC, and MQC were 95.13%, 92.96%, and 94.59%, respectively.
Long term
Sparsentan's %CV and mean accuracy met the long-term stability threshold. The studies were performed on the days of 1, 7, 14, 21, 28, and found the % mean accuracy within limits.
A dose of sparsentan was administered to rats according to its body weight; samples were collected at 1.0, 2.0, 3.0, 4.0, 6.0, 8.0, 10.0 and 12.0 H post-dose. About 300 μl of blood was collected into K2 EDTA (Ethylene Diamine Tetra Acetic Acid) vacutainer tubes at each time point. To check for potential plasma interferences, we obtained a predose sample. The samples collected were centrifuged for plasma. Collected plasma was stored at-7 to 10 °C. After spiking the samples with ISTD, they were processed at different QC concentrations. Software tools were used to calculate pharmacokinetic parameters. Incurred sample reanalysis (ISR) is used to establish stability studies of the samples. Near Cmax, 2 samples from each animal were selected for ISR, and the elimination phase in the pharmacokinetic profile is as shown in fig. 13. The Percent difference should not be more than 20% for samples to be considered stable.
Table 13: Pharmacokinetic studies
| Time intervals (H) | Sparsentan (ng/ml) |
| 1.0 | 41.363 |
| 2.0 | 77.893 |
| 3.0 | 111.351 |
| 4.0 | 92.965 |
| 6.0 | 66.510 |
| 8.0 | 43.956 |
| 10.0 | 21.159 |
| 12.0 | 0 |
*Hours (H)
Table 14: Pharmacokinetic parameters of sparsentan
| Pharmacokinetic parameters | Sparsentan |
| AUC0-t | 640 ng-h/ml |
| Cmax | 113.702 ng/ml |
| AUC0-∞ | 640 ng-h/ml |
| tmax | 3.0 H |
| T1/2 | 10.0 H |
AUC0−∞: Area under the curve extrapolated to infinity, AUC0−𝑡: Area under the curve up to the last sampling time, Cmax: The maximum plasma concentration, Tmax: The time to reach peak concentration, T1/2: Time the drug concentration.
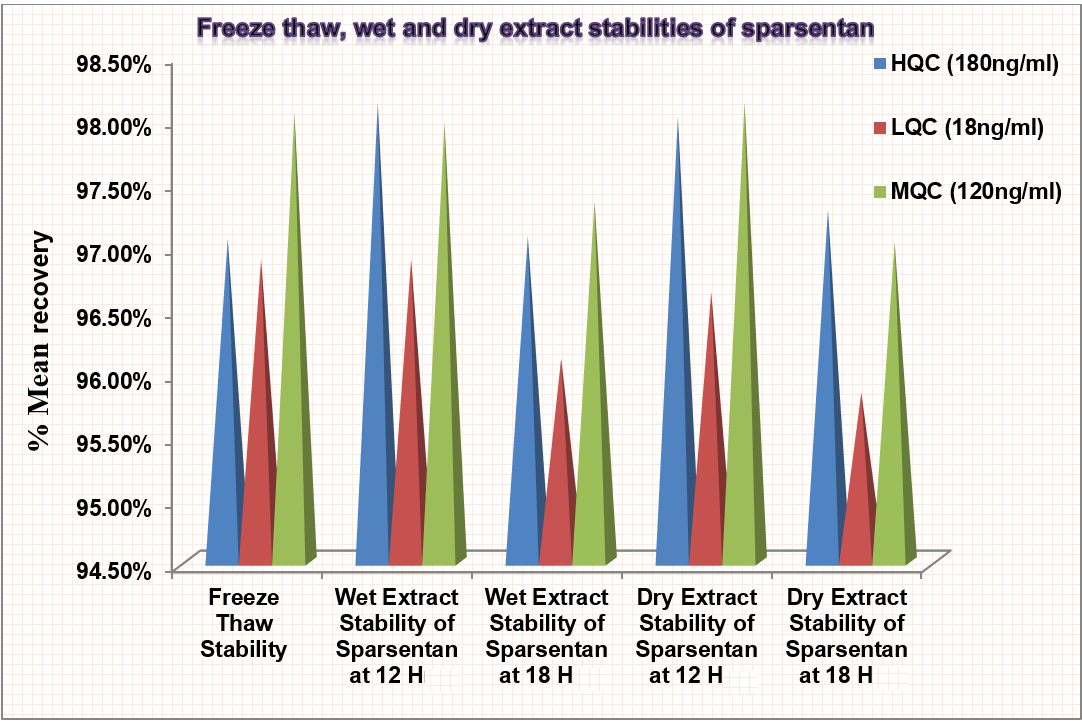
Fig. 11: Showing freeze thaw, wet and dry extract stabilities of sparsentan
Green assessment
This method shows a colourful picture divided into 12 sections on the outer ring part, and the centre shows the overall index in numerical value from 1 to 0. Every section has a score ranging from 1 to 0, where 1 indicates complete green colour and 0 indicates red colour. Towards green indicates the greenness of the method. Red indicates away from it. The software used for the analysis can be downloaded from the website mentioned by the authors in their article [22]. Our method was analysed through this technique and found the score of 0.67, which is towards greenness as shown in the fig. 17.
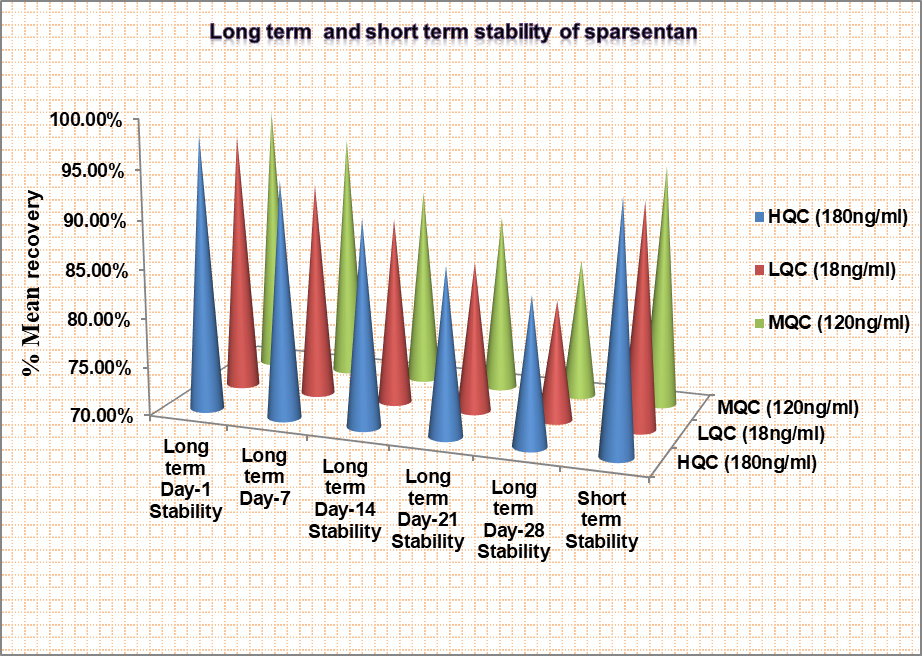
Fig. 12: Showing long-term and short-term stabilities of sparsentan
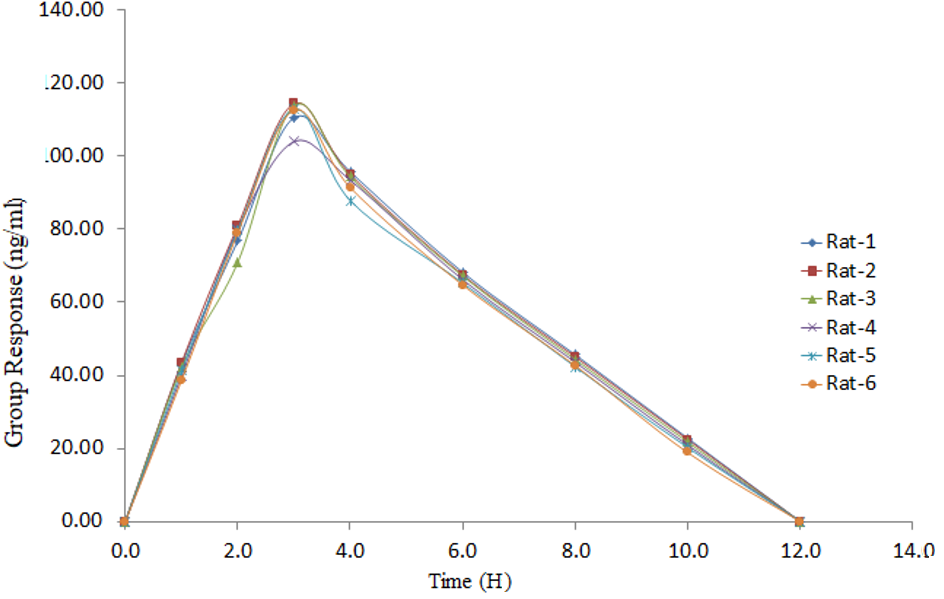
Fig. 13: Recovery plot for sparsentan in rat plasma
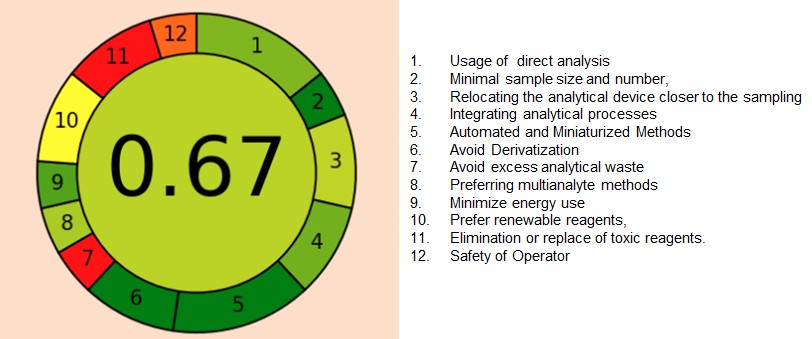
Fig. 17: Greenness evaluation of the proposed method by the AGREE tool
The above results show that sparsentan can be estimated with high accuracy and precision in biological matrices, which was a major constraint with existing methods [11-14]. The sensitivity of LC-MS is higher than that of HPLC, which is an added advantage. The Pharmacokinetic application of the study may pave a path for therapeutic drug monitoring and bioequivalence studies. Incorporating greenness assessments into analytical methods ensures they are not only effective but also environmentally friendly. These assessments help to reduce the use of hazardous chemicals, minimize waste and lower energy consumption, leading to safer laboratory practices and a smaller environmental footprint [23].
CONCLUSION
This work aimed to develop a simple LC-MS method to estimate Sparsentan, a recently approved drug in rat plasma and its application to Pharmacokinetic studies. The experimental results show that the method is cost-effective and sensitive. The method was validated for a linear concentration range of 6.0-240.0 ng/ml with a better regression coefficient. The intra-batch and inter-batch precision (%CV) across five levels of QC samples was less than 15.00. The optimised sample preparation and chromatographic conditions ensured high sensitivity and minimal matrix interference, allowing reliable quantification of sparsentan even at low concentrations. Greenness evaluation indicates that the method is environmentally cautious compared to existing methods. Future research can focus on method modifications to enable simultaneous quantification of sparsentan and its metabolites. Furthermore, this method can be adapted for therapeutic drug monitoring and bioequivalence studies to ensure optimal drug dosing in patients.
ACKNOWLEDGEMENT
I obliged to my guide for encouragement and support and I also thank Shri Vishnu college of Pharmacy for their continuous support.
FUNDING
Nil
AUTHORS CONTRIBUTIONS
Kranthi Yalla carried out research samples and prepared manuscript. Dr. A Krishnamanjari Pawar guided and reviewed manuscript. Dr Kiran supported in documentation.
CONFLICT OF INTERESTS
Authors declare that they have no conflict of interest.
REFERENCES
Donadio JV, Grande JP. IgA nephropathy. N Engl J Med. 2002 Sep 5;347(10):738-48. doi: 10.1056/NEJMra020109, PMID 12213946.
Fabiano RC, Pinheiro SV, Simoes E Silva AC. Immunoglobulin a nephropathy: a pathophysiology view. Inflamm Res. 2016 Oct;65(10):757-70. doi: 10.1007/s00011-016-0962-x, PMID 27351940.
Lai KN, Tang SC, Schena FP, Novak J, Tomino Y, Fogo AB. IgA nephropathy. Nat Rev Dis Primers. 2016 Jan 14;2(1):16001. doi: 10.1038/nrdp.2016.1, PMID 27189177.
Floege J, Rauen T, Tang SC. Current treatment of IgA nephropathy. Semin Immunopathol. 2021 Oct;43(5):717-28. doi: 10.1007/s00281-021-00888-3, PMID 34495361.
Komers R, Plotkin H. Dual inhibition of rennin angiotensin aldosterone system and endothelin-1 in treatment of chronic kidney disease. Am J Physiol Regul Integr Comp Physiol. 2016 May 15;310(10):R877-84. doi: 10.1152/ajpregu.00425.2015, PMID 27009050.
Travere Therapeutics. Travere therapeutics announces FDA accelerated approval of FILSPARI™ (sparsentan), the first and only non-immunosuppressive therapy for the reduction of proteinuria in IgA nephropathy; 2023 Feb 17. Available from: https://www.travere.san.com/news/filsprai-fda-approvaldiego:traveretherapeutics. [Last accessed on 27 Feb 2024].
Travere Therapeutics Inc. FILSPARI™ (sparsentan) tablets for oral use: US prescribing information. San Diego: Travere Therapeutics; 2023.
Vifor CS, Travere Therapeutics. CSL vifor and travere therapeutics announce EMA has accepted for review the conditional marketing authorization application for sparsentan for the treatment of IgA Nephropathy; 2022 Aug 22. Available from: https://www.com/media-releases.viforpharma.
Travere Therapeutics. Travere therapeutics announces orphan drug designation for sparsentan for the treatment of IgA nephropathy. Available from: https://www.com/news/orphan-drug-sparsentan.travere. [Last accessed on 27 Feb 2024].
Drug Bank. Sparsentan-DB12548. Drug Bank. Available from: https://go.com/drugs/db12548.
Krishna PS, Mukkanti Eswarudu M, Srinivasa Babu P, Likhitha T, Venkatesh N, Poojitha C. A review on analytical profile for newly FDA-approved drugs in 2023. JMPAS. 2023;12(4):5955-61. doi: 10.55522/jmpas.V12I4.5491.
Siva Krishna P, Eswarudu MM, Srinivasa Babu P, Likhitha T, Venkatesh N, Poojitha C. Validated stability indicating RP-HPLC method for quantification of sparsentan in pharmaceutical dosage form: a 2023 USFDA approved drug. RJC. 2024 Apr-Jun;17(2):631-41. doi: 10.31788/RJC.2024.1728805.
Gali H. A new validated method for the estimation of sparsentan in bulk and pharmaceutical dosage form by RP-HPLC. World J Pharm Sci. 2024 Feb;12(2):47-58. doi: 10.54037/WJPS.2022.100905.
Wada R, Kleijn HJ, Zhang L, Chen SC. Population pharmacokinetic analysis of sparsentan in healthy volunteers and patients with focal segmental glomerulosclerosis. CPT Pharmacometrics Syst Pharmacol. 2023 Oct;12(8):1080-92. doi: 10.1002/psp4.12996, PMID 37221817.
Ramadevi P, Rambabu K. Bioanalytical method development and validation for ezetimibe and pitavastatin and its applications to pharmacokinetic studies in rat plasma by using LC-MS/MS. Int J Res Pharm Sci. 2020;11(4):7854-62. doi: 10.26452/ijrps.v11i4.4670.
Eluru A, Surendra Babu K. Bioanalytical method development and validation for aplidine in rat plasma and their pharmacokinetic studies by LC-MS. World J Pharm Pharm Sci. 2019;8:1201-9.
Ramchandran D, Kethipalli A, Krishnamurthy M. Bioanalytical method development and validation of daunorubicin and cytarabine in rat plasma by LC-MS/MS and its application in pharmacokinetic studies. J Pharm Sci Res. 2020;12(3):381-6.
US Food and Drug Administration. M10 bioanalytical method validation and study sample analysis. Silver Spring, MD: FDA; 2022 Nov.
European Medicines Agency. Guideline on bioanalytical method validation. Clinical orthopaedics and related research. Vol. 2. London, UK: EMA; 2011 Jul 21.
Gope ER, Pottendla S, Yaparthi S. Bioanalytical approach to ensitrelvir estimation using liquid chromatography tandem mass spectrometry and its application to pharmaceutical research. Asian J Pharm Clin Res. 2025 Mar;18(3):25-9. doi: 10.22159/ajpcr.2025v18i3.53760.
Hemanth Kumar AK, Sudha V, Vijayakumar A, Padmapriyadarsini C. Simultaneous method for the estimation of bedaquiline and delamanid in human plasma using high-performance liquid chromatography. Int J Pharm Pharm Sci. 2021;13(6):36-40. doi: 10.22159/ijpps.2021v13i6.40853.
Pena Pereira F, Wojnowski W, Tobiszewski M, Agree. Analytical greenness metric approach and software. Anal Chem. 2020 Aug 18;92(15):10076-82. doi: 10.1021/acs.analchem.0c01887.
Sajid M, Plotka Wasylka J. Green analytical chemistry metrics: a review. Talanta. 2022 Feb 1;238(2):123046. doi: 10.1016/j.talanta.2021.123046, PMID 34801903.