
Int J App Pharm, Vol 17, Issue 4, 2025, 483-496Original Article
ARTIFICIAL INTELLIGENCE POWERED DESIGN OF EXPERIMENTS: OPTIMIZING ABIRATERONE ACETATE LOADED GELATIN NANOPARTICLES FOR ENHANCED ORAL BIOAVAILABILITY OF ABIRATERONE ACETATE
NALLAMUTHU M.1, UMADEVI S.*2, ANANDAN R.3
1,2Department of Pharmaceutics, School of Pharmaceutical Sciences, Vels Institute of Science, Technology and Advanced Studies (VISTAS), Pallavaram, Chennai-600117, Tamil Nadu, India. 3Department of Computer Science and Engineering, Vels Institute of Science, Technology and Advanced Studies (VISTAS), Pallavaram, Chennai-600117, Tamil Nadu, India
*Corresponding author: Umadevi S.; *Email: umadevi.sps@vistas.ac.in
Received: 03 Apr 2025, Revised and Accepted: 03 Jun 2025
ABSTRACT
Objective: The current probing aims to investigate the Artificial Intelligence (AI) powered Design of Experiments (DoE) to optimize Abiraterone acetate loaded Gelatin Nanoparticles (AGNPs) with the desired Critical Quality Attributes (CQA) for increasing oral bioavailability of abiraterone acetate.
Methods: AGNPs were formulated using the desolvation method, guided by a quality-by-design (QbD) approach, to identify CQA. The proposed DoE was a Central Composite Design (CCD) that was done to determine the influence of gelatin, tween 80, and genipin on particle size and Drug Entrapment Efficiency (DEE). Further optimization was performed with Artificial Neural Networks (ANN) to refine the predictive models.
Results: The ANN model was developed using data from the CCD. K-fold cross-validation was implemented for training and validating the model. Both training and validation sets' R-squared values were closer to 1, confirming that the algorithms correctly characterized the predictive models. Characterization studies confirmed that optimized AGNPs had particle size (123.4±0.06 nm), poly dispersibility index (0.047±0.07), DEE (88.23±0.26 %), zeta potential (+35.78±0.24 mV), and controlled drug release (96.32±0.78 % over 12 h).
Conclusion: The results show that nanoparticles developed according to the criteria set by CQA to enhance oral bioavailability, and an AI-integrated CCD approach optimally worked for AGNPs, which can deliver abiraterone acetate orally. The infusion of advanced technologies ANN undoubtedly holds excellent potential for exciting discoveries in nanomedicine and enables future innovations.
Keywords: Abiraterone acetate, Design of experiments, Gelatin nanoparticles, Artificial neural networks, Validation, Formulation optimization, Oral bioavailability
© 2025 The Authors. Published by Innovare Academic Sciences Pvt Ltd. This is an open access article under the CC BY license (https://creativecommons.org/licenses/by/4.0/)
DOI: https://dx.doi.org/10.22159/ijap.2025v17i4.54437 Journal homepage: https://innovareacademics.in/journals/index.php/ijap
INTRODUCTION
Carcinoma of the prostate is the second-greatest cause of cancer-related mortality in men [1]. The FDA authorized abiraterone acetate in 2011, and it is typically used when combined with prednisone to treat prostate cancer patients [2]. The active abiraterone is produced by the hydrolysis of abiraterone acetate after oral ingestion. This drug selectively and strongly inhibits the CYP17A1 microsomal enzymes, which are implicated in multiple pathways of androgen production. Prostate cancer patients seem to benefit greatly from the medicine in terms of living longer [3, 4].
Abiraterone acetate is marketed under the Zytiga® brand. Zytiga® has demonstrated clinical and commercial success; oral administration of abiraterone acetate is extremely challenging. Abiraterone acetate is classified as the fourth category of the Biopharmaceutical Classification System (BCS). The substances are poorly soluble in water and are not effectively absorbed from the gastrointestinal tract. The oral bioavailability of abiraterone acetate in humans is predicted to be less than 10 % due to these characteristics; hence, a substantial daily dosage of 1000 mg (four 250 mg tablets once a day) is required to reach therapeutic blood levels, which elevates the probability of forgetting doses [5]. Therefore, abiraterone acetate is essential to develop a polymeric nanoparticulate drug delivery system that enhances solubility and dissolution, controls the drug release, oral bioavailability, and reduces dosing frequency.
Polymeric nanoparticles have emerged as a promising drug delivery system for improving the solubility, stability, and oral bioavailability of poorly soluble drugs. These nanoparticles, made from biodegradable and biocompatible polymers, address many issues associated with conventional drug formulations by significantly increasing drug dissolution and absorption [6]. Additionally, by utilizing controlled release mechanisms and other targeting strategies, polymeric nanoparticles offer a powerful approach to developing more effective oral drug formulations [7]. Gelatin was chosen as the preferred polymer for this research because of its desirable properties in drug delivery systems. It has good drug-loading capacity, particularly for hydrophobic and poorly soluble drugs. Gelatin also allows for controlled release of drugs through enzymatic degradation under physiological conditions, improving therapeutic efficacy while preserving biocompatibility [8]. In contrast, Poly-lactic-co-glycolic acid is commonly employed for sustained release but can form an acidic microenvironment through degradation to lactic and glycolic acids, destabilizing acid-sensitive drugs [9]. Chitosan, although providing mucoadhesion and controlled release, has poor solubility at physiological pH, which can limit its utility in systemic delivery. Hence, due to its natural origin, regulatory acceptance, biocompatibility, and effective encapsulation of hydrophobic drugs, gelatin is a better and appropriate polymer for the formulation of abiraterone acetate-loaded nanoparticles [10].
A critical step in the design of a polymeric nanoparticle is formulation optimization [11]. Various methods and strategies can be implemented to create input variable composition in nanoparticle development. The traditional method, which is most frequently used, involves modifying one independent variable or component while maintaining the remaining variables unchanged to observe how composition or process variables affect quality attributes. Nevertheless, this method necessitates a lot of research studies, and it proves difficult to fig. out how input components interact with output. It's also possible to misunderstand the experiment results [12]. One of the most popular statistical methods for examining significant quality parameters that influence product creation is the Design of Experiments (DoE). Using the DoE techniques, like Central Composite Design (CCD), throughout the design and development phase could help solve this issue by concurrently identifying the interconnected impact of many factors that affect the outputs' quality [13]. Based on several important quality parameter criteria, it can also progressively optimize the entire formulation. DoE is a suitable technique for correlating formulation and process attributes with the pharmaceutical product's vital quality factors in the development of pharmaceuticals. This method makes it more straightforward to understand a process and establishes its ideal operating state [14, 15].
Artificial Intelligence (AI) is revolutionizing the optimization of nanoparticle formulations by minimizing experimental efforts, increasing accuracy, and speeding up the identification of the best formulations [16]. Techniques powered by AI, including Machine Learning (ML), deep learning, and evolutionary algorithms, assist in forecasting nanoparticle characteristics, fine-tuning synthesis conditions, and improving the efficiency of drug delivery [17]. Artificial Neural Networks (ANN) are a type of ML technique and have gained recognition and interest among formulation scientists as one of the most potent computational tools ever created since the early age [18]. The computational approach has biological inspiration and can mimic the brain's experience-based memorization mechanism. When given partial or incomplete input, an ANN can nevertheless make decisions and conclude. It can be utilized for both non-numeric and numerical computations [19]. ANN's superior fitting and prediction capabilities make it a multi-variable simultaneous optimization strategy that is relatively more powerful than other conventional methods for pharmaceutical formulation optimization [20]. Nowadays, the ANN-powered DoE plays a crucial role in optimizing nanoparticle formulation by enhancing efficiency, precision, and decision-making. By integrating AI with DoE, researchers can streamline formulation development, reduce experimental costs, and achieve robust, high-quality nanoparticle products [21-23].
Quality by Design (QbD) is a comprehensive strategy of drug development employed to ensure the quality of the product through the design and development controls of the formulation and manufacturing process [24]. The Quality Target Product Profile (QTPP) is an essential aspect of QbD that details the expected quality characteristics of a nanoparticle-based drug product. It is the general layout made to achieve formulation-based development and regulatory compliance. They act as scaffolding in the development of high-quality nanoparticle-based drug formulations. The key product attributes are determined early in development, thus assuring efficacy, safety, stability, and regulatory compliance for best therapeutic outcomes [25, 26].
This study, using gelatin as the biodegradable polymer, aims at developing polymeric nanoparticles of abiraterone acetate to overcome its biopharmaceutical barriers. A QbD-based study will reveal the Critical Quality Attributes (CQA) and Critical Process Parameters (CPP). The ANN-powered DoE was used in the critical factor identification and optimization of Abiraterone acetate-loaded Gelatin Nanoparticles (AGNPs) with desired CQA to promote oral bioavailability of abiraterone acetate.
MATERIALS AND METHODS
Materials
Sun Pharmaceutical Industries Ltd in India provided a gift sample of abiraterone acetate. Dialysis membrane and gelatin type A, and Genipin were purchased from Hi Media, Mumbai. Other chemicals are used as analytical grades.
Methods
Assignment of QTPP for AGNPs
The proper selection and deployment of QTPP, along with the constructive description for optimizing the potential benefits of the developed formulation, signified the first stage of the QbD approach. The CQA for nanoparticles ought to yield a product that satisfies the pertinent requirements and is repeatable and accurate [27].
Risk assessment
The CPP considerably impacts the CQA that was discovered via risk assessment studies. A fishbone diagram was adopted to detect high-risk issues that might affect the finished formulation's quality. The list specifies the significant CPP for developing nanoparticles [28].
Formulation of nanoparticles
The AGNPs were prepared using the desolvation method [29, 30]. Gelatin type a (155.8 mg) was dissolved in 10 ml of distilled water at 45 °C under magnetic stirring (Remi 2 MLH). Abiraterone acetate (250 mg) was dissolved in 10 ml of ethanol. The abiraterone acetate and gelatin solution were combined, and the pH level was adjusted to four using dilute hydrochloric acid, with continuous monitoring by a calibrated digital pH meter (Eutech Instruments) under magnetic stirring. Tween 80 (5%) was added to the gelatin-abiraterone solution while stirring magnetically. The solution was stirred at 500 rpm using a magnetic stirrer (Remi 2 MLH) in a 100 ml borosilicate glass beaker at room temperature. 10 ml of acetone was added dropwise to the abiraterone acetate-gelatin solution, initiating nanoparticle formation due to dehydration and precipitation of gelatin. Stirring was maintained for 60 min to ensure uniform nanoparticle formation. Genipin (1.5%) was then added dropwise. Stirring continued for 12 h at 500 rpm to allow the nanoparticles to cross-link. The generated solution was centrifuged at 10,000 ×g for 30 min using a Remi R-24 centrifuge with a fixed-angle rotor, discarding the supernatant solution and collecting the precipitate, which was dried at room temperature and stored in a refrigerator for subsequent evaluation investigations.
Experimental design
The ASNPs were prepared using JMP software, utilizing a 17-run, 3-factor, 2-level CCD as depicted in table 1. The gelatin (A), tween 80 (B), and genipin (C) were chosen as the independent factors based on the preliminary study, and their impacts were investigated on the dependent variables of particle size and Drug Entrapment Efficiency (DEE).
Table 1: Selection of input variables and their level for the CCD
| Input variable | Levels | |
| Low | High | |
| A-Gelatin (mg) | 100 | 200 |
| B-Tween 80 (mg) | 1 | 5 |
| C-Genipin (%) | 1 | 3 |
| Response variables | Goal | |
| Y1-Particle size (nm) | Minimize | |
| Y2-DEE (%) | Maximize | |
CCD: Central composite design, DEE: Drug entrapment efficiency.
AI-powered DoE for formulation optimization, prediction profiler development
The JMP Pro 18 software was used to optimize the input variable composition formula via ANN-powered CCD. A total of 1000 simulation runs were created using the CCD data. To ascertain the prediction capabilities of the ANN analysis, the simulated CCD data was divided into training and validation sets, and K-fold cross-validation was employed to validate the predictive model [21-23, 31].
Characterization of optimized AGNPs
Drug polymer compatibility studies
The FT-IR spectroscopic assessment was executed using a Shimadzu FTIR Spectrophotometer, and investigating the drug-polymer compatibility, the KBR pellet method was used to capture the FTIR spectra of pure abiraterone acetate, gelatin, and optimized AGNPs. The spectra were taken at a range of 4000 cm−1 to 400 cm−1.
X-ray diffraction studies (XRD)
A powder X-ray diffractometer has examined the XRD images of the pure abiraterone acetate and optimized AGNPs.
Determination of particle size and zeta potential
Using a Malvern Zeta Sizer, the particle size and zeta potential of AGNPs were assessed. In short, the AGNPs were diluted 1:100 times with water, and the measurement of particle size, Poly Dispersity Index (PDI), and zeta potential was conducted at 25 °C [32].
Determination of DEE
The 10 mg of AGNPs were mixed with 10 ml of phosphate buffer and then centrifuged for 30 min at 10,000 rpm. The unentrapped abiraterone acetate was extracted from the nanoparticles by collecting the supernatant fraction and filtered (0.45 μm membrane), suitably diluted with phosphate buffer. The amount of unentrapped abiraterone acetate in the nanoparticles was determined by UV spectrometric detection at a wavelength of 252 nm [33]. To calculate the DEE, the following formula was applied,
In vitro drug release
The in vitro release of abiraterone acetate from optimized nanoparticles and commercial product (Zytiga®), pure drug suspension, has been studied using USP dissolving equipment II (paddles) [34]. The commercial product and optimized AGNPs (equivalent to 250 mg of abiraterone acetate) were dispersed in 2 ml phosphate buffer (pH 7.4) and filled with a dialysis bag, 2 ml of pure drug suspension filled in a dialysis bag and three samples were separately put inside the dissolving tester containing 900 ml of phosphate buffer (pH 7.4). To control sink conditions and temperature, this instrument was fitted in an outside water bath. The testing procedure proceeded with stirring at 100 rpm and 37±0.5 °C. The release medium was collected and replaced with a new buffer solution in a dissolving vessel at predefined intervals. After sampling and filtering 10 ml of the dissolving medium using a membrane filter (0.45 μm), the concentration of abiraterone acetate in the filtrate was measured using UV spectrophotometry at a wavelength of 252 nm.
Surface morphology
The surface morphology of optimized AGNPs and pure abiraterone acetate has been studied using a scanning electron microscope. Using an accelerating voltage of 10 kV, photomicrographs were made of the sample at various magnifications using a piece of double-sided sticky tape coated with gold.
Short-term stability study
The optimized AGNPs were subjected to accelerated stability studies following the International Conference on Harmonization (ICH) Q1A (R2) specifications [35]. Optimized AGNPs were preserved at 40±2 °C and 75±5 % relative humidity in a polyethylene strip. The formulation was taken out at periods of 0, 1, 2, and 3 mo and examined for all of the following qualities: particle size, PDI, DEE, zeta potential, and in vitro drug release.
RESULTS AND DISCUSSION
Assignment of QTPP for AGNPs
The CQA of AGNPs was discovered via QTPP. The purpose of AGNPs was to enhance the oral bioavailability of abiraterone acetate. Considering that the procedure used to prepare AGNPs was predictable and reproducible, the end result satisfies CQA for pharmaceuticals. The QTPP, listed in table 2, includes the reasons behind their selection.
Table 2: QTPP earmarked for AGNPs
| QTPP | Target | Reason |
| Particle size | Less than 400 nm |
|
| PDI | Less than 0.3 |
|
| DEE | High drug entrapment |
|
| Zeta potential | more than ±30 mV |
|
| Dissolution | Controlled drug release |
|
| Stability | At room temperature for at least ninety days |
|
AGNPs: Abiraterone acetate loaded gelatin nanoparticles, QTPP: Quality target product profile, DEE: Drug entrapment efficiency.
Risk assessment
The Ishikawa chart evolved to systematize the risk assessment procedure, identifying subcases and justifications that impact the CQAs. The Ishikawa (fishbone) graph for AGNP is presented in fig. 1, demonstrating an interaction between all potential variables impacting AGNP of CQAs. Under risk assessment experiments and an overview of the literature, CPP such as gelatin, tween 80, and genipin were decided to be crucial since these variables carry a high risk on selected critical quality attributes (Particle size, DEE).
Experimental design
The impact of different input variables on output variables was investigated in the current research using the CCD technique. The statistical program JMP Pro 18 was used to carry out the experiment design. Table 1 displays the independent variables and their levels, while table 2 displays the response variable observations. A total of 17 runs of experiments were given by CCD and each formulation was designed per those runs.
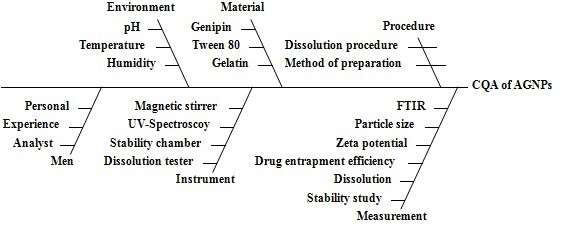
Fig. 1: Ishikawa fishbone diagram to recognize significant variables affecting AGNPs. AGNPs: Abiraterone acetate loaded gelatin nanoparticles, CQA: Critical quality attributes
Table 2: Composition of AGNPs by CCD
| Run | Input variables | Response variables | |||
| A: Gelatin (mg) | B: Tween 80 (%) | C: Genipin (%) | Y1: Particle size (nm) | Y2: DEE (%) | |
| 1 | 150 | 3 | 2 | 320.8±0.53 | 75.64±0.25 |
| 2 | 200 | 3 | 3 | 200.5±0.88 | 80.91±0.38 |
| 3 | 100 | 3 | 1 | 462.3±0.32 | 68.03±0.64 |
| 4 | 100 | 3 | 3 | 462.3±0.11 | 68.85±0.48 |
| 5 | 150 | 3 | 2 | 320.8±0.76 | 75.64±0.17 |
| 6 | 150 | 1 | 1 | 562.3±0.34 | 69.98±0.69 |
| 7 | 150 | 3 | 2 | 320.8±1.02 | 75.46±0.38 |
| 8 | 200 | 3 | 1 | 200.5±0.12 | 80.91±0.94 |
| 9 | 200 | 5 | 2 | 128.3±0.03 | 85.36±0.75 |
| 10 | 150 | 3 | 2 | 320.8±0.49 | 75.64±0.38 |
| 11 | 100 | 1 | 2 | 800.2±0.96 | 60.08±0.36 |
| 12 | 150 | 1 | 3 | 562.3±0.43 | 70.59±0.05 |
| 13 | 100 | 5 | 2 | 750.1±0.53 | 71.49±0.46 |
| 14 | 150 | 3 | 2 | 320.8±1.34 | 75.64±1.06 |
| 15 | 150 | 5 | 3 | 200.4±0.65 | 83.87±0.83 |
| 16 | 200 | 1 | 2 | 640.8±0.42 | 65.73±1.03 |
| 17 | 150 | 5 | 1 | 203.1±0.08 | 83.28±0.38 |
AGNPs: Abiraterone acetate loaded gelatin nanoparticles, CCD: Central composite design, DEE: Drug entrapment efficiency. All values are presented as mean±standard deviation (n = 3)
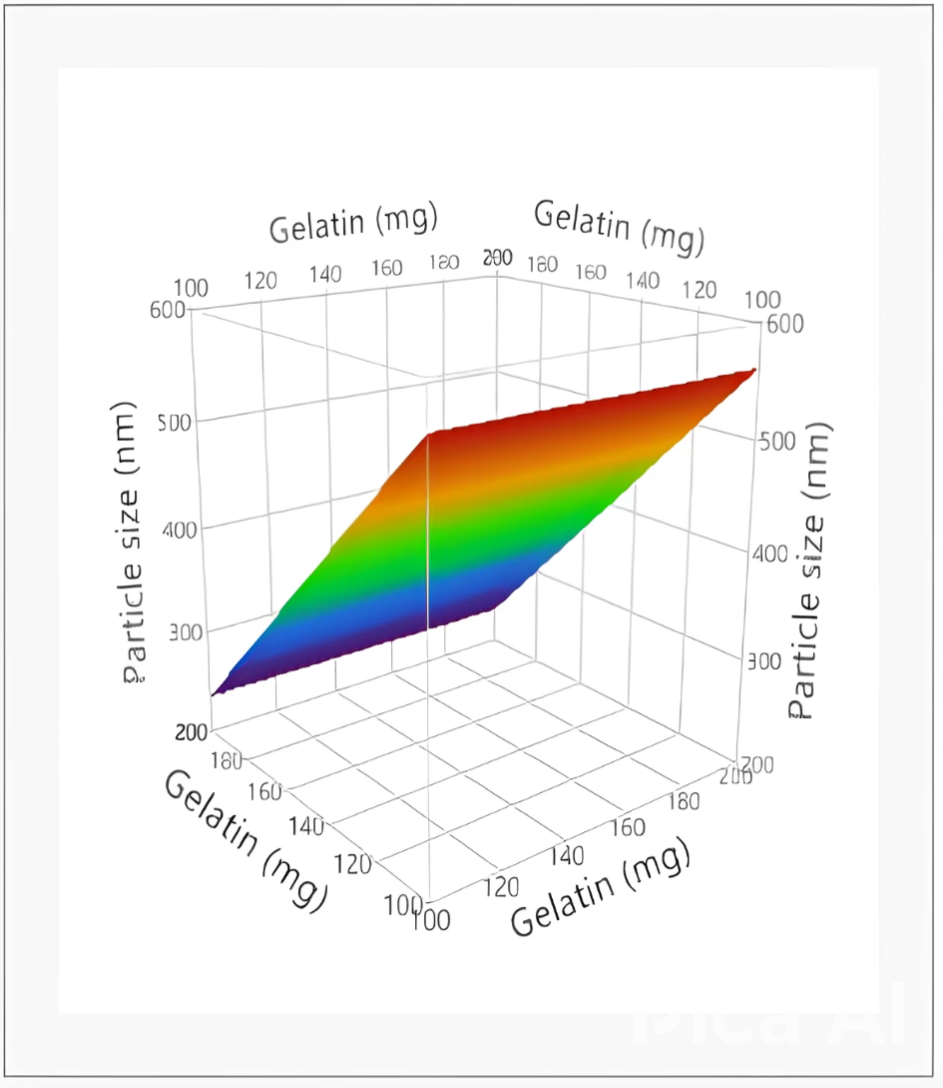
Fig. 2: 3D surface plots for gelatin against particle size of AGNPs. AGNPs: Abiraterone acetate loaded gelatin nanoparticles
Effect of input factor against particle size
The prepared AGNPs' particle size ranged from 128.3±0.03 nm to 750.1±0.53 nm. Therefore, a higher quantity of gelatin leads to a higher AGNPs particle size. However, a lower amount of gelatin possessed the opposite effect (fig. 2). The size of the AGNPs declined as once increased tween 80 concentration. Inversely, as a con of tween 80 concentration increases, the relationship reverses (fig. 3). Higher crosslinker concentrations (genipin) lead to larger particles. Conversely, lowering the concentration of genipin results in smaller particles (fig. 4). Pareto plot analyses revealed that the input factors (gelatin, tween 80, and genipin) directly influence the size of nanoparticle development (fig. 5).
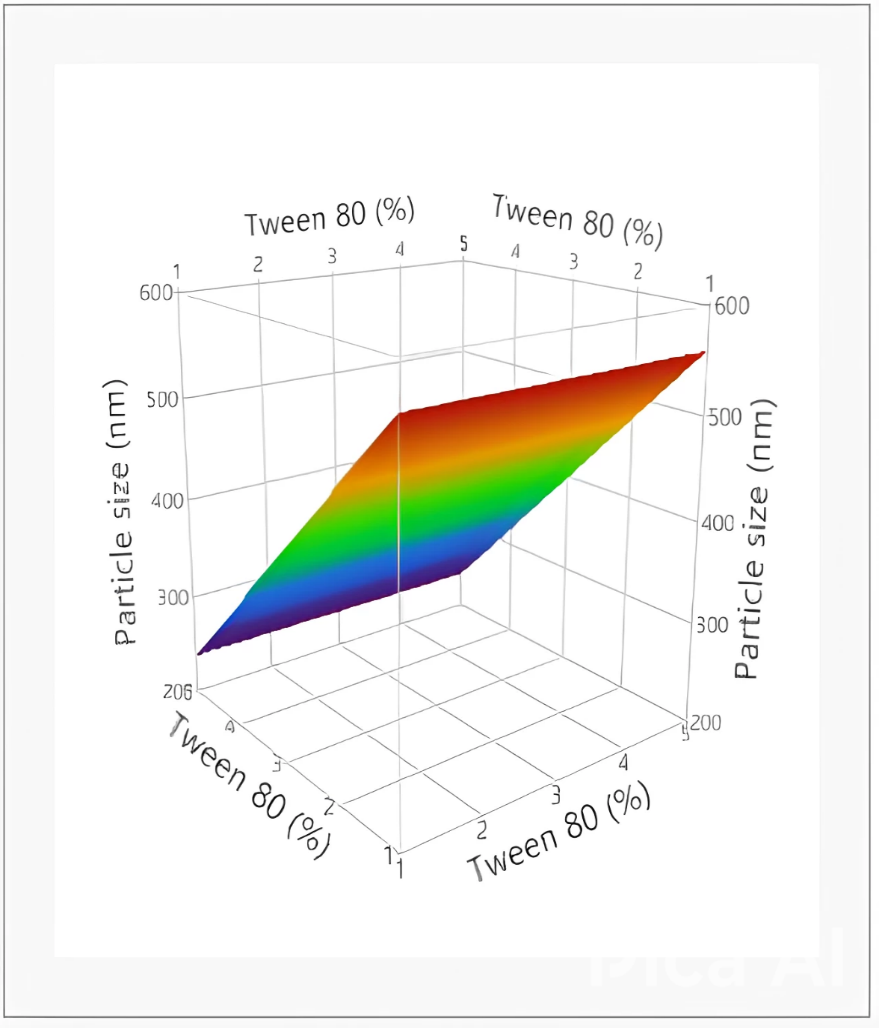
Fig. 3: 3D surface plots for tween 80 against particle size of AGNPs. AGNPs: Abiraterone acetate loaded gelatin nanoparticles
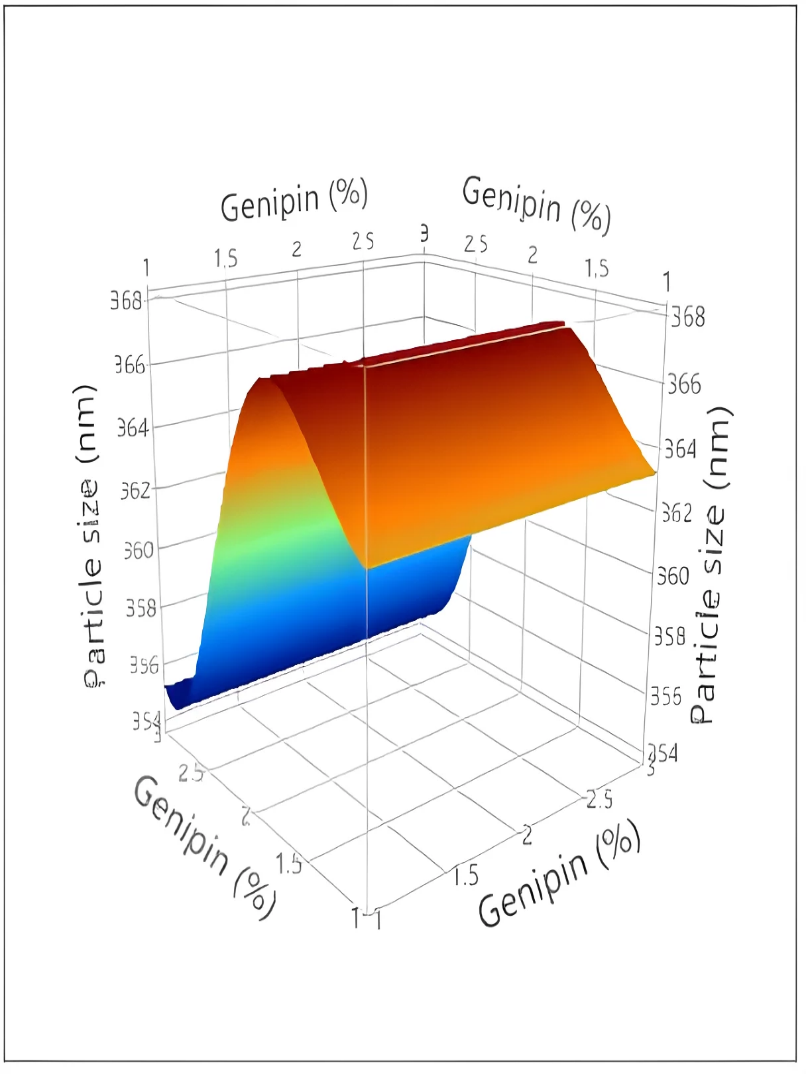
Fig. 4: 3D surface plots for genipin against particle size of AGNPs. AGNPs; Abiraterone acetate loaded gelatin nanoparticles
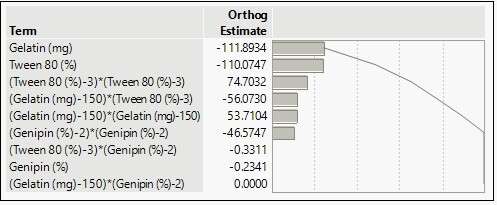
Fig. 5: Pareto plot analysis for the impact of input factor against particle size
Effect of input factor against DEE
The prepared AGNPs' DEE ranged from 60.08±0.36 % to 85.36±0.75 %. Therefore, a higher quantity of gelatin leads to a higher drug entrapment in prepared nanoparticles. However, a lower amount of gelatin possessed low drug entrapment in prepared nanoparticles (fig. 6). The drug entrapment in AGNPs increased as one increased the Tween 80 concentration. Inversely, as a con of the tween 80 increases, the relationship reverses (fig. 7). Higher crosslinker concentrations lead to higher drug entrapment. Conversely, lowering the concentration of genipin results in lower drug entrapment in prepared nanoparticles (fig. 8). Pareto plot analyses indicated that the input factors (gelatin, Tween 80, and genipin) significantly impact drug entrapment in nanoparticle development (fig. 9).
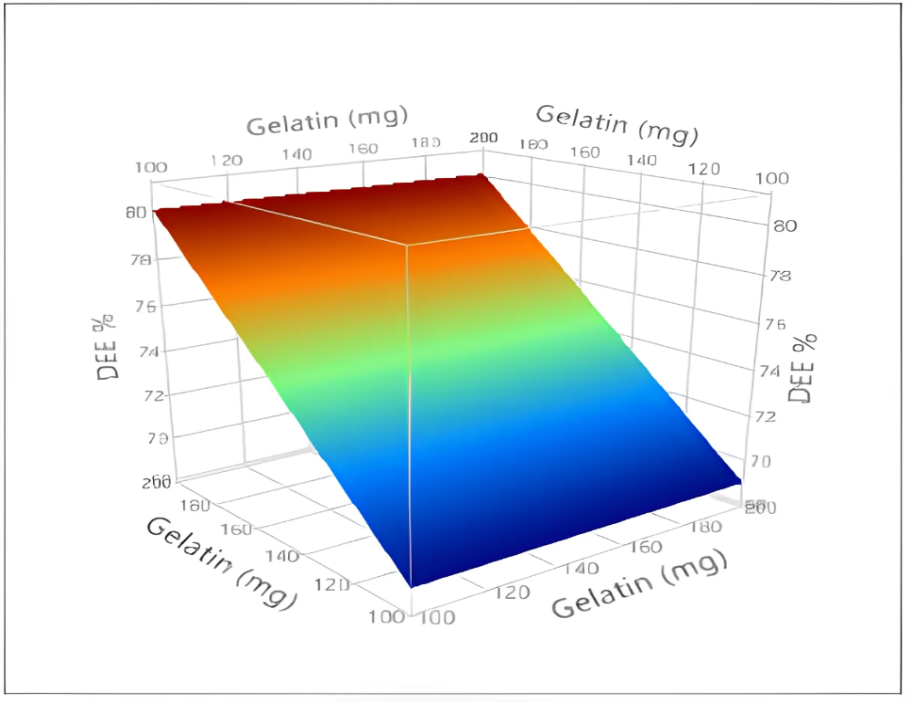
Fig. 6: 3D surface plots for gelatin against DEE. DEE: Drug entrapment efficiency

Fig. 7: 3D surface plots for tween 80 against DEE, DEE: Drug entrapment efficiency
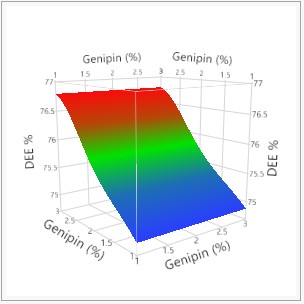
Fig. 8: 3D surface plots for genipin against DEE, DEE: Drug entrapment efficiency
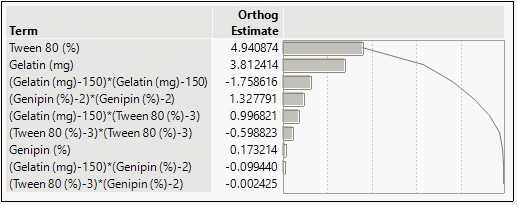
Fig. 9: Pareto plot analysis for the impact of input factor against DEE. DEE: Drug entrapment efficiency
Statistical analysis of CCD
The response variables were subjected to an ANOVA analysis, which is always necessary for evaluating the applicability and validity of the mathematical models response surface methodology recommends. The model was considered significant when the regression coefficient (R2) was more than 0.85 and the probability value (P) was 0.05 or less. According to the ANOVA, all selected response parameters had P<0.05, and the R2 value is closer to 1, confirming that the chosen model was significant (table 3). The impact of each factor against responses was measured using the polynomial model, which confirmed a non-linear relationship between each factor and responses, as the model fit study reported. Thus, the CCD was perfect for the aforementioned study with a suitable model fit.
Table 3: Statistical analysis of response variables
|
||||||
| Source | Sum of squares | Degrees of freedom | mean square | F-value | p-value | R2 |
| Model | 6.531E+05 | 9 | 72562.57 | 44.40 | <0.0001 | 0.9828 |
| A-Gelatin | 2.128E+05 | 1 | 2.128E+05 | 130.24 | <0.0001 | |
| B-Tween 80 | 2.060E+05 | 1 | 2.060E+05 | 126.04 | <0.0001 | |
| C-Genipin | 0.9316 | 1 | 0.9316 | 0.0006 | 0.9816 | |
| AB | 53451.13 | 1 | 53451.13 | 32.71 | 0.0007 | |
| AC | 0.0000 | 1 | 0.0000 | 0.0000 | 1.0000 | |
| BC | 1.86 | 1 | 1.86 | 0.0011 | 0.9740 | |
| A² | 45720.77 | 1 | 45720.77 | 27.98 | 0.0011 | |
| B² | 1.009E+05 | 1 | 1.009E+05 | 61.76 | 0.0001 | |
| C² | 36876.43 | 1 | 36876.43 | 22.56 | 0.0021 | |
|
||||||
| Model | 768.31 | 9 | 85.37 | 96.34 | <0.0001 | 0.9920 |
| A-Gelatin | 247.09 | 1 | 247.09 | 278.86 | <0.0001 | |
| B-Tween 80 | 415.01 | 1 | 415.01 | 468.37 | <0.0001 | |
| C-Genipin | 0.5100 | 1 | 0.5100 | 0.5756 | 0.4728 | |
| AB | 16.89 | 1 | 16.89 | 19.06 | 0.0033 | |
| AC | 0.1681 | 1 | 0.1681 | 0.1897 | 0.6763 | |
| BC | 0.0001 | 1 | 0.0001 | 0.0001 | 0.9918 | |
| A² | 54.48 | 1 | 54.48 | 61.48 | 0.0001 | |
| B² | 7.58 | 1 | 7.58 | 8.56 | 0.0222 | |
| C² | 29.97 | 1 | 29.97 | 33.83 | 0.0007 | |
DEE: Drug entrapment efficiency.
Implementation of ANN model for formulation optimization, prediction profiler development
Formulation optimization was performed with ANN to refine the predictive models. In recent years, more complex assessments and nonlinear relationships have been carried out leveraging the AI model, potentially circumventing some of the DoE technique's limitations. The ability of ANNs to interpret complex data, identify trends, and generate prediction models renders them superior to DoE. Additionally, a single model may predict multiple results at once.
The JMP 18 software optimized the input composition formula via ANN-powered CCD. Gelatin, tween 80, and genipin are the selected independent parameters found in the input layer. In contrast, particle size and DEE are found in the output. The 1000 simulation runs were generated using the trained ANN model as a predictive surrogate based on the original CCD data (17 experimental runs). These additional runs were not real experiments but synthetic predictions obtained by generating a uniformly random sample of 1000 input combinations within the design space boundaries defined by the CCD. Feeding these synthetic inputs into the trained ANN model to predict corresponding output responses. The complete raw data from all 1000 ANN simulation runs is available in the supplementary file. To prevent major biases, the dataset had been thoroughly cleaned and standardized before building the prediction model. A three-input layer, three-node, and one-hidden-layer neural network was used to train the output variables individually (fig. 10). The hidden layer consists of three neurons (indicated by the three green circular nodes with activation symbols. K-fold cross-validation was applied for splitting the CCD data into training and validation testing sets to determine the ANN analysis's capabilities for prediction.
The hyperbolic tangent function (TanH) is implemented activation function at every hidden layer node. The number of tours and learning rate during the training process were set at 1 to 0.1, respectively. The k-fold strategy was used to validate the training process, and K subsets were generated from the original data (K = 10). The model's fit has been verified on the remaining data using each of the K sets to fit a total of K models. The predictive model fit was selected according to the model that generated the most accurate validated statistics; Both training and validation sets' R-squared values were closer to 1, lower Root mean square errors for training and validation sets, confirming that the algorithms were correctly characterizing the data used in training while precisely estimating the data that was not used for training (table 4).
The prediction profiler is the most straightforward approach to anticipating the response surface. It contributes to selecting the optimal formulation composition according to intended outcomes after validating the data. Prediction values for the respective CQAs are presented in every plot or graph separately. This prediction chart reveals the probable variance of response if one variable has been slightly altered while all other variables remain the same. The prediction profiler for particle size and drug entrapment efficiency is displayed in Fig.11. The Y-axis depicts the response parameters, while the X-axis indicates the concentration of the factors. For optimal formulation composition, the horizontal and parallel lines represent the anticipated outcomes of the factors.
The prediction profiler was used to pick the best-optimized AGNP formula because it exhibits a high desirability function (0.9303) as seen in fig. 11. The composition of the optimized AGNP formulation included gelatin (155.8 mg), tween 80 (5 %), and genipin (1.5 %) [36]. The formulation demonstrated the expected values for particle size (125.1 nm) and drug entrapment efficiency (84.50 %) as depicted in fig. 11.
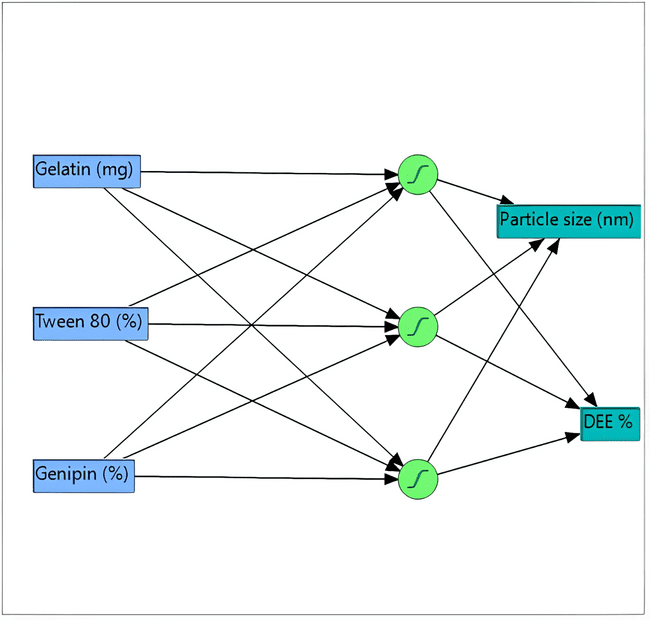
Fig. 10: ANN for particle size, DEE. ANN: Artificial neural networks, DEE: Drug entrapment efficiency
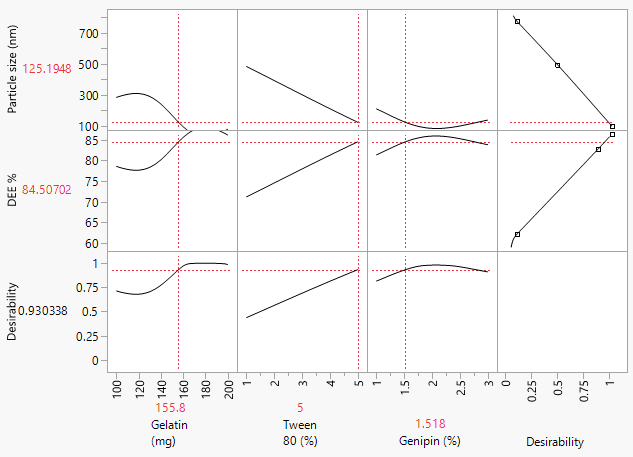
Fig. 11: Prediction profiler for AGNPs. AGNPs: Abiraterone acetate loaded gelatin nanoparticles, DEE: Drug entrapment efficiency
Table 4: The training and validation results of neural networks
| Parameter | Particle size DEE | |||
| Training set | Validation set | Training set | Validation set | |
| R square | 0.9231 | 0.9460 | 0.9040 | 0.9549 |
| Root mean square error | 2.61 | 0.61 | 1.92 | 2.08 |
| mean absolute deviation | 1.99 | 0.61 | 1.62 | 2.00 |
| Log-likelihood | 35.69 | 1.85 | 31.11 | 4.30 |
| Error sum of squares | 102.42 | 0.7490 | 55.60 | 8.68 |
| Generalized R2 reports | ||||
| Measures | R2 | |||
| Training set | 0.9983 | |||
| Validation set | 0.9970 | |||
DEE: Drug entrapment efficiency
Confirmation of the optimized formula predicted by the CCD-ANN
Our research findings also demonstrated that the synthesized AGNPs achieved the optimization scenario as anticipated by the CCD-ANN. Table 5 demonstrates that the ANN-CCD design's validity was verified by comparing predicted and observed outcomes.
Comparison of ANN vs traditional CCD
Run 9 of the CCD design produced good results in the experimental design space. Upon the inclusion of ANN, the model predicted an optimized formulation with potentially better characteristics compared to traditional CCD (table 6). For the confirmation of the prediction ability of the CCD-ANN model, experimental trials were performed using the formulation predicted by the ANN. The observed values closely agreed with the predicted values, establishing the model's reliability. This comparison supports the fact that the ANN model improves prediction and offers a better optimization method than CCD alone.
Evaluation of optimized nanoparticles
Particle size and zeta potential
The optimized AGNPs exhibited a Z-average particle size of 123.4±0.06 nm, as depicted in fig. 12. The optimized AGNPs particle size is smaller than 400 nm, since this could increase the nanoparticles' time in the bloodstream and allow for the specific targeting of malignant cells through improved permeability and retention [37]. In optimized AGNPs, the measured PDI (0.047±0.07) is less than 0.3, which indicates good particle stability and homogeneity in AGNPs. This results in improved cell uptake and more consistent and predictable drug release, essential for targeted and controlled drug administration. The measured particle size, PDI, satisfies QTPP.
The ANN-recommended optimized AGNPs exhibited a high zeta potential (+35.78±0.24 mV) as depicted in fig. 13. The optimized nanoparticle is positively charged, has a high zeta potential, and meets the necessary QTPP. Consequently, it makes it easier for them to interact with the negatively charged mucous membranes surrounding the gastrointestinal tract, facilitating better drug retention and absorption. The optimized AGNP's comparatively high zeta potential indicated that the surface was highly charged, which caused the particles to experience intense electrostatic repulsion. The particles are forced to be free by this repulsion, which stops them from aggregating. This distribution can improve solubility and dissolution by increasing surface area [38].
Table 5: Confirmation of the CCD-ANN predicted optimized formula
| Response variable | Predicted value | Observed value | Residual value |
| Particle size | 125.1 nm | 123.4±0.06 nm | -1.7 |
| DEE | 84.5 % | 88.23±0.26 % | -3.73 |
DEE: Drug entrapment efficiency, CCD: Central composite design, CCD-ANN: Central composite design powered by design of experiments
Table 6: Comparison of ANN vs traditional CCD
| Response variable | CCD optimized formula (Run 9) | CCD-ANN optimized formula |
| Particle size | 128.3±0.03 | 123.4±0.06 nm |
| DEE | 85.36±0.75 | 88.23±0.26 % |
DEE: Drug entrapment efficiency, CCD: Central composite design, CCD-ANN: Central composite design powered by design of experiments.
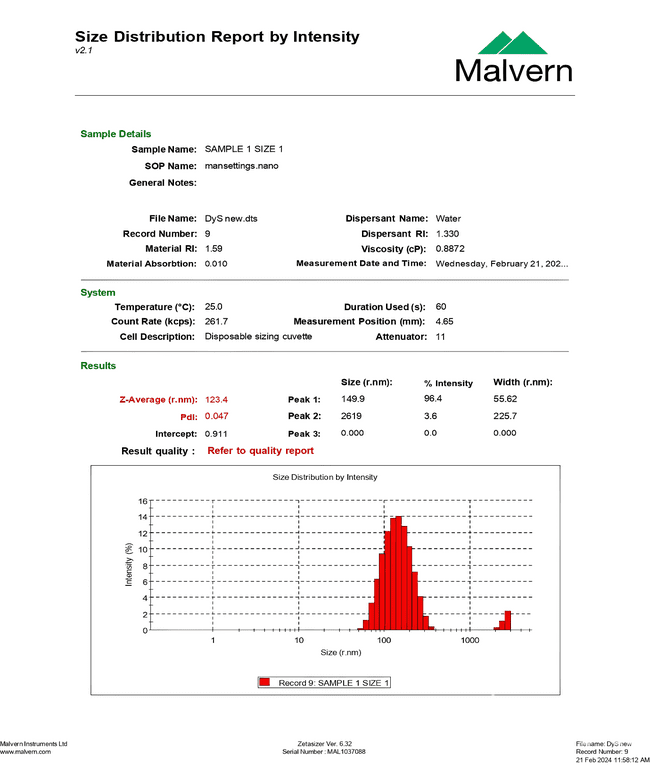
Fig. 12: Particle size of optimized AGNPs. AGNPs: Abiraterone acetate loaded gelatin nanoparticles
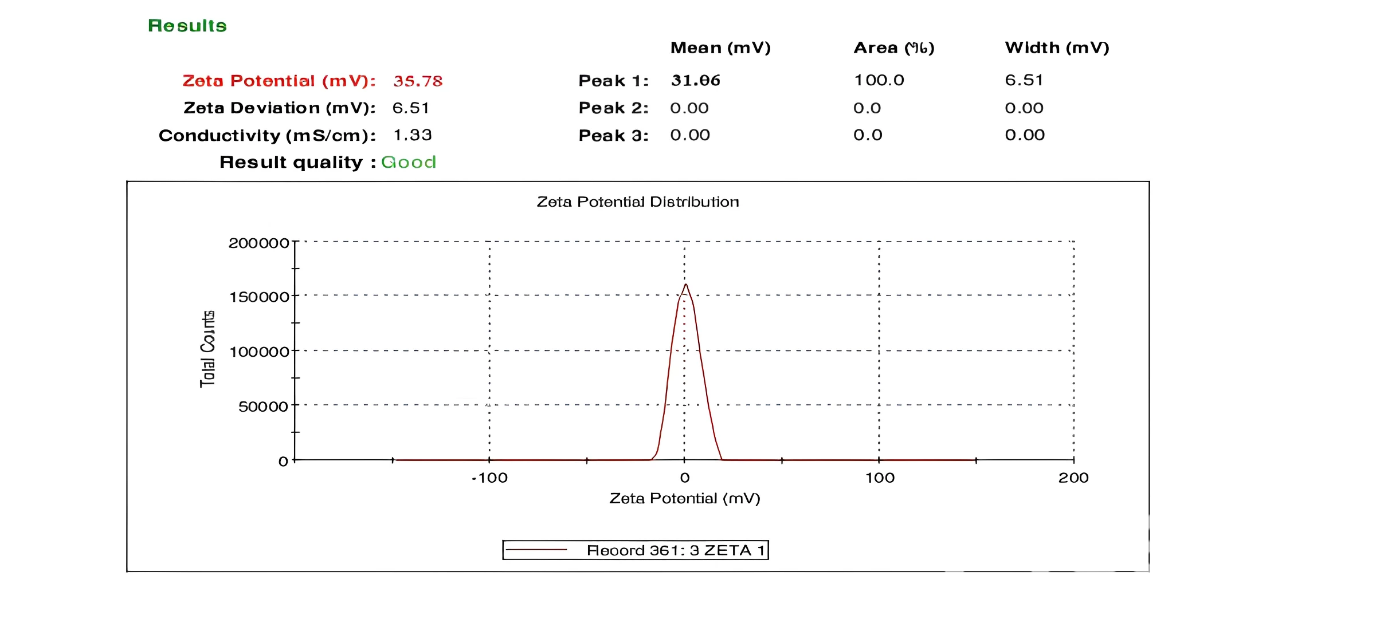
Fig. 13: Zeta potential of optimized AGNPs. AGNPs: Abiraterone acetate loaded gelatin nanoparticles
Determination of DEE
The optimized AGNPs achieve the QTPP target while exhibiting a high drug entrapment rate (88.23±0.26 %). Therefore, designed nanoparticles can be anticipated to result in improved dissolution, oral bioavailability, and therapeutic efficacy [39, 40].
FTIR analysis
The compatibility of the drug and polymer was confirmed using FTIR spectroscopy investigations. The FTIR spectra of abiraterone acetate, gelatin, and optimized AGNPs have been recorded and contrasted. The optimized AGNP spectra exhibit significant peaks from both abiraterone acetate and gelatin, presented in table 7 and fig. 14. The predominant peaks of gelatin and abiraterone acetate in the optimized AGNPs spectra indicate that the drug and polymer are compatible. It showed that the characteristic peak of pure abiraterone acetate was not altered by the addition of excipients, and after being formulated into nanoparticles with no change in the functional group, indicating no chemical reaction and interaction between the drug and polymer. The predominant peaks of gelatin and abiraterone acetate in the optimized AGNPs spectra indicate that the drug and polymer are compatible.
Table 7: FTIR interpretation of pure abiraterone acetate, gelatin, optimized AGNPs
| Functional groups | Pure abiraterone acetate | Gelatin | Optimized AGNPs |
| C-H starching | 2936.09 | 2922.52 | 2925.48 |
| Ester | 1734.66 | 1723.72 | 1735.56 |
| C=C stretching | 1669.2 | 1673.2 | 1652.7 |
| OH stretching | 3150.78 | 3545.24 | 3560.21 3152.34 |
| C=O stretching | 1716.42 | 1732.73 | 1716.34 |
| Pyridine ring | 1455.99 | - | 1449.24 |
| Amides | - | 3466.1 | 3421.1 |
AGNPs: Abiraterone acetate loaded gelatin nanoparticles
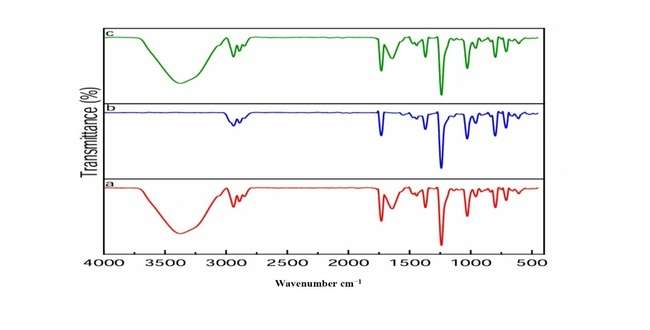
Fig. 14: FTIR spectrum of pure abiraterone acetate (a), gelatin (b), Optimized AGNPs (c). AGNPs: Abiraterone acetate loaded gelatin nanoparticles
XRD
Fig. 15a exhibits sharp and intense peaks, suggestive of a very crystalline material with well-ordered atomic structures and long-range periodicity [41]. Fig. 15b has broad, less sharp peaks representative of a lower crystallinity state where atomic structures have no long-range order. Amorphous materials typically have higher solubility and rates of dissolution than their crystalline forms. This is because crystalline solids possess high intermolecular forces and a stable lattice, and hence are less soluble. Contrarily, reduced crystalline materials are in a more energetic state with higher molecular disorder, hence more molecular mobility. This promotes quicker interaction with solvents and enhances dissolution rates and bioavailability in drugs [42].
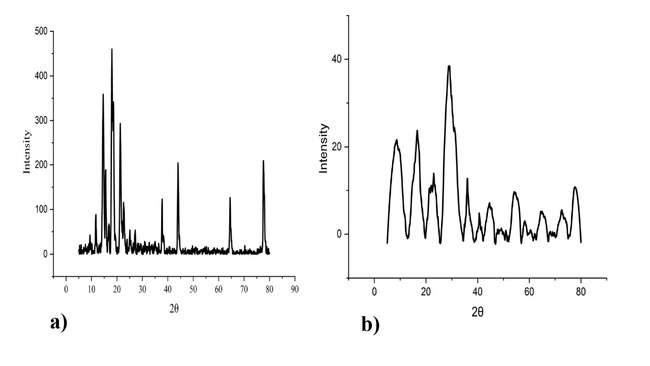
Fig. 15: XRD graphs for pure abiraterone acetate (a), optimized AGNPs (b). AGNPs: Abiraterone acetate loaded gelatin nanoparticles
In vitro drug release
According to the in vitro release profile AGNPs, in the first 1 h, almost 51.54±0.04 % of the abiraterone acetate from the AGNPs was released, after a burst release, there was a controlled release (96.32±0.78 %) for 12 h from AGNPs (fig. 16). A controlled release of the drug was noted in designed nanoparticles and fig. 16 highlights only 60.54±0.67 % of the abiraterone acetate is released from commercial product after 12 h in dissolving media, which can be attributed to its poor solubility. Inversely, a pure drug suspension only showed 10.32 % drug release in the medium for the first 1 h, after which there was a stage of stagnation that exhibited no additional changes to the drug release profile, and it highlights that the pure form of abiraterone acetate shows poor solubility (fig. 16).
Fig. 16 shows that the dissolution rate of abiraterone acetate increased after constructing optimized nanoparticles compared to pure abiraterone acetate suspension, a commercial product. The release of abiraterone acetate from the optimized AGNPs followed zero-order kinetics, as evidenced by the higher R² value (0.9722) in zero-order models, which is comparable to the other model (table 8). This suggests that the abiraterone acetate release rate from optimized AGNPs is independent of the drug's residual concentration. This could contribute to optimized AGNPs delivering therapeutics in a controlled manner. Our findings indicated that optimized AGNPs in the Korsmeyer-Peppas model showed an n value of 1.6 in the dissolving medium (table 8). The calculated release exponent (n = 1.6) suggests a Super Case II transport mechanism, indicating that drug release is primarily governed by polymer swelling and relaxation processes rather than simple diffusion. Evidence indicates that gelatin-based nanocarriers improve mucosal adhesion, extend gastrointestinal residency time, and protect encapsulated drugs against enzymatic degradation in the gastrointestinal (GI) tract [43]. These combined properties could allow plasma drug concentrations to have constant and greater bioavailability, presenting an opportunity for less frequent dosing. Thus, based on extended release (in vitro drug release) and supported by previous in vivo studies of similar gelatin-based systems, we hypothesize that the formulation will result in longer systemic exposure, which may minimize patients' need to take multiple doses every day, thereby increasing compliance. However, we would need to conduct in vivo pharmacokinetic studies to confirm our hypotheses.
The presence of gelatin (hydrophilic polymer) [44], high drug entrapment [39, 40], and nanosizing of abiraterone acetate [45], high zeta potential [38], and reducing the drug crystallinity [42] results in enhanced dissolution of abiraterone acetate. The observed result from the dissolution study satisfies and meets the specification in the QTPP.
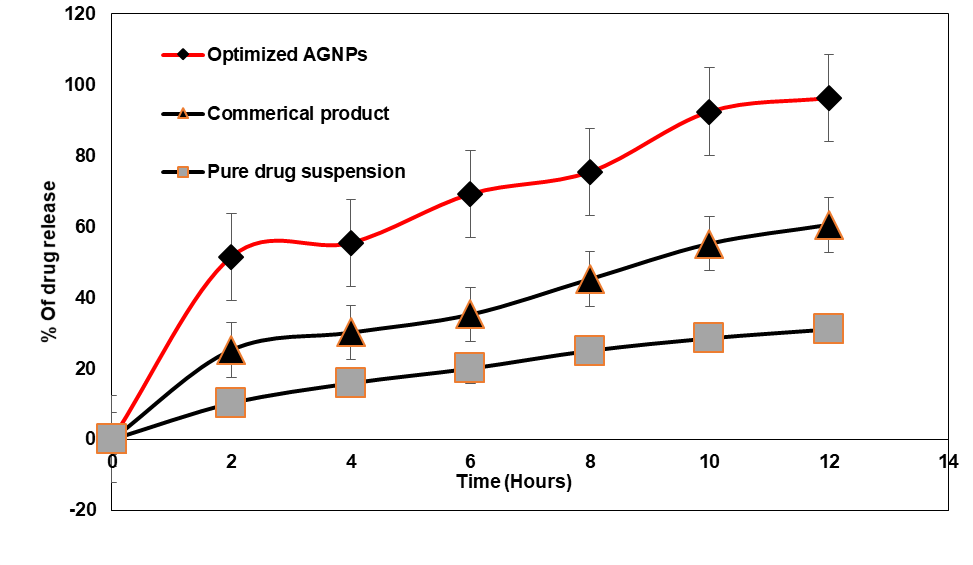
Fig. 16: Dissolution profile of optimized AGNPs and commercial product (Zytiga®), pure drug suspension. All values are presented as mean±standard deviation (n = 3). AGNPs: Abiraterone acetate loaded gelatin nanoparticles
Table 8: Drug release kinetics of optimized AGNPs
| Optimized AGNPs | Zero-order | First order | Korsmeyer-Peppas model | Higuchi model |
| R2 value | 0.9722 | 0.8897 | 0.9714 | 0.8618 |
| Slope | y = 9.7463x+39.288 | y =-0.2286x+2.07 | y = 0.0583x+1.646 | y = 13.956x+7.0914 |
AGNPs: Abiraterone acetate loaded gelatin nanoparticles.
Surface morphology
Fig. 17 exhibits an SEM picture of optimized AGNPs and pure abiraterone acetate. Compared to pure abiraterone acetate, SEM pictures of optimized AGNPs showed a change in surface shape. The pure drug (fig. 17a) displayed irregular, plate-like crystalline particles and massive crystalline aggregates, while the optimized AGNP formulation (fig. 17b) showed discrete, smaller crystalline particles with smooth surfaces and fragmented morphology. Amalgamated particles were observed in fig. 17b. These changes in morphology offer conclusive proof that nanoparticles have been formed.
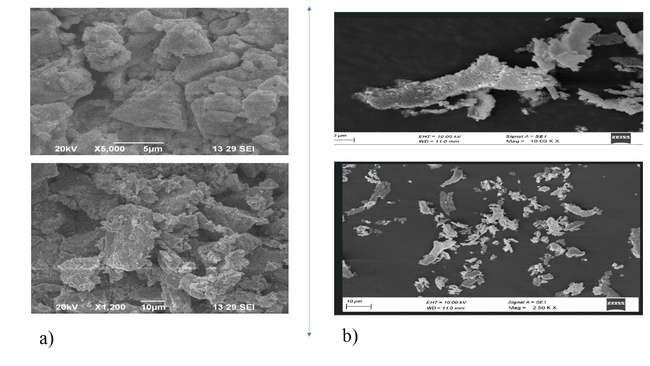
Fig. 17: SEM picture of pure abiraterone acetate at 5000X, 1200X Magnification and scale bar at 5μm, 10μm (a) and optimized AGNPs at 10 KX, 2.50KX magnification and scale bar at 2μm, 10μm (b)
Short-term stability study
At a specific temperature and humidity (40±2 °C/75±5% RH), the optimized nanoparticles were found to be chemically stable. All examined metrics, including particle size, PDI, zeta potential, and DEE, dissolution studies, showed no discernible differences. The results of all assessed characteristics before and after storage are presented in table 9, and no discernible variation has been discovered at any of the values. The formulation was physically and chemically stable under conditions representative of 3 mo at accelerated conditions (40±2 °C/75±5% RH), and no significant change in particle size, zeta potential, PDI, DEE, in vitro release profile was observed. These findings provide initial indications of stability [46]. While three-month accelerated stability data have been created and included as part of the present study, it is recognized that these data alone are inadequate to fulfill regulatory needs as described in ICH Q1A(R2). Thus, long-term stability studies for our product have been scheduled and are in progress. A full 12-month stability report will be included in future submissions to facilitate product development and regulatory support. The observed result from the stability study satisfies and meets the specification in the QTPP.
Table 9: Accelerated stability testing of optimized AGNPs
| Characterization studies | Storage condition | Before testing | 1 mo | 2nd mo | 3rd mo |
| Particle size (nm) | 40±2 °C/75±5% RH | 123.4±0.06 | 123.7±0.64 | 123.9±0.97 | 124.1±0.46 |
| Zeta potential (mV) | 35.78±0.24 | 35.78±0.32 | 35.81±1.02 | 36.9±0.32 | |
| PDI | 0.047±0.07 | 0.048±0.03 | 0.048±0.08 | 0.050±0.04 | |
| DEE (%) | 88.23±0.26 | 88.25±0.32 | 88.27±0.21 | 88.87±0.83 | |
| In vitro drug release (%) | 96.32±0.78 | 96.39±0.56 | 96.43±0.19 | 96.78±0.45 |
AGNPs: Abiraterone acetate loaded gelatin nanoparticles, PDI: Poly dispersity index, DEE: Drug entrapment efficiency. All values are presented as mean±standard deviation (n = 3)
CONCLUSION
AI-integrated CCD was used to design, characterize, and optimize AGNPs for the enhancement of oral bioavailability. This study methodically showcased a QbD strategy to synthesize AGNPs using a risk-based methodology. Formulation optimization was performed with ANN to refine the predictive models. K-fold cross-validation was implemented for training and validating the model. Both training and validation sets' R-squared values were closer to 1, confirming that the algorithms correctly characterized the predictive models. Characterization studies confirmed that optimized AGNPs had particle size (123.4±0.06 nm), PDI (0.047±0.07), DEE (88.23±0.26 %), zeta potential (+35.78±0.24 mV), and controlled drug release (96.32±0.78 % over 12 h). The formulation of AGNPs was optimized for the desired performance characteristics. The results showed that the nanoparticles were developed as per CQA for improving oral bioavailability. Thus, AGNPs could be a possible candidate for oral drug delivery. AI has greatly helped in forecasting the different characteristics and bizarre behavior of nanomaterials. The infusion of advanced technologies, ANN undoubtedly holds great potential for exciting discoveries in nanomedicine and enables future innovations. The present research acknowledges the ability of artificial ANN to serve as a very valuable means for modeling and optimizing AGNPs, with reliable predictive accuracy and optimization. Therefore, although there are exciting prospects with ANN, there are limitations related to ANN that should not be overlooked; these include extensive computer power and the ability to be sensitive to the amount and quality of data used. The dataset was limited, which could result in potential model bias and limit transferability. Moving forward, developing further research will aim to attempt to replicate these outcomes by conducting in vivo studies and working to scale up the process to be capable of an industrial scale, to determine the model fit and stability of the application.
ACKNOWLEDGEMENT
The authors thank Vels Institute of Science, Technology and Advanced Studies (VISTAS), Pallavaram, Chennai, India, for providing the facility to complete this research. The authors acknowledge Sun Pharmaceutical Industries Ltd for providing a gift sample of abiraterone acetate.
FUNDING
This work was not funded by any organization
ETHICAL DECLARATION
This study involved no human or animal subjects; thus, ethical approval was not applicable.
AUTHORS CONTRIBUTIONS
Mr. M. Nallamuthu completed the research work and writing part, and Dr. S. Umadevi, Dr. R. Anandan made the corrections and submission for publication.
CONFLICTS OF INTERESTS
The authors report that there are no conflicts of interest regarding the publication of this article.
REFERENCES
Butler EN, Kelly SP, Coupland VH, Rosenberg PS, Cook MB. Fatal prostate cancer incidence trends in the United States and England by race stage and treatment. Br J Cancer. 2020;123(3):487-94. doi: 10.1038/s41416-020-0859-x, PMID 32433602.
Fizazi K, Tran N, Fein L, Matsubara N, Rodriguez Antolin A, Alekseev BY. Abiraterone plus prednisone in metastatic castration sensitive prostate cancer. N Engl J Med. 2017;377(4):352-60. doi: 10.1056/NEJMoa1704174, PMID 28578607.
Attard G, Reid AH, A Hern RA, Parker C, Oommen NB, Folkerd E. Selective inhibition of CYP17 with abiraterone acetate is highly active in the treatment of castration resistant prostate cancer. J Clin Oncol. 2009;27(23):3742-8. doi: 10.1200/JCO.2008.20.0642, PMID 19470933.
Goldberg T, Berrios Colon E. Abiraterone (zytiga) a novel agent for the management of castration resistant prostate cancer. PT. 2013;38(1):23-6. PMID 23599666.
Schultz HB, Meola TR, Thomas N, Prestidge CA. Oral formulation strategies to improve the bioavailability and mitigate the food effect of abiraterone acetate. Int J Pharm. 2020 Mar 15;577:119069. doi: 10.1016/j.ijpharm.2020.119069, PMID 31981706.
Imam SS. Nanoparticles: the future of drug delivery. Int J Curr Pharm Sci. 2023;15(6):8-15. doi: 10.22159/ijcpr.2023v15i6.3076.
Zielinska A, Carreiro F, Oliveira AM, Neves A, Pires B, Venkatesh DN. Polymeric nanoparticles: production characterization toxicology and ecotoxicology. Molecules. 2020;25(16):3731. doi: 10.3390/molecules25163731, PMID 32824172.
Jiang X, Du Z, Zhang X, Zaman F, Song Z, Guan Y. Gelatin-based anticancer drug delivery nanosystems: a mini review. Front Bioeng Biotechnol. 2023 Mar 21;11:1158749. doi: 10.3389/fbioe.2023.1158749, PMID 37025360.
Makadia HK, Siegel SJ. Poly lactic-co-glycolic acid (PLGA) as biodegradable controlled drug delivery carrier. Polymers (Basel). 2011;3(3):1377-97. doi: 10.3390/polym3031377, PMID 22577513.
Kean T, Thanou M. Biodegradation, biodistribution and toxicity of chitosan. Adv Drug Deliv Rev. 2010 Jan 31;62(1):3-11. doi: 10.1016/j.addr.2009.09.004, PMID 19800377.
Richfield O, Piotrowski Daspit AS, Shin K, Saltzman WM. Rational nanoparticle design: optimization using insights from experiments and mathematical models. J Control Release. 2023 Aug;360:772-83. doi: 10.1016/j.jconrel.2023.07.018, PMID 37442201.
Rampado R, Peer D. Design of experiments in the optimization of nanoparticle-based drug delivery systems. J Control Release. 2023;358:398-419. doi: 10.1016/j.jconrel.2023.05.001, PMID 37164240.
Podder S, Mukherjee S. Response surface methodology (RSM) as a tool in pharmaceutical formulation development. Asian J Pharm Clin Res. 2024;17(11):18-25. doi: 10.22159/ajpcr.2024v17i11.52149.
Singh B, Bhatowa R, Tripathi CB, Kapil R. Developing micro-/nanoparticulate drug delivery systems using design of experiments. Int J Pharm Investig. 2011;1(2):75-87. doi: 10.4103/2230-973X.82395, PMID 23071925.
Tavares Luiz M, Santos Rosa Viegas J, Palma Abriata J, Viegas F, Testa Moura De Carvalho Vicentini F, Lopes Badra Bentley MV. Design of experiments (DoE) to develop and to optimize nanoparticles as drug delivery systems. Eur J Pharm Biopharm. 2021 Aug;165:127-48. doi: 10.1016/j.ejpb.2021.05.011, PMID 33992754.
Das KP, JC. Nanoparticles and convergence of artificial intelligence for targeted drug delivery for cancer therapy: current progress and challenges. Front Med Technol. 2022;4:1067144. doi: 10.3389/fmedt.2022.1067144, PMID 36688144.
Vidhya KS, Sultana A, M NK, Rangareddy H. Artificial intelligence's impact on drug discovery and development from bench to bedside. Cureus. 2023;15(10):e47486. doi: 10.7759/cureus.47486, PMID 37881323.
Vora LK, Gholap AD, Jetha K, Thakur RR, Solanki HK, Chavda VP. Artificial intelligence in pharmaceutical technology and drug delivery design. Pharmaceutics. 2023;15(7):1916. doi: 10.3390/pharmaceutics15071916, PMID 37514102.
Paul D, Sanap G, Shenoy S, Kalyane D, Kalia K, Tekade RK. Artificial intelligence in drug discovery and development. Drug Discov Today. 2021;26(1):80-93. doi: 10.1016/j.drudis.2020.10.010, PMID 33099022.
Wang S, Di J, Wang D, Dai X, Hua Y, Gao X. State-of-the art review of artificial neural networks to predict characterize and optimize pharmaceutical formulation. Pharmaceutics. 2022;14(1):183. doi: 10.3390/pharmaceutics14010183, PMID 35057076.
Aksu B, Paradkar A, De Matas M, Ozer O, Guneri T, York P. Quality by design approach: application of artificial intelligence techniques of tablets manufactured by direct compression. AAPS PharmSciTech. 2012;13(4):1138-46. doi: 10.1208/s12249-012-9836-x, PMID 22956056.
Suriyaamporn P, Pamornpathomkul B, Wongprayoon P, Rojanarata T, Ngawhirunpat T, Opanasopit P. The artificial intelligence and design of experiment assisted in the development of progesterone loaded solid lipid nanoparticles for transdermal drug delivery. Pharmacia. 2024;71:1-12. doi: 10.3897/pharmacia.71.e123549.
Arboretti R, Ceccato R, Pegoraro L, Salmaso L, Housmekerides C, Spadoni L. Machine learning and design of experiments with an application to product innovation in the chemical industry. J Appl Stat. 2022;49(10):2674-99. doi: 10.1080/02664763.2021.1907840, PMID 35757041.
Yu LX, Amidon G, Khan MA, Hoag SW, Polli J, Raju GK. Understanding pharmaceutical quality by design. AAPS J. 2014;16(4):771-83. doi: 10.1208/s12248-014-9598-3, PMID 24854893.
Zhang L, Mao S. Application of quality by design in the current drug development. Asian J Pharm Sci. 2017 Jan;12(1):1-8. doi: 10.1016/j.ajps.2016.07.006, PMID 32104308.
N Politis S, Colombo P, Colombo G, M Rekkas D. Design of experiments (DoE) in pharmaceutical development. Drug Dev Ind Pharm. 2017;43(6):889-901. doi: 10.1080/03639045.2017.1291672, PMID 28166428.
Sipos B, Katona G, Csoka I. A systematic knowledge space-based proposal on quality by design-driven polymeric micelle development. Pharmaceutics. 2021;13(5):702. doi: 10.3390/pharmaceutics13050702, PMID 34065825.
Pielenhofer J, Meiser SL, Gogoll K, Ciciliani AM, Denny M, Klak M. Quality by design (QbD) approach for a nanoparticulate imiquimod formulation as an investigational medicinal product. Pharmaceutics. 2023;15(2):514. doi: 10.3390/pharmaceutics15020514, PMID 36839835.
Krishnamoorthy K, Mahalingam M. Selection of a suitable method for the preparation of polymeric nanoparticles: multi-criteria decision making approach. Adv Pharm Bull. 2015;5(1):57-67. doi: 10.5681/apb.2015.008, PMID 25789220.
Geh KJ, Hubert M, Winter G. Optimisation of one-step desolvation and scale-up of gelatine nanoparticle production. J Microencapsul. 2016;33(7):595-604. doi: 10.1080/02652048.2016.1228706, PMID 27556342.
Silveira RF, Lima AL, Gross IP, Gelfuso GM, Gratieri T, Cunha Filho M. The role of artificial intelligence and data science in nanoparticles development: a review. Nanomedicine (Lond). 2024;19(14):1271-83. doi: 10.1080/17435889.2024.2359355, PMID 38905147.
Ismail R, Sovany T, Gacsi A, Ambrus R, Katona G, Imre N. Synthesis and statistical optimization of poly (lactic-Co-glycolic acid) nanoparticles encapsulating GLP1 analog designed for oral delivery. Pharm Res. 2019;36(7):99. doi: 10.1007/s11095-019-2620-9, PMID 31087188.
Salatin S, Barar J, Barzegar Jalali M, Adibkia K, Kiafar F, Jelvehgari M. Development of a nanoprecipitation method for the entrapment of a very water soluble drug into Eudragit RL nanoparticles. Res Pharm Sci. 2017;12(1):1-14. doi: 10.4103/1735-5362.199041, PMID 28255308.
Bai G, Armenante PM, Plank RV, Gentzler M, Ford K, Harmon P. Hydrodynamic investigation of USP dissolution test apparatus II. J Pharm Sci. 2007;96(9):2327-49. doi: 10.1002/jps.20818, PMID 17573698.
Gonzalez Gonzalez O, Ramirez IO, Ramirez BI, O Connell P, Ballesteros MP, Torrado JJ. Drug stability: ICH versus accelerated predictive stability studies. Pharmaceutics. 2022;14(11):2324. doi: 10.3390/pharmaceutics14112324, PMID 36365143.
Liu TY, Lin YL. Novel pH-sensitive chitosan based hydrogel for encapsulating poorly water soluble drugs. Acta Biomater. 2010;6(4):1423-9. doi: 10.1016/j.actbio.2009.10.010, PMID 19819354.
Subhan MA, Yalamarty SS, Filipczak N, Parveen F, Torchilin VP. Recent advances in tumor targeting via EPR effect for cancer treatment. J Pers Med. 2021;11(6):571. doi: 10.3390/jpm11060571, PMID 34207137.
Chang SH, Lin HT, Wu GJ, Tsai GJ. pH Effects on solubility zeta potential and correlation between Antibacterial Activity and Molecular Weight of chitosan. Carbohydr Polym. 2015;134:74-81. doi: 10.1016/j.carbpol.2015.07.072, PMID 26428102.
Singh R, Lillard JW. Nanoparticle-based targeted drug delivery. Exp Mol Pathol. 2009;86(3):215-23. doi: 10.1016/j.yexmp.2008.12.004, PMID 19186176.
Kita K, Dittrich C. Drug delivery vehicles with improved encapsulation efficiency: taking advantage of specific drug carrier interactions. Expert Opin Drug Deliv. 2011;8(3):329-42. doi: 10.1517/17425247.2011.553216, PMID 21323506.
Wheatley AM, Kaduk JA, Gindhart AM, Blanton TN. Crystal structure of abiraterone acetate (Zytiga), C26H33NO2. Powder Diffr. 2018;33(1):72. doi: 10.1017/S0885715618000015.
Blagden N, De Matas M, Gavan PT, York P. Crystal engineering of active pharmaceutical ingredients to improve solubility and dissolution rates. Adv Drug Deliv Rev. 2007;59(7):617-30. doi: 10.1016/j.addr.2007.05.011, PMID 17597252.
Shilpi D, Kushwah V, Agrawal AK, Jain S. Improved stability and enhanced oral bioavailability of atorvastatin loaded stearic acid modified gelatin nanoparticles. Pharm Res. 2017;34(7):1505-16. doi: 10.1007/s11095-017-2173-8, PMID 28466393.
Choi MJ, Woo MR, Choi HG, Jin SG. Effects of polymers on the drug solubility and dissolution enhancement of poorly water soluble rivaroxaban. Int J Mol Sci. 2022;23(16):9491. doi: 10.3390/ijms23169491, PMID 36012748.
Al Kassas R, Bansal M, Shaw J. Nanosizing techniques for improving bioavailability of drugs. J Control Release. 2017 Aug 28;260:202-12. doi: 10.1016/j.jconrel.2017.06.003, PMID 28603030.
Ali MS, Alam MS, Alam N, Anwer T, Safhi MM. Accelerated stability testing of a clobetasol propionate loaded nanoemulsion as per ICH guidelines. Sci Pharm. 2013;81(4):1089-100. doi: 10.3797/scipharm.1210-02, PMID 24482775.