
Int J App Pharm, Vol 17, Issue 5, 2025, 332-342Original Article
QBD-DRIVEN DESIGN OF CALENDULA ESSENTIAL OIL NANOSPONGE TOPICAL GEL FOR ENHANCED ANTIBACTERIAL EFFICACY
R. DHANUSH1, K. SUJATHA2, C. SOWMYA3*
1Department of Pharmaceutics, Faculty of Pharmacy, Sri Ramachandra Institute of Higher Education and Research, Porur, Chennai, Tamil Nadu, India. 2Department of Pharmaceutical Chemistry, Faculty of Pharmacy, Sri Ramachandra Institute of Higher Education and Research, Porur, Chennai, Tamil Nadu, India. 3*Department of Pharmaceutics, Faculty of Pharmacy, Sri Ramachandra Institute of Higher Education and Research, Porur, Chennai, Tamil Nadu, India
*Corresponding author: C. Sowmya; *Email: drcsowmya@sriramachandra.edu.in
Received: 05 Apr 2025, Revised and Accepted: 11 Jul 2025
ABSTRACT
Objective: The objective of this research was to design and optimize calendula essential oil-loaded nanosponges (CEO-NS) using a quality-by-design (QbD) strategy and formulate them into a topical gel to improve antibacterial activity and obtain controlled drug release.
Methods: CEO-NS were prepared using the emulsion solvent diffusion technique, using ethyl cellulose (EC) as the polymer and polyvinyl alcohol (PVA) as the stabilizer. A box-behnken design (BBD) was utilized for the optimization of formulation variables. NS were characterized by particle size, polydispersity index (PDI), zeta potential (ZP), encapsulation efficiency (EE), Fourier-transform infra-red spectroscopy (FTIR), and scanning electron microscopy (SEM). The chosen optimized formulations (NS18, NS19, NS20) were loaded into gels (G1, G2, G3) and tested for viscosity, pH, spreadability, homogeneity, in vitro drug release, and antibacterial activity.
Results: Among the formulations tested, NS18 was considered an ideal formulation with a particle size of 268.7 nm, a PDI of 0.421, ZP of-20.98 mV, and the predicted desirability of formulation NS18 was 1, while the actual experimental desirability was 0.9157, indicating excellent agreement and near-optimal performance. This was an indicator of good colloidal stability. The percentage EE was between 78±1.6 and 92±2.2. SEM showed spherical porous morphology, and FTIR showed the absence of significant drug-excipient interactions. The G1 showed optimum physicochemical characteristics (viscosity: 3454.12–3678.23 cps; spreadability: 40.37–66.77 g/cm/sec; pH: 5.2–5.7), The controlled drug release observed in G1 gel is a sustained release, where the drug is released at a steady rate over 8 h. It follows the Hixson-Crowell model and has better antibacterial activity against Staphylococcus aureus (S. aureus) and Escherichia coli (E. coli) than pure CEO.
Conclusion: The topical gel (G1) controlled the release of the drug with improved antibacterial efficacy, making it a promising formulation for topical antibacterial therapy.
Keywords: Calendula essential oil, Nanosponge, Box-behnken design, Antibacterial activity
© 2025 The Authors. Published by Innovare Academic Sciences Pvt Ltd. This is an open access article under the CC BY license (https://creativecommons.org/licenses/by/4.0/)
DOI: https://dx.doi.org/10.22159/ijap.2025v17i5.54461 Journal homepage: https://innovareacademics.in/journals/index.php/ijap
INTRODUCTION
The rising prevalence of multidrug-resistant (MDR) bacterial infections, especially those caused by E. coli and S. aureus, has posed an international health crisis [1–3]. Both of these pathogenic organisms are involved in diseases attacking many anatomical sites, from infections of the skin and soft tissues to cystitis, promptly to systemic sepsis, with attendant morbidity and treatment failures [4]. Moreover, the general overuse of conventional antibiotics has greatly accelerated antimicrobial resistance (AMR) such that the development of alternative therapeutic approaches is essential, with more efficacy and better-targeted delivery. Natural antimicrobial agents, among which CEO from Calendula officinalis have gained a lot of awareness due to their broad-spectrum antibacterial, anti-inflammatory, and wound-healing properties [5]. CEO has a lot of beneficial substances, including flavonoids, triterpenoids, along volatile oils, that are very good at killing microorganisms that are both Gram-positive and Gram-negative [6, 7]. Nevertheless, the clinical application of CEO faces challenges due to its low solubility in water, susceptibility to oxidation, and uncontrolled release, which hinder its pharmacological effectiveness [8].
These flaws can therefore be overruled, and the latest approaches in Nano Technology (NT)-based drug delivery systems might just stand a better chance in stabilizing the phytochemicals and enhancing their bioavailability [9]. NS, being porous three-dimensional nanocarriers, have some added advantages such as high encapsulation ability, prolonged drug release kinetics, and enhanced skin permeability, making them ideal for topical formulations [10]. Nano sponges (NSs) improve the CEO's water solubility, oxidative degradation protection, and controlled release, enhancing skin permeability and encapsulation efficiency, thus increasing its therapeutic potential and stability in topical applications. They provide a protective medium for the CEO, which, whilst allowing continuous and focused delivery at the infection site, also leads to much-reduced deterioration. However, such a promise comes with serious difficulty in optimizing NS formulations to the physicochemical properties, drug loading capability, and therapeutic utility required [11].
Topical drug delivery systems have the advantage of delivering targeted action at the desired site of application with less systemic toxicity, eliciting improved patient compliance, and consequently are most suitable for dermatological or antimicrobial applications. Topical gels are preferred for NS-based antibacterial therapy due to their non-greasy nature, ease of application, enhanced skin penetration, faster drug release, and better drug retention [12]. The use of CEO-NS in a topical gel matrix could significantly improve localized drug retention, controlled release profile, and antibacterial action, rendering it a potential candidate for treating MDR bacterial infections [13].
To optimize the formulation of CEO-NS with reproducibility and predictability, a systematic QbD perspective is necessary. The BBD finds major applications in response surface methodology (RSM) due to its ability to test multiple formulation parameters in a minimum number of experimental runs, thereby strengthening the optimization strategy due to enhanced efficiency and statistical robustness [14, 15]. The study aimed to formulate and optimize CEO-NS incorporated into Topical gel for enhanced anti-bacterial efficacy and to obtain controlled release.
MATERIALS AND METHODS
CEO is obtained from Veda Oils Pvt Ltd, Haryana. Dichloromethane (DCM) is obtained from Thermo Fisher Scientific India Pvt Ltd, Mumbai. PVA ~115,000 dalton, and a degree of hydrolysis of 98–99% and triethanolamine were procured from Sisco Research Laboratories Pvt Ltd, Delhi. EC with a viscosity grade of 10 cps (measured as a 5% solution in toluene/ethanol 80:20 at 25 °C) is obtained from Central Drug House Pvt. Ltd., New Delhi. Carbopol 934 is obtained from HiMedia Laboratories Pvt Ltd, Maharashtra. Methylparaben is procured from Sigma-Aldrich Chemicals Pvt. Ltd. Bangalore. E. coli (MTCC 1570) and S. aureus (ATCC 23235) are obtained from HiMedia Laboratories Pvt Ltd, Maharashtra, India.
Optimization CEO-NS using BBD
BBD was used to optimize the formulation of CEO-NS. PVA and EC were chosen as critical variables due to their direct influence on key quality attributes like particle size, PDI, and zeta potential. Prioritizing these factors over drug: polymer ratio, they focus on optimizing carrier characteristics for controlled release and stability. The effects of PVA concentration (A) and EC concentration (B) were evaluated as independent variables on three dependent responses, particle size (Y₁), PDI (Y₂), and ZP (Y₃) of the formulated NS. Design-Expert® version 7.0 was used to optimize the factors at three different levels: low (−1), medium (0), and high (+1). Variables with coded values are given in table 1.
Preparation of CEO-NS
As per the BBD matrix, 17 different NS (NS1-NS17) and three optimized batches (NS18-NS20) have been prepared using the emulsion solvent diffusion method. Initially, EC and 0.2 ml of CEO were dissolved in DCM and emulsified in an aqueous solution containing PVA in a ratio of (2:1) The emulsification process was carried out at 700 rpm for 3 h at room temperature (25±2 °C) followed by removal of DCM by continuous magnetic stirring at room temperature to obtain NS [16].
Table 1: Variables with coded values in box-behnken design
| Independent variables | Coded levels | ||
| Low (-1) | Medium (0) | High (+1) | |
| A-PVA (mg) | 10 | 55 | 100 |
| B-EC (mg) | 100 | 175 | 250 |
In vitro characterization of CEO-NS
Particle size analysis and PDI
Particle size analysis is crucial for assessing the bioavailability, efficacy, and shelf life of NS formulations. The particle size as well as the PDI of NS1-NS20 formulations had been analyzed through a Malvern zetasizer by using distilled water as a dispersion medium [17, 18].
Zeta potential
ZP, dependent on surface charge, is vital for the stability of NS. The ZP of NS1-NS20 formulations was measured with the use of a Malvern zetasizer by using distilled water as a dispersion medium [19, 20].
Surface morphology analysis of NS18 formulation using SEM
The SEM stub was cleaned with isopropyl alcohol, the NS18 was placed onto it, and then the stub was coated with an ultrathin gold layer for conductivity. SEM acceleration voltage at 20 kV and magnification at A-10 kx and B-5.5 kx. The samples were viewed under imaging in the SEM chamber, analyzing surface morphology, particle size distribution, and porosity using the Fei Quanta 200F SEM at various magnifications to give a close-up view of the structure of NS [21].
FTIR spectral studies
The effect of NS formation on the functional groups of the CEO and changes in the chemical composition of the CEO-loaded NS induced due to polymer interactions were captured using the Bruker Alpha II FTIR spectrophotometer. The samples, including pure CEO, physical mixture, and NS18, were ground and mixed with dry potassium bromide in a 1:100 ratio. The mixture was compressed into a transparent pellet and placed in an FTIR sample holder, and spectra were recorded using a Bruker Alpha II spectrophotometer in the 4000-400 cm⁻¹ range [22].
Encapsulation efficiency of optimized NSs
EE is analyzed for NS18 – NS20. To find out how much CEO was in the CEO-NS, 10 mg of NS18–NS20 were added to 10 ml of phosphate buffer pH 7.4 and left for 24 h. The solution was then agitated with a magnetic stirrer set to 1000 rpm for 60 min and filtered. A UV-visible spectrophotometric method was validated at 280 nm for the quantification of CEO. The method showed excellent linearity over the concentration range of 5–50 µg/ml with a correlation coefficient (R²) of 0.9992. The limit of detection and limit of quantification was found to be 1.52 µg/ml and 4.61 µg/ml, respectively [23]. The formula used to determine the EE (%);
 (1)
(1)
Formulation of topical gel incorporating optimized NSs
Carbopol 934 (1% w/v), which was soaked overnight in distilled water to allow complete hydration. The swollen Carbopol was then stirred gently to form a smooth gel base, and the pH was adjusted to 5.5–6.5 using triethanolamine for skin compatibility. The optimized formulations NS18, NS19, and NS20 (1% w/w) were gradually incorporated into the gel base with continuous gentle stirring to ensure uniform dispersion without disrupting the NS structure and designated as G1, G2, and G3. To enhance the stability of the formulation, 0.2% w/w methylparaben was added as a preservative. The final formulation was mixed until a homogeneous, smooth, and non-greasy gel was obtained and then stored in an airtight container for further evaluation and use [24–26].
Characterization of optimized ns topical gels
Physical appearance
Morphological studies like color, along with odor were assessed visually for all three prepared gels.
Determination of homogeneity
The uniformity of the gels was verified through visual inspection. The formulations were examined for the appearance and presence of aggregates.
Determination of pH
The digital pH meter was used to assess the three gels by dipping the glass electrode into the mixture [27, 28].
Determination of viscosity
The viscosity of the processed gels persists obstinately using Brookfield viscometer through spindle no. 64 at 10 rpm at temperature [29, 30].
Determination of spreadability
The parallel plate technique was used to assess the gel's spreadability. A set quantity of gel, G1–G3 (1 g), was encased between two glass slides, and for one minute, a 100 g weight was applied. The gel's spread length was measured [31, 32]. The spreadability is calculated by the below formula;
 …. (2)
Where, S = spreadability in g. cm/s
M = mass in (g)
L = spread length (cm)
T = time in seconds.
In vitro drug release studies
A 10 ml Franz diffusion cell in the receptor chamber was used for the gels' in vitro drug release investigation. The donor and receptor compartments were separated by a cellophane membrane, which was then covered in the donor chamber with 1g of gel (G1, G2, G3). Phosphate-buffered saline (PBS) with a pH of 6.8 was added to the receptor chamber, which was kept at 37±0.5 °C and agitated at 100 rpm. To guarantee sink conditions, 1 ml of receptor media was removed and replaced with new PBS at intervals of 0.5, 1, 2, 4, 6, and 8 h. To ascertain the CEO concentration, the extracted samples were examined with a UV-visible spectrophotometer [33–36]. Using mathematical models such as zero-order, first-order, Higuchi, Hixson-Crowell, and Korsmeyer-Peppas, the cumulative percentage of medication released was computed and plotted versus time. And the t50% and MDT were calculated by the below formula;
 ……. (3)
n – Release exponent
k – Rate constant.
In vitro antimicrobial studies
Preparation of agar plates
Dissolved agar in water followed by autoclave at 121 °C for 15 min and allowed to cool down. A measured 25 ml of melted agar was added to each Petri plate and placed under Laminar airflow for hardening.
Preparation of inoculum
The antibacterial effectiveness of G1 was assessed using E. coli (MTCC 1570) and S. aureus (ATCC 23235) obtained from HiMedia Laboratories Pvt Ltd, Maharashtra, India. Subcultures were prepared from the main parent cultures diluted to required concentrations and stored under cool conditions till usage.
Inoculation of agar plates
The prepared inoculum was applied to the solidified agar plates using a streaking technique. The plates were left to dry at room temperature for five minutes.
Agar well diffusion method
The test organisms' culture was collected in sterile Brain Heart Infusion broth (E. coli and S. aureus), and the turbidity was corrected to 0.5 McFarland standards. Lawn cultures of the broth suspension were applied to the surface of sterilized Mueller-Hinton agar plates. The antibacterial activities of CEO and G1 against S. aureus and E. coli were evaluated using the agar well diffusion method. Each well received 50 µl** of the respective test sample. The pure CEO well contained 50 µl** of CEO, while the G1 well contained 50 µl** of gel (equivalent to 20 µl** of CEO). Plates were incubated at 37ºC for 24 h. Following incubation, the zone of clearing and the zone of diameter were recorded and statistical analysis (ANOVA with Tukey’s post-hoc) for zone of inhibition (ZOI) comparisons and minimum inhibitory concentration (MIC) were determined [37–40].
Stability studies
A preliminary stability study was conducted on the optimized gel formulations (G1–G3) over 3 mo at 25±2 °C and 60±5% relative humidity (RH), following ICH guidelines. The formulations were evaluated monthly for physical appearance, pH, viscosity, and drug content.
RESULTS AND DISCUSSION
Optimization of CEO-NS using BBD
A comprehensive study has been conducted to examine all the dependent variables via both numerical and graphical optimization methods. Numerically optimizing required desired responses maximized as independent variables could be regulated to remain within pre-established limits. The upper and lower bounds of independent variables have been established, while dependent ones were bounded based on responses generated experimentally. The statistical significance of all variables was assessed, and the effect of each factor on formulation was determined using RSM. Graphs and optimized solutions have been generated, where the maximum responses and the minimum values of dependent variables are set accordingly.
Experimental runs can be derived from a BBD model; that is how 17 runs were produced shown in table 2 based on permutations of different independent variables. Each run was executed, and responses recorded including particle size, PDI, and ZP were documented. The information obtained was fed into statistical software to ascertain which optimum formulation would come out. So, an optimal formulation was offered with a very good desirability index, which would ensure an optimum balance of formulation parameters. All the respective experimental runs were carried out per the aforementioned procedure, and the generated data were put into the design under BBD for subsequent statistical analysis.
Table 2: DOE results for CEO-NS (NS1-NS17), presenting particle size (A), PDI (B), and zeta potential (C) as key physicochemical attributes influenced by formulation factors
| Formulation | Std | Run | Factor 1 | Factor 2 | Response 1 | Response 2 | Response 3 |
| A-PVA (mg) | B-EC (mg) | Y1-Size (nm) | Y2-PDI | Y3-Zeta potential (mV) | |||
| NS1 | 16 | 1 | 55 | 175 | 310 | 0.685 | -16.2 |
| NS2 | 4 | 2 | 100 | 250 | 480 | 0.918 | -9.7 |
| NS3 | 5 | 3 | 10 | 175 | 285 | 0.5541 | -20.1 |
| NS4 | 12 | 4 | 55 | 250 | 510 | 0.875 | -21.3 |
| NS5 | 14 | 5 | 55 | 175 | 340 | 0.723 | -14.8 |
| NS6 | 6 | 6 | 100 | 175 | 620 | 0.589 | -5.4 |
| NS7 | 3 | 7 | 10 | 250 | 290 | 0.6372 | -19.6 |
| NS8 | 10 | 8 | 55 | 250 | 365 | 0.785 | -17.4 |
| NS9 | 9 | 9 | 55 | 100 | 480 | 0.204 | -21.1 |
| NS10 | 1 | 10 | 10 | 100 | 275 | 0.5541 | -19.8 |
| NS11 | 15 | 11 | 55 | 175 | 360 | 0.7592 | -16.9 |
| NS12 | 7 | 12 | 10 | 175 | 320 | 0.6346 | -18.2 |
| NS13 | 8 | 13 | 100 | 175 | 610 | 0.589 | -5.2 |
| NS14 | 17 | 14 | 55 | 175 | 355 | 0.742 | -15.3 |
| NS15 | 2 | 15 | 100 | 100 | 460 | 0.918 | -10.1 |
| NS16 | 13 | 16 | 55 | 175 | 330 | 0.789 | -17.7 |
| NS17 | 11 | 17 | 55 | 100 | 295 | 0.695 | -18.5 |
The response (Y1) (Particle size)
BBD suggested linear model is the Perfect fit to study the outcome of chosen variables on particle size. The relationship is explained by the following polynomial equation.
Response 1 (Y1) =+393.24+125.00 (A)+16.88 (B)
Where Y₁ is the particle size, X₁ is the PVA concentration, and X₂ is the EC concentration. Model (Linear) F = 12.24, and Prob>F (0.0008) implies model terms are significant (A). The expected Y₁ response ranges from 275 nm – 620 nm. The particle size increases with increasing A and B concentration. The effects of X₁ and X₂ on Y₁ had been represented on a 3D response surface plot fig. 1(A).
P-values less than 0.0500 indicate model terms are significant. In this case, A is a significant model term value greater than 0.1000 indicate the model terms are not significant.
The Lack of Fit F-value of 1.91 implies the Lack of Fit is not significant relative to the pure error. There is a 19.47% chance that a Lack of Fit F-value this large could occur due to noise. Non-significant lack of fit is good.
The response (Y2) is the model suggested as the linear model.
The response (Y2) (PDI)
BBD suggested linear model is the Perfect fit to study the outcome of chosen variables on PDI. The relationship is explained by the following polynomial equation.
Response 2 (Y2) = +0.6854+0.0792 (A)+0.1055 (B)
Where Y2 is the PDI. The Model F = 3.00, and Prob>F (0.0825) indicates model (linear) terms are important (A and B). The expected Y2 response ranges from 0.204 to 0.918. The PDI directly affects the A and B concentration. The effects of A and B on Y2 were represented on a 3D response surface plot fig. 1(B)
P-values less than 0.0500 indicate model terms are significant. In this case, there are no significant model terms value greater than 0.1000 indicate the model terms are not significant.
The Lack of Fit F-value of 1.91 implies the Lack of Fit is not significant relative to the pure error. There is a 19.56% chance that a Lack of Fit F-value this large could occur due to noise. Non-significant lack of fit is good.
The quadratic model was chosen for ZP due to its better fit, while linear models provided an adequate explanation for particle size and PDI. Model complexity was minimized when necessary to capture true response behaviour.
The response (Y3) is the model suggested as the Quadratic model.
The response (Y3) (ZP)
BBD is the suggested quadratic model and is the Perfect fit to study the outcome of chosen variables on ZP. The relationship is explained by the following polynomial equation.
Response 3 (Y3)=-16.35+5.91 (A)+0.1875 (B)+0.0500 (A B)+4.34 A2-3.01 B2
Where Y3 is the ZP, F = 31.66, and Prob>F (0.0001) indicates model (quadratic) terms are important (A and B). The expected Y3 response ranges from-5.2 mV--21.3 mV. The ZP directly affects the A and B concentration. The effects of A and B on Y3 were represented on a 3D response surface plot fig. 1(C)
P-values less than 0.0500 indicate model terms are significant. In this case, A, A², and B² are significant model terms value greater than 0.1000 indicate the model terms are not significant.
The lack of fit F-value of 1.30 implies the lack of fit is not significant relative to the pure error. There is a 33.99% chance that a Lack of Fit F-value this large could occur due to noise. Non-significant lack of fit is good.
Summary of ANOVA results in analyzing lack of fit and pure error for the response of NS1-NS17 formulation given in table 3.
Table 3: Summary of ANOVA results in analyzing lack of fit and pure error for the response of NS1-NS17 formulation
| Size | ||||||
| Source | Sum of squares | df | mean Square | F-value | p-value | |
| Model | 1.273E+05 | 2 | 63639.06 | 12.24 | 0.0008 | significant |
| A-PVA | 1.250E+05 | 1 | 1.250E+05 | 24.05 | 0.0002 | |
| B-EC | 2278.13 | 1 | 2278.13 | 0.4383 | 0.5187 | |
| Residual | 72768.93 | 14 | 5197.78 | |||
| Lack of Fit | 42861.43 | 6 | 7143.57 | 1.91 | 0.1947 | not significant |
| Pure Error | 29907.50 | 8 | 3738.44 | |||
| Cor Total | 2.000E+05 | 16 | ||||
| PDI | ||||||
| Source | Sum of squares | df | mean square | F-value | p-value | |
| Model | 0.1393 | 2 | 0.0697 | 3.00 | 0.0825 | not significant |
| A-PVA | 0.0502 | 1 | 0.0502 | 2.16 | 0.1636 | |
| B-EC | 0.0891 | 1 | 0.0891 | 3.83 | 0.0705 | |
| Residual | 0.3254 | 14 | 0.0232 | |||
| Lack of Fit | 0.1915 | 6 | 0.0319 | 1.91 | 0.1956 | not significant |
| Pure Error | 0.1339 | 8 | 0.0167 | |||
| Cor Total | 0.4647 | 16 | ||||
| Zeta potential | ||||||
| Source | Sum of squares | df | mean square | F-value | p-value | |
| Model | 391.99 | 5 | 78.40 | 31.66 | <0.0001 | significant |
| A-PVA | 279.66 | 1 | 279.66 | 112.94 | <0.0001 | |
| B-EC | 0.2813 | 1 | 0.2813 | 0.1136 | 0.7424 | |
| AB | 0.0100 | 1 | 0.0100 | 0.0040 | 0.9505 | |
| A² | 79.65 | 1 | 79.65 | 32.17 | 0.0001 | |
| B² | 38.17 | 1 | 38.17 | 15.41 | 0.0024 | |
| Residual | 27.24 | 11 | 2.48 | |||
| Lack of Fit | 8.92 | 3 | 2.97 | 1.30 | 0.3399 | not significant |
| Pure Error | 18.32 | 8 | 2.29 | |||
| Cor Total | 419.23 | 16 | ||||
The graphical optimization method was used to verify the experimental design. An overlay plot was created using the response targets, demonstrating optimal formulation characteristics. Areas shaded in yellow indicate the optimized design space where the formulation meets the limits for particle size, PDI, and ZP were displayed in fig. 2. The grey areas represent non-optimal regions defined by responses that are outside the specified limits. The overlay map successfully illustrated the design space for nanoparticle formulation; flags showing the values of each response were placed at factor levels accordingly. From this design space, three formulations were made and tested for their responses (NS18-20) based upon this design space, and EE(%) were shown in table 4. The measured values of responses such as particle size, PDI, and ZP were consistent when closely aligned with the predicted values, verifying the validity and accuracy of the optimized process. The NS18 size and PDI are shown in fig. 3 and ZP in fig. 4. The formulation NS18 exhibited a predicted desirability of 1.000, while the actual experimental desirability was 0.9157, indicating a high level of agreement between the model and experimental outcomes. These values are comparable with those reported in earlier studies, where particle sizes ranged from 320–610 nm Sujitha and Muzib et al., PDI>0.6 with Ahmed et al., and zeta potentials around −10 mV, Abbas et al. The desirability (0.9157) and EE (92.2%) were also higher than typical values reported by Ahsan et al. and Sherje et al., indicating an optimally stable and efficient NS system. This confirms the reliability of the optimization model and the near-optimal performance of the NS18 formulation. The desirability NS 18 is shown in fig. 5.
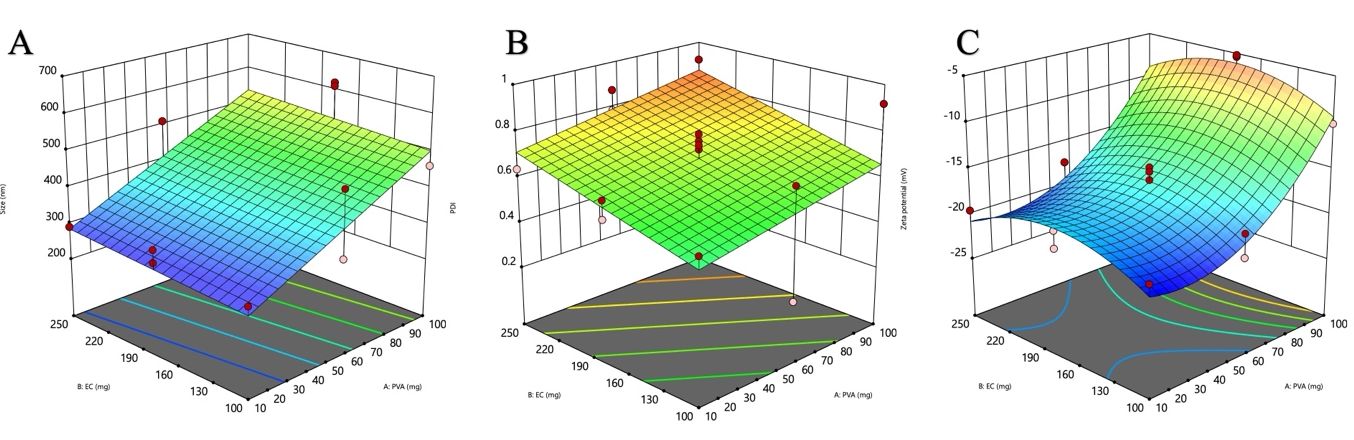
Fig. 1: 3D response surface plots illustrating the effect of PVA and EC concentrations on critical quality attributes of CEO-NS: (A) size (nm), (B) PDI, and (C) zeta potential (mV)
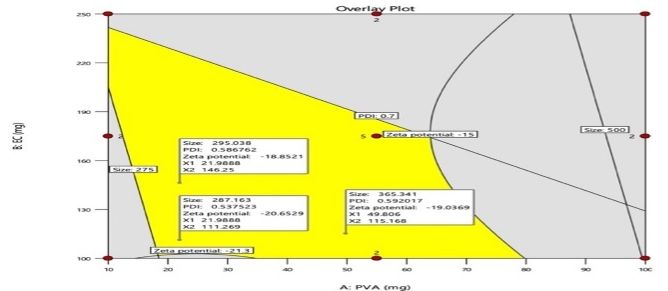
Fig. 2: Overlay plot depicting the optimal formulation
Table 4: Results of actual and predicted values, optimized formulation and Encapsulation efficiency (%)
| Optimized batch | Independent variable | Dependent variables | EE (%) (mean sd)* sd)* |
||||||
| Actual values (meansd)* |
Predicted values | ||||||||
| A (mg) | B (mg) | Y1 (nm) | Y2 | Y3 (mV) | Y1 | Y2 | Y3 | ||
| NS18 | 21.98 | 111.26 | 268.7±5 | 0.4210.02 |
-20.98 |
287.16 | 0.537 | -20.65 | 92 .2 .2 |
| NS19 | 21.98 | 146.25 | 305±4 | 0.5650.01 |
-18.70 |
295.03 | 0.586 | -18.85 | 851.8 |
| NS20 | 49.80 | 115.16 | 355±3 | 0.5790.01 |
-19.01 |
365.34 | 0.592 | -19.03 | 781.6 |
*n = 3
SEM studies
The SEM images of the optimized formulation (NS18) were quantitatively analyzed using ImageJ software. The analysis showed that the average size of the pores was 320±45 nm and the porosity index was 42.6%, leading to the formation of cavities, which helps to increase the encapsulation efficiency of CEO to 92.2%. The porous, spherical morphology observed in SEM images aligns with findings by Sujitha and Muzib et al., who noted similar structures enhancing drug entrapment. The porosity index (42.6%) in NS18 is notably higher than typical NS, contributing to the superior EE and sustained drug release. This porous structure of NS18 enhances drug release and antibacterial efficacy, allowing for controlled and sustained release over 8 h as observed in the Hixson-Crowell model fitting for G1 gel, where diffusion drug occurs gradually from the internal matrix to the surface, prolonging therapeutic effect with G1 showing larger zones of inhibition. Structural integrity also assures the physical stability of the nanospheres in the gel formulation. Uniformity in particle size and shape also establishes consistent production methods and potential for scale-up in topical gel formulation. It was successful with the NS encapsulating the best characteristics of the CEO in their morphological profile as an apparent necessity requirement for effective delivery in topical application, using SEM analysis. The SEM picture of NS18 is shown in fig. 6.
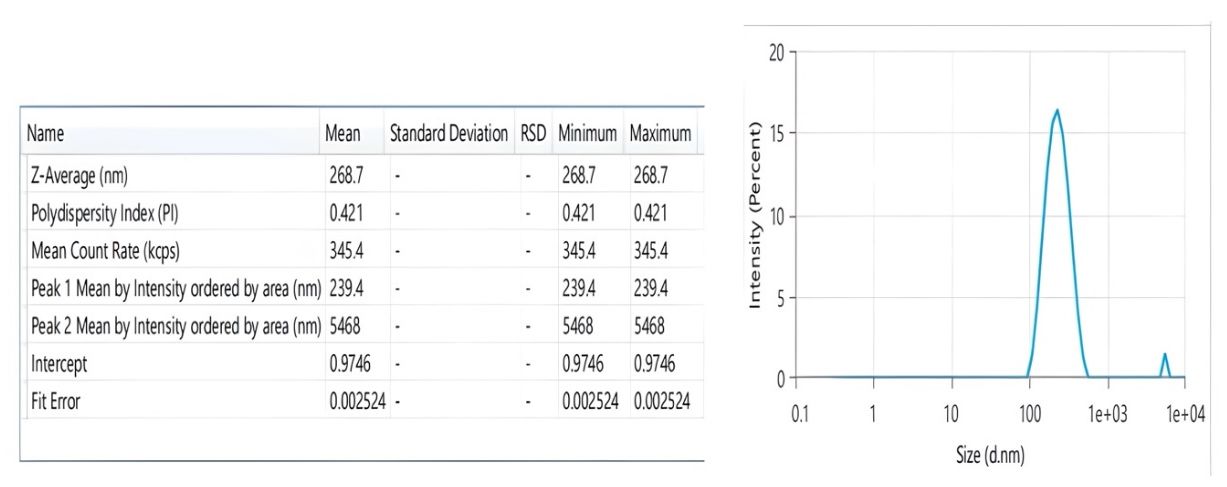
Fig. 3: Particle size of optimized formulation NS18
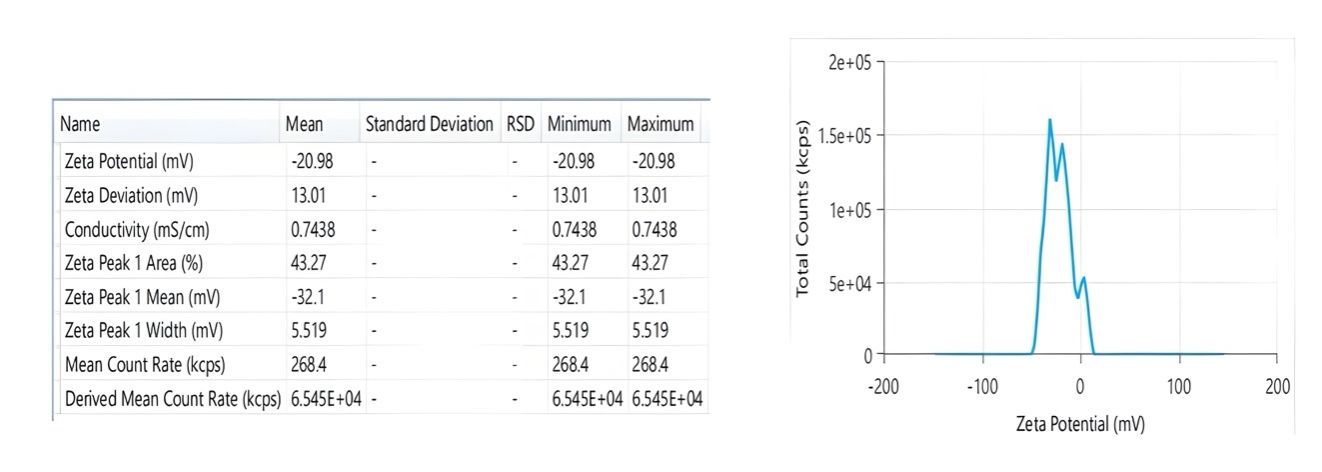
Fig. 4: Zeta potential of optimized formulation NS18
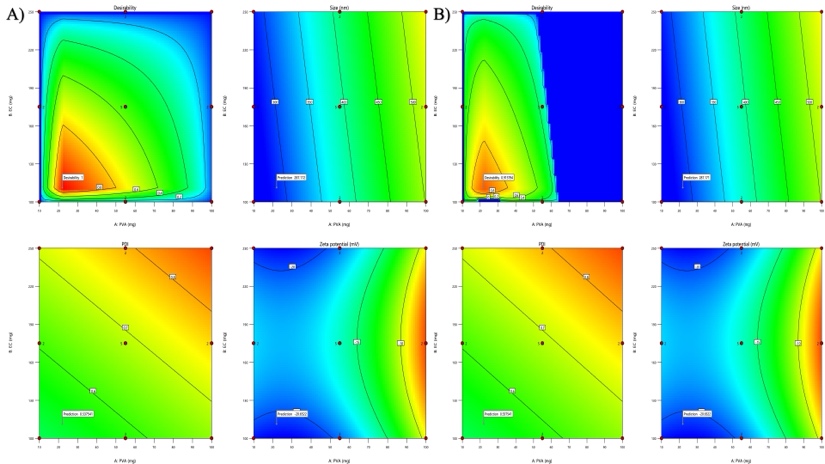
Fig. 5: Desirability of NS18 A)-predicted and B)-actual values
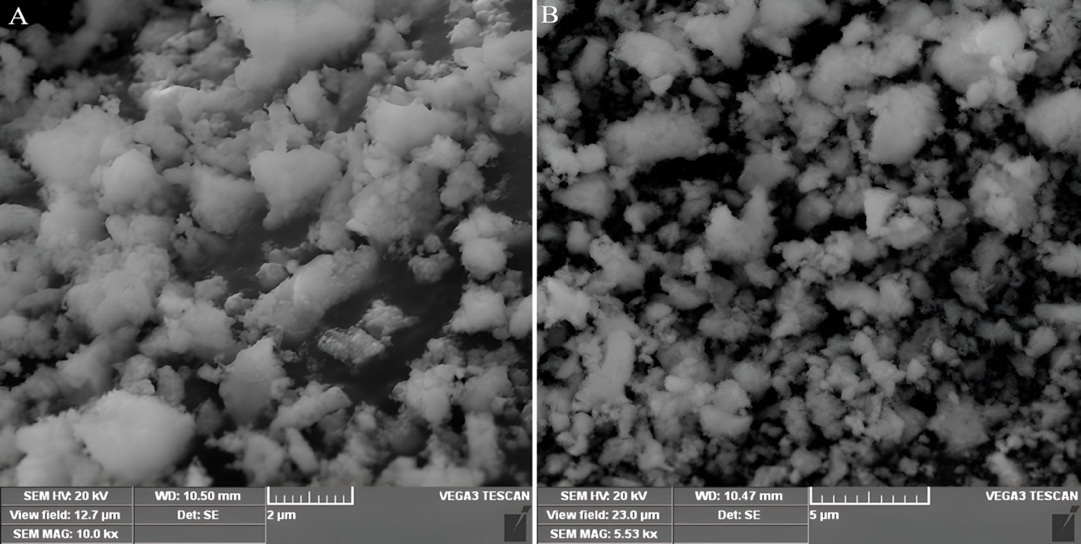
Fig. 6: Scanning electron microscope photographs of NS18 at 2 µm scale (A), 5 µm scale (B)
FTIR analysis
The FTIR analysis of the (a) PHY-MIXTURE (CEO with Polymers), (b) PURE CEO, and (c) NS18 spectra shows that some essential functional groups are available across the samples. The O-H stretching bands at 3455.6 cm⁻¹ PURE CEO, 3280 cm⁻¹ PHY-MIXTURE, and 3436.11 cm⁻¹ NS18 indicate the existence of alcohols or phenols typically found in flavonoids. C-H stretching vibrations between 2958.9–2871 cm⁻¹ confirm the presence of alkanes or alkenes across all samples, typically found in triterpenoids. The existence of strong bands C=O stretching at 1724.6 cm-¹ PURE CEO, 1697 cm⁻¹ PHY-MIXTURE, and 1715.49 cm⁻¹ NS18 indicates the presence of carbonyl groups, often aldehydes or esters, typically found in fatty acids/lipids. The peaks at 1378.4 cm⁻¹ in PHY-MIXTURE and at 1375.48 cm⁻¹ in NS18 correspond to the bands of the PURE CEO between 1453.7-1365.9 cm⁻¹, indicating the presence of aliphatic hydrocarbons. C-O stretching peaks around 1125-1022 cm⁻¹ in PURE CEO and 1059.8 cm⁻¹ in PHY-MIXTURE indicate the presence of alcohol or ether groups typically found in tannins/glycosides. Aromatic C=C stretching appeared dominantly in the NS18 at 1606.89 cm⁻¹, typically found in tannins/glycosides; aromatic C-H bending was present in the NS18 (918.82, 851.55 cm⁻¹), and PHY-MIXTURE (818.95 cm⁻¹). Furthermore, the same mixture exhibits C-Cl or C-Br stretching vibrations in the 746.2–565.57 cm⁻¹ PURE CEO and 576.86 cm⁻¹ PHY-MIXTURE range, yet peaks attributed to NS18 appear within this general range. This array of peaks is associated with a mix of aliphatic and aromatic compounds with a variety of functional groups throughout each sample. Spectral studies confirmed the absence of drug-excipient interactions [41-43]. The FTIR is shown in the fig. 7.
Characterization of optimized ns topical gels
The prepared gels G1 to G3 were transparent and translucent with good homogeneity and appearance (fig. 8). They exhibit good spreadability, viscosity, and optimum pH suitable for topical application. Results are given in table 5.

Fig. 7: FTIR spectra of PHY-mixture of CEO with polymers (a), PURE CEO (b), NS18 (c)
Fig. 8: Morphological characteristics of G1-G3, NS18-20 incorporated topical gels
| S. No. | Formulation | pH (mean±sd)* | Viscosity (cps) (mean±sd)* | Spreadability (g/cm/sec) (mean±sd)* |
| G1 | 5.5 ±0. 3 | 3454±36 | 66.77±12.3 | |
| G2 | 5.7±1.0 | 3678 ±45 | 56.34±2.4 | |
| G3 | 5.2±0.4 | 3567±43 | 40.37 ±4.6 |
*n=3
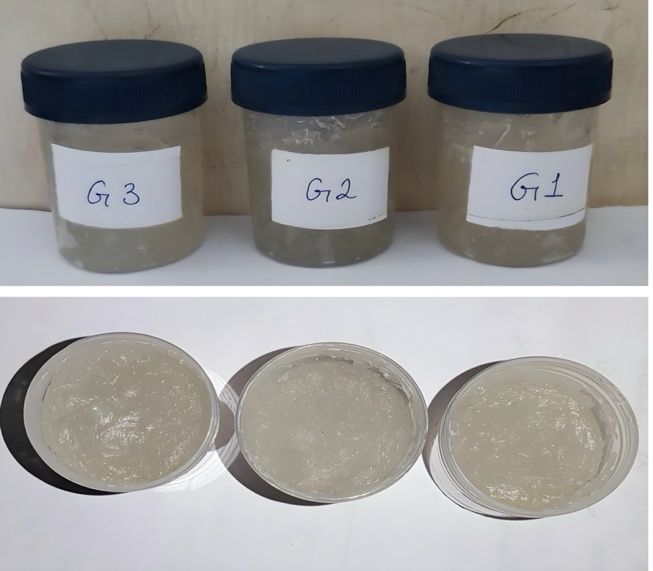
Table 5: pH, viscosity, and spreadability of G1 – G3 formulated gels
In vitro drug release studies
In vitro drug release studies indicate controlled release patterns for the three topical gels laden with NS over 8 h; G1 showed the highest drug release (~90%), followed by G2 (~85%) and G3 (~80%). The porosity of the nanosponges is considered optimum, and it slows down the drug-release process. G1, G2, and G3 showed drug release for 8 h with an average of 12 mg/hr release rate. The higher release rate of G1 can be ascribed to higher spreadability (66.77±12.3 g/cm/sec) and medium viscosity (3454±36 cps), which aided drug diffusion. On the contrary, G3, having low spreadability (40.37±4.6 g/cm/sec) but high viscosity, released the least. The results depict the G1 formulation as the most effective, leading to enhanced drug permeation and prolonged therapeutic effectiveness in topical applications. This is more controlled than Fickian release profiles reported by Ahmed et al. and Ghourab et al. in similar NS gels. Fig. 9 describes the drug release of G1-G3, and table 6 describes different kinetics models.
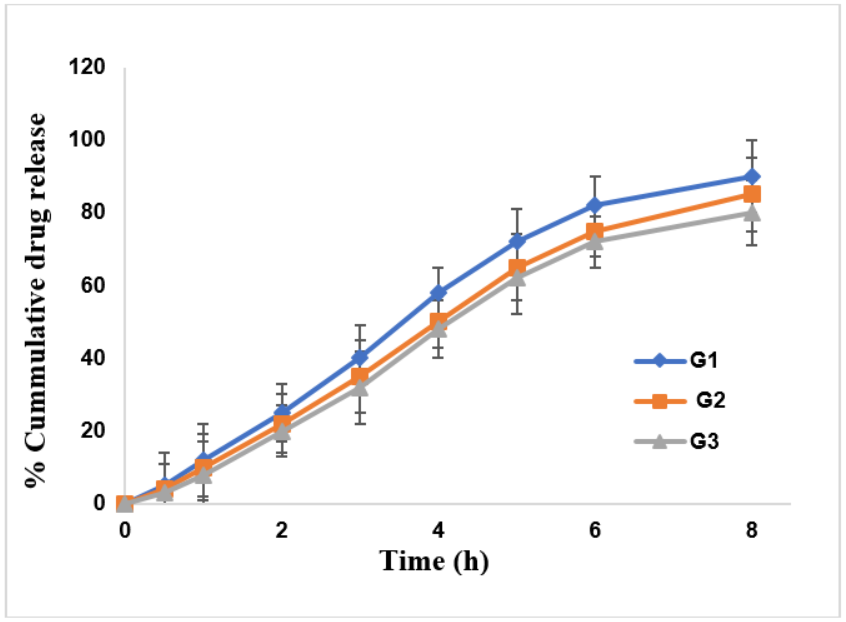
Fig. 9: Drug release of formulated gels G1, G2 and G3. Error bars indicate the SD values
Table 6: Correlation coefficient values and kinetics of drug release based on the dissolution profiles of G1, G2, and G3 of formulated gels
Formulation code |
Zero-order | First order | Hixon crowell | Higuchi | Korsemeyer Peppas | t50% (h) (mean |
MDT (h) (mean |
|||||||||
| r2 | Regression equation | K(mg/h) | r2 | Regression equation | K1 (h-1) | r2 | Regression equation | r2 | Regression equation | r2 | Regression equation | ‘n’ value | ||||
| G1 | 0.9696 | y = 12.464x+1.8126 | 12.46 | 0.9636 | y =-0.2974x+4.7873 | 0.256 | 0.9873 | y =-0.3321x+4.7634 | 0.9320 | y = 36.497x-15.596 | 0.9068 | y = 30.475x+12.906 | 0.582 | 4.12±0.25 | 6.24±0.20 | |
| G2 | 0.9805 | y = 11.645x+0.2742 | 11.65 | 0.8138 | y = 0.1643x+0.8699 | 0.215 | 0.8965 | y = 0.3726x+1.8927 | 0.9245 | y = 33.772x-15.468 | 0.9805 | y = 0.137x+0.0032 | 0.624 | 3.56±0.20 | 5.58±0.17 | |
| G3 | 0.9755 | y = 11.173x-0.5104 | 11.17 | 0.7827 | y = 0.22x+0.5479 | 0.198 | 0.8167 | y = 0.4816x+1.2428 | 0.9162 | y = 32.339x-15.514 | 0.9755 | y = 0.1397x-0.0064 | 0.617 | 3.62±0.17 | 5.44±0.15 | |

*n = 3
The drug release from G1 gel best fits the Hixson-Crowell model (R² = 0.9873), suggesting that drug release is governed by changes in surface area and particle size of the NS due to matrix erosion, indicating a controlled release mechanism. The Korsmeyer-Peppas model yielded an “n” value of 0.582 for G1, which falls between 0.45 and 0.89, indicating a non-Fickian transport mechanism. t50% which ranges from 3.56±0.20-4.12±0.25 and the MDT range from 5.44±0.15-6.24±0.20.
In vitro antibacterial studies
The antibacterial activities of CEO and G1 against S. aureus and E. coli were evaluated using the respective ZOI for each formulation. Table 7 describes the ZOI, and fig. 10 illustrates the Anti-bacterial activity of pure CEO and G1. A one-way ANOVA was performed to compare the mean ZOI of pure CEO, G1 gel, and standard antibiotic against S. aureus and E. coli. The results showed significant differences (p<0.05) among the groups. Tukey’s post-hoc test confirmed that G1 produced a significantly larger ZOI compared to pure CEO for both bacteria S. aureus: G1 (15.4±3.2 mm) vs. CEO (9.5±3.4 mm), p<0.01 and E. coli: G1 (13.2±2.2 mm) vs. CEO (10.2±2.2 mm), p<0.05. The MIC of pure CEO was found to be 0.5% v/v against S. aureus and 0.75% v/v against E. coli. G1 formulation exhibited lower MIC values of 0.25% w/w and 0.5% w/w against S. aureus and E. coli, respectively, indicating improved antibacterial potency through NS incorporation. These results confirm that G1 provides a more potent antibacterial effect, making it a promising candidate for topical antimicrobial applications.
The CEO-NS formulation outperformed NS-based systems like clobetasol-loaded NS Kumar et al. with an encapsulation efficiency of up to 92.2%, higher than typical EE values. Its Hixson-Crowell model suggests a robust controlled release profile, similar to or better than clobetasol. CEO-NS also showed larger ZOIs against S. aureus and E. coli, indicating enhanced therapeutic potential through improved bioavailability and sustained local action. NS Kumar et al., (2021) have prepared clobetasol-loaded NS formulations with an encapsulation efficiency of up to 92.2%, which is higher than typical EE values. Its Hixson-Crowell model suggests a robust controlled release profile, better than pure clobetasol. Similarly, Kaur et al. (2021) developed a cinnamon oil-based nanosponge gel that showed a maximum ZOI of approximately 10 mm against Gram-positive strains, whereas G1 achieved 15.4 mm against S. aureus and 13.2 mm against E. coli. In comparison with these studies, the developed CEO-NS system offers enhanced antimicrobial performance, better drug retention, and more effective delivery compared to conventional topical treatments.
Table 7: Anti-bacterial activity of pure CEO and G1 against E. coli and S. aureus
| Test organisms | Zone of inhibition mm (mean±sd)* | |
| Pure COE (mm) | G1 (mm) | |
| S. aureus | 9.5±3.4 | 15.4±3.2 |
| E. coli | 10.2±2.2 | 13.2±2.2 |
*n = 3
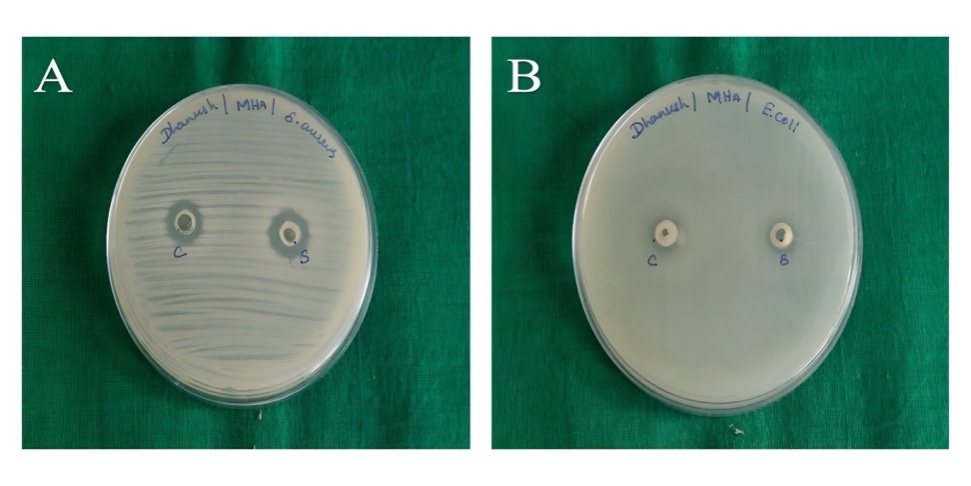
Fig. 10: Anti-bacterial activity: ZOI of pure CEO and G1 on S. aureus (A) and E. coli (B)
Stability studies
Stability studies over three months showed that all formulations (G1, G2, G3) maintained acceptable pH, viscosity, and drug content with no significant physical changes. G1 showed the highest stability, retaining 95.6% drug content with minimal variation in pH and viscosity, confirming the formulations’ suitability for long-term storage. Stability data of gel formulations G1, G2, and G3 are given in table 8.
Table 8: Stability studies results of gels G1, G2 and G3
| Formulation | Parameter | Initial (mean±sd)* | 1 Mo (mean±sd)* | 2 Mo (mean±sd)* | 3 Mo (mean±sd)* |
| G1 | Appearance | Clear, homogeneous | No change | No change | No change |
| pH | 5.5±0.3 | 5.5±0.2 | 5.4±0.2 | 5.4±0.2 | |
| Viscosity (cps) | 3454±36 | 3401±33 | 3375±40 | 3352±39 | |
| Drug content (%) | 100 | 98.8 | 97.2 | 95.6 | |
| G2 | pH | 5.7±1.0 | 5.6±0.8 | 5.5±0.7 | 5.5±0.6 |
| Viscosity (cps) | 3678±45 | 3620±40 | 3592±42 | 3561±44 | |
| Drug content (%) | 100 | 97.9 | 96.3 | 94.8 | |
| G3 | pH | 5.2±0.4 | 5.2±0.3 | 5.1±0.3 | 5.1±0.2 |
| Viscosity (cps) | 3567±43 | 3512±39 | 3487±36 | 3454±41 | |
| Drug content (%) | 100 | 97.5 | 95.8 | 94.1 |
*n=3
CONCLUSION
The study uses a QbD approach, specifically BBD, to optimize formulation variables like PVA and EC concentrations. Unlike traditional trial-and-error methods, QbD enabled a statistically guided process that ensures consistent quality attributes like particle size, PDI, and zeta potential. The optimized formulation (NS18) exhibited a particle size of 268.7 nm, PDI of 0.421, and ZP of-20.98 mV, which reflected good colloidal stability. FTIR analysis confirmed the absence of drug-excipient interaction, and SEM photographs indicated porous spherical morphology, which supports high encapsulation efficiency and controlled release. Optimized formulation into topical gel preparations (G1, G2, and G3) and analyzed for physicochemical parameters like pH, viscosity, spreadability, and homogeneity. G1 possessed the optimum properties with pH 5.5±0.3, viscosity 3454±36 cps, and maximum spreadability 66.77±12.3 g/cm/sec and hence was most suitable for application on the skin. In vitro release studies of drugs showed that G1 obeyed the Hixson-Crowell model (r² = 0.9873), describing a controlled release of drugs with t₅₀% = 4.12 h and MDT = 6.24 h. Further, antibacterial activity revealed that G1 was more active against S. aureus (15.4±3.2 mm) and E. coli (13.2±2.2 mm) compared to pure CEO. Overall, the optimized G1 demonstrated better-controlled drug release and enhanced antibacterial activity, making it a promising NS formulation for topical antibacterial applications. G1 offers clinical potential in managing MDR skin infections by delivering targeted antibacterial therapy, reducing systemic exposure and antibiotic resistance risk. The study showed promising in vitro characteristics but has limitations, including a lack of in vivo or ex vivo permeation studies and a lack of long-term stability data under various storage conditions. Future work should address these to strengthen the translational potential of the CEO-NS topical gel.
FUNDING
Nil
AUTHORS CONTRIBUTIONS
[Sowmya C*]-Ideation and drafting of the manuscript; [Dhanush R]-literature search, and execution of the project; [Sujatha K]-compilation of results and finalization of the manuscript.
CONFLICT OF INTERESTS
Declared none
REFERENCES
Poolman JT, Anderson AS. Escherichia coli and Staphylococcus aureus: leading bacterial pathogens of healthcare associated infections and bacteremia in older age populations. Expert Rev Vaccines. 2018;17(7):607-18. doi: 10.1080/14760584.2018.1488590, PMID 29902092.
Haq K, Figgitt M, Lee D. Phage therapy against antibiotic resistant and multidrug-resistant infections involving nonhealing wounds and prosthetic joint infections associated with biofilms: a mini-review. Can J Infect Dis Med Microbiol. 2024;2024(1):6252415. doi: 10.1155/2024/6252415, PMID 39545100.
Hatem H, Abdelaziz R. Revolutionizing the fight against multidrug resistant bacteria: phage and phage products as the leading armament in future. J Adv Vet Res. 2024;14(5):913-6.
Zelellw DA, Dessie G, Worku Mengesha E, Balew Shiferaw M, Mela Merhaba M, Emishaw S. A systemic review and meta-analysis of the leading pathogens causing neonatal sepsis in developing countries. BioMed Res Int. 2021;2021(1):6626983. doi: 10.1155/2021/6626983, PMID 34195273.
Shahane K, Kshirsagar M, Tambe S, Jain D, Rout S, Ferreira MK. An updated review on the multifaceted therapeutic potential of Calendula officinalis L. Pharmaceuticals (Basel). 2023;16(4):611. doi: 10.3390/ph16040611, PMID 37111369.
Chaleshtori SH, Kachoie MA, Pirbalouti AG. Phytochemical analysis and antibacterial effects of Calendula officinalis essential oil. Biosci Biotech Res Comm. 2016;9(3):517-22. doi: 10.21786/bbrc/9.3/26.
Hamad MN, Mohammed HJ, Merdaw MA. Antibacterial activity of Calendula officinalis flowers in vitro. IHJPAS. 2011;24(3). doi: 10.30526/24.3.735.
Basch E, Bent S, Foppa I, Haskmi S, Kroll D, Mele M. Marigold (Calendula officinalis L.): an evidence based systematic review by the natural standard research collaboration. J Herb Pharmacother. 2006;6(3-4):135-59. doi: 10.1080/j157v06n03_08, PMID 17317655.
Sherje AP, Dravyakar BR, Kadam D, Jadhav M. Cyclodextrin based nanosponges: a critical review. Carbohydr Polym. 2017;173(1):37-49. doi: 10.1016/j.carbpol.2017.05.086, PMID 28732878.
Shringirishi M, Prajapati SK, Mahor A, Alok S, Yadav P, Verma A. Nanosponges: a potential nanocarrier for novel drug delivery a review. Asian Pac J Trop Dis. 2014 Feb 1;4 Suppl 2:S519-26. doi: 10.1016/S2222-1808(14)60667-8.
Shivani S, Kumar Poladi K. Nanosponges novel emerging drug delivery system: a review. Int J Pharm Sci Res. 2015;6(2):529. doi: 10.13040/IJPSR.0975-8232.6.
Bhuyan C, Saha D, Rabha B. A brief review on topical gels as drug delivery system. J Pharm Res Int. 2021;33(4):344-57. doi: 10.9734/jpri/2021/v33i47A33020.
Ghourab N, Gardouh Ahmed, Gad S, Moustafa Y. Nanosponge as a drug delivery system. Rec Pharm Biomed Sci. 2020;4(1):17-31.
Ahsan Hafiz M, Abbas N, Bukhari NI. Quality by design approach for formulation development and evaluation of carboplatin-loaded ethylcellulose nanosponges. Int J Polym Mater Polym Biomater. 2022;71(13):1012-24. doi: 10.1080/00914037.2021.1933978.
Vamshidhar Reddy D, Sambashiva Rao A. Development and evaluation of nanosponges based controlled release tapentadol tablets by box-behnken design. Volatiles Essent Oils. 2021;8(6):5000.
Abbas N, Parveen K, Hussain A, Latif S, Uz Zaman SU, Shah PA. Nanosponge-based hydrogel preparation of fluconazole for improved topical delivery. Trop J Pharm Res. 2019 Feb 1;18(2):215-22. doi: 10.4314/tjpr.v18i2.1.
Burad S, Markad K, Kulkarni N, Dhole S. Assessment and outcome on preparations characterization of topical targeted nanosponge based drug delivery critical review. Asian Journal of Pharmaceutical and Clinical Research. 2023;16(5):19-26. doi: 10.22159/ajpcr.2023v16i5.46809.
Ghareb M Soliman, Shaaban K Osman, Ahmed M Hamdan. Preparation and evaluation of anthralin biodegradable nanoparticles as a potential delivery system for the treatment of psoriasis. International Journal of Pharmacy and Pharmaceutical Sciences. 2015;7(12):36-40.
Kumar S, Prasad M, Rao R. Topical delivery of clobetasol propionate loaded nanosponge hydrogel for effective treatment of psoriasis: formulation, physicochemical characterization antipsoriatic potential and biochemical estimation. Mater Sci Eng C Mater Biol Appl. 2021 Feb 1;119:111605. doi: 10.1016/j.msec.2020.111605, PMID 33321649.
Gokul M, Umarani G, Esakki A. Green synthesis and characterization of isolated flavonoid mediated copper nanoparticles by using Thespesia populnea leaf extract and its evaluation of anti-oxidant and anti-cancer activity. Int J Chem Res. 2022;6(1):15-32. doi: 10.22159/ijcr.2022v6i1.197.
Aldawsari HM, Badr Eldin SM, Labib GS, El Kamel AH. Design and formulation of a topical hydrogel integrating lemongrass loaded nanosponges with an enhanced antifungal effect: in vitro/in vivo evaluation. Int J Nanomedicine. 2015 Jan 29;10:893-902. doi: 10.2147/IJN.S74771, PMID 25673986.
Ahmed MM, Fatima F, Anwer MK, Ibnouf EO, Kalam MA, Alshamsan A. Formulation and in vitro evaluation of topical nanosponge based gel containing butenafine for the treatment of fungal skin infection. Saudi Pharm J. 2021;29(5):467-77. doi: 10.1016/j.jsps.2021.04.010, PMID 34135673.
Sujitha YS, Muzib YI. Formulation and optimization of quercetin loaded nanosponges topical gel: ex vivo, pharmacodynamic and pharmacokinetic studies. Int J App Pharm. 2019;11(5):156-65. doi: 10.22159/ijap.2019v11i5.32850.
Padmini Iriventi NV Gupta. Development and evaluation of nanosponge loaded topical herbal gel of Wrightia tinctoria. International Journal of Applied Pharmaceutics. 2020;12(1):89-95. doi: 10.22159/ijap.2020v12i1.31198.
Rupal J, Kaushal J, Mallikarjuna SC, Dipti P. Preparation and evaluation of topical gel of valdecoxib. Int J Pharm Sci Drug Res. 2010;2(1):51-4. doi: 10.25004/IJPSDR.2010.020111.
KJ C, Patil MC, Banerjee M, HMA. Preparation and characterization of ficus lacor metallic particles based nanogel for wound healing activity. Int J Curr Pharm Res. 2024;16(1):50-5. doi: 10.22159/ijcpr.2024v16i1.4016.
Rathod AG, Raut AR, Jaiswal SR, Awaghate PD, Sayyed SA, Lasure AB. Formulation development and evaluation of topical herbal gel containing Withania somnifera for enhanced antifungal efficacy. Cuestiones de Fisioterapia. 2025;54(2):1193-213. doi: 10.48047/CU.
Pasha A, Tomar S. Preparation and evaluation of voriconazole hydrogel using cyclodextrin based nano sponges. Asian Journal of Pharmaceutical and Clinical Research. 2025;18(5):184-92. doi: 10.22159/ajpcr.2025v18i5.54060.
Ghurghure S, Pathan M. Preparation and in vitro evaluation of itraconazole loaded nanosponges for topical drug delivery. Indo Am J Pharm Res. 2019;9(4):1999.
Subair TK, Mohanan J. Development of nano based film forming gel for prolonged dermal delivery of luliconazole. Int J Pharm Pharm Sci. 2022;14(2):31-41. doi: 10.22159/ijpps.2022v14i2.43253.
Bakhrushina EO, Anurova MN, Zavalniy MS, Demina NB, Bardakov AI, Krasnyuk II. Dermatologic gels spreadability measuring methods comparative study. Int J Appl Pharm. 2022;14(1):164-8. doi: 10.22159/ijap.2022v14i1.41267.
Kaur M, Nagpal M, Singh M, Singh TG, Aggarwal G, Dhingra GA. Improved antibacterial activity of topical gel based on nanosponge carrier of cinnamon oil. BioImpacts. 2021;11(1):23-31. doi: 10.34172/bi.2021.04, PMID 33469505.
Helal DA, Abd El Rhman D, Abdel Halim SA, El Nabarawi MA. Formulation and evaluation of fluconazole topical gel. Int J Pharm Pharm Sci. 2012;4 Suppl 5:176-83.
Rafiee Tehrani M, Mehramizi A. In vitro release studies of piroxicam from oil in water creams and hydroalcoholic gel topical formulations. Drug Dev Ind Pharm. 2000;26(4):409-14. doi: 10.1081/ddc-100101247, PMID 10769782.
El Gendy AM, Jun HW, Kassem AA. In vitro release studies of flurbiprofen from different topical formulations. Drug Dev Ind Pharm. 2002;28(7):823-31. doi: 10.1081/ddc-120005628, PMID 12236068.
Rao BN, Reddy KR, Fathima SR, Preethi P. Design development and evaluation of diltiazem hydrochloride loaded nanosponges for oral delivery. Int J Curr Pharm Sci. 2020;12(5):116-22. doi: 10.22159/ijcpr.2020v12i5.39784.
Nalawade TM, Bhat KG, Sogi S. Antimicrobial activity of endodontic medicaments and vehicles using agar well diffusion method on facultative and obligate anaerobes. Int J Clin Pediatr Dent. 2016;9(4):335-41. doi: 10.5005/jp-journals-10005-1388, PMID 28127166.
Athanassiadis B, Abbott PV, George N, Walsh LJ. An in vitro study of the antimicrobial activity of some endodontic medicaments and their bases using an agar well diffusion assay. Aust Dent J. 2009;54(2):141-6. doi: 10.1111/j.1834-7819.2009.01107.x, PMID 19473156.
Saleem U, Saleem M, Ahmad B, Hussain K, Ahmad M, Bukhari NI. In vitro antimicrobial susceptibility testing of leaves methanol extract and latex of euphorbia helioscopia using agar well diffusion and broth dilution methods. J Anim Plant Sci. 2015;25(1):261-7.
Abosede OO, Ezegwu LE. Synthesis and spectroscopic characterization of silver (I) mebendazole complexes. Int J Chem Res. 2022;6(2):1-5. doi: 10.22159/ijcr.2022v6i2.203.
Mariana IR. Characterization and antioxidant activity of phytosynthesised silver nanoparticles using Calendula. 2014;62:129-36.
Su X, Yang Z, Tan KB, Chen J, Huang J, Li Q. Preparation and characterization of ethyl cellulose film modified with capsaicin. Carbohydr Polym. 2020 Aug 1;241:116259. doi: 10.1016/j.carbpol.2020.116259, PMID 32507184.
Sudhamani SR, Prasad MS, Udaya Sankar K. DSC and FTIR studies on gellan and polyvinyl alcohol (PVA) blend films. Food Hydrocoll. 2003;17(3):245-50. doi: 10.1016/S0268-005X(02)00057-7.