
Int J App Pharm, Vol 17, Issue 4, 2025, 241-253Original Article
QBD (QUALITY BY DESIGN) APPROACH: DEVELOPMENT AND VALIDATION OF AN RP-HPLC METHOD FOR ESTIMATING IMEGLIMIN HCL AND ITS KETONE IMPURITY
POOJA T. GIRI1, ANURUDDHA R. CHABUKSWAR1*, SWATI C. JAGDALE1, SANTOSH A. CHINDHE2
1Department of Pharmaceutical Sciences, School of Health Sciences and Technology, Dr. Vishwanath Karad MIT World Peace University, Pune-411038, India. 2Chemicea Pharmaceutical Pvt. Ltd., Navi Mumbai, India
*Corresponding author: Anuruddha R. Chabukswar; *Email: anuruddha.chabukswar@mitwpu.edu.in
Received: 08 Apr 2025, Revised and Accepted: 02 Jun 2025
ABSTRACT
Objective: Quality by Design (QbD) is a structured approach that ensures consistently high-quality outcomes by following a systematic methodology. This study aimed to develop and validate a robust and reliable Reverse-Phase High-Performance Liquid Chromatography (RP-HPLC) method for the simultaneous quantification of Imeglimin hydrochloride (IMG) and its ketone impurity, Imeglimin Ketone Impurity (IKI), utilizing a Quality by Design (QbD) approach to ensure enhanced method precision, accuracy, and regulatory compliance.
Methods: A risk-based strategy guided method development, employing the Agilent Zorbax Bonus RP (AZB-RP) column (25 cm×4.6 mm, 5.0 µm) under isocratic elution with a Mobile Phase (MP) of Trifluoroacetic acid (TFA) and Acetonitrile (ACN) (45:55 v/v). Chromatographic conditions included a flow rate of 0.45 ml/min, an injection volume of 10 µl**, and a column temperature of 30 °C. A Central Composite Design (CCD) was applied to study the influence of MP ratio and Flow Rate (FR) on Critical Analytical Parameters (CAPs) using Design Expert 13.0 software.
Results: The method showed excellent linearity with R² = 0.9998 for imeglimin hydrochloride (80–120 ppm) and R² = 0.9994 for its ketone impurity (4–6 ppm) at 238 nm. The recovery was 100.02–100.78% for imeglimin hydrochloride and 99.98–100.02% for the impurity. The Limit of Detection (LOD) and Limit of Quantitation (LOQ) for the impurity were 0.23 ppm and 0.70 ppm, respectively. The Analysis of Variance (ANOVA) results confirmed the model’s significance and predictive ability, highlighting the method’s robustness and reliability for routine quality control applications.
Conclusion: The QbD-based RP-HPLC method described here is accurate, precise, and robust for the simultaneous estimation of IMG and IKI and can be used for routine quality control.
Keywords: Imeglimin hydrochloride, Imeglimin ketone impurity, Quality by design (QBD), RP-HPLC, Central composite design
© 2025 The Authors. Published by Innovare Academic Sciences Pvt Ltd. This is an open access article under the CC BY license (https://creativecommons.org/licenses/by/4.0/)
DOI: https://dx.doi.org/10.22159/ijap.2025v17i4.54506 Journal homepage: https://innovareacademics.in/journals/index.php/ijap
INTRODUCTION
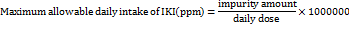
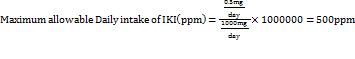
Quality by Design (QbD) principles systematically focus on identifying and controlling variability during method development, whereas ICH validation guidelines assess a method's performance after development. A QbD complements ICH guidelines by proactively reducing variability and enhancing method robustness from the outset [1]. It follows the principle outlined in ICH guideline Q8(R2) [2], Q9(R1) [3], and Q10 [4]. Several factors contribute to variability in analytical methods, including the use of different buffers, solvent polarities, and critical chromatographic parameters such as Flow Rate (FR), proportion of Mobile Phase (MP), and injection volume [5]. The QbD approach emphasizes the identification of key variability sources through scientific, risk-based analysis. It optimizes analytical performance by defining Critical Method Parameters (CMPs), conducting risk assessments, and using statistical tools like Design of Experiments (DoE) to create an optimized, robust method [6]. Imeglimin hydrochloride (IMG) (fig. 1A) is an oral tetrahydrotriazine compound classified under the novel “Glimis” class of antidiabetic agents, used in the treatment of type II diabetes in adults [7–9]. The recommended maximum daily dose of IMG is 1000 mg/day [10, 11]. Imeglimin exhibits unique antihyperglycemic activity by reducing hepatic gluconeogenesis [12], enhancing mitochondrial function [13], and improving glucose homeostasis through the reduction of mitochondrial free radical production [14]. During the synthesis or storage of imeglimin, an impurity known as Imeglimin Ketone Impurity (IKI) may form. Chemically, IKI is defined as 6-(dimethylamino)-4-methyl-1,3,5-triazin-2(1H)-one (fig. 1B). The presence of impurities, particularly at elevated levels, poses potential toxicological risks and presents a significant challenge for pharmaceutical quality control [15–18]. According to the Material Safety Data Sheet (MSDS) provided by K. M. Pharma Solution Private Limited, IKI was not classified as hazardous or carcinogenic. The MSDS explicitly stated "Carcinogenicity: NIL" and "Mutagenicity: NIL," indicating no observed evidence of carcinogenic or mutagenic potential. Furthermore, it reported an LD₅₀ value exceeding 10,000 mg/kg, suggesting low acute toxicity (MSDS file provided in the supplementary data file). According to ICH Q3B(R2) guideline [19], for non-genotoxic impurities in drug products with a daily dose of 1000 mg (1 g), the reporting threshold is 0.05%. This corresponds to an allowable impurity level of 0.5 mg/day. Based on this threshold, the maximum permissible daily intake of imeglimin ketone impurity (IKI) can be calculated according to its concentration in the drug product. To determine the acceptable concentration of IKI in the formulation, the following formula is applied:
This research focused on developing a reliable, sensitive, and easily reproducible RP-HPLC method capable of detecting impurities at concentrations below the established acceptable limit of 500 ppm. The method was thoroughly validated following ICH guidelines.
Existing literature reports several analytical techniques developed for the quantification of imeglimin hydrochloride (IMG) in biological matrices and pharmaceutical formulations, including RP-HPLC [20–22], RP-UHPLC [23], LC-MS/MS for imeglimin enantiomer detection [24], and UV spectroscopy [25, 26] However, the previously reported methods were solely focused on identifying the parent drug and are inadequate for detecting or quantifying related impurities due to their limited sensitivity and selectivity. A comprehensive review of scientific databases revealed no published reports on the simultaneous estimation of IMG and IKI in any pharmaceutical matrix. This significant gap highlights the absence of a validated method that can simultaneously detect and quantify the Active Pharmaceutical Ingredient (API) and its structurally related impurity (IKI) in a single chromatographic run. Additionally, the implementation of the QbD technique aligns with modern regulatory expectations for reducing quality risks during method development. The presence of impurities can significantly affect drug safety; therefore, there is a critical need to develop a robust analytical method capable of accurately and simultaneously estimating both the drug and impurity under regulatory standards. While LC-MS/MS offered high sensitivity, it was often unsuitable for routine pharmaceutical quality control due to its complexity, high operational cost, requirement for a skilled person, and expensive and extensive solvent use. In contrast, HPLC is cost-effective, easier to operate, and widely accepted in quality control laboratories for routine analysis. The current research is focused on developing a rapid, efficient, and sensitive RP-HPLC method for the simultaneous estimation of imeglimin hydrochloride (IMG) and its ketone impurity (IKI), by employing the Central Composite Design (CCD) approach under the QbD framework.
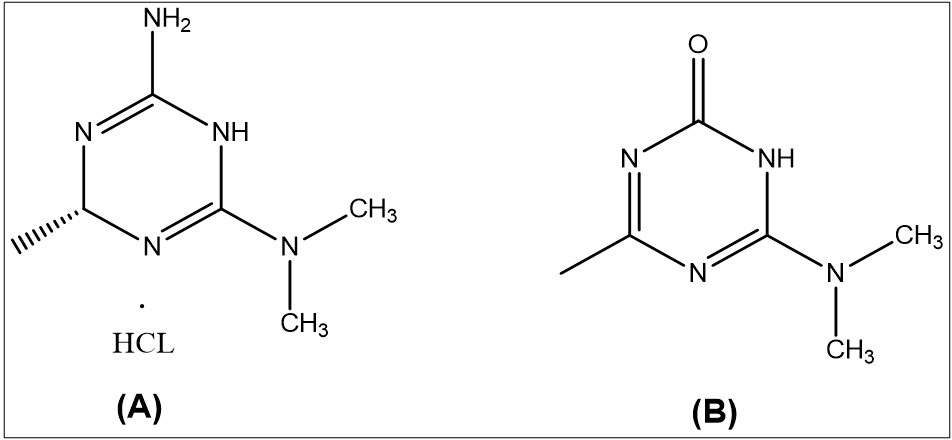
Fig. 1: Chemical structure of A. Imeglimin hydrochloride and B. Imeglimin ketone impurity
MATERIALS AND METHODS
Material and software
Imeglimin hydrochloride (99.93%) and Imeglimin ketone impurity (98.93%) were generously provided by Chemicea Pharmaceuticals Pvt. Ltd., Navi Mumbai, India. Imeglyn® Tablets (500 mg imeglimin hydrochloride, film-coated tablets, Batch No. EMV240338), a product of Zydus Healthcare Pvt. Ltd., were procured from a local pharmacy in Pune, India. Other HPLC-grade chemicals, such as acetonitrile, trifluoroacetic acid, and Milli-Q water, were procured from Thermo Fisher Scientific Pvt. Ltd.
The current study was carried out using an Agilent 1260 Infinity II HPLC system equipped with a diode array detector and a binary gradient pump. The chromatographic separation was achieved on an Agilent Zorbax Bonus-RP column (250 mm×4.6 mm, 5 μm particle size).
The experimental design, method optimisation, and subsequent data analysis were performed using Design-Expert Software version 13.0 (Stat-Ease Inc., USA). Sample processing and chromatographic data integration were carried out using Agilent OpenLab EZChrom software.
Methods
Diluent
The diluent used throughout the study consisted of a 50:50 (v/v) mixture of acetonitrile (ACN) and 0.01% trifluoroacetic acid (TFA) in water.
Sample preparation
A stock solution of IMG was prepared by accurately weighing 10 mg of IMG and dissolving it in 10 ml of the diluent to achieve a concentration of 1000 ppm. A sub-stock solution (100 ppm) was then prepared by taking 1 ml of the stock solution and diluting it to 10 ml with the same diluent. For the IKI, 5 mg was dissolved in 10 ml of the diluent to obtain a 500 ppm stock solution. From this, a 50 ppm sub-stock solution (Sub-SS) was prepared by further dilution. A 5 ppm working solution of IKI was obtained by diluting 1 ml of the 50 ppm Sub-SS to 10 ml with diluent. Finally, 1 ml each of the IMG (100 ppm) and IKI (5 ppm) solutions was combined and diluted with the diluent to a final volume of 10 ml.
Placebo preparation
A homogeneous physical mixture of all excipients, such as microcrystalline cellulose, polyvinylpyrrolidone (PVP K-30), croscarmellose sodium, colloidal silicon dioxide, magnesium stearate, polyethylene glycol 400, titanium dioxide, and purified talc, was prepared by weighing 100 mg of each excipient and blending them thoroughly. An accurately weighed 10 mg portion of this mixture was transferred to a 100 ml volumetric flask. Approximately 70 ml of diluent was added, and the solution was ultrasonicated for 5 min to ensure complete dispersion. The volume was then made up to 100 ml with the same diluent, followed by thorough mixing to obtain a uniform placebo solution.
Preparation of commercial product formulation solution
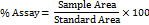
Using a mortar and pestle, 10 imeglimin hydrochloride tablets were ground into a fine powder. An accurately weighed 10 mg portion of the powder was transferred into a volumetric container, dispersed in 10 mL of diluent, and mixed thoroughly to ensure complete dissolution. The mixture was then ultrasonicated for 15 min to ensure complete dissolution, resulting in a final concentration of 1000 ppm. From this, 1 ml of the 1000 ppm solution was transferred and diluted to 10 ml with diluent to prepare a 100 ppm sample solution. The final solution was analyzed in triplicate to determine the % assay using the following formula:
RP-HPLC separating conditions
Chromatographic separation was performed using an Agilent Zorbax Bonus-RP (AZB-RP) column (25 cm×0.46 cm×5.0 µm). The mobile phase comprised of 0.01% trifluoroacetic acid (TFA) and acetonitrile (ACN) in a 45:55 (v/v) ratio. A detection wavelength of 238 nm was selected due to the strong and consistent response of both the drug and its impurity. The column temperature was maintained at 30 °C, and a flow rate of 0.45 ml/min was used to ensure optimal chromatographic performance. The injection volume was 10 µl**. Chromatographic conditions for the initial and optimized HPLC methods were compared for IMG and IKI, as shown in tables 1A and 1B.
Existing literature reports several analytical techniques developed for the quantification of imeglimin hydrochloride (IMG) in biological matrices and pharmaceutical formulations, including RP-HPLC [20–22], RP-UHPLC [23], LC-MS/MS for imeglimin enantiomer detection [24], and UV spectroscopy [25, 26] However, the previously reported methods were solely focused on identifying the parent drug and are inadequate for detecting or quantifying related impurities due to their limited sensitivity and selectivity. A comprehensive review of scientific databases revealed no published reports on the simultaneous estimation of IMG and IKI in any pharmaceutical matrix. This significant gap highlights the absence of a validated method that can simultaneously detect and quantify the Active Pharmaceutical Ingredient (API) and its structurally related impurity (IKI) in a single chromatographic run. Additionally, the implementation of the QbD technique aligns with modern regulatory expectations for reducing quality risks during method development. The presence of impurities can significantly affect drug safety; therefore, there is a critical need to develop a robust analytical method capable of accurately and simultaneously estimating both the drug and impurity under regulatory standards. While LC-MS/MS offered high sensitivity, it was often unsuitable for routine pharmaceutical quality control due to its complexity, high operational cost, requirement for a skilled person, and expensive and extensive solvent use. In contrast, HPLC is cost-effective, easier to operate, and widely accepted in quality control laboratories for routine analysis. The current research is focused on developing a rapid, efficient, and sensitive RP-HPLC method for the simultaneous estimation of imeglimin hydrochloride (IMG) and its ketone impurity (IKI), by employing the Central Composite Design (CCD) approach under the QbD framework.
Table 1A: Initial HPLC method parameters for IMG and IKI
| Parameter | Imeglimin hydrochloride (IMG) | Imeglimin ketone Imp (IKI) |
| Column | AZB-RP (25 cm x 0.46 cm, 5.0µm) | AZB-RP (25 cm x 0.46 cm, 5.0µm) |
| Injection volume (µl) | 10 | 10 |
| Column temp(C) | 30 | 30 |
| Flow Rate (ml/min) | 0.55 | 0.55 |
| Detection(nm) | 238 | 238 |
| Mobile phase (%) | 40:60 | 40:60 |
| Run time(min) | 10 | 10 |
| Asymmetry | 1.03 | 0.85 |
AZB-RP column = Agilent zorbax bonus reversed-phase column
Table 1B: Optimized HPLC method parameters for IMG and IKI
| Parameter | Imeglimin hydrochloride (IMG) | Imeglimin ketone impurity (IKI) |
| Column | AZB-RP (25 cm×0.46 cm, 5.0 µm) | AZB-RP (25 cm×0.46 cm, 5.0 µm) |
| Injection volume (µl) | 10 | 10 |
| Column temp (°C) | 30 | 30 |
| Flow Rate (ml/min) | 0.45 | 0.45 |
| Detection (nm) | 238 | 238 |
| Mobile phase (%) | 45:55 | 45:55 |
| Run time (min) | 10 | 10 |
| Asymmetry | 0.98 | 0.85 |
AZB-RP column = Agilent Zorbax Bonus Reversed-Phase column
Wavelength selection
A 100 ppm solution of imeglimin hydrochloride and a 5 ppm solution of its ketone impurity were scanned in the UV spectral range of 200–400 nm to determine their absorbance characteristics and identify suitable detection wavelengths. The detection wavelength of 238 nm was selected based on its optimal absorbance intensity, which allowed effective detection of the ketone impurity while providing clear and well-defined chromatographic signals for both Imeglimin hydrochloride (IMG) and Imeglimin ketone impurity (IKI).
Studies on factor screening
For the factor screening investigations, key Critical Method Parameters (CMPs), including the proportion of MP-A and FR, were selected based on a preliminary literature review to support optimal method development. These parameters were structured into a matrix to evaluate their combined effects on Critical Method Attributes (CMAs), such as Retention Time (RT), Theoretical Plates (TP), and Resolution (Rs). Table 2 presents an overview of the CMPs, their assigned levels, and their influence on the CMAs.
Table 2: Independent variables and their levels in central composite design (CCD)
| Factor independent variables | Factor level | ||
| -1 | 0 | +1 | |
| Aqueous phase concentration(A) | 30% | 40% | 50% |
| Flow Rate(B) | 0.40 | 0.50 | 0.60 |
| Dependent variables | |||
| Time of retention IMG (R1) | N/A | N/A | N/A |
| Time of retention IKI (R2) | N/A | N/A | N/A |
| Theoretical plates count of IMG (R3) | N/A | N/A | N/A |
| Theoretical plates count of IKI (R4) | N/A | N/A | N/A |
| Resolution (R5) | N/A | N/A | N/A |
Method development using an experimental design
Identifying CMPs is insufficient, it is also important to consider the overall effect of all observed CMPs during chromatographic separation. A set of experimental runs was created using the CCD in Design of Expert (DoE)version 13.0, focusing on two factors like the proportion of MP-A and FR. Five key responses were monitored, such as RT of IMG(R1), RT of IKI(R2), TP for IMG(R3), TP for IKI(R4), and resolution(R5). DoE version 13.0 was used to create the study. Table 3 presents the design matrix with nine trial runs generated by the software. All experimental runs were examined for CMAs (RT, Rs, TP) employing a standard concentration of 100 ppm IMG and 5 ppm IKI.
Table 3: Experimental design with variables (CMPs) and replies
| Runs | Mobile phase A (%) | Flow rate (ml/min) | Imeglimin hydrochloride | Imeglimin ketone impurity | |||
| Retention period (Min) R1 | Theoretical plates (N) R3 | Retention period (Min) R2 | Theoretical plates (N) R4 | Resolution R5 |
|||
| 1 | 45 | 0.45 | 3.93 | 13225 | 4.86 | 10113 | 5.66 |
| 2 | 35 | 0.50 | 3.54 | 11325 | 4.39 | 5826 | 4.67 |
| 3 | 45 | 0.50 | 3.53 | 12664 | 4.36 | 9017 | 5.39 |
| 4 | 40 | 0.55 | 3.21 | 11424 | 3.97 | 8647 | 5.27 |
| 5 | 35 | 0.45 | 3.92 | 11960 | 4.84 | 4126 | 4.14 |
| 6 | 45 | 0.55 | 3.21 | 11809 | 3.96 | 9062 | 5.3 |
| 7 | 40 | 0.50 | 3.53 | 12100 | 4.36 | 8514 | 5.21 |
| 8 | 35 | 0.55 | 3.21 | 10794 | 4 | 5502 | 4.64 |
| 9 | 40 | 0.45 | 3.93 | 12958 | 4.86 | 10327 | 5.67 |
Software-aided method optimization
The robustness of HPLC methods has not been extensively explored using design methodologies in existing literature. In this study, critical chromatographic parameters were identified through preliminary experimentation, and various factors were incorporated into the method development process following a literature review. The selected factors included the proportion of MP-A (volume of 0.01% TFA) and the FR. We employed the CCD approach to evaluate the impact of two key chromatographic parameters (FR and proportion of MP-A) on five critical response variables.
In this study, two essential factors were investigated at three levels: low (−1), medium (0), and high (+1). The first factor (A) represented the proportion of mobile phase A, set at 30%, 40%, and 50%, while the second factor (B) corresponded to FR, tested at 0.40, 0.50, and 0.60 ml/min. The response variables measured were RT of IMG (R1) and IKI (R2), TP for IMG (R3) and IKI (R4), and resolution (R5), as detailed in table 3. The collected data were analysed with Design-Expert software version 13.0. It was discovered that a quadratic response surface model fit best suited for R1 and R2, and a linear model provided a better fit for R3, R4, and R5. These models allowed for an efficient interpretation of how each response varied with variation in the experimental factors, ultimately guiding the optimization of chromatographic conditions for peak performance [22]. The appropriateness of these models was confirmed by testing their suitability through a series of statistical metrics, including the correlation coefficient, degrees of freedom (df), p-value, sum of squares, F-statistic, adjusted R², and predicted R². Response surface analysis was also performed, and both 2D contour and 3D response surface plots were constructed to illustrate the interaction effects between experimental factors and corresponding responses. Finally, optimal chromatographic conditions were determined by precisely adjusting numerical functions to obtain the desired effect, ensuring an efficient and well-optimised separation process.
Optimized method
The optimized method was validated based on the standard procedure given in the ICH Q2(R1) guideline [28]. These guidelines emphasize the importance of system suitability tests to validate the performance of analytical equipment. Before the sample analysis, crucial parameters such as the TP, Rs, and asymmetry were evaluated by injecting six replicates of standard solutions of 100 ppm of IMG and 5 ppm of IKI. The results yielded %RSD values of<2.0%, depicting that the method was within the desired limits and suitable for analysis [29]. Five distinct concentrations of IMG (80–120 ppm) and IKI (4-6 ppm) were prepared for linearity analysis and explored by plotting the calibration curve. A linear regression analysis was conducted to evaluate the linearity of the method. The method was validated for repeatability by injecting a 100 ppm concentration of IMG and a 5 ppm concentration of IKI six times, and % RSD was monitored. Accuracy was validated by spiking standard samples of IMG (100 ppm) and IKI (5 ppm) with a placebo. A target concentration of IMG and IKI (80%, 100%, and 120%) was spiked with placebo, and three replicates of each solution were prepared. Recovery percentages and %RSD values were obtained to explore the accuracy of the method.
The method's reliability was established by evaluating its performance on intraday (same day) and various days over several days (interday). For this purpose, six sample solutions were prepared, each containing IMG (100 ppm) and IKI (5 ppm). The method’s precision was established by analyzing the following six successive injections (10 µl** each) carried out daily over six consecutive days. The LOD and LOQ were determined following ICH guidelines. To assess the method's robustness, deliberate and minor variations were introduced into the chromatographic conditions, such as slight changes in column oven temperature and detection wavelength, to observe their effect on performance.
RESULTS
The primary aim of the present study was to develop and validate an accurate, precise, and reliable QbD-based RP-HPLC method for the simultaneous estimation of IMG and IKI from pharmaceuticals. This study mostly relies on literature articles, and our trials begin with preliminary testing to identify suitable setpoints and input targets for optimising the experimental outcomes. Multiple experiments were conducted using different MP compositions, columns, and chromatographic conditions to refine and improve the analytical method [30]. Buffer systems composed of 0.1% TFA and ACN were tested in various ratios: 80:20, 60:40, 50:50, 40:60, and 30:70. These trials were conducted on an AZB RP column (25 cm×4.6 mm, 5.0 µm) at a FR of 1.00 ml/min with an injection volume of 50 µl. The results showed merged peaks at a mobile phase ratio of 80:20, and M-shaped, poorly resolved peaks at other ratios, indicating inadequate separation of IMG and IKI.
To address these issues, several method parameters were modified. The FR was reduced from 0.75 mL/min to 0.50 mL/min to improve resolution. The concentration of TFA was reduced from 0.1% to 0.01% to minimize peak broadening. The injection volume was also reduced from 50 µl to 10 µl to prevent column overloading. These modifications led to the optimization of the separation conditions, which were a 40:60 ratio of 0.01% TFA in water to ACN, an FR of 0.50 mL/min, an injection volume of 10 µl, and a detection wavelength of 238 nm. Under these conditions, the retention time was recorded at 3.51 min, the peak area was 12,076, and the peak purity index was 1.03. The detection of the ketone impurity was also greatly improved. Therefore, the proportion of MP-A and the FR were among the most critical factors in method development.
QBD-assisted method optimization
Optimization of the analytical method was carried out using CCD. The study focused on two critical factors, the proportion of MP-A and the FR, which were under investigation since they play a vital role in optimizing the RP-HPLC method. This design allowed the evaluation of the combined effects of the variables on the significant chromatographic responses as a RT of IMG (R1), RT of IKI (R2), theoretical plates (TP) for IMG (R3), TP for IKI (R4), and resolution (R5) to evaluate the robustness of the method. Advanced mathematical models were developed to describe the relationships between the experimental variables and the measured outcomes. A quadratic response surface model provided the best fit for the theoretical RT of IMG (R1) and IKI (R2), and a linear response surface model yielded the best fit for the TP of IMG (R3), TP of IKI (R4), and resolution (R5). These models accurately represented the relationships between the experimental factors and chromatographic responses, supporting optimal method optimization within the CCD framework. To ensure the accuracy and reliability of the models, validation was carried out using Analysis of Variance (ANOVA) in DoE software. This validation confirmed the statistical significance and predictive power of the models, ensuring their effectiveness in optimizing the RP-HPLC method.
The predicted (Pred) R² values for the RT of IMG (R₁) and IKI (R₂), and TP for IMG (R₃) and IKI (R₄), were found to be in good agreement with their respective adjusted (Adj) R² values, with differences less than 0.2, ensuring the regression model predictive accuracy and minimal overfitting. The ANOVA results, as presented in table 4, confirm the statistical significance of the developed models for all five responses (R₁-R₅), with all p-values being less than 0.05, suggesting that the factor has a statistically significant effect on all five responses, meaning the results are unlikely to have occurred by chance [31]. In particular, response R₃ exhibited a highly significant model with a p-value of<0.0001 and a high F-value of 111.00, confirming its robustness. Similarly, A high F-value indicates that the variation caused by the factor is much greater than random error [32]. Furthermore, the F-values (e. g., R1 = 33.92, R2 = 16.77, R3 = 111.00) are relatively high, suggesting that the variance explained by the model is substantially greater than the unexplained (random) variance. This supports the robustness of the model in describing the relationship between variables. These findings confirm that the models for R1-R3 are highly predictive and statistically significant, while R4 and R5 show moderate significance.
For responses R₄ and R₅, the p-values remained below the 0.05 threshold, confirming their statistical significance. However, for the resolution between IMG and IKI (R₅), the Pred R² value showed a weaker agreement with the Adj R². Despite this, the adequate precision value for R₅ exceeded the recommended threshold of 4.0, indicating a sufficient signal-to-noise ratio and supporting the model’s reliability. Additionally, the sequential p-value for R₅ was found to be 0.0372, which reinforces the validity of the model. Adequate precision measures the model’s ability to distinguish between the signal (true effect) and random noise, and values above 4 for all responses (R₁ to R₅) confirm that the models possess adequate signal strength. Overall, the results demonstrate that the linear and quadratic models developed are statistically robust and suitable for exploring and optimizing the design space.
Table 4: Result of ANOVA study
| Parameter | Responses | ||||
| R1 | R2 | R3 | R4 | R5 | |
| P value | 0.0087 | 0.0235 | <0.0001 | 0.0246 | 0.0372 |
| F value | 33.92 | 16.77 | 111.000 | 7.31 | 5.98 |
| PRESS value | 0.00012 | 0.0040 | 3.267E+05 | 2.679E+07 | 1.80 |
| Predicted R2 | 0.9984 | 0.9966 | 0.9365 | 0.3070 | 0.1504 |
| Adjusted R2 | 0.9996 | 0.9992 | 0.9649 | 0.6121 | 0.5547 |
| R2 | 0.9999 | 0.9997 | 0.9737 | 0.7090 | 0.6660 |
| Adequate precision | 147.0828 | 100.4427 | 29.7375 | 5.9560 | 5.3090 |
| Sum of squares | 0.0024 | 0.0041 | 5.006E+06 | 2.744E+07 | 1.41 |
| Df | 2 | 2 | 2 | 2 | 2 |
| MS | 0.0012 | 0.0026 | 2.503E+06 | 1.372E+07 | 0.7065 |
P value: Probability value, F value: Fisher value, PRESS value: Predicted Residual Error Sum of Squares value, R2: Coefficient of Determination, Df: Degrees of Freedom. MS: mean of square, R1: Retention time of IMG, R2: Retention time of IKI, R3: Theoretical plates of IMG, R4: Theoretical plates of IKI, R5: Resolution.
The predictive equations formulated in terms of coded factors serve as powerful tools for forecasting response outcomes at varying factor levels. These equations play a critical role in QbD, enabling precise quantification of factor influence and facilitating effective process optimization. By analysing factor coefficients, the relative impact of each parameter on the response can be systematically determined, where larger coefficients indicate a stronger influence. The final predictive model equation for R₁-R5 is expressed as follows:
IMG: R1 =+3.53+0.0000A-0.3583B-0.0025AB+0.0000A2+0.0350B2;
IKI: R2 =+4.37-0.0083A-0.4383B-0.0150AB+0.0050A2+0.0450B2;
IMG: R3 =+12028.78+603.17A-686.00B;
IKI: R4 =+7906.00+2126.33A-229.17B;
Resolution of IMG and IKI: R5 =+511+0.4833A-0.0433B.
Based on the sign and magnitude of the coefficients, it was observed that the proportion of mobile phase A positively influenced responses R₁, R₃, R₄, and R₅, while it had a negative impact on R₂. The FR (factor B) showed a negative impact on all responses (R₁-R₅), indicating that increasing the flow rate generally decreased performance metrics. The interaction between A and B had a negative impact on R₁ and R₂, suggesting a combined diminishing effect on retention times. Additionally, the quadratic terms A² and B² had a positive influence on R₁ and R₂, signifying curvature in the response surface. The response surface and contour plots were analysed to evaluate the impact of various factors and their interactions on the observed responses [33]. Fig. 2 and 3 illustrate 2D surface and contour plots depicting the effect of the proportion of MP-A (A) and FR (B) on RT for IMG (R1) and IKI (R2). The analysis revealed that RT for both compounds was primarily governed by FR (B), where higher flow rates led to significantly reduced retention times. In contrast, a high proportion of mobile phase A had minimal impact on R₁ and R₂.
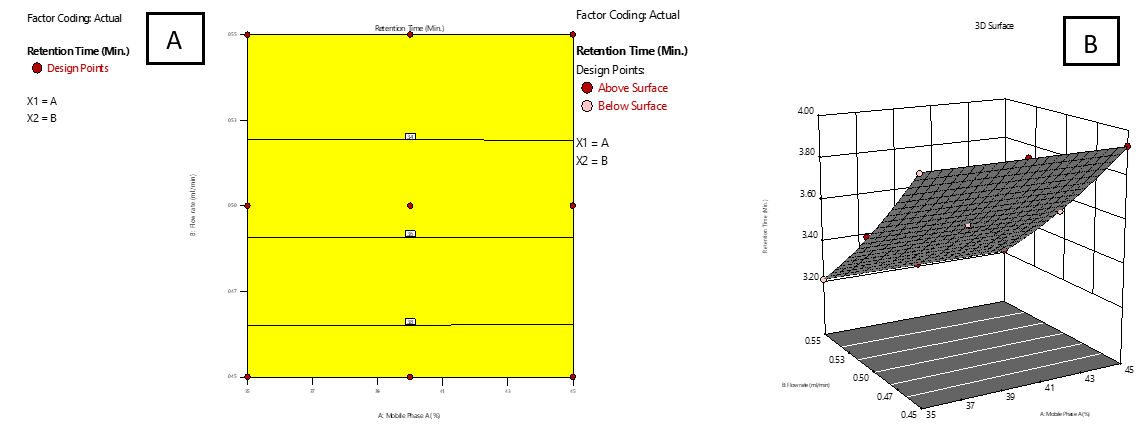
Fig. 2: Effect of combined factors X1 (Proportion of Mobile phase-A, A) and X2 (Flow rate, B) on the Retention Time (RT) of IMG using Central Composite Design (CCD). A: Contour plot illustrating interaction effects; B: 3D surface plot showing the response surface curvature
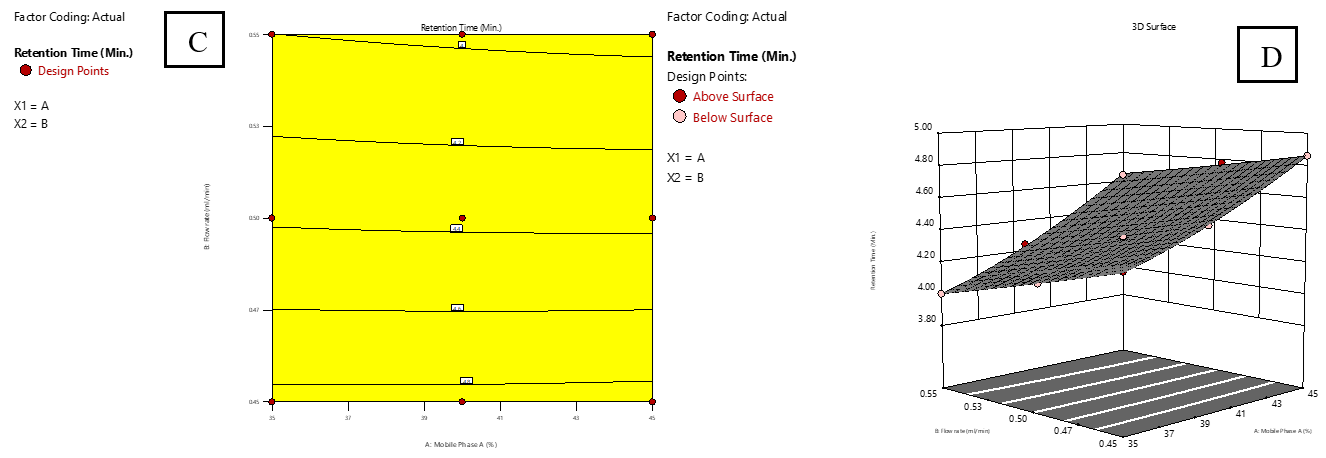
Fig. 3: Effect of combined factors X1 (Proportion of mobile phase-A, A) and X2 (Flow rate, B) on the retention time (RT) of IKI using Central Composite Design (CCD). C: Contour plot illustrating interaction effects; D: 3D surface plot showing the response surface curvature
Fig. 4 and 5 display 2D surface and contour plots illustrating the impact of the proportion of MP-A (A) and flow rate (B) on the TP of IMG (R3) and IKI (R4). Higher levels of factor a enhanced column efficiency, resulting in increased TP for both IMG and IKI. In contrast, an increase in flow rate (B) led to a drop in TP count, indicating decreased efficiency.
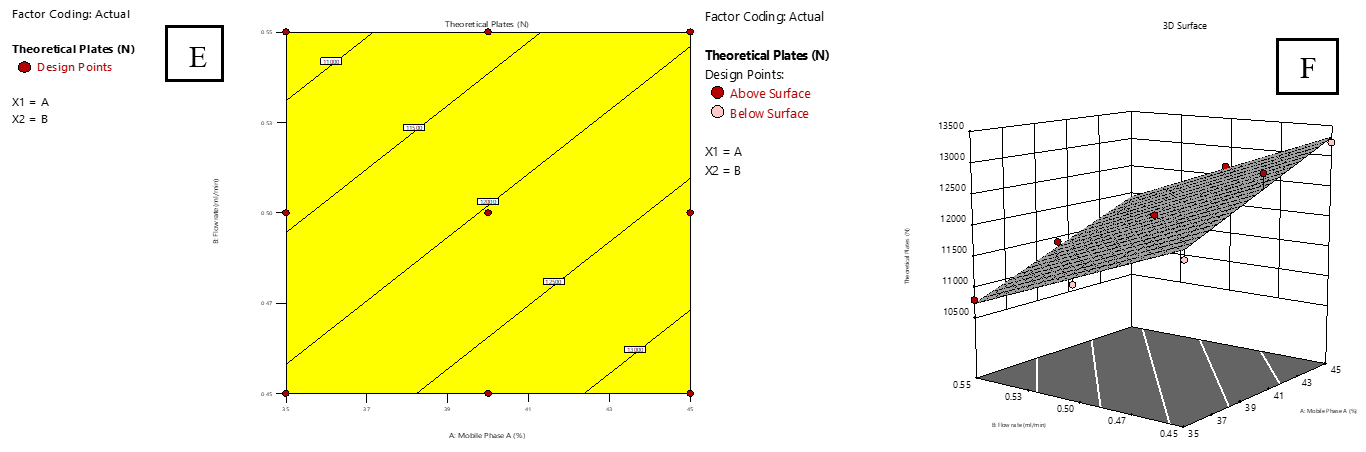
Fig. 4: Effect of combined factors X1 (Proportion of mobile phase-A, A) and X2 (Flow rate, B) on the theoretical plates count (TP) of IMG using central composite design (CCD). E: Contour plot illustrating interaction effects; F: 3D surface plot showing the response surface curvature
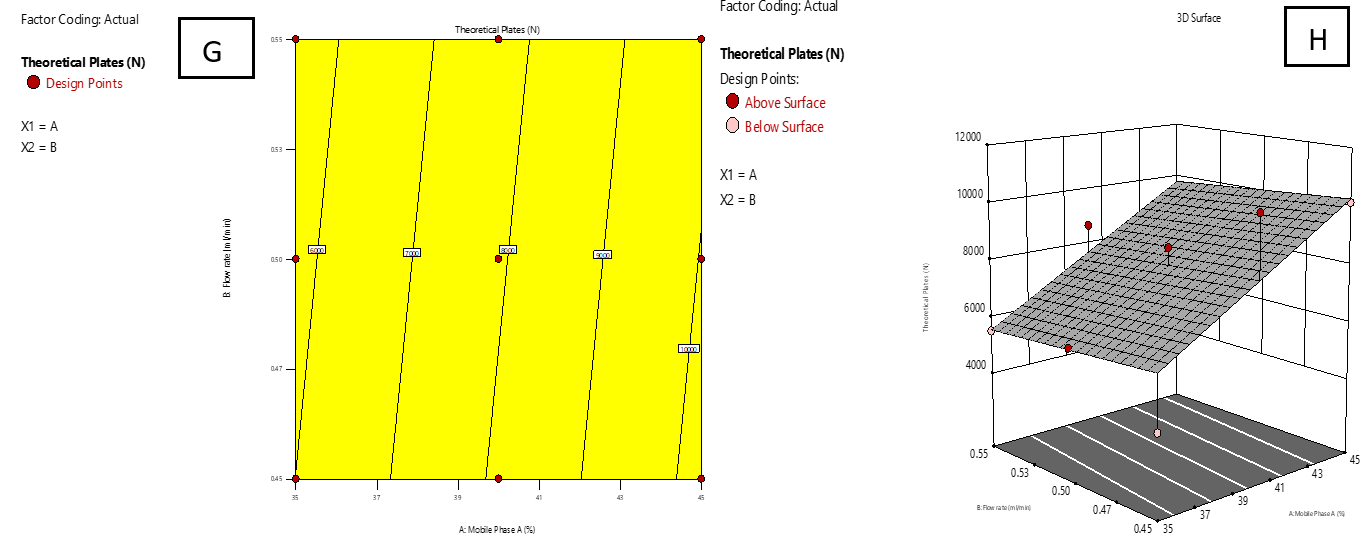
Fig. 5: Effect of combined factors X1 (Proportion of Mobile phase-A, A) and X2 (Flow rate, B) on the theoretical plates count (TP) of IKI using central composite design (CCD). G: Contour plot illustrating interaction effects; H: 3D surface plot showing the response surface curvature
Resolution determines the degree of separation between IMG and IKI, ensuring accurate quantification in chromatographic analysis. As shown in fig. 6, the response surface plot remains nearly flat, confirming that resolution (R5) is relatively stable across variations in A and B. The contour plot also demonstrates a linear trend, reinforcing the minor influence of these factors on resolution. The regression model indicates that Factor A has a positive effect, suggesting that increasing A marginally improves resolution. Conversely, Factor B exhibits a negative effect, implying minimal impact on separation.
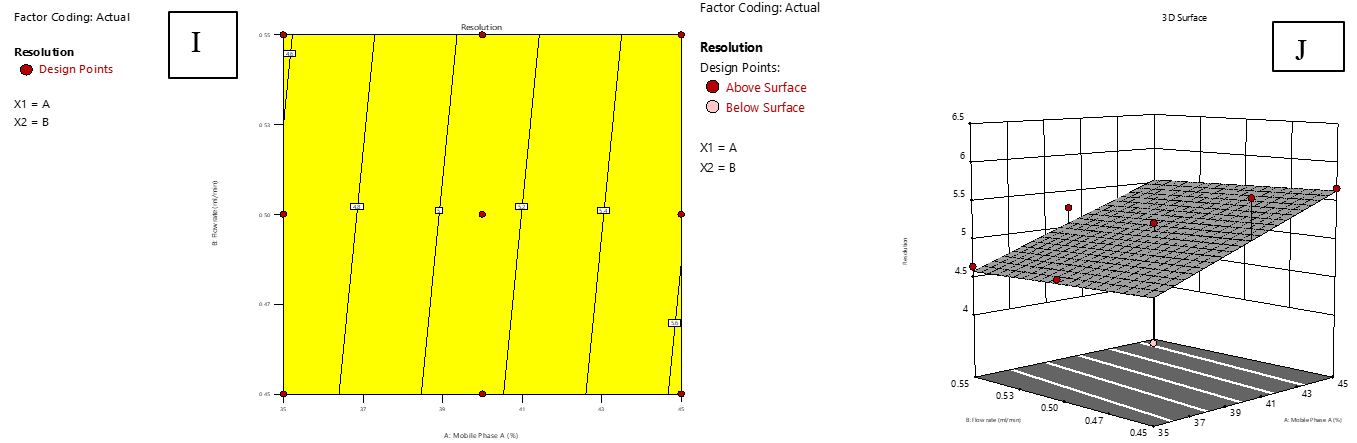
Fig. 6: Effect of combined factors X1 (Proportion of mobile phase-A, A) and X2 (Flow rate, B) on the resolution of IMG and IKI using central composite design (CCD). I: Contour plot illustrating interaction effects; J: 3D surface plot showing the response surface curvature
The overall effects of the selected factors (flow rate and proportion of mobile phase-A) on the five responses (R₁-R₅) were as follows: Higher flow rates reduced the RT of both IMG and IKI but compromised the TP, indicating a decrease in column efficiency. The resolution between the compounds was slightly affected, although it remained relatively stable across the tested conditions. An increased proportion of mobile phase A had minimal effect on the RT of both IMG and IKI, but improved the TP and slightly enhanced the resolution for both IMG and IKI.
The composite desirability function was applied using Design Expert software to optimise multiple chromatographic responses simultaneously. Retention times (R1, R2) were minimised to reduce analysis time, TP (R3, R4) were maximised to enhance efficiency, and resolution (R5) was maximised to ensure effective separation. Resolution was given the highest weight due to its critical role, followed by theoretical plates and retention times. The software calculated individual desirability scores (ranging from 0 to 1) and combined them using a weighted geometric mean to generate a composite desirability value of 0.988, indicating excellent overall performance. The optimised conditions, comprising a mobile phase (0.01% TFA: Acetonitrile, 45:55) and flow rate (0.45 ml/min), were selected for the final method. These parameters yielded acceptable retention times, high column efficiency, minimal peak tailing, and a resolution value of≥2.0, as shown in fig. 7. This confirms that the selected method is robust, reproducible, and aligned with QBD principles.
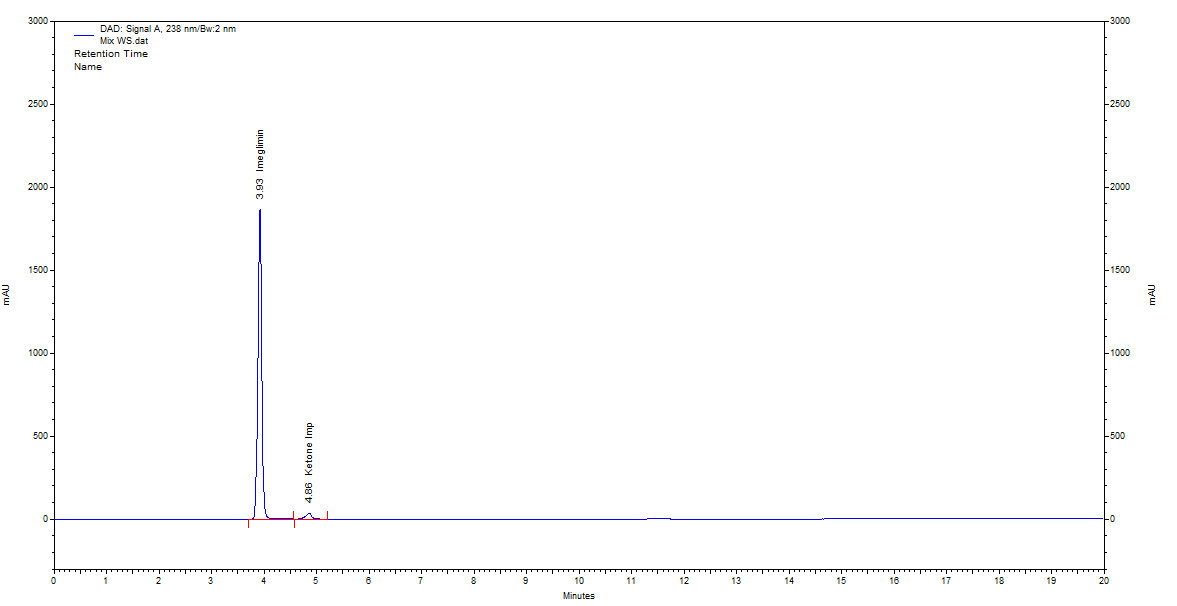
Fig. 7: Chromatogram of optimised condition
Method validation
The most challenging aspect in developing a new analytical method was achieving satisfactory separation of the active pharmaceutical ingredients (APIs). To ensure maximum effectiveness, the chromatographic conditions were meticulously optimized. The developed method was then validated against a set of prescribed parameters, including specificity, linearity, accuracy, robustness, precision, LOD and LOQ, following ICH Q2(R1) guidelines. During the system suitability test, the USP tailing factor and TP count were evaluated by injecting standard solutions. The acceptance criteria are summarised in table 5, while the results of system suitability parameters for the developed method are presented in table 6.
Table 5: System suitability acceptance criteria as per USP guidelines
| Parameter | Acceptances criteria |
| USP plate count | Not less than 2000 |
| USP plate tailing (Asymmetry) | Not more than 2.0 |
| USP resolution | Not less than 2.0 |
| % RSD | Not more than 2.0 |
Table 6: Evaluation of system suitability parameter for IMG and IKI
| Sample | Imeglimin hydrochloride (IMG) | Imeglimin ketone impurity (IKI) | |||
| TP | Asymmetry | TP | Asymmetry | Resolution | |
| Standard 1 | 13497 | 0.93 | 10622 | 0.84 | 5.76 |
| Standard 2 | 13121 | 0.94 | 10264 | 0.84 | 7.76 |
| Standard 3 | 13652 | 0.93 | 10325 | 0.85 | 5.76 |
| Standard 4 | 13741 | 0.93 | 10478 | 0.84 | 5.75 |
| Standard 5 | 13542 | 0.94 | 10556 | 0.85 | 5.75 |
| Standard 6 | 13697 | 0.93 | 10356 | 0.85 | 5.76 |
| mean±SD | 13541.7±225.828 | 0.933333333±0.005163978 | 10433.5±140.732 | 0.845± 0.005477226 | 6.09±0.818144242 |
| %RSD | 1.67 | 0.55 | 1.35 | 0.65 | 13.43 |
n=6, TP: Theoretical plates, SD: Standard deviation, RSD: Relative standard deviation.
Specificity of the analytical method was confirmed by comparing the chromatograms of blank (fig. 8), the chromatogram of the placebo (fig. 9), standard solutions of IMG (fig. 10) and standard solution of IKI (fig. 11), and tablet samples (fig. 12). This comparison was conducted to verify the absence of interference from excipients or other components. Since it is clear from the fig. below, active ingredients were easily separated from the blank and excipients and no interference was found at the RT of IMG and IKI. Thus, it is confirmed that the method is specific.
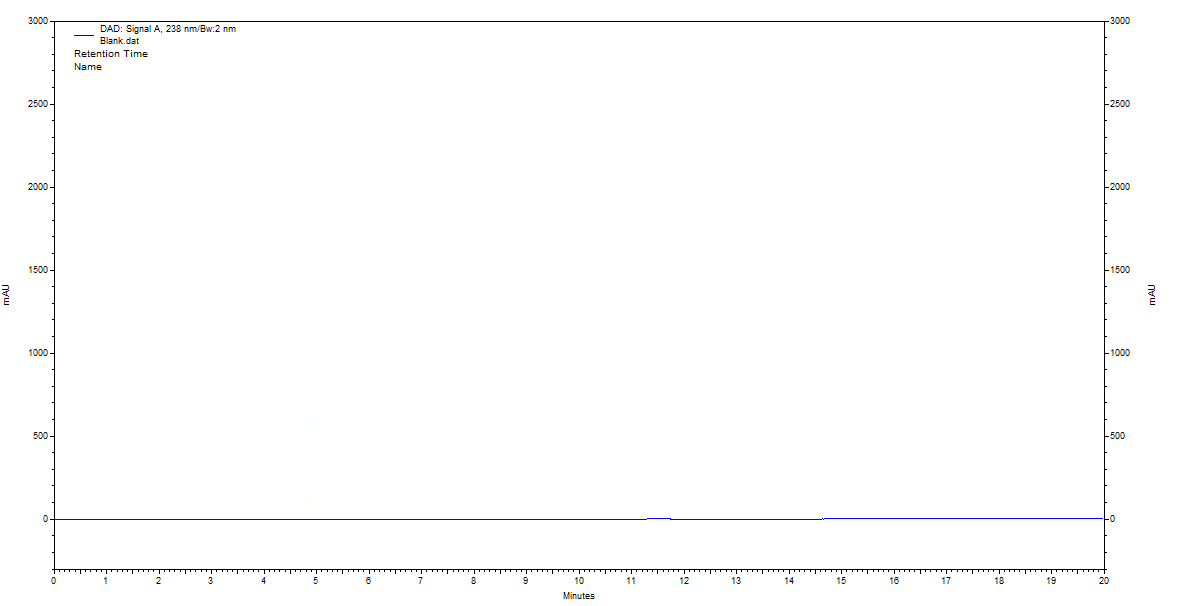
Fig. 8: Chromatogram of blank
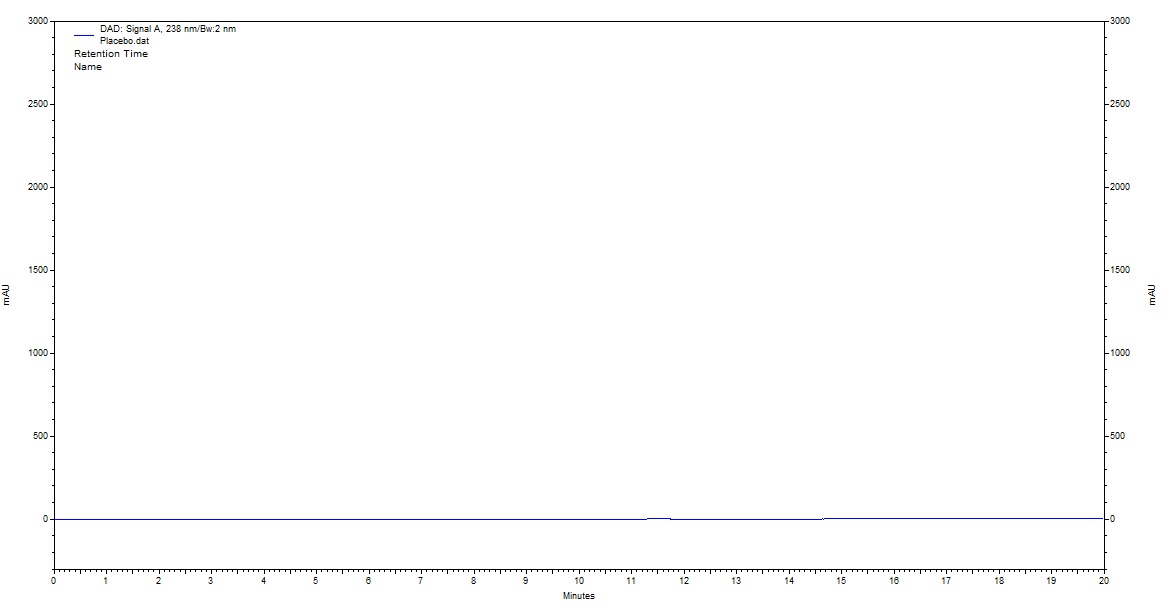
Fig. 9: Chromatogram of the placebo sample

Fig. 10: Chromatogram of standard imeglimin hydrochloride obtained by optimized RP-HPLC conditions
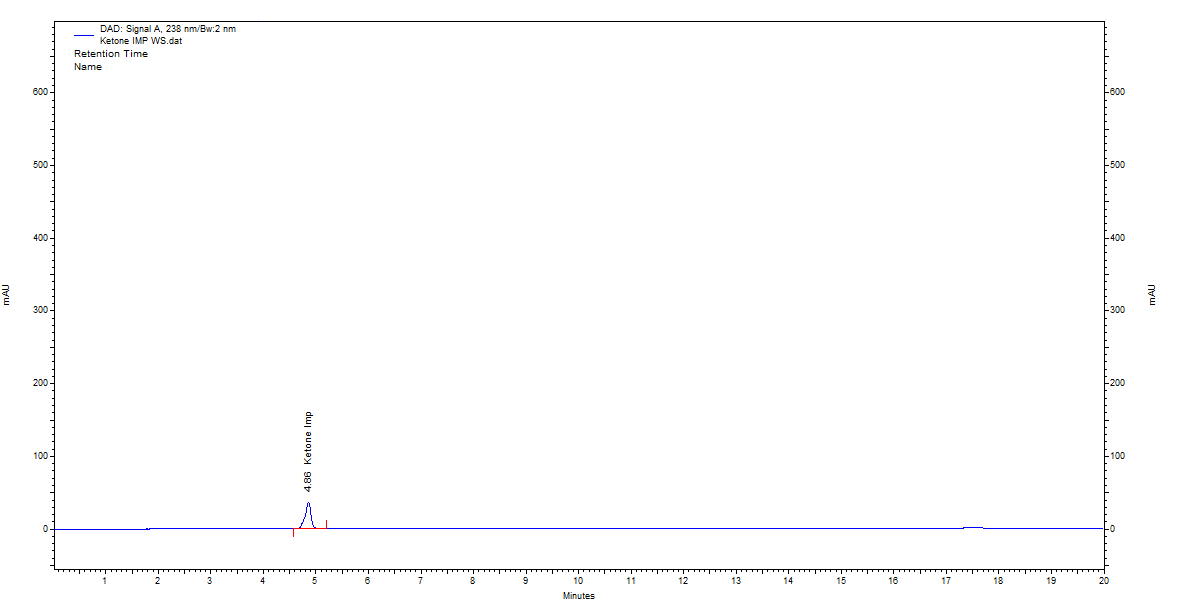
Fig. 11: Chromatogram of standard imeglimin ketone impurity obtained by optimized RP-HPLC conditions
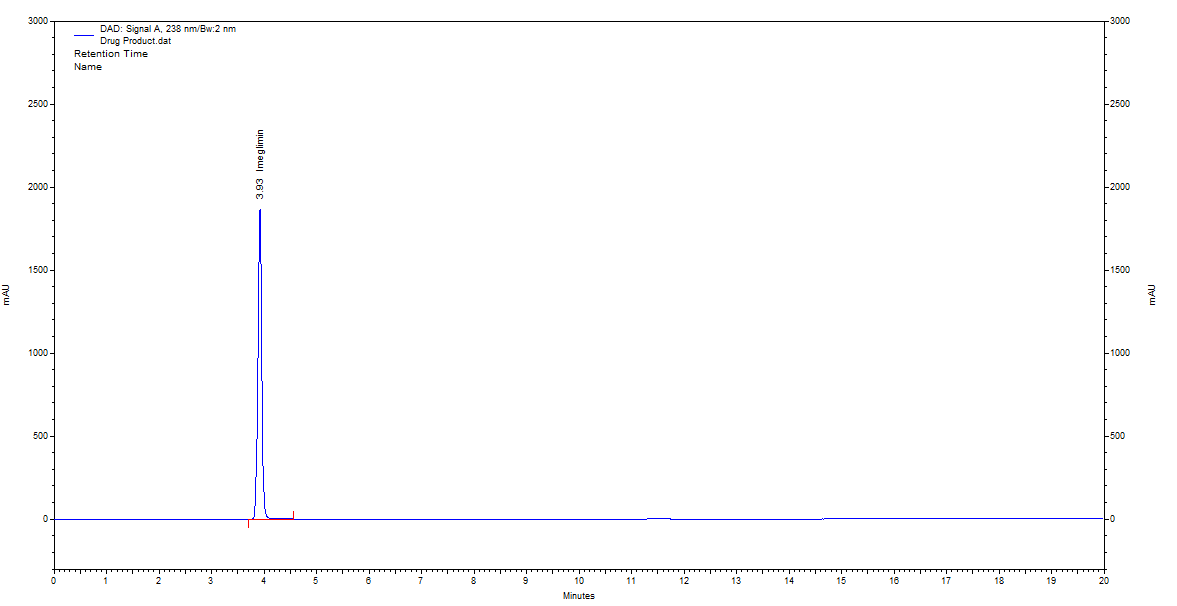
Fig. 12: Chromatogram of imeglimin hydrochloride tablet sample
The method exhibited excellent linearity over the concentration ranges of 80-120 ppm for IMG and 4-6 ppm for IKI. The regression equation of IMG was y = 201268x+95193 with an R² value of 0.9998, while for IKI the equation was y = 114181x+4539.8 with an R² value of 0.9994. These high correlation coefficients indicate a strong linear relationship between concentration and peak area. The linearity data are summarised in table 7 and illustrated in fig. 13.
Table 7: Data of the linearity study
| S. No. | Conc. (ppm) of imeglimin hydrochloride | Conc. (ppm) of imeglimin hydrochloride | Area of imeglimin hydrochloride | Area of imeglimin ketone impurity |
| 1 | 80 | 4 | 16229830 | 450082 |
| 2 | 90 | 4.5 | 18220172 | 510080 |
| 3 | 100 | 5 | 20156935 | 568527 |
| 4 | 110 | 5.5 | 22199471 | 625134 |
| 5 | 120 | 6 | 24303583 | 678008 |
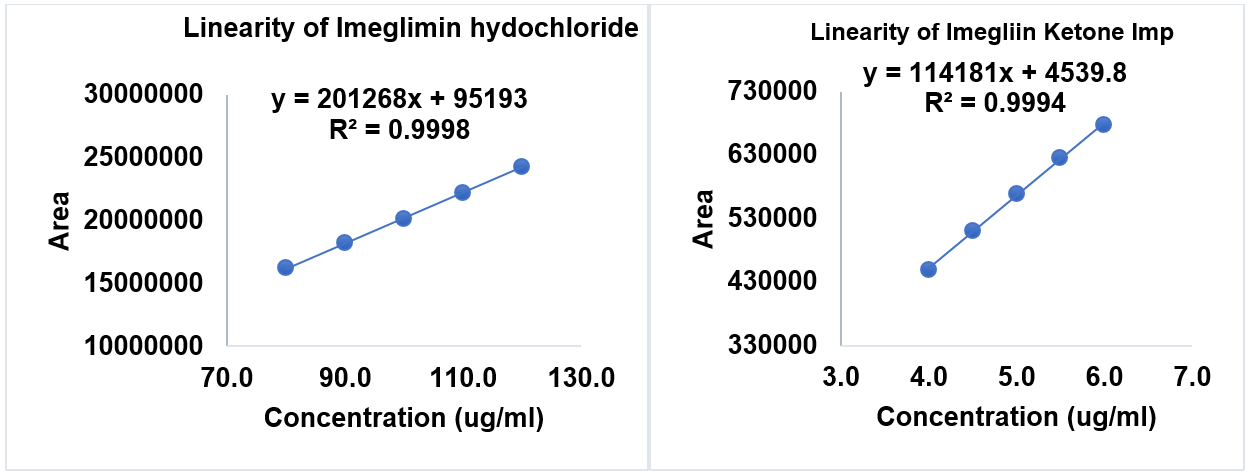
Fig. 13: Calibration curve of IMG and IKI
To evaluate the precision of the developed method, six replicate injections of 100 ppm IMG and 5 ppm IKI were performed. The precision was assessed by calculating the %RSD, as shown in table 8.
Table 8: Data of method precision
| S. No. | IMG area | IKI area |
| 1 | 20151374 | 567584 |
| 2 | 20115473 | 562614 |
| 3 | 20112374 | 559662 |
| 4 | 20163974 | 563254 |
| 5 | 20027463 | 564725 |
| 6 | 20163914 | 562548 |
| mean±SD | 20122429± 51870.68 | 563398± 2630.56 |
| %RSD | 0.26 | 0.47 |
n=6, SD: Standard deviation, RSD: Relative standard deviation
Table 9: Result of precision study
| Imeglimin hydrochloride (IMG) | |||||||
| Interday | Time (H) | 1 | 2 | 4 | 6 | 8 | 10 |
| Area | 20265871 | 20136942 | 20459314 | 20658743 | 20261354 | 20213456 | |
| Assay (%) | 100.16 | 99.52 | 101.11 | 102.10 | 100.13 | 99.90 | |
| mean±SD | 100+0.9490 | ||||||
| %RSD | 0.94 | ||||||
| Intra-day | Day | 1 | 2 | 3 | 4 | 5 | 6 |
| Area | 20162541 | 20534753 | 20468514 | 20713647 | 20435743 | 20352143 | |
| Assay (%) | 99.64 | 101.48 | 101.16 | 102.37 | 100.99 | 100.58 | |
| mean±SD | 101.03±0.91 | ||||||
| %RSD | 0.90 | ||||||
| Imeglimin ketone impurity (IKI) | |||||||
| Interday | Time (H) | 1 | 2 | 4 | 6 | 8 | 10 |
| Area | 562314 | 562134 | 552478 | 573264 | 556412 | 572632 | |
| Assay (%) | 102 | 101.97 | 100.22 | 103.99 | 100.93 | 103.87 | |
| mean±SD | 102±1.5238 | ||||||
| %RSD | 1.49 | ||||||
| Intra-day | Day | 1 | 2 | 3 | 4 | 5 | 6 |
| Area | 561662 | 561357 | 552364 | 572651 | 556982 | 553621 | |
| Assay (%) | 101.88 | 101.83 | 100.20 | 103.88 | 101.03 | 100.42 | |
| mean±SD | 102±1.34 | ||||||
| %RSD | 1.32 |
n =6, SD: Standard deviation, % RSD: Percent relative standard deviation
Intraday precision was evaluated by injecting six replicate samples containing 100 ppm of IMG and 5 ppm of IKI into the RP-HPLC system on the same day. The mean, SD, and %RSD values were computed using the observed peak area values. The finding indicated that the proposed method produced highly accurate results, with assay percentages close to 100% and %RSD values of 0.90 for IMG and 1.32 for IKI, both of which are within the acceptable range of 2%. To establish intermediate (interday) precision, six replicate injections of a sample solution containing 100 ppm of IMG and 5 ppm of IKI were established over different days. The peak areas of the analytes were recorded, which were used as the basis for calculating the mean, SD, and %RSD values. The finding indicated good precision, with %RSD values of 0.94 for IMG and 1.49 for IKI, both of which are within the acceptable limit of 2%. Additionally, the % assay values of IMG were found to be approximately 100%. Detailed results are shown in the accompanying table 9.
The accuracy of the developed method was evaluated using the standard addition method, where in known quantities of IMG and IKI were added in triplicate at three concentration levels, as 80%, 100%, and 120%. Specifically, concentrations of 80 ppm, 100 ppm, and 120 ppm of IMG, alongside 4 ppm, 5 ppm, and 6 ppm of IKI, were incorporated into the system for analysis. Accuracy was evaluated by calculating the percentage recovery of IMG and IKI in accordance with ICH guidelines. The results are presented in table 10, which summarizes the accuracy study findings for both compounds (drug and impurity).
Table 10: Accuracy study of IMG and IKI
| S. No. | % Level | Imeglimin hydrochloride (IMG) | Imeglimin ketone impurity (IKI) | ||||
| % Recovery | mean ±SD | %RSD | % Recovery | mean ±SD | %RSD | ||
| 1 | 80 | 100.82 | 100.71±0.1099 | 0.11 | 98.86 | 100.02±0.14298 | 0.14 |
| 100.72 | 100.11 | ||||||
| 100.60 | 100.10 | ||||||
| 2 | 100 | 100.14 | 100.02±0.1077 | 0.11 | 100.74 | 99.98±0.710618 | 0.71 |
| 99.97 | 99.86 | ||||||
| 99.95 | 99.34 | ||||||
| 3 | 120 | 100.65 | 100.68±0.0374 | 0.04 | 100.29 | 99.99±0.262263 | 0.26 |
| 100.68 | 99.92 | ||||||
| 100.72 | 99.78 | ||||||
n = 6, SD: Standard deviation, % RSD: Percent relative standard deviation
The developed approach was deliberately modified by introducing moderate changes in column oven temperature and wavelength. Tests conducted under these altered conditions confirmed the robustness of the developed method. The result of the robustness test is table 11.
Table 11: Outcomes of the robustness study
| Parameter | Retention time | Area | TP | Asymmetry | ||||
| IMG | IKI | IMG | IKI | IMG | IKI | IMG | IKI | |
| Wavelength (236 nm) | 3.91 | 4.86 | 20321451 | 550812 | 13652 | 10478 | 0.93 | 0.84 |
| Wavelength (240 nm) | 3.91 | 4.86 | 20014573 | 541243 | 13741 | 10264 | 0.94 | 0.85 |
| Temp(28 ᵒC) | 3.91 | 4.86 | 20127414 | 550031 | 13121 | 10556 | 0.93 | 0.84 |
| Temp(32 ᵒC) | 3.91 | 4.86 | 20135456 | 568527 | 13497 | 10356 | 0.93 | 0.84 |
IMG: Imeglimin hydrochloride, IKI: Imeglimin Ketone Impurity, TP: Theoretical plates.
The LOD and LOQ for IKI were calculated based on the calibration curve's standard deviation (σ) and slope (S). The LOD was found to be 0.23 ppm, using the formula:
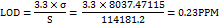
Similarly, the LOQ was determined to be 0.70 ppm, using the formula:
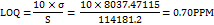
These values confirm the method's sensitivity for detecting and quantifying IKI at low concentrations.
Assay
The optimized chromatogram of IMG displayed a prominent peak at an RT of 3.93 min during the assay performed on tablet samples. The drug content assay returned a result of 99.33±0.60% (n = 3) for the labelled dose of IMG. These results highlight the high precision and specificity of the developed method, demonstrating its capability to reliably measure the drug content, even in the presence of excipients in the tablet formulation.
DISCUSSION
The present study introduces the first QbD-based RP-HPLC method for the simultaneous estimation of IMG and its structurally related IKI in pharmaceutical formulations. Unlike traditional single-variable optimization approaches, the use of CCD enables a systematic and efficient exploration of CMPs, such as FR and the proportion of mobile phase-A, to optimize method performance in alignment with modern regulatory expectations [34]. Most previously reported analytical methods for imeglimin have focused solely on the active pharmaceutical ingredient (API), employing techniques such as UV spectrophotometry [26], RP-HPLC [35], or LC-MS [36], with limited attention to impurity profiling and QbD-based optimization. In contrast, the present method integrates both IMG and IKI estimation into a single chromatographic run, offering a more efficient and comprehensive analytical strategy, especially relevant for routine quality control and regulatory compliance with ICH Q3A(R2) impurity guidelines [37].
The application of CCD [38] allowed for multi-variable optimization of critical quality attributes (CQAs), including retention time (RT), theoretical plates (TP), and resolution (Rs). The model gave a highly composite desirability value of 0.988, which indicating the potential of strategy to achieve optimal chromatographic performance across multiple criteria. This type of predictive model has not been reported in previous imeglimin studies, which highlights the novelty and scientific merit of the present approach. A modification of this method is the use of a milder MP,0.01% TFA in water: ACN (45:55, v/v), in comparison with the more concentrated 0.05% TFA used by Chikhale et al. (2024) for estimation of IMG alone [22]. The optimized mobile phase enabled sharp and well-resolved peaks, with an RT of approximately 3.93 min for IMG, which is comparable to that reported in the existing method [39] while ensuring adequate separation of IKI. The reduced TFA concentration enhances column longevity, improves environmental sustainability, and minimizes matrix interferences.
The method exhibited excellent linearity, with correlation coefficients (R²) of 0.9998 for IMG and 0.9994 for IKI, indicating accurate quantification across a broad concentration range. The method’s precision was confirmed by intra-and interday %RSD values below 2%, and accuracy was demonstrated through recovery studies at 80%, 100%, and 120%, yielding recoveries within 100.02–100.78% for IMG and 99.98–100.02% for IKI consistent with ICH Q2(R1) acceptance criteria. The calculated LOD and LOQ for IKI were 0.23 ppm and 0.70 ppm, respectively, confirming the sensitivity of the method. Robustness testing showed the method's resilience to intentional variations in wavelength and column oven temperature, further supporting its suitability for routine QC applications. Additionally, the method proved to be specific, with no interference observed from common excipients present in the formulation.
CONCLUSION
A robust, accurate, and precise QbD-based RP-HPLC method was successfully developed and optimised for the simultaneous estimation of IMG and IKI. CMPs were identified through risk assessment and optimised using DoE software, resulting in a method that demonstrated excellent linearity, accuracy, precision, and robustness within the studied range. The developed RP-HPLC method was successfully validated as per ICH Q2(R1) guidelines. Linearity was established over the concentration range of 80-120 ppm for IMG and 4–6 ppm for IKI, with R²of 0.9998 and 0.9994, respectively. Accuracy was demonstrated through recovery studies, with mean recoveries of 100.02–100.78% for IMG and 99.98–100.02% for the IKI, confirming the method reliability. The method showed good precision, with %RSD values well within acceptable limits (i. e., less than 2% as per ICH Q2(R1) guidelines). The LOD and LOQ were found to be 0.23 ppm and 0.70 ppm for the ketone impurity, indicating the method’s sensitivity. The method was also robust against small variations in analytical conditions. Therefore, this validated method is precise, accurate, and suitable for routine quality control of imeglimin and its related impurity in pharmaceutical formulations.
ACKNOWLEDGEMENT
The authors express their gratitude to the management of Dr. Vishwanath Karad MIT World Peace University, Kothrud, for support andfacilities.
FUNDING
There is currently no funding support for this research.
ETHICALAPPROVALS
In this current research, there is no anyone involment of any type of animals or humans.
AUTHORS CONTRIBUTIONS
The overall study concept and experimental design were conceived by A. R. C. and P. T. G., laying the foundation for the analytical strategy. S. A. C. provided high-purity reference standards for both the drug (IMG) and impurity (IKI), which were essential for method development and validation. The manuscript was drafted by P. G., A. R. C., and S. C. J. All authors contributed to data analysis, interpretation, and manuscript revision. A. R. C., S. C. J., and S. A. C. critically revised the manuscript for scientific accuracy and clarity.
CONFLICT OF INTERESTS
There are no conflicts of interest regarding the publication of this article, as declared by the authors.
REFERENCES
Shukla R, Chaudhari A, Patel P, Detholia K. QbD-based RP-HPLC method development for quantitative computation of phase III composition comprising apixaban and clopidogrel. J Appl Pharm Sci. 2024 Aug;14(8):85-93. doi: 10.7324/JAPS.2024.181311.
ICH. Pharmaceutical. Development; 2009. Available from: https://database.ich.org/sites/default/files/Q8_R2_Guideline.pdf. [Last accessed on 10 Jan 2025].
ICH. Quality. Risk Manag; 2023. Available from: https://database.ich.org/sites/default/files/ICH_Q9%28R1%29_Guideline_Step4_2022_1219.pdf. [Last accessed on 11 Jan 2025].
ICH. Pharmaceutical quality system. 2008:Q10. Available from: https://database.ich.org/sites/default/files/Q10%20Guideline.pdf. [Last accessed on 13 Jan 2025].
Orlandini S, Pinzauti S, Furlanetto S. Application of quality by design to the development of analytical separation methods. Anal Bioanal Chem. 2013;405(2-3):443-50. doi: 10.1007/s00216-012-6302-2, PMID 22941176.
Mehta B, Joshi H, Shah U, Patel P. Implementation of qbd principles for simultaneous quantitative expression of olmesartan medoxomil telmisartan and hydrochlorothiazide by RP-HPLC. J Pharm Res Int. 2021;33(41):50-61. doi: 10.9734/jpri/2021/v33i41A32301.
Perry RJ, Cardone RL, Petersen MC, Zhang D, Fouqueray P, Hallakou Bozec S. Imeglimin lowers glucose primarily by amplifying glucose-stimulated insulin secretion in high-fat-fed rodents. Am J Physiol Endocrinol Metab. 2016;311(2):E461-70. doi: 10.1152/ajpendo.00009.2016, PMID 27406738.
Hallakou Bozec S, Vial G, Kergoat M, Fouqueray P, Bolze S, Borel AL. Mechanism of action of imeglimin: a novel therapeutic agent for type 2 diabetes. Diabetes Obes Metab. 2021;23(3):664-73. doi: 10.1111/dom.14277, PMID 33269554.
Yaribeygi H, Maleki M, Sathyapalan T, Jamialahmadi T, Sahebkar A. Molecular mechanisms by which imeglimin improves glucose homeostasis. J Diabetes Res. 2020 Mar 6;2020:8768954. doi: 10.1155/2020/8768954, PMID 32215274.
Dubourg J, Ueki K, Grouin JM, Fouqueray P. Efficacy and safety of imeglimin in Japanese patients with type-2 diabetes: a 24 w randomized double blind placebo controlled dose ranging phase 2b trial. Diabetes Obes Metab. 2021;23(3):800-10. doi: 10.1111/dom.14285, PMID 33275318.
Perry RJ, Cardone RL, Petersen MC, Zhang D, Fouqueray P, Hallakou Bozec S. Imeglimin lowers glucose primarily by amplifying glucose stimulated insulin secretion in high-fat-fed rodents. Am J Physiol Endocrinol Metab. 2016;311(2):E461-70. doi: 10.1152/ajpendo.00009.2016, PMID 27406738.
Vuylsteke V, Chastain LM, Maggu GA, Brown C. Imeglimin: a potential new multi-target drug for type 2 diabetes. Drugs RD. 2015;15(3):227-32. doi: 10.1007/s40268-015-0099-3, PMID 26254210.
Vial G, Chauvin MA, Bendridi N, Durand A, Meugnier E, Madec AM. Imeglimin normalizes glucose tolerance and insulin sensitivity and improves mitochondrial function in liver of a high-fat high sucrose diet mice model. Diabetes. 2015;64(6):2254-64. doi: 10.2337/db14-1220, PMID 25552598.
Lablanche S, Tubbs E, Cottet Rousselle C, Lamarche F, Moisan A, Persoons V. Imeglimin protects INS-1 cells and human islets against high glucose and high fructose induced cell death by inhibiting the mitochondrial PTP opening. Diabetes. 2018;67 Suppl 1:81. doi: 10.2337/db18-81-OR.
Bernardi RM, D Avila FB, Todeschini V, Andrade JM, Froehlich PE, Bergold AM. Main degradation products of dabigatran etexilate evaluated by LC-UV and LC-ESI-MS, degradation kinetics and in vitro cytotoxicity studies. J Braz Chem Soc. 2015;26(4). doi: 10.5935/0103-5053.20150023.
Codevilla CF, Cortivo Lange AD, Maria De Mello Andrade J, Segalin J, Froehlich PE, Bergold AM. Photodegradation kinetics of lodenafil carbonate structure elucidation of two major degradation products using UPLC-MS/MS and in vitro cytotoxicity. Anal Methods. 2013;5(22):6511. doi: 10.1039/c3ay41273c.
Costa MC, Barden AT, Andrade JM, Oppe TP, Schapoval EE. Quantitative evaluation of besifloxacin ophthalmic suspension by HPLC application to bioassay method and cytotoxicity studies. Talanta. 2014 Feb;119:367-74. doi: 10.1016/j.talanta.2013.10.051, PMID 24401427.
Emerce E, Cok I, Degim IT. Determination of the impurities in drug products containing montelukast and in silico/in vitro genotoxicological assessments of sulfoxide impurity. Toxicol Lett. 2015;238(2):90-9. doi: 10.1016/j.toxlet.2015.07.003, PMID 26205398.
ICH. Impurities in new drug products. 2006;Q3B(R2). Available from: https://database.ich.org/sites/default/files/Q3B%28R2%29%20Guideline.pdf. [Last accessed on 12 Jun 2025].
Jahagirdar S, Godge R, Vikhe S, Bornare S. Estimation of imeglimin in pharmaceutical tablets by RP-HPLC. Int J Drug Deliv Technol. 2024;14(2):724-6. doi: 10.25258/ijddt.14.2.19.
Adhao VS, Chaudhari SP, Ambhore JP. Stability indicating RP-HPLC method development and validation for imeglimin hcl in pharmaceutical dosage form. Chem Sci Int J. 2024;33(4):1-10. doi: 10.9734/CSJI/2024/v33i4901.
Chikhale H, Ambekar Y, Avhad S, Borse L. Development and validation of RP-HPLC method for determination of antidiabetic drug (imeglimin HCL) in bulk and its dosage form. JCHR.2024;14(4):675-85.
Jain A, Soni LK, Sharma R. Development and validation of stability indicating RP-UHPLC method for the estimation of imeglimin hydrochloride used for the treatment of metabolic disorder diabetes mellitus. Int J Appl Pharm. 2023;15(6):211-7. doi: 10.22159/ijap.2023v15i6.49757.
Ramalingam S, Subramania MN, Basuvan B, Jaganathan R, Dhavamani AJ, Kandukuri NK. A sensitive direct chiral liquid chromatography tandem mass spectrometry method for the enantio selective analysis of imeglimin in formulation. J Appl Pharm Sci. 2023;13(7):214-19. doi: 10.7324/JAPS.2023.132349.
Ranjan PB, Prakash SR. Development and validation of imeglimin hydrochloride by UV/Visible spectrophotometric method. Int J Res Anal Rev. 2023;10(4):57.
Dange YD, Honmane SM, Bhinge SD, Salunkhe VR, Jadge DR. Development and validation of UV-spectrophotometric method for estimation of metformin in bulk and tablet dosage form. Indian J Pharm Educ Res. 2017;51(4s):s754-60. doi: 10.5530/ijper.51.4s.109.
Ficarra R, Calabro ML, Cutroneo P, Tommasini S, Melardi S, Semreen M. Validation of a LC method for the analysis of oxaliplatin in a pharmaceutical formulation using an experimental design. J Pharm Biomed Anal. 2002;29(6):1097-103. doi: 10.1016/S0731-7085(02)00151-6, PMID 12110395.
ICH. Validation of analytical procedures: text and methodology; 2005;Q2(R1). Available from: https://database.ich.org/sites/default/files/Q2%28R1%29%20Guideline.pdf. [Last accessed on 15 Feb 2025].
Hinge MA, Patel D. Optimization of HPLC method using central composite design for estimation of torsemide and eplerenone in tablet dosage form. Braz J Pharm Sci. 2022;58:e20219. doi: 10.1590/s2175-97902022e20219.
S Lakka N, Kuppan C. Principles of chromatography method development. In: Boldura OM, Balta C, Sayed Awwad N, editors. Biochemical analysis tools methods for bio-molecules studies. IntechOpen; 2020. doi: 10.5772/intechopen.89501.
Andrade C. The P value and statistical significance: misunderstandings explanations challenges and alternatives. Indian J Psychol Med. 2019;41(3):210-5. doi: 10.4103/IJPSYM.IJPSYM_193_19, PMID 31142921.
Kim TK. Understanding one way ANOVA using conceptual figures. Korean J Anesthesiol. 2017;70(1):22-6. doi: 10.4097/kjae.2017.70.1.22, PMID 28184262.
Hinge MA, Patel D. Optimization of HPLC method using central composite design for estimation of torsemide and eplerenone in tablet dosage form. Braz J Pharm Sci. 2022;58:e20219. doi: 10.1590/s2175-97902022e20219.
Beg S, Swain S, Rahman M, Hasnain MS, Imam SS. Application of design of experiments (DoE) in pharmaceutical product and process optimization. In: pharmaceutical quality by design. Amsterdam: Elsevier; 2019. p. 43-64. doi: 10.1016/B978-0-12-815799-2.00003-4.
Adhao VS, Chaudhari SP, Ambhore JP. Stability indicating RP-HPLC method development and validation for imeglimin HCL in pharmaceutical dosage form. Chem Sci Int J. 2024;33(4):1-10. doi: 10.9734/CSJI/2024/v33i4901.
Gogikar SK, Sen S, Pathinti S, Samanthula G, Dikundwar AG. Forced degradation study of an anti‐diabetic drug imeglimin: impurity profiling and structure elucidation using LC‐Q‐ToF‐MS/MS and NMR. Rapid Commun Mass Spectrom. 2025;39(5):e9960. doi: 10.1002/rcm.9960, PMID 39658818.
ICH. Impurities in new drug substances; 2006:Q3A(R2). Available from: https://database.ichorg/sites/default/files/Q3A%28R2%29%20Guideline.pdf. [Last accessed on 02 Mar 2025].
Ofrydopoulou A, Nannou C, Evgenidou E, Lambropoulou D. Sample preparation optimization by central composite design for multi class determination of 172 emerging contaminants in wastewaters and tap water using liquid chromatography high resolution mass spectrometry. J Chromatogr A. 2021 Aug 30;1652:462369. doi: 10.1016/j.chroma.2021.462369, PMID 34246959.
Mubeen G, Navali S, NL. RP-HPLC method for determination of imeglimin hydrochloride in bulk and tablet formulation. Asian J Pharm Res Dev. 2024;12(4):92-6. doi: 10.22270/ajprd.v12i4.1446.