
Int J App Pharm, Vol 17, Issue 5, 2025, 361-377Original Article
ANALYTICAL QBD INTEGRATED RP-HPLC METHOD DEVELOPMENT AND OPTIMIZATION FOR HIGH-PRECISION QUANTIFICATION OF IBRUTINIB IN HYBRID NANOCARRIER SYSTEMS
PRAGATHI DEVANAND BANGERA, MAHESHA KEERIKKADU, VAMSHI KRISHNA TIPPAVAJHALA, MAHALAXMI RATHNANAND*
1Department of Pharmaceutics, Manipal College of Pharmaceutical Sciences, Manipal Academy of Higher Education, Manipal-576104, Karnataka, India
*Corresponding author: Mahalaxmi Rathnanand; *Email:  mahalaxmi.r@manipal.edu
Received: 21 Apr 2025, Revised and Accepted: 11 Jun 2025
ABSTRACT
Objective: This study optimizes, develops, and validates the reversed-phase high-performance liquid chromatography (RP-HPLC) assay to measure Ibrutinib (IBR) in bulk and nanoformulations. It is a highly sensitive and specific method.
Methods: Chromatographic optimization was addressed using a methodical Design of Experiments (DoE) approach. Key method parameters (CMPs) were screened using the Taguchi Orthogonal Array (OA) design, and the outcomes were optimized using the Box-Behnken Design (BBD).
Results: The optimal settings were the Acetonitrile (ACN) (50% v/v) as the mobile phase, a 1.043 ml/min flow rate, and a column oven temperature of 26 °C. Under these conditions, the following results were obtained: theoretical plates of 13,5050±19.9, a peak area of 171500.66±324.94 mV-min, a Retention time (Rt) of 8.12±0.011 min, and a Tailing factor (Tf) of 1.21±0.001. The procedure showed good linearity with detection and quantification limits of 4.74 ng/ml and 15.8 ng/ml, respectively, for the concentration range of 50-5000 ng/ml (R2=0.9997). Validation verified that the approach met regulatory requirements for precision, specificity, sensitivity, accuracy, and robustness. Moreover, the method showed selectivity towards IBR even in degradation products.
Conclusion: The suggested RP-HPLC technique is good for regular pharmaceutical examination of IBR formulations. It has been effectively applied to identify and quantify IBR in hybrid nanocarriers and in in vitro drug release tests.
Keywords: Reversed-phase high-performance liquid chromatography, Ibrutinib, Design of experiments, Quality by design, Box-behnken design, Validation
© 2025 The Authors. Published by Innovare Academic Sciences Pvt Ltd. This is an open access article under the CC BY license (https://creativecommons.org/licenses/by/4.0/)
DOI: https://dx.doi.org/10.22159/ijap.2025v17i5.54683 Journal homepage: https://innovareacademics.in/journals/index.php/ijap
INTRODUCTION
Ibrutinib (IBR), a Bruton's tyrosine kinase (BTK) inhibitor, inhibitor which was approved by the FDA in year 2016, has garnered significant attention due to its efficacy in treating various B-cell malignancies, including Chronic Lymphocytic Leukemia (CLL) and Mantle Cell Lymphoma (MCL) [1]. Commercially, it is sold under Imbruvica, manufactured by Pharmacyclics LLC, an AbbVie company, and Janssen Biotech, Inc. It is available in two dosage forms that are tablets (140, 280, 420, and 560 mg) and capsules (140 mg). The prescribed dose of IBR for CLL by the FDA is 420 mg orally once daily until disease progression or unacceptable toxicity [2, 3]. Despite its clinical success, IBR exhibits limitations such as poor aqueous solubility and variable bioavailability, necessitating the development of advanced drug delivery systems, including hybrid nanoformulations. Hybrid nanoformulations, which integrate multiple carrier systems to enhance drug solubility, stability, and controlled release, have emerged as promising alternatives to conventional formulations [4]. However, the complex nature of these formulations poses challenges in their analytical characterization, thereby necessitating the development of a robust and validated Reverse-phase high-performance liquid chromatography (RP-HPLC) method for their accurate estimation [5].
The development of robust and reliable analytical methods is crucial for ensuring the quality, efficacy, and safety of pharmaceutical formulations. RP-HPLC remains a widely accepted and powerful analytical technique for quantifying and characterizing pharmaceutical compounds due to its high sensitivity, precision, and reproducibility [6]. The increasing complexity of drug formulations, particularly in the case of hybrid nanoformulations, demands a systematic and scientifically sound approach to method development and validation [7]. In this context, the Analytical Quality-by-Design (AQbD) paradigm offers a structured and risk-based approach to method development, ensuring optimal performance characteristics while enhancing method understanding and robustness [8, 9].
The literature has documented several RP-HPLC techniques for estimating IBR in pharmaceutical formulations and bulk [10–12]. These techniques have mostly concentrated on chromatographic settings, mobile phase compositions, and detection wavelengths to maximize drug separation and quantification [13]. To evaluate IBR in capsule dose, for example, Chatki et al. used the gradient elution method, which was optimized and validated in compliance with ICH recommendations [14]. Konduru et al. created the RP-HPLC method for IBR separation in a noteworthy study [15]. This was accomplished by employing a Luna C18 column as the stationary phase, which contained 10 mmol phosphate buffer with a pH of 5.6 acetonitrile. The ideal chromatographic parameters include a column temperature of 40 °C, an injection volume of 10 μL, and a flow rate of 1.0 ml/min. Every impurity was located, and the results for precision and robustness were deemed adequate [16]. The AQbD paradigm introduces a scientific, risk-based strategy that involves defining an Analytical Target Profile (ATP), identifying Critical Method Variables (CMVs), and optimizing these parameters using statistical tools such as Design of Experiments (DoE) [17]. By integrating AQbD principles into RP-HPLC method development, the present study aims to enhance method efficiency, reliability, and regulatory compliance [18]. The AQbD approach in analytical method development involves a systematic assessment of various analytical parameters, including the selection of an appropriate chromatographic column, mobile phase composition, flow rate, and detection wavelength, to achieve an optimal and reliable analytical method [19, 20]. By implementing AQbD principles, the method is developed within a design space that ensures robustness against minor variations in experimental conditions. The application of AQbD in RP-HPLC method development for IBR quantification in hybrid nanoformulations not only enhances the reliability of the method but also aligns with regulatory expectations for robust and scientifically justified analytical procedures [21].
This study aims to develop and validate a robust RP-HPLC method for the estimation of IBR in hybrid nano formulations using the AQbD approach. The method development is guided by systematic risk assessment and statistical modelling to achieve an optimized analytical procedure. Additionally, forced degradation studies are conducted to evaluate the stability of IBR and its degradation kinetics, while mathematical modelling of in vitro release studies provides insights into the release behaviour of the drug from the nanoformulations. The integration of AQbD principles, stability studies, and mathematical modelling in this research ensures a comprehensive analytical approach that meets regulatory requirements and contributes to the advancement of nanoformulation-based drug delivery systems.
MATERIALS AND METHODS
Chemicals and reagents
IBR (Form A) was gifted by Hetero Labs Pvt. Ltd. Acetonitrile (ACN), Ortho-Phosphoric Acid (OPA) (88 %), methanol of HPLC grade (purity, min 99.8 %), Sodium dihydrogen phosphate, and di-Sodium hydrogen phosphate were obtained from Merck specialties Pvt Ltd., Mumbai, India. A cellulose membrane filter (0.22 µm) was procured from HiMedia® Laboratories Pvt. Ltd., Mumbai, India, sodium hydroxide pellets (NaOH) (purity ≥98 %), pure AR. Hydrogen peroxide (H2O2) 6 % and Triethylamine (TEA) (purity ≥99 %) were obtained from Loba Chemie Pvt. Ltd. (Mumbai, India). Hydrochloric acid (HCl)-35 % was procured from Finar Ltd., Ahmedabad, India. Poly (Lactic-co-Glycolic) Acid (PLGA) was obtained from Yarrow chemicals, while soya lecithin was acquired from HiMedia® Laboratories Pvt. Ltd., Mumbai, India, for the preparation of polymer-lipid hybrid nanoparticles. The samples and mobile phase were prepared using de-ionized ultrapure water prepared by the Millipore Direct-Q®3 water purification system (Millipore Corporation, MA, USA). All other chemicals and solvents used were of analytical or HPLC grade.
Instrumentation
The Shimadzu LC-2010C HT HPLC system (Shimadzu, Japan) was used for the chromatographic analyses. It has a quaternary pump, autosampler, column oven, degasser, sample chiller, and UV detector. Using LabSolutions software (version 5.57), monitoring, data collection, and peak integration were carried out. Design experiments, response modeling, and desirability estimates were also performed using Design Expert® software (version 13.0; Stat-Ease Inc., Minneapolis, MN, USA).
Chromatographic condition
The isocratic elution analysis of ibrutinib was run on a Phenomenex Hyper Clone 5-µm ODS (C18) 120 Å, 250 × 4.6 mm column as the stationary phase. The mobile phase consisted of a 50:50 (v/v) composition of 10 mmol sodium phosphate buffer (pH adjusted to 6.8±0.05) containing 0.1%v/v Triethylamine (TEA) and ACN. The aqueous mobile phase was filtered through a 0.22 µm cellulose membrane filter and degassed using ultrasonication before use. The autosampler had its temperature set to 4 °C, while that of the column oven was 25 °C. The analysis is carried out within a total run time of about 10 min. IBR detection was accomplished with a UV detector operating at a wavelength of 260 nm, an injection volume of 10 µl**, and a flow rate of 1.043 ml/min.
Calibration standards and stock solution preparation
Preparing the primary stock solution involved dissolving a precisely determined quantity of IBR in Milli-Q water to achieve a 1000 µg/ml concentration. This stock solution was then appropriately diluted to create a working standard solution with a 10 µg/ml concentration. Milli-Q water was used to dilute the solution further to create additional dilutions for calibration and quality control samples. Three QC sample levels were made: Medium (MQC), Low (LQC), and High (HQC) concentrations, which were set at 4000, 3000, and 150 ng/ml, respectively. They created the calibration standards between 50 and 5000 ng/ml.
Development of methods through the application of AQbD
The AQbD technique was used to assess how independent variables affected dependent responses [22, 23]. This is carried out to maximize the data experiments that have been evaluated while considering the connections between other elements that influence the dependent variables.
Critical analytical attributes (CAAs) and quality target method profile (QTMP)
QTMP is a basic part of AQbD that defines intended use, performance characteristics, and acceptance criteria for an analytical method. It is a strategic blueprint for method development by laying down the objective of the method and ensuring alignment with product quality needs. QTMP allows systematic risk evaluation and identification of Critical Method Attributes (CMAs) and Critical Method Parameters (CMPs). Through setting pre-defined quality objectives, it facilitates the development of rugged, reliable, and compliant analytical procedures. QTMP ensures that analytical procedures always provide correct and precise results over their lifecycle. The first stage in applying the AQbD process is to define the QTMP, which specifies the required analytical profile with defined characteristic parameters so that the method can be reliable, fast, and suitable to quantify ibrutinib. Once the QTMP is defined, the CMP, which has a major effect on determining the CAA, may be identified to improve the method's performance [24]. The CAA is a quantifiable chromatographic characteristic that must fall within an acceptable threshold or range to ensure that the method's performance is appropriate. In this work, the important CAAs such as peak area, retention time (Rt), tailing factor at 5% (Tf 5%), tailing factor at 10% (Tf 10%), and the NTP were chosen because they are very important in judging the accuracy and robustness of the proposed RP-HPLC method [25].
Factor screening and risk analysis
The systemic approach to quality risk management was used in the risk assessment. At this point, risks are recognized at the outset of the development process, and a suitable mitigation plan is implemented as a precaution [26, 27]. An Ishikawa fishbone diagram was established based on the early trials and previous research. The L8 Taguchi orthogonal array design of 7 factors with 8 runs was used to screen the factors. The primary technique factors influencing the CAAs, including peak area, tailing factor (Tf), and Retention time (Rt), were screened using this approach (table s2, supplemental material). The Design Expert® software version 13.0 was used to conduct the statistical study [28].
Factors optimization
The Taguchi design was used to screen independent variables, and those that impacted the response were classified as CMPs. Additional parameters were optimized, including ACN concentrations, flow rate, and oven temperature, using the response surface method, also known as Box-Behnken Design (BBD) [29]. Peak area, retention duration, NTP, and Tf were among the response factors that were recorded and assessed to produce the optimal solution. The three-level BBD design suggested 17 runs with every potential combination of the chosen independent variables.
Optimized method validation
Selectivity and specificity
Specificity and selectivity are two components that are very important to identify the capability with which a given chromatographic condition can define an analyzed sample with a similarly different composition of the matrix, impurities, and degradation products therein. To ensure the specificity of the performed method for IBR, forced degradation and matrix interference studies were completed [30].
Interferences of the matrix
To establish the specificity of the analytical method, an IBR sample at the lowest concentration (50 ng/ml) and a blank sample were injected. The retention time (RT) and peak area of the analyte were recorded for each sample. The interference at the analyte's retention time in the blank sample was then computed. The entirety of the IBR matrix was also analysed to evaluate the impact of the nanoformulation excipients, with the purity of the peak verified to ensure that no co-eluting impurities were present [31].
Forced degradation study
In accordance with ICH Q1A (R2) recommendations, a forced degradation study of IBR was carried out to assess the specificity of stability-indicating capacity and an optimized analytical method. IBR was exposed to a range of stress conditions, including neutral (pH 7.0), basic (NaOH in the normality (N) 0.1N, and 1.0 N), and acidic (HCl, 0.1N, and 1.0 N) hydrolysis. Additional stress conditions included oxidative degradation (H2O2), photodegradation (light exposure), and thermal degradation [32, 33]. Standard samples were prepared at 100 μg/ml and exposed to these stress factors. At 0, 4, and 8 h, samples were withdrawn, neutralized as required, and diluted to a final concentration of 10 μg/ml [34].
Study of hydrolytic degradation in acid, base, and neutral
Acid degradation studies were conducted using 1.0 N and 0.1 N HCl. Base degradation studies were performed using 1.0 N and 0.1 N NaOH, while neutral degradation studies were carried out at pH 7.0. All studies were conducted at three different temperatures: 4 ℃, room temperature (RT), and 60 ℃. Samples for the study were prepared by mixing 500 µl** of standard solution (100 µg/ml) with 500 µl** of the stressor. Aliquots of 10 µl** were collected at intervals (0, 4, and 8 h), neutralized, and diluted for HPLC analysis [35].
Oxidative degradation
Oxidative degradation studies using 3.0% H2O2 ensure an adequate evaluation of IBR’s oxidative stability. The samples are exposed to 3 different temperatures: 4 °C, room temperature (RT), and 60 °C. This is crucial since oxidative degradation often produces harmful degradation products [36].
Photo degradation
For photo degradation studies, the samples were exposed to natural sunlight. The samples were withdrawn at 0, 4, and 8 h, which were then diluted with the diluent and analyzed using HPLC [37].
Thermal degradation
A thermal degradation analysis of an aqueous IBR standard solution was carried out by refluxing at 4 °C, room temperature, and 60 °C. After refluxing, the samples were diluted accordingly and analysed using the HPLC system [38].
System suitability
Six consecutive injections of IBR at a concentration of 5000 ng/ml were added to the HPLC system to conduct a system suitability test. The analyte's peak area and tailing factor were measured for the six samples. After calculating the average data, the system performance was evaluated by calculating the % RSD.
Linearity
To create the calibration curve, we examined nine different concentrations, spanning from 50 to 5000 ng/ml, and conducted triplicate analyses for each concentration [11]. The peak area was recorded for each of these concentrations. Then, we established the calibration curve by graphing the concentration on the horizontal (x) axis and the average peak area on the vertical (y) axis. We computed the linear regression from this curve, including the slope, intercept, and coefficient of determination (R2).
LOD and LOQ
The response's standard deviation and the slope of the calibration curve were used to get the LOD and LOQ values [39,40]using Equations 1 and 2.
Where ‘SD’ is the y-intercept's standard deviation, and "m" is the calibration curve's slope.
Precision
The RP-HPLC method developed was subjected to precision studies, both within the same day (intra-day) and across different days (inter-day), using three distinct concentrations: low, medium, and high (150, 2500, 4000 μg/ml). In the case of intra-day precision, six replicates of each concentration level (low, medium, and high) were analyzed during the morning and evening of the same day (day 1). Six replicates of each concentration level were analyzed on the morning of day 1 and the morning of day 2 to assess inter-day precision. The peak area for all samples was meticulously recorded, and the percentage relative standard deviation (%RSD) of the peak area was calculated for each concentration level [10].
Accuracy
The accuracy assessment utilized a drug recovery method [41]. This involved conducting an accuracy experiment across three concentration levels, specifically 75%, 100%, and 125%. To create the test samples, we combined 300, 2500, and 4000 ng/ml of IBR with equal volumes of a 2500 ng/ml sample, resulting in final concentrations of 1875, 2500, and 3125 ng/ml, corresponding to the 75%, 100%, and 125% concentration levels, respectively. Additionally, we directly prepared three reference samples (Purity-99.7%) with 1875, 2500, and 3125 μg/ml concentrations from the primary stock solution, which had a concentration of 1000 μg/ml. These reference samples were analysed alongside the test samples, and the peak area for each sample were recorded to calculate percentage recovery from Equation 3.

Robustness
The finely tuned parameters of the created RP-HPLC method underwent deliberate adjustments to assess the method's resilience. Minor modifications were introduced to key method parameters, including the flow rate, buffer pH, injection volume, ratio of aqueous to organic phase, column oven temperature, and UV detector wavelength [41]. For each of these parameters, a sample with a concentration of 3000 ng/ml was analyzed in triplicate. We recorded the tailing factor and peak area, calculating the percentage relative standard deviation (%RSD).
Method applicability
Formulation of IBR-loaded polymer lipid hybrid nanoparticles (IBR-PLHNs)
In the conventional nanoprecipitation method, the polymer and the incorporated agent, IBR, were first dissolved in a water-miscible organic solvent, ACN. Soya lecithin was meanwhile dispersed in an aqueous ethanolic solution and heated from 65 to 70 °C for efficient mixing and homogenous dispersing [41]. The next step was the dropwise addition of the polymer solution into aqueous lipid dispersion under continuous stirring at 550 rpm, leading to the polymer precipitation as nanoparticles. Because of their hydrophobic interactions, the lipids self-assemble around the polymeric nanoparticles. Lipids' hydrophilic heads spread into the aqueous environment while their hydrophobic tails cling to the polymer core. IBR-loaded polymer-lipid hybrid nanoparticles (PLHNs) stabilized with soy lecithin were the end product of this procedure [4, 42].
Determination of total drug content in IBR-PLHNs
Drug content of the IBR-PLHNs was assessed by an indirect method, where the formulation was subjected to centrifugation at 15,000 rpm, 4 ℃ for 20 min. The supernatant was then separated, diluted, and analysed using a validated HPLC method [43, 44].
In vitro drug release studies of IBR-PLHNs
The drug release studies were carried out through a dialysis membrane immersed in 200 ml of dissolution media containing 0.1N HCl and pH 6.8 phosphate buffer. The experiment was performed in the shaking incubator, Biobee Tech, apparatus set at 50 rpm while maintaining a temperature of 37±0.5 °C. 2 ml of the PLHN formulation and the standard IBR were taken and sealed inside a dialysis bag, clipping both ends of the bag. This dialysis bag was immersed in 0.1N HCl for two hours and in pH 6.8 phosphate buffer for 48 h of the study. Tween 80, 0.5%, was added to the dissolution media to maintain sink conditions [42, 45, 46]. With the times indicated, two millilitres of the samples were taken and each time, replaced with an equal volume of fresh buffer. The drug release percentage was calculated using the IBR calibration curve (CC) equation. All the experiments were carried out in triplicate to ensure the accuracy and reproducibility of data.
RESULTS AND DISCUSSION
AQbD-assisted HPLC technique development and optimization
Preliminary method development
To produce a well-shaped peak with a lower retention time (Rt), a smaller tailing factor (Tf), a higher theoretical plate (NTP), and better resolution, the RP-HPLC analytical method was created by adjusting several parameters. The stationary phase for the separation of IBR was determined to be a reversed-phase Phenomenex® HyperClone C18 column after a thorough literature review and initial testing carried out during the method development stage. IBR has polar functional groups like amides, ethers, and nitrogen heterocycles responsible for the overall polarity of the compound by hydrogen bonding and dipole interactions. All these polar aspects affect its retention and separation in RP-HPLC. The polarity is of utmost importance for dictating its interaction with the stationary as well as the mobile phase. Hence, optimization of mobile phase composition, gradient, and buffer conditions must be taken very carefully to obtain sharp peaks, effective separation, and reliable chromatographic performance.
Selecting an appropriate mobile phase for the separation of IBR using reverse-phase HPLC (RP-HPLC) involves careful consideration of its chemical properties, polarity, and solubility characteristics. The goal is to achieve optimal retention time, peak symmetry, and resolution. The mobile phase should give the ability to ionize or unionize the drug completely. The organic solvent usually selected are acetonitrile (ACN) and methanol. The use of methanol obtains wider peaks. Acetonitrile was preferred due to its lower viscosity and ability to produce sharper peaks with shorter run times. The mobile phase selected for a particular drug should have a pH aligned with pka of the drug (±2). The buffers, which stabilize the molecule's polar functional groups, particularly the amide and heteroaromatic rings, by preventing ionization and can minimize the tailing with good peak shape, were screened from the range of 6.0 to 7.0 pH. Therefore, the screening was done with the initial trial of 50:50 ratio of ACN and phosphate buffer, ranging from pH 6.0 to 7.0. The increase in the pH of the phosphate buffer to 7 caused broadening of the peak. Therefore, further analysis was done with pH 6.0 to 6.5 phosphate buffer, which resulted in the peaks with Rt 4.0. Finally, the use of a 50:50 ratio of acetonitrile and pH 6.7 phosphate buffer provided a well-balanced mobile phase for IBR analysis. This composition optimizes retention time (8.12±0.011), peak area (171500.66±324.94), NTP (13505±19.9) and tailing factor (1.21) while the other composition had Rt lesser than 4.0. The strength of the buffer used also affects the elution and column conditions. 20 mmol and 10 mmol strength of the buffer was screened. The parameters like Rt, peak and NTP did not make much difference. But tailing factor was reduced with the usage of 10 mmol strength buffer. Therefore, along with 10 mmol 6.7 pH buffer we have added 0.1 %v/v triethylamine (TEA), which helps in decreasing the tailing.
Study of risk assessment
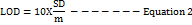
To identify the relationship between CMPs and CAAs that would have caused an impact on the methodology, the Ishikawa fishbone diagram (fig. 1) was constructed according to the literature [20, 41]. The parameters selected for the subsequent Taguchi screening design include flow rate, buffer strength, pH, oven temperature, ACN concentration, injection volume, and wavelength.
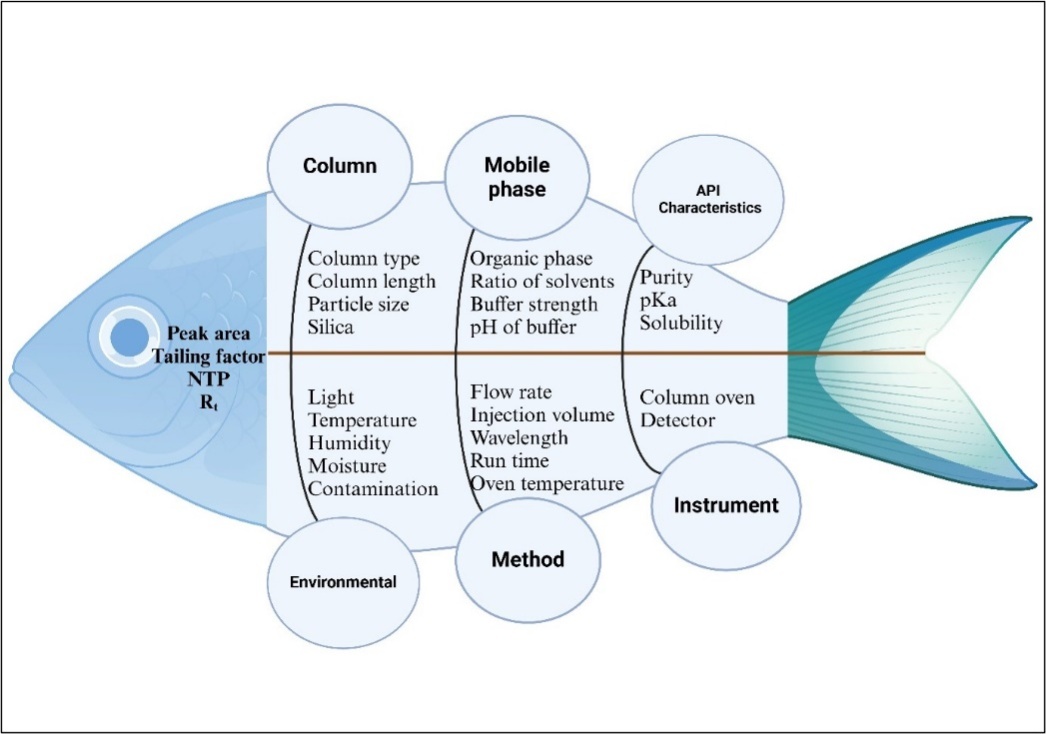
Fig. 1: Ishikawa diagram for risk assessment studies
Factor screening using taguchi orthogonal array design
The CMPs identified through determining risk were addressed using the Taguchi Orthogonal Array (OA) design (table 1) [47]. Such work provided the identification of CAAs with great influence on critical chromatographic responses such as peak area, retention time (Rt), number of theoretical plates (NTP), and tailing factor (Tf). The selection of CAAs was accomplished with reference to the Pareto chart analysis depicted in fig. 2 by focusing on parameters that showed a powerful statistically important (p<0.005) effect and were fit for further use in optimization studies (table 2). In that respect, ACN conc., flow rate, and column oven temperature showed significant antagonistic effects on Rt. The negative influence of this factor on Rt, peak area, and NTP was very important, above the Bonferroni limit, as observed in the Pareto charts. Additionally, the ACN conc. act negatively on NTP, while a lower buffer pH and flow rate were positively synergistic to NTP. The Tf identified that ACN concentration induced positive effects, while encapsulation pH, flow rate, and oven temperature were negative influences. The column type was left out of the design since it had been fixed following initial experiments that determined the most appropriate column for the analyte to ensure compatibility and stability. The oven temperature variations were evaluated using the Taguchi OA screening, which selected two extreme temperature conditions for this examination: 22 °C and 25 °C. The analysis concluded that high-temperature conditions tended to reduce retention time and Tf, which were beneficial for chromatographic separation. The BBD was performed to better support the results by taking a wider range for temperature optimization. The lower bound was 24 °C, the upper 26 °C, with the centre point at 25 °C. The optimization software suggested setting the temperature to 25 °C when running the chromatographic procedure was the most desirable solution.
Fig. 2: The following factors are shown in a Pareto chart: (a) retention period, (b) peak area, (c) number of theoretical plates, and (d) tailing factor
Table 1: Taguchi OA screening design
| Standard | Flow rate (ml/min) | Injection volume (µl) | Wavelength (nm) | Oven temperature (˚C) | Concentration of ACN (%) | Buffer strength | Buffer pH |
| 1 | -1 | -1 | -1 | -1 | -1 | -1 | -1 |
| 2 | -1 | -1 | -1 | +1 | +1 | +1 | +1 |
| 3 | -1 | +1 | +1 | -1 | -1 | +1 | +1 |
| 4 | -1 | +1 | +1 | +1 | +1 | -1 | -1 |
| 5 | +1 | -1 | +1 | -1 | +1 | -1 | +1 |
| 6 | +1 | -1 | +1 | +1 | -1 | +1 | -1 |
| 7 | +1 | +1 | -1 | -1 | +1 | +1 | -1 |
| 8 | +1 | +1 | -1 | +1 | -1 | -1 | +1 |
| Factors | Factor levels | ||||||
| Low (-1) | High (+1) | ||||||
| Flow rate (mL/min) | 1.0 | 1.4 | |||||
| Injection volume (µl) | 5 | 15 | |||||
| Wavelength (nm) | 258 | 264 | |||||
| Oven temperature (˚C) | 22 | 25 | |||||
| Concentration of ACN (%) | 40 | 60 | |||||
| Buffer strength | 10 | 15 | |||||
| Buffer pH | 6.3 | 7.3 |
Table 2: p-values of independent variables obtained from taguchi OA design
| Variables | Retention time | Peak area | NTP | Tailing factor |
| Flow rate | <0.0001 | 0.0665 | 0.0024 | 0.0311 |
| Injection volume | 0.0027 | 0.1765 | 0.0397 | - |
| Wavelength | 0.0031 | 0.1147 | - | 0.2763 |
| Oven temperature | 0.0004 | - | 0.0091 | 0.0417 |
| Concentration of ACN | <0.0001 | - | 0.0118 | 0.0002 |
| Buffer strength | - | 0.2691 | 0.0223 | - |
| Buffer pH | 0.0012 | - | 0.0230 | - |
Method optimization and response surface analysis
BBD was applied for method optimization due to its efficacy and feasibility. Unlike Central Composite Design (CCD), in which several experimental runs are required, BBD embodies a more economical route, per se. The Response Surface Methodology (RSM) was successful in modelling and optimizing important independent variables impacting HPLC performance, such as gradient steepness and column temperature and showed strong statistical reliability (Adjusted R²>0.9). Central composite design (CCD) and Box–Behnken design (BBD) were used to systematically explore experimental spaces and reduced trial numbers, allowing for the identification of interactions and quadratic effects between independent factors; the method produced tolerance and variation transmission analysis results that verified robustness (getting a quality of six sigma) with very little error between predicted versus experimental value. Both studies supported prediction models that had excellent agreement between predicted responses and observed responses along with support for RSM as a powerful tool for optimizing chromatographic conditions and improving extraction efficiency [48, 49]. The advantage is that BBD does not have experimental points at the extreme edges of the factor space, which are normally imposed in CCD. It is highly challenging to perform such extreme points experimentally, and at times, physical constraints could arise, leading to an inability to achieve a certain factor combination. The formula N=2𝑘(𝑘−1)+𝐶0, where 𝑘 is the number of independent variables, and 𝐶0 is the number of centre points, is used to calculate the total number of experimental runs in BBD. In this investigation, 17 experimental runs were carried out, and three factors were examined under five centre points (table 3). Five centre points were strategically placed because they increase predictive accuracy at the centre of the design area, which is essential for accurate response modelling. Robust statistical analysis is also made possible by this setup. Additionally, the centre points guarantee rotatability, which means that changes in the anticipated reaction are maintained at equal separations from the design space's centre. This feature helps to guarantee a precise design for increased accuracy and reproducibility of the optimized HPLC process. The three independent variables chosen for optimization under the BBD are flow rate (A), oven temperature (B), and acetonitrile concentration (C), in accordance with the results of the risk assessment studies. There are three levels of variation for each variable: low (-1), medium (0), and high (+1). Design Expert software was used to create the experimental design, which suggested 17 experimental trials. Retention time (Rt, R1), peak area (R2), the number of theoretical plates (NTP, R3), and tailing factor (Tf, R4) were the four strategic response factors that were thoroughly tested during these trials.
Table 3: Optimization of RP-HPLC method for IBR nanocarriers using box-behnken design
| Run | Factor | Response | |||||
| Flow rate (ml/min) | Oven temperature (˚C) | Concentration of ACN (%) | Retention time | Peak area | NTP | Tailing factor | |
| 1 | 1.2 | 24 | 55 | 5.384±0.004 | 234603.667±281.86 | 10757.667±17 | 1.230±0.0005 |
| 2 | 1 | 26 | 55 | 6.437±0.003 | 279691.333±453.6 | 12284.333±75 | 1.228±0.003 |
| 3 | 1.2 | 24 | 55 | 5.372±0.004 | 233182.333±151.8 | 10766.667±19.5 | 1.228±0.001 |
| 4 | 1.2 | 24 | 55 | 5.374±0.005 | 233553.667±311.4 | 10656.333±48.7 | 1.231±0.002 |
| 5 | 1.2 | 22 | 50 | 7.239±0.01 | 232490.333±969.8 | 11807.667±43.5 | 1.231±0.001 |
| 6 | 1.2 | 24 | 55 | 5.382±0.002 | 234181.333±59.07 | 10656.333±8.08 | 1.233±0.001 |
| 7 | 1 | 22 | 55 | 6.450±0.005 | 278908.333±381.06 | 11692.000±15.71 | 1.244±0.002 |
| 8 | 1.4 | 22 | 55 | 4.664±0.002 | 202522.000±261.5 | 9360.333±54.53 | 1.233±0.001 |
| 9 | 1.2 | 24 | 55 | 5.384±0.001 | 234367.667±644.6 | 10640.667±23.1 | 1.233±0.001 |
| 10 | 1.2 | 22 | 60 | 4.397±0.002 | 234458.333±207.49 | 9333.333±7.37 | 1.254±0.001 |
| 11 | 1 | 24 | 50 | 8.636±0.01 | 277158.667±287.5 | 13579.333±62.3 | 1.224±0.001 |
| 12 | 1.4 | 26 | 55 | 4.617±0.006 | 201875.333±337.5 | 9789.667±15.15 | 1.214±0.002 |
| 13 | 1.2 | 26 | 60 | 4.360±0.003 | 233977 ±351.09 | 9709.333±63.53 | 1.235±0.001 |
| 14 | 1.4 | 24 | 60 | 3.770±0.003 | 202301.000±162.07 | 8478.333±4.72 | 1.234±0.005 |
| 15 | 1 | 24 | 60 | 5.235±0.002 | 279836.333±150.69 | 10782±21.63 | 1.250±0.005 |
| 16 | 1.2 | 26 | 50 | 7.201±0.004 | 233462±421.1 | 12496.333±31 | 1.209±0.001 |
| 17 | 1.4 | 24 | 50 | 6.328±0.008 | 208370.667±206.2 | 11269.333±10.96 | 1.208±0.002 |
Each value is represented as mean±SD; n = 3, NTP=Number of theoretical plates
Independent variable effects on the responses
Independent variable's effect on the retention time
The quadratic model showed a statistically significant effect (p<0.0001) on retention time with an R² value of 0.9995, adjusted R² value of 0.9988, and predicted R² value of 0.9917. All three interacting factors affected retention time significantly (p<0.05) (table S1 and fig. S1). A perturbation graph depicted in fig. 3a shows that flow rate and retention time are strongly negatively correlated. A green curve effectively illustrates that increasing the flow rate results in a corresponding sharp decline in retention time. Increasing the flow rate enhances elution more quickly, thereby reducing Rt mainly. The blue curve (B-oven temperature), remains nearly horizontal, implying a negligible impact of oven temperature changes on Rt. This suggests that within the studied range, temperature variations do not significantly affect retention time. The gray curve (C-acetonitrile concentration) shows a moderate negative slope, indicating that increasing acetonitrile concentration slightly decreases Rt. This is likely due to enhanced elution strength when the organic modifier concentration is increased. In the fig. 3b contour lines run almost parallel to the oven temperature axis, indicating that changes in flow rate have a more pronounced effect on Rt than oven temperature. The evenly spaced contour lines along the temperature axis confirm the minimal impact of temperature variations within the tested range. In the 3D surface plot (fig. 3c), the surface descends sharply as flow rate increases, corroborating the perturbation plot's observation that higher flow rates reduce Rt. The near-flat surface along the temperature dimension supports the observation that temperature changes have minimal influence on Rt. Among the tested variables, flow rate significantly affects retention time, making it a critical factor for chromatographic optimization. Temperature variations have minimal impact on Rt, offering greater flexibility in experimental conditions. Higher concentrations of acetonitrile marginally decrease Rt, supporting its role as an effective eluent.
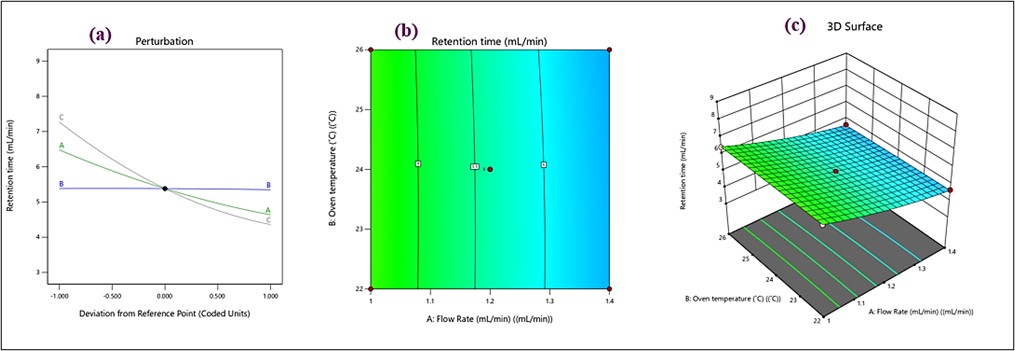
Fig. 3: (a) perturbation plots, (b) contour, and (c) 3D response surface plots for retention time
Impact of individual variables on peak area
The peak area quadratic model had an R2 value of 0.9988, an adjusted R2 of 0.9973, and a forecasted R2 of 0.9831, all of which were significant (p<0.0001). Each of the three parameters significantly impacted the peak area (p<0.05) (table S2 and fig. S2). Variable a (flow rate) exhibited a strong nonlinear relationship with the peak area. Changes in flow rate significantly affect the response. Whereas the variable B, the oven temperature appears to have minimal impact on the peak area, as its curve is almost flat. When it comes to variable C, ACN concentration a negligible influence on the response, with little to no variation in the peak area. We can conclude by stating flow rate (A) is the most critical factor influencing peak area depicted in perturbation plot in fig. 4a. In the contour plot (fig. 4b), the gradient in colour from blue to red indicates regions of lower to higher peak area. Flow rate (A) significantly impacts the response, as seen in the steep gradient along the x-axis. Oven temperature (B) has a minor effect, with almost vertical contour lines indicating little variation in the response. Therefore, the peak area increases more significantly with changes in flow rate than with oven temperature. Similarly, in 3D surface plot shown in fig. 4c, the surface slopes steeply along the flow rate (A) axis, indicating its dominant influence on the response. The oven temperature (B) axis contributes minimally to the variation in peak area, as the surface remains relatively flat along this direction. The highest peak area is achieved at higher flow rates, as represented by the red region. The 3D plot confirms that the flow rate plays a more critical role than oven temperature in determining the peak area. Based on all the three graphs, the is the most influential factor affecting the peak area is the flow rate. Oven temperature (B) and acetonitrile concentration (C) have limited or negligible impacts. Adjusting the flow rate within the studied range can optimize the peak area for better analytical performance.
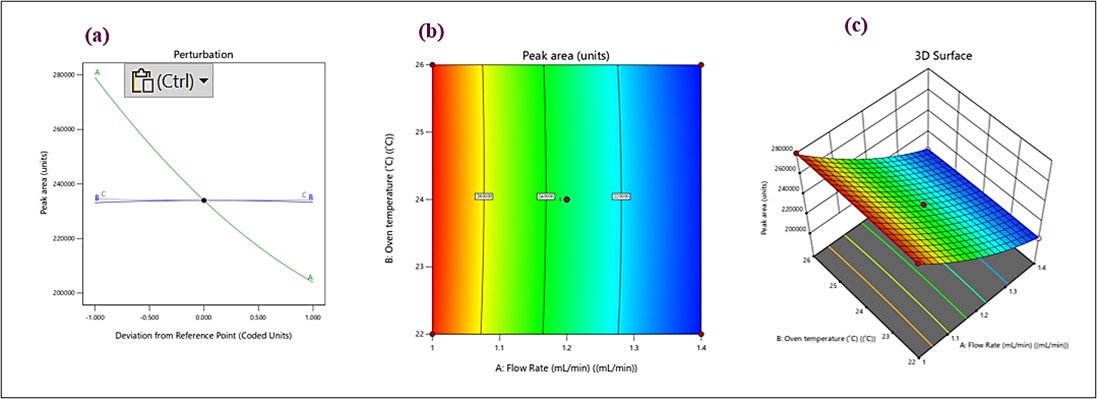
Fig. 4: (a) perturbation plot, (b) contour, and (c) 3D Response surface plots for peak area
NTP and the impact of independent variables
The fitting of square terms to statistically significant predictors of NTP was done with an ANOVA p-value<0.0001. That means the linear model fits poorly; however, the R² was 0.9987, adjusted R² was 0.9971, and predicted R² was 0.9876. Besides this, the three factors were significant with respect to influencing NTP, as their p-values were lower than 0.05 (table S3 and fig. S3). In the perturbation plot (fig. 5a), the green line A indicates a significant effect of flow rate on NTP. The steep slope suggests a strong sensitivity, with NTP decreasing as the flow rate increases. The blue line B represents the effect of oven temperature on NTP. The curve is flatter, implying a weaker influence compared to flow rate. The grey line shows the impact of acetonitrile concentration, which shows that the line is relatively parallel to the x-axis, indicating a minimal or negligible effect on NTP within the investigated range. The contour lines in the plot represent levels of NTP. Closer and more curved lines indicate stronger interactions between the two factors. The gradient from yellow to blue illustrates a decrease in NTP as the flow rate increases, with temperature having a secondary impact. Optimal NTP (lighter areas, close to red points) occurs at lower flow rates and moderate oven temperatures (fig. 5b). The 3D surface shows (fig. 5c) a clear slope, indicating that a combination of low flow rate and moderate oven temperature results in higher NTP. The peak (higher NTP values) aligns with the optimal conditions observed in the contour plot. The 3D plot confirms the dominant effect of flow rate compared to oven temperature. Overall, the observations were as follows: The flow rate (A) has the most significant impact on the NTP, as seen in the steep slope in the perturbation plot and the gradients in the contour and 3D plots. Oven temperature (B) has a moderate effect, influencing NTP at higher flow rates but less so at lower rates. Acetonitrile concentration (C) appears to have minimal impact on NTP within the tested range. For optimal NTP, the experimental conditions should prioritize a lower flow rate and moderate oven temperature.
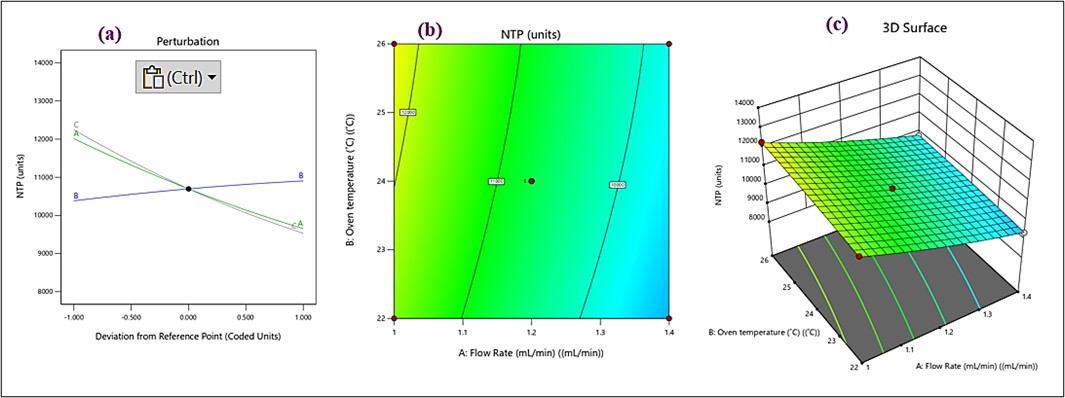
Fig. 5: (a) perturbation plot), (b) contour, and (c) 3D Response surface plots for NTP
Effect of independent variables on tailing factor
The quadratic model for Tf was found to have a significant effect (p<0.0001), with predicted R2=0.8987, adjusted R2=0.9665, and R2=0.9854. Tf was strongly impacted by all three parameters (p<0.05) (table S4 and fig. S4). In contrast to flow rate (A) and ACN concentration (C), oven temperature (B) shows the steepest slope in the perturbation plot fig. 6a, suggesting that it has the greatest effect on Tf. A has a moderate impact, while C has a minimal effect, as seen by the relatively flat line. This 2D contour plot (fig. 6b) illustrates the combined effect of two independent variables (A and B) on Tf, with C held constant. The gradient of the colours (blue to red) represents the range of Tf, with blue indicating lower Tf values and red indicating higher values. Lower Tf values are observed at higher flow rates (A) and lower oven temperatures (B). The contour lines help visualize interaction effects between A and B. Increasing A (flow rate) decreases Tf, whereas increasing B (oven temperature) slightly increases Tf. This 3D graph (fig. 6c) visualizes the interactive effects of two variables (A and B) on Tf, with CCC fixed. The curved surface in 3D plot demonstrates how changes in A and B interactively influence Tf. The lowest Tf values (blue regions) occur at higher A (flow rate) and lower B (oven temperature). The response surface also reflects the relative significance of the two variables, with A having a stronger effect than B. To summarize the effects of variables, higher flow rates reduce Tf, indicating a negative linear effect. Higher temperatures increase Tf, showing a positive linear effect. ACN concentration showed minimal effect on Tf, as observed in the perturbation plot and absence in the contour and 3D plots.
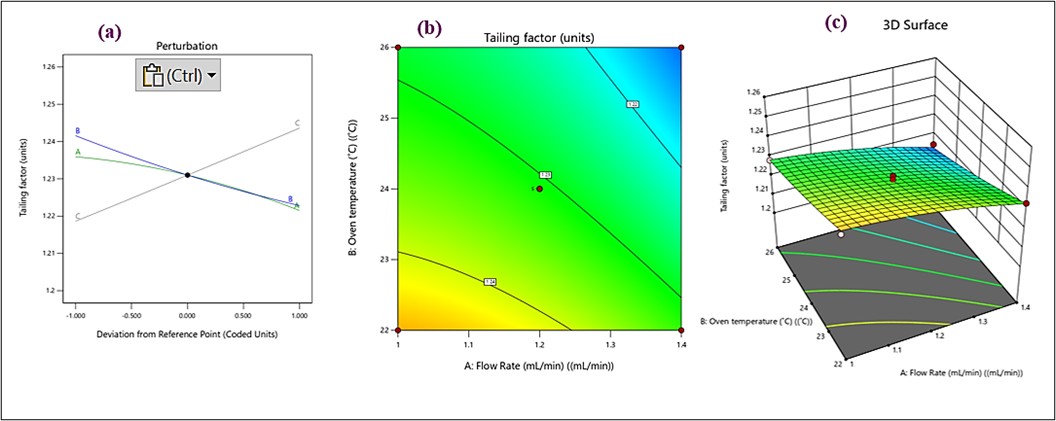
Fig. 6: (a) perturbation plot), (b) contour, and (c) 3D Response surface plots for tailing factor
Verification of software-generated optimized solution
The design space and the limitations placed on the variables were used in the experiment's optimizations (table 4). Such recommendations are accompanied by a solution with a maximum attractiveness of 0.948. A 50:50 v/v mixture of acetonitrile and 10 mmol phosphate buffer (pH 6.8) was used as the mobile phase in the devised RP-HPLC optimization method, with a flow rate of 1.043 ml/min. At this stage, the column's great efficiency was demonstrated by the approximately 0.948 desirability, 8.246-minute retention time, 1.214 tailing factor (Tf), and 13579.332 theoretical plates that were obtained using this approach. The whole range of oven temperatures, flow rate from 0.77 to 2.37 ml/min at 50% ACN concentration, and the established ranges of the components produced the desired results, which are shown in fig. 7a. The whole range of ACN contents at an oven temperature of 26 °C and a flow rate maintained between 0.77 and 2.37 ml/min is shown in fig. 7b. Within the 50–60% ACN concentration range, fig. 7c displays oven temperatures ranging from 20 to 36.1 °C and flow rates of 1.0426 ml/min.
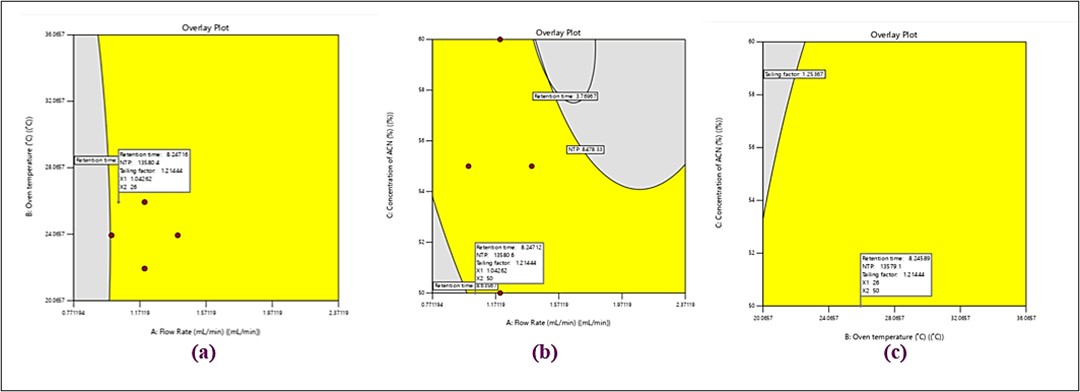
Fig. 7: An overlay plot showing the desired factor settings for the four chosen responses like (a) flow rate and oven temperature; (b) flow rate and concentration of ACN; (c) oven temperature and concentration of CAN
Table 4: limitations placed on both independent and dependent variables throughout the optimization process
| Name of variables | Goal | Lower limit | Upper limit |
| Independent variables | |||
| Flow rate | In range | 1.0 | 1.4 |
| Oven Temperature (℃) | In range | 24 | 26 |
| ACN concentration | Minimize | 50 | 60 |
| Dependant Variables | |||
| Retention Time | In range | 3.769672±0.003 | 8.63567±0.01 |
| Peak Area | In range | 201875±337.5 | 279691±453.6 |
| NTP | Maximize | 8478.33±4.72 | 13579.3±62.3 |
| Tailing Factor | Minimize | 1.20767±0.002 | 1.24967±0.001 |
Each value is represented as mean±SD; n = 3.
Validation of the optimized RP-HPLC method
The ICH Q2 (R1) criteria were followed to validate the best RP-HPLC technology. Selectivity, specificity, system appropriateness, linearity, limit of detection, limit of quantification, precision, accuracy, and robustness were among the metrics used [50, 51].
Selectivity and specificity
Interference by matrix elements
No additional peaks from extraneous components interfered with the regular IBR solution, according to the specificity tests fig. 8. The lack of any notable obstructive peaks at the IBR retention time (Rt) indicates the absence of interference.
Forced degradation studies
Stress testing was performed on the IBR under various harsh conditions, including acidic, basic, neutral, oxidative, thermal, and photolytic stress, as showed in table 5. These forced degradation studies aimed to explore a broad range of potential degradation pathways, not to optimize specific conditions. The studies were primarily qualitative or semi-quantitative, focusing on identifying the presence of degradation products rather than precisely measuring their quantities.
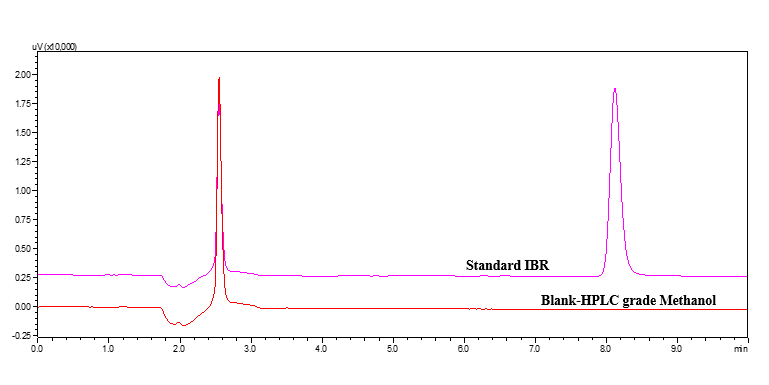
Fig. 8: Chromatogram of blank and IBR standard
Table 5: Forced degradation studies
| State | Stress parameters | Sample treatment | IBR retention time (min) |
| Reference | - | 8.12±0.00 | |
| Solution state | Acid hydrolysis | 0.1 N HCl; 8 h | Peak split |
| 1 N HCl; 8 h | Peak split | ||
| Base hydrolysis | 0.1 N NaOH; 8 h | 6.4±0.00 | |
| 1 N NaOH; 8 h | 6.1±0.00 | ||
| Oxidation | 3.0% H2O2; 8 h | 6.1±0.00 | |
| Neutral hydrolysis | Distilled water | 7.3±0.00 | |
| Solid state | Photodegradation | 8 h | 6.1±0.00 |
| Thermal degradation | 80 ˚C; 8 h | 6.1±0.00 |
Hydrolysis
Acid (0.1 and 1.0 N HCl): IBR is susceptible to acid hydrolysis, primarily affecting its core structure. The primary loss of activity was due to the hydrolysis of the piperidine ring. Also, oxidation of functional groups due to prolonged exposure to acidic conditions causes a split in the peak, leading to the degradation of IBR. Strongly acidic conditions lead to the cleavage of amide bonds. Both 0.1 N and 1 N HCl showed very little degradation at 4 °C, indicating that hydrolysis is temperature dependent. 1 N HCl exhibited moderate degradation at ambient temperature, but 0.1 N HCl displayed only minor degradation. Degraded peaks' retention time suggested structural changes. Both acid concentrations showed notable deterioration at 60 °C. The development of degradation products was indicated by the increasing intensity of new degradation peaks over time. IBR undergoes significant acid hydrolysis at elevated temperatures, increasing degradation at higher concentrations. The study establishes that a stability-indicating HPLC method can effectively separate degradation products from the parent compound (fig. 9).
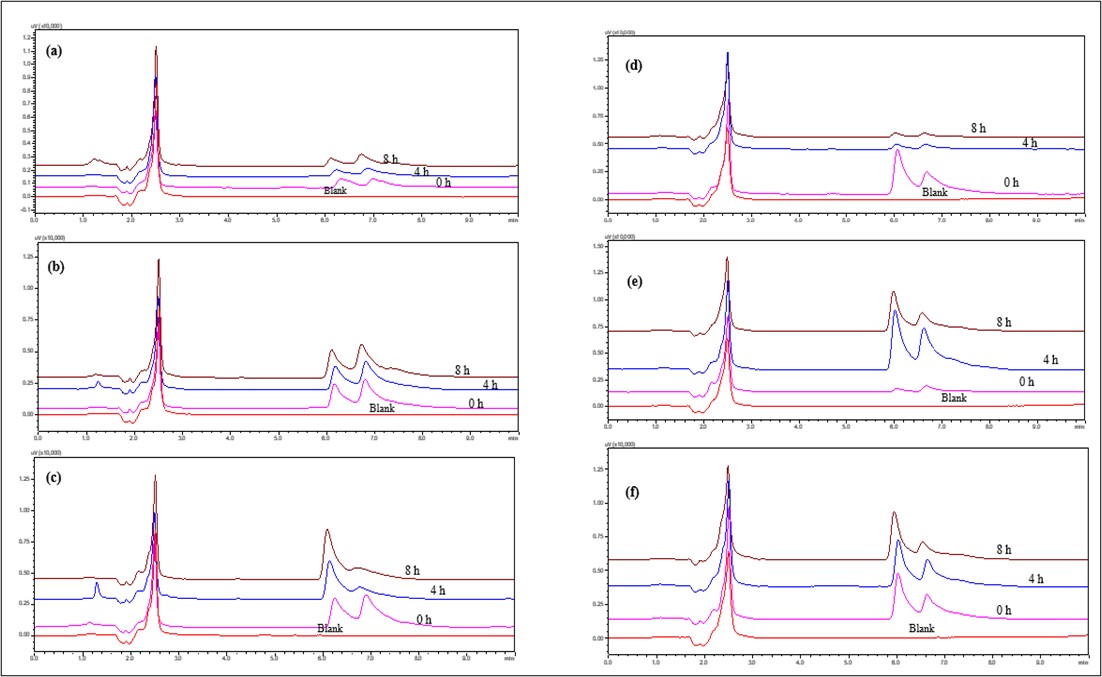
Fig. 9: Overlay of HPLC chromatograms of IBR when exposed to 1N and 0.1N Acid stress conditions (a) 0.1 N HCl at 4 ℃ (b) 0.1 N HCl at RT, (c) 0.1 N HCl at 60 °C, (d) 1 N HCl at 4 °C, (e) 1 N HCl at RT and (f) 1 N HCl at 60 °C
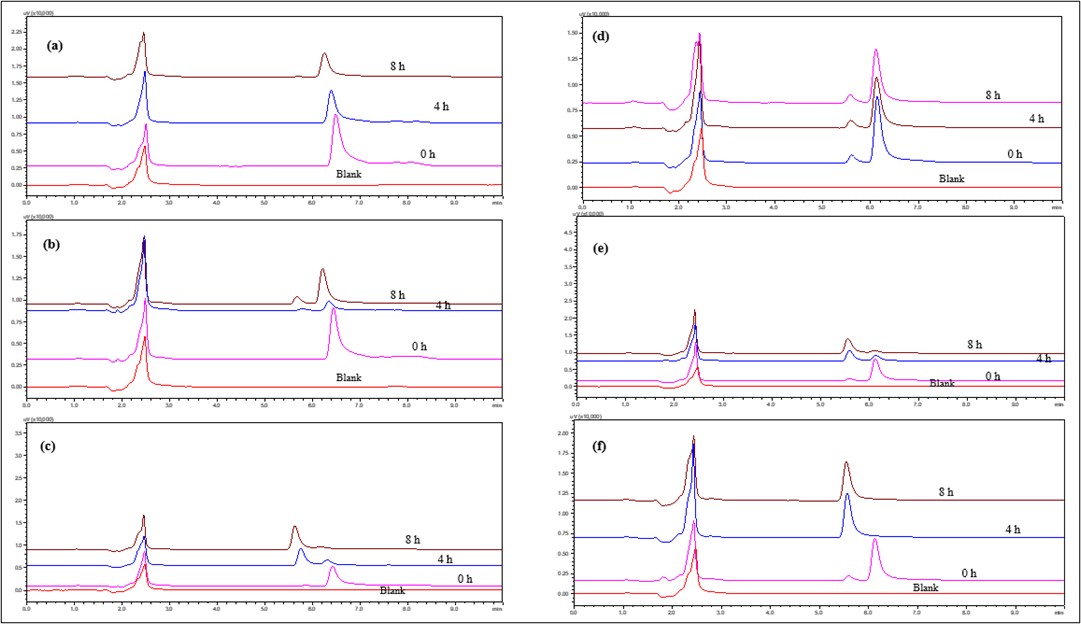
Fig. 10: Overlay of HPLC chromatograms of IBR when exposed to 1N and 0.1N Base stress conditions (a) 0.1 N NaOH at 4 °C (b) 0.1 N NaOH at RT, (c) 0.1 N NaOH at 60 °C, (d) 1 N NaOH at 4 °C, (e) 1 N NaOH at RT and (f) 1 N NaOH at 60 °C
Base (0.1 and 1.0 N NaOH)
IBR contains several functional groups, including an amide bond, a pyrrolopyrimidine core, and a piperidine moiety, which may undergo degradation under alkaline conditions. The key degradation pathways include amide hydrolysis, resulting in a decrease in the peak area of the parent compound, nucleophilic attack on the pyrrolopyrimidine core and oxidation of the piperidine ring. At 4 °C (cold condition), IBR with 0.1 N NaOH showed no significant degradation was observed and 1 N NaOH showed minor degradation detected after 8 h, indicating that alkaline hydrolysis is temperature dependent. At RT with 0.1 N NaOH showed slow degradation occurred over time, with slight peak broadening in HPLC and 1 N NaOH showed faster degradation with additional degradation peaks appearing at 8 h, indicating progressive hydrolysis. At 60 °C in case of 0.1 N NaOH followed moderate degradation observed within 4–8 h, with a decrease in parent peak intensity whereas 1 N NaOH observed significant degradation was observed within 1–2 h, indicating rapid amide bond hydrolysis and formation of multiple degradation products. In conclusion, IBR is susceptible to alkaline hydrolysis, especially at higher temperatures and in stronger NaOH concentrations. Degradation products were observed in 1 N NaOH at room temperature and 60 °C, with amide hydrolysis and core structure modification as the main degradation pathways (fig. 10).
Neutral hydrolysis
IBR in the presence of water, amides slowly hydrolyse to form a carboxylic acid and an amine derivative. Unlike acidic or alkaline conditions, neutral hydrolysis does not involve direct oxidation, but trace amounts of dissolved oxygen may contribute to minor oxidative degradation. This reaction is typically accelerated by heat, with minimal degradation at lower temperatures. At 4 °C, RT and 60 ℃, the HPLC chromatogram showed no significant additional peaks, but broadening of peak at the end of 8 h was seen as depicted in fig. 11. The extent of degradation was much lower compared to acidic or alkaline conditions, indicating that IBR is relatively stable in neutral water.
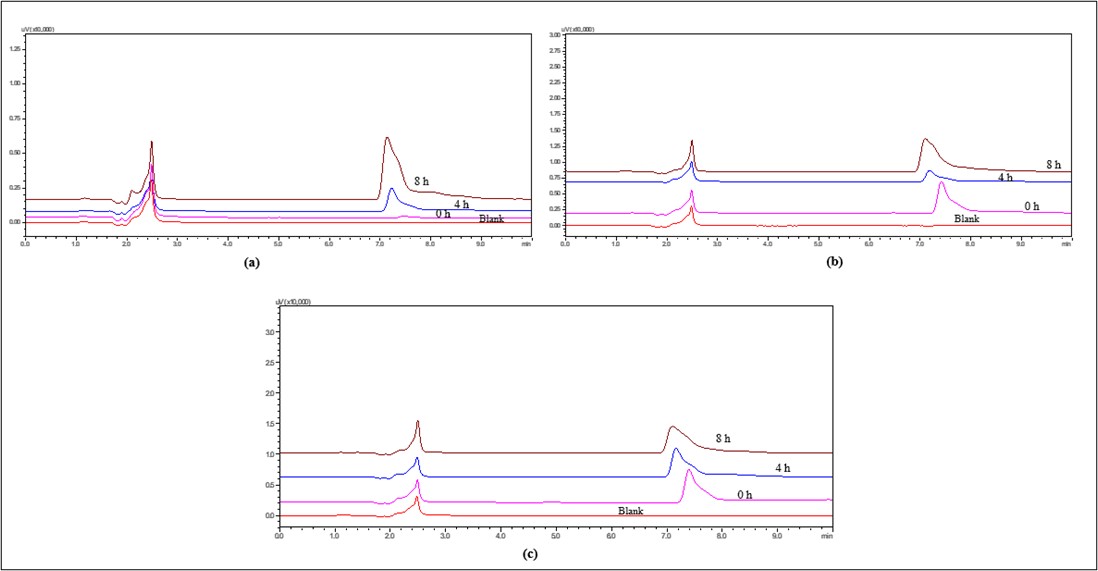
Fig. 11: Overlay of HPLC chromatograms of IBR when exposed to neutral stress conditions (a) IBR in Milli Q water at 4 °C (b) IBR in Milli Q water at RT and (c) IBR in Milli Q water at 60 °C

Fig. 12: Overlay of HPLC chromatograms of IBR when exposed to 3% H2O2 oxidation stress conditions (a) 3% H2O2 at 4 °C (b) 3% H2O2 at RT and (c) 3% H2O2 at 60 °C
Oxidation
IBR contains a pyrrolopyrimidine core, an amide bond, and a piperidine moiety, which may undergo oxidation. Hydrogen peroxide can attack the nitrogen in the piperidine ring, leading to N-oxide formation. This introduces a polar functional group, potentially altering the retention time in HPLC. At 4 °C, Rt, and 60 ℃ minimal to no degradation was observed within 8 h as seen in fig. 12. The HPLC chromatogram remained largely unchanged, with an increase in Tf and retention time shift.
Photodegradation
Photolytic degradation up to 8 h showed no significant degradation. The HPLC chromatogram showed a single sharp peak corresponding to intact IBR. After 8 H of sunlight exposure, a light reduction in the parent peak intensity and a shift in Rt were observed, as seen in fig. 13. No major additional peaks were detected.
Thermal degradation
The chromatogram of the samples of the drug exposed to hot temperatures showed that there was shift in rt and increased tailing was also observed, as depicted in fig. 14.
The forced degradation studies in this work have shown that Ibrutinib is especially sensitive to acid, base, and oxidative conditions, wherein significant degradation occurred under those stresses, which is consistent with its known chemical instability in harsh conditions. The compound showed good stability under thermal, humidity, and photolytic conditions, confirming the robustness of the drug in storage and handling conditions. In comparison to previous studies, this approach offers a more thorough and interference-free stability-indicating profile where all degradation products and placebo components were well-resolved from the main peak, further validating the method's specificity, and suitability for regulatory submissions [15].
System suitability
System suitability was established by six replicate analyses of a single standard solution. No significant differences were observed in the critical analytical attributes (CAAs). The relative standard deviations (RSDs) for retention time, peak area, tailing factor at 5% and 10%, peak height, and theoretical plate number were all within acceptable limits (fig. 15).
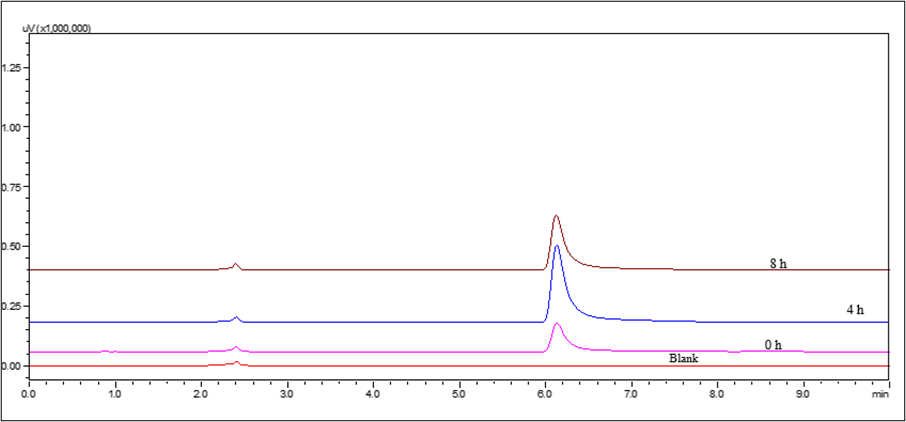
Fig. 13: HPLC chromatograms of IBR when exposed to photodegradation stress conditions
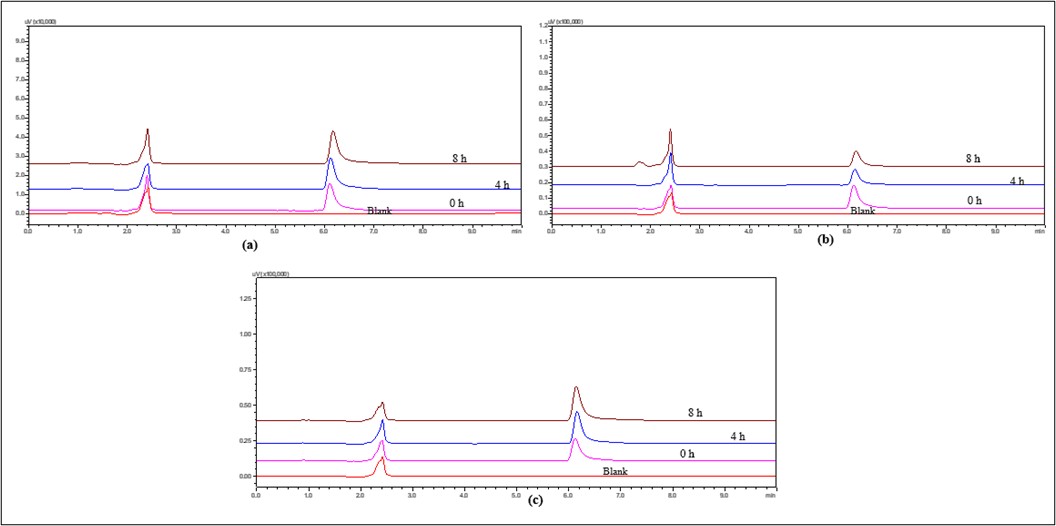
Fig. 14: Overlay of HPLC chromatograms of IBR when exposed to thermal degradation stress conditions (a) at 4 °C (b) at RT and (c) at 60 °C
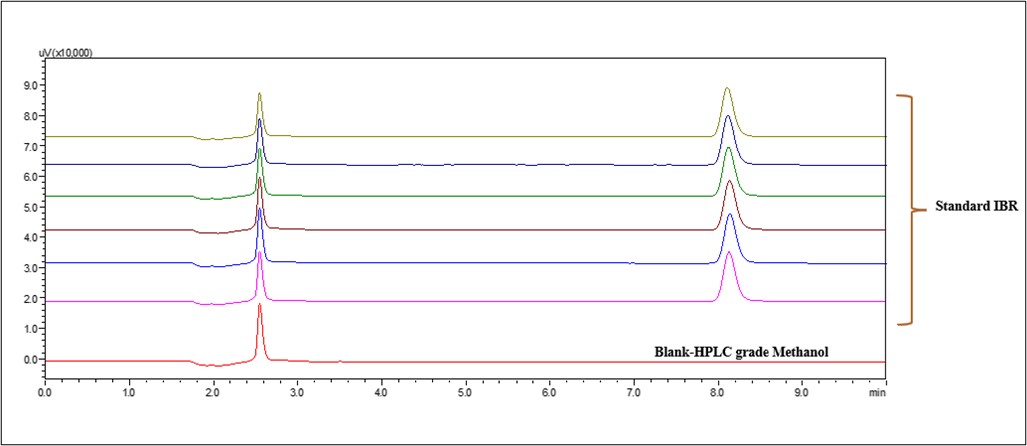
Fig. 15: System suitability study of standard IBR
Table 6: Validation parameters of optimized analytical method
| Validation parameters | |||||||
| (a) System suitability parameters of IBR | |||||||
| S. No. | Parameter | Average±SD (n=6) | % RSD | ||||
| 1 | Analyte peak area (mV-min) | 171500.66±324.94 | 0.18 | ||||
| 2 | RT (min) | 8.12±0.011 | 0.14 | ||||
| 3 | NTP (per column length) | 13505±19.9 | 0.14 | ||||
| 4 | TF (5%) | 1.21±0.00 | 0.1 | ||||
| 5 | TF (10%) | 1.11±0.00 | 0.08 | ||||
| (b) Linearity (acceptance criteria: Correlation coefficient-0.999) | |||||||
| Linearity range | 50-5000 ng/ml | ||||||
| Correlation coefficient (r2) | 0.9997 | ||||||
| Regression equation | y=34.384x-1222.6 | ||||||
| (c) LOD and LOQ | |||||||
| LOD | 4.74 ng/ml | LOQ | 15.8 ng/ml | ||||
| (d) Precision (RSD<2%) | |||||||
| Inter-day precision | Intra-day Precision | ||||||
| Peak area (mV-min) | Peak area (mV-min) | ||||||
| 150 ng/ml | 3000 ng/ml | 4000 ng/ml | 150 ng/ml | 3000 ng/ml | 4000 ng/ml | ||
| Mean±SD (n =12) | 3134.25±15.99 | 68411±203.39 | 92547±226.49 | Mean±SD (n =12) | 3152.5±18.16 | 68273±293.57 | 92204.57±759.49 |
| % RSD | 0.55 | 0.29 | 0.24 | % RSD | 0.57 | 0.29 | 0.82 |
| (e) Accuracy (% Recovery 98-102%; % RSD of recovery concentrations must be<2%) | |||||||
| % Level | Spiked concentration (ng/ml) | Peak area (mV-min) (Mean±SD; n=3) | Recovered concentration (ng/ml) (Mean±SD; n=3) | % Recovery | |||
| Reference | Test | Reference | Test | Reference | Test | ||
| mean ±SD (n =3) | % RSD | ||||||
| 75 | 1875 | 37959.33±397.6 | 37657±454 | 1846.87±19.3 | 1839.52±20.22 | 98.48±1.03 | 0.01 |
| 100 | 2500 | 50666±449 | 50913.3±525.4 | 2464.51±21.8 | 2476.53±25.5 | 98.58±0.87 | 0.008 |
| 125 | 3125 | 64271.7±79.85 | 64060.2±303 | 3125.84±3.8 | 3115.56±14.73 | 100±0.12 | 0.001 |
| (f) Robustness (RSD<2%) | |||||||
| Parameter | Level | Retention time (min) | Peak area (mV-min) | ||||
| mean ±SD (n =3) | %RSD | mean ±SD (n =3) | %RSD | ||||
| Concentration of ACN | 52 | 8.547±0.004 | 0.05 | 99289.3±237.8 | 0.23 | ||
| 48 | 6.952±0.002 | 0.02 | 100179±126.9 | 0.12 | |||
| Column Oven Temperature | 22 ℃ | 7.97±0.009 | 0.12 | 99651±162.5 | 0.16 | ||
| 28 ℃ | 7.94±0.003 | 0.04 | 98953.8±285.12 | 0.28 | |||
| Flow rate | 1.1 ml/min | 8.82±0.002 | 0.02 | 109192±248.8 | 0.22 | ||
| 1.3 ml/min | 7.309±0.002 | 0.02 | 90752.2±171.02 | 0.18 | |||
| Wavelength | 258 nm | 7.97±0.002 | 0.03 | 98850.3±155.4 | 0.15 | ||
| 262 nm | 7.96±0.001 | 0.01 | 98159±232.1 | 0.23 | |||
| injection Volume | 8 µl | 7.96±0.005 | 0.06 | 79309±296 | 0.37 | ||
| 12 µl | 7.58±0.93 | 0.12 | 119205±545.2 | 0.45 | |||
| Phosphate Buffer pH | 6.2 pH | 8.33±0.02 | 0.25 | 80584.7±282.6 | 0.35 | ||
| 7.3 pH | 8.3±0.03 | 0.45 | 83297.2±346.5 | 0.44 | |||
Each value is represented as mean±SD; n = 6.
Linearity
Method linearity demonstrates the relationship between analyte concentration and instrument response. IBR's calibration curve exhibited linearity across the tested range of 50 ng/ml to 5000 ng/ml. Regression analysis yielded the equation y = 34.384x –1222.6, with a coefficient of determination (R²) of 0.9997, confirming the excellent linearity shown in table 6.
LOD and LOQ
The LOD and LOQ were calculated using the slope of the calibration curve, a 260 nm detection wavelength, and a 10 µl** injection volume. The findings in table 7 showed a LOQ of 4.74 ng/ml and a LOD of 15.8 ng/ml.
Precision
A precision study was conducted to determine the reproducibility of consecutive measurements of identical samples under identical analytical conditions. High repeatability was demonstrated by the same-day precision samples' relative standard deviations (%RSD) of the peak area, all of which were less than 1%. The three concentration levels of 100, 1500, and 3000 ng/ml were used to assess the intra-day and inter-day precision. The method's reliability and reproducibility were confirmed because the calculated percentage RSD values were within the predetermined acceptable criteria of ≤1% for intra-day accuracy and ≤2% for inter-day precision (table 6 and fig. S11).
Accuracy
Accuracy measures how closely experimental results match the true value. Recovery quantifies the amount of analyte retrieved during sample preparation, expressed as a percentage of the expected amount. In this study, accuracy was assessed by evaluating recovery at three concentration levels (75%, 100%, and 125%). The percent recovery was within ±3% for all levels (table 6 and fig. S12).
Robustness
Robustness of the method tests the stability of an analytical method by determining its performance under small, intentional variations in critical parameters. The sample analysis with the optimized method, with minor intentional changes, gave %RSD values below 1% for both peak area and tailing factor. These results validate the robustness and reliability of the method, showing its consistency under minor variations in analytical conditions (table 6 and fig. S5-S10).
Applicability of the developed RP-HPLC method
Characterization and drug content of IBR-loaded nanocarriers
The IBR nanocarriers exhibited an 84.713±0.648% drug content value, indicating their efficient drug loading and stability. These factors provide for increased therapeutic efficacy and pharmaceutical formulation development.
In vitro drug release study
The dialysis bag approach was used to ascertain the IBR nanocarriers' in vitro release profile [52]. The release rate of the hybrid nanocarriers loaded with IBR was 76.69% at 48 h, while for pure IBR solution, it was significantly lower at 37.86% at the same time. This increased release by hybrid nanoparticles is due to decreased crystallinity of IBR and nano-sized drug particles, thus increasing the surface area for dissolution. When nanoscale particles are exposed to the solubilizing solvent, their large surface area becomes hydrophilic, enabling fast conversion to an aqueous solution. The drug release data were modelled using different mathematical models, as represented in table 8, to get insight into the release mechanism. The hybrid nanoparticles' release kinetics conformed to the first-order release model with a very high correlation coefficient (r²=0.9228), showing that the release is dependent on concentration. Further, the Higuchi model gave an 'r2' value of 0.9745, indicating that the drug release follows Fickian diffusion from the matrix where the drug is diffusion is dependent on the concentration gradient, as shown in fig. 16. The in vitro release data were fitted to the Korsmeyer-Peppas model with an n value of 0.61. This indicates anomalous transport, which means the drug release process involves a combination of Fickian diffusion and polymer relaxation or swelling [53]. This behaviour is expected for nanocarrier systems due to the double effect of nanocarrier stretching and expulsion through Fickian diffusion governing the overall drug release.
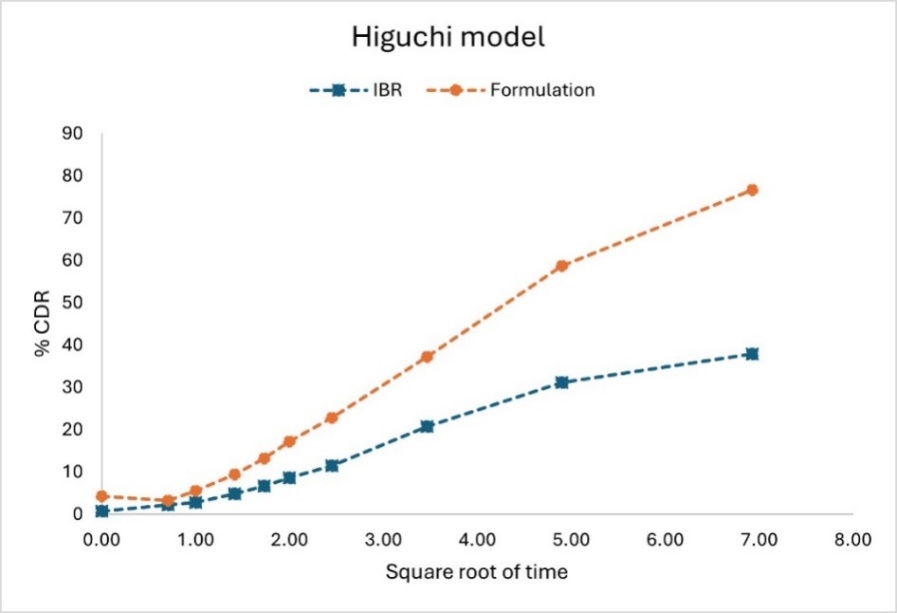
Fig. 16: Higuchi kinetic model depicting drug release of IBR suspension and PLHNs nanosuspension
Table 7: Drug release kinetic analysis by fitting the in vitro release data
| Release model equation | Coefficient of correlation (r2) and diffusion exponent (n-value) | |||
| Standard IBR | IBR-PHHNs | |||
| r2 value | n-value | r2 value | n-value | |
| Zero-order kinetics (Qo-Qt=kt) | 0.8938 | - | 0.9699 | - |
| First order kinetics (ln Qt = ln Qo+kt) | 0.9228 | - | 0.9905 | - |
| Higuchi model (Qo-Qt=kt1/2) | 0.9745 | - | 0.9770 | - |
| Korsmeyer-Peppas (Qo-Qt = (log k+n log t) | 0.9024 | 0.41 | 0.8416 | 0.61 |
| Hixson-Crowell (Qo1/3-Qt1/3=kst) | 0.9135 | - | 0.9745 | - |
CONCLUSION
In this work, a sensitive and systematic RP-HPLC methodology was formulated and thoroughly validated to determine IBR in bulk and hybrid nanoformulations accurately. A DoE approach was utilized to improve the analytical method, which provided a systematic and data-oriented optimization process. Particularly, the Taguchi orthogonal array was employed to screen and determine CMPs to allow efficient selection of contributing factors that impact chromatographic performance. Afterward, the BBD was applied to fine-tune and optimize chromatographic conditions for enhanced resolution, sensitivity, and robustness. The validated RP-HPLC procedure was subjected to stringent validation based on ICH guidelines to ascertain its accuracy, precision, sensitivity, specificity, linearity, and robustness. Forced degradation studies were also performed under diverse stress conditions, such as hydrolytic, oxidative, photolytic, and thermal degradation, to check the stability-indicating capability of the method and its ability to detect potential degradation products of IBR.
ACKNOWLEDGMENT
The authors thank Manipal College of Pharmaceutical Sciences, Manipal Academy of Higher Education, Manipal, India, for providing scholarships and the necessary facilities to Pragathi Devanand Bangera. The authors thank SP Accure Laboratories PVT. Ltd. for providing the grant to procure the necessary materials for conducting the experiment. We also thank Hetero Labs for providing ibrutinib.
FUNDING
This work was supported by the Manipal College of Pharmaceutical Sciences, Manipal Academy of Higher Education, Manipal and SP Accure Labs Pvt. Ltd.
AUTHORS CONTRIBUTIONS
Conceptualization-Mahalaxmi Rathnanand, Pragathi Devanand Bangera; Methodology-Mahalaxmi Rathnanand, Pragathi Devanand Bangera, Mahesha Keerikkadu, Vamshi Krishna Tippavajhala; Validation-Mahalaxmi Rathnanand, Pragathi Devanand Bangera; Writing-original draft preparation-Pragathi Devanand Bangera; Writing-review and editing-Mahalaxmi Rathnanand, Pragathi Devanand Bangera; Supervision-Mahalaxmi Rathnanand.
CONFLICT OF INTERESTS
The authors declare that they have no known competing financial interests or personal relationships that could have appeared to influence the work reported in this paper.
REFERENCES
Kaur V, Swami A. Ibrutinib in CLL: a focus on adverse events, resistance and novel approaches beyond ibrutinib. Ann Hematol. 2017 Jul;96(7):1175-84. doi: 10.1007/s00277-017-2973-2, PMID 28342031.
Ran F, Liu Y, Wang C, Xu Z, Zhang Y, Liu Y. Review of the development of BTK inhibitors in overcoming the clinical limitations of ibrutinib. Eur J Med Chem. 2022 Feb 5;229:114009. doi: 10.1016/j.ejmech.2021.114009, PMID 34839996.
Szklener K, Michalski A, Zak K, Piwonski M, Mandziuk S. Ibrutinib in the treatment of solid tumors: current state of knowledge and future directions. Cells. 2022 Jan;11(8):1338. doi: 10.3390/cells11081338, PMID 35456016.
Rizwanullah M, Alam M, Harshita MSR, Mir SR, Rizvi MM, Amin S. Polymer lipid hybrid nanoparticles: a next-generation nanocarrier for targeted treatment of solid tumors. Curr Pharm Des. 2020 Apr 24;26(11):1206-15. doi: 10.2174/1381612826666200116150426, PMID 31951163.
Elkady EF, Fouad MA, Mozayad AN. Application of box-behnken experimental design and response surface methodology for selecting the optimum RP-HPLC conditions for the simultaneous determination of methocarbamol indomethacin and betamethasone in their pharmaceutical dosage form. BMC Chem. 2022 Dec 12;16(1):114. doi: 10.1186/s13065-022-00908-9, PMID 36510282.
Kokilambigai KS, Lakshmi KS. Analytical quality by design-assisted RP-HPLC method for quantifying atorvastatin with green analytical chemistry perspective. J Chromatogr Open. 2022 Nov 1;2:100052. doi: 10.1016/j.jcoa.2022.100052.
Kannaiah KP, Chanduluru HK, Obaydo RH, Lotfy HM, Erk N, Krishnan M. Application of advanced environmentally benign assessment tools in determining ternary cardiovascular drug combination by RP-HPLC with analytical quality by design: application to stability indicating method evaluation. Sustain Chem Pharm. 2023 Oct 1;35:101197. doi: 10.1016/j.scp.2023.101197.
Borman P, Chatfield M, Nethercote P, Thompson D, Truman K. The application of quality by design to analytical methods. Pharm Technol. 2007;31(10):142-8.
Sathishbabu P, Hani U, Shakeela C, Hemanth Vikram PR, Ghazwani M, Osmani RA. A novel RP-HPLC method development and validation for simultaneous quantification of gefitinib and resveratrol in polymeric hybrid lipid nanoparticles and glioma cells. J Chromatogr B Analyt Technol Biomed Life Sci. 2022 Dec 1;1212:123483. doi: 10.1016/j.jchromb.2022.123483, PMID 36279777.
Prajapati P, Patel A, Desai A, Shah P, Shakar Pulusu V, Shah S. Comprehensive strategy of white analytical chemistry and analytical quality by design to sensitive spectrofluorimetric method for in vitro drug release kinetic study of Ibrutinib-loaded nanostructured lipid carriers for leukemia via lymphatic targeting. Microchem J. 2024 Mar 1;198:110147. doi: 10.1016/j.microc.2024.110147.
Akbel E, Gungor S, Bulduk I. Alternative analytical methods for ibrutinib quantification in pharmaceutical formulation: a statistical comparison. Rev Anal Chem. 2022 Jan 1;41(1):146-57. doi: 10.1515/revac-2022-0039.
Garcia Cansino L, Boltes K, Marina ML, Garcia MA. Enantioseparation and ecotoxicity evaluation of ibrutinib by electrokinetic chromatography using single and dual systems. Talanta. 2023 Dec 1;265:124783. doi: 10.1016/j.talanta.2023.124783, PMID 37348354.
Albuquerque LF, Souto MV, Saldanha Araujo F, Carvalho JL, Gratieri T, Cunha-Filho M. Development and validation of a chromatographic method for ibrutinib determination in human and porcine skin. Chemistry. 2024;6(2):272-82. doi: 10.3390/chemistry6020014.
Chatki PK, Mahajan UN. Eco-friendly liquid chromatography method for the quantification of ibrutinib in a pharmaceutical dosage form. Biomed Chromatogr. 2024 Feb;38(2):e5792. doi: 10.1002/bmc.5792, PMID 38017613.
Konduru N, Gundla R, Katari NK, Paidikondala K, Reddy AS, Jagadabi V. Development and validation of a stability indicating method for Ibrutinib: identification and separation of degradation products known and genotoxic impurities using RP-HPLC/PDA and QDa mass detectors. Anal Chem Lett. 2020;10(1):113-36. doi: 10.1080/22297928.2019.1673814.
Shamim A, Ansari MJ, Aodah A, Iqbal M, Aqil M, Mirza MA. QbD-engineered development and validation of a RP-HPLC method for simultaneous estimation of Rutin and ciprofloxacin HCl in Bilosomal nanoformulation. ACS Omega. 2023 Jun 20;8(24):21618-27. doi: 10.1021/acsomega.3c00956, PMID 37360463.
Ettaboina SK, Katakam LN, Dongala T. Development and validation of a stability indicating RP-HPLC method for the determination of erythromycin related impurities in topical dosage form. Pharm Chem J. 2022 Apr 1;56(1):131-7. doi: 10.1007/s11094-022-02610-5.
Pereira FJ, Rodriguez Cordero A, Lopez R, Robles LC, Aller AJ. Development and validation of an RP-HPLC-PDA method for determination of paracetamol caffeine and tramadol hydrochloride in pharmaceutical formulations. Pharmaceuticals (Basel). 2021 May;14(5):466. doi: 10.3390/ph14050466, PMID 34063393.
Bhatt DA, Rane SI. QbD approach to analytical RP-HPLC method development and its validation. Int J Pharm Pharm Sci. 2011;3(1):179-87.
Patel KY, Dedania ZR, Dedania RR, Patel U. QbD approach to HPLC method development and validation of ceftriaxone sodium. Futur J Pharm Sci. 2021 Dec;7(1):141. doi: 10.1186/s43094-021-00286-4.
Kelani KM, Elzanfaly ES, Saad AS, Halim MK, El Zeiny MB. Different greenness assessment perspectives for stability indicating RP-HPLC method used for the assay of isoxsuprine hydrochloride and four nephrotoxic and hepatotoxic photothermal degradation products. Microchem J. 2021 Dec 1;171:106826. doi: 10.1016/j.microc.2021.106826.
Alam P, Shakeel F, Taleuzzaman M, Foudah AI, Alqarni MH, Aljarba TM. Box-behnken design (BBD) application for optimization of chromatographic conditions in RP-HPLC method development for the estimation of thymoquinone in Nigella sativa seed powder. Processes. 2022 Jun;10(6):1082. doi: 10.3390/pr10061082.
Salwa KL, Kumar L. Quality by design driven analytical method (AQbD) development and validation of HPLC–UV technique to quantify rivastigmine hydrogen tartrate in lipidic nanocarriers: forced degradation and assessment of drug content and in vitro release studies. Microchem J. 2023 Oct 1;193:108944. doi: 10.1016/j.microc.2023.108944.
Beg S, Hasnain MS, Rahman M, Swain S. Introduction to quality by design (QbD): fundamentals principles and applications. In: Pharmaceutical quality by design. Amsterdam: Elsevier; 2019. p. 1-17. doi: 10.1016/B978-0-12-815799-2.00001-0.
Maddala SM, Parimi R, Elvina PK. A quality by design (QbD) strategy for developing and validating droxidopa in API and formulation using an RP-HPLC procedure ensuring regulatory compliance. Anal Chem Lett. 2025;15(2):328-48. doi: 10.1080/22297928.2024.2446893.
Deidda R, Orlandini S, Hubert P, Hubert C. Risk based approach for method development in pharmaceutical quality control context: a critical review. J Pharm Biomed Anal. 2018 Nov 30;161:110-21. doi: 10.1016/j.jpba.2018.07.050, PMID 30145448.
De Baere S, Eeckhaut V, Steppe M, De Maesschalck C, De Backer P, Van Immerseel F. Development of a HPLC–UV method for the quantitative determination of four short chain fatty acids and lactic acid produced by intestinal bacteria during in vitro fermentation. J Pharm Biomed Anal. 2013 Jun 1;80:107-15. doi: 10.1016/j.jpba.2013.02.032, PMID 23542733.
Marques SM, Salwa KL, Kumar L. Quality by design-based development of an eco-friendly HPLC method for the estimation of nisoldipine in nanoformulations: forced degradation studies and in vitro release studies. Sustain Chem Pharm. 2023 Dec 1;36:101254. doi: 10.1016/j.scp.2023.101254.
Miriam Marques S, Shirodkar RK, Kumar L. Analytical quality by design paradigm in development of a RP-HPLC method for the estimation of cilnidipine in nanoformulations: forced degradation studies and mathematical modelling of in vitro release studies. Microchem J. 2023 Oct 1;193:109124. doi: 10.1016/j.microc.2023.109124.
Afzal M, Muddassir M, Alarifi A, Ansari MT. Box-behnken assisted validation and optimization of an RP-HPLC method for simultaneous determination of domperidone and lansoprazole. Separations. 2021 Jan;8(1):5. doi: 10.3390/separations8010005.
Alruwaili NK. Analytical quality by design approach of reverse phase high performance liquid chromatography of atorvastatin: method development optimization validation and the stability indicated method. Int J Anal Chem. 2021;2021(1):8833900. doi: 10.1155/2021/8833900, PMID 33628253.
Recber T, Timur SS, Erdogan Kablan S, Yalçın F, Karabulut TC, Neslihan Gursoy R. A stability indicating RP-HPLC method for determination of the COVID-19 drug molnupiravir applied using nanoformulations in permeability studies. J Pharm Biomed Anal. 2022 May 30;214:114693. doi: 10.1016/j.jpba.2022.114693, PMID 35276385.
Kowalska M, Wozniak M, Kijek M, Mitrosz P, Szakiel J, Turek P. Management of validation of HPLC method for determination of acetylsalicylic acid impurities in a new pharmaceutical product. Sci Rep. 2022;12(1):1. doi: 10.1038/s41598-021-99269-x, PMID 34992227.
Annadi MA, Zahar NME, Abdel Sattar NEDA, H Mohamed E, A Mahmoud S, S Attia M. Development and validation of molnupiravir assessment in bulk powder and pharmaceutical formulation by the RP-HPLC-UV method. RSC Advances. 2022;12(53):34512–9.
Ramanunny AK, Wadhwa S, Gulati M, Gupta S, Porwal O, Jha NK. Development and validation of RP-HPLC method for 1-Acetoxychavicol acetate (ACA) and its application in optimizing the yield of ACA during its isolation from Alpinia galanga extract as well as its quantification in nanoemulsion. S Afr J Bot. 2022 Sep 1;149:887-98. doi: 10.1016/j.sajb.2021.10.012.
Kumar G, Mullick P, Nandakumar K, Mutalik S, Rao CM. Box–behnken design-based development and validation of a reverse-phase HPLC analytical method for the estimation of paclitaxel in cationic liposomes. Chromatographia. 2022 Jul 1;85(7):629-42. doi: 10.1007/s10337-022-04172-w.
Mozayad AN, Fouad MA, Elkady EF. Utilizing experimental design and desirability function in optimizing RP-HPLC method for simultaneous determination of some skeletal muscle relaxants and analgesics. Sci Rep. 2024 May 6;14(1):10360. doi: 10.1038/s41598-024-58381-4, PMID 38710733.
Bedogni G, Azcarate F, Seremeta K, Okulik N, Salomon C, Boschetti C. Development of a fast RP-HPLC method for the separation of nifurtimox and its forced degradation products through a design of experiment approach. J Mol Liq. 2024 Apr 1;399:124293. doi: 10.1016/j.molliq.2024.124293.
Reddy Gopireddy R, Maruthapillai A, Mahapatra S, Tamilselvi M. Development and validation of HPLC method for enantioseparation of Ibrutinib on immobilized chiral stationary phase. Mater Today Proc. 2022 Jan 1;50:384-7. doi: 10.1016/j.matpr.2021.08.358.
Al Hakkani MF, Ahmed N, Abbas AA, Hassan MH. Cefoperazone rapidly and sensitive quantitative assessment via a validated RP-HPLC method for different dosage forms in use stability and antimicrobial activities. BMC Chem. 2023 Jul 12;17(1):72. doi: 10.1186/s13065-023-00989-0, PMID 37438790.
Sen S, Ranjan OP. A quality by design (QbD) driven gradient high-performance liquid chromatography method development for the simultaneous estimation of dasatinib and nilotinib in lipid nanocarriers. J Chromatogr B Analyt Technol Biomed Life Sci. 2024 Aug 1;1243:124229. doi: 10.1016/j.jchromb.2024.124229, PMID 38991258.
Anwer MK, Ali EA, Iqbal M, Ahmed MM, Aldawsari MF, Saqr AA. Development of sustained-release baricitinib-loaded lipid polymer hybrid nanoparticles with improved oral bioavailability. Molecules. 2021;27(1):168. doi: 10.3390/molecules27010168, PMID 35011397.
Khan MA, Khan S, Kazi M, Alshehri SM, Shahid M, Khan SU. Norfloxacin-loaded lipid polymer hybrid nanoparticles for oral administration: fabrication characterization in silico modelling and toxicity evaluation. Pharmaceutics. 2021;13(10):1632. doi: 10.3390/pharmaceutics13101632, PMID 34683925.
RR. Stability indicating RP-HPLC method development and validation for the analysis of doxepin hydrochloride in bulk and pharmaceutical dosage form. Int J Pharm Pharm Sci. 2024 Apr 1;16(4):27-35. doi: 10.22159/ijpps.2024v16i4.50126.
Du M, Ouyang Y, Meng F, Zhang X, Ma Q, Zhuang Y. Polymer lipid hybrid nanoparticles: a novel drug delivery system for enhancing the activity of Psoralen against breast cancer. Int J Pharm. 2019 Apr 20;561:274-82. doi: 10.1016/j.ijpharm.2019.03.006, PMID 30851393.
Katolkar P, Jaiswal S. Analytical method development and validation for the estimation of cyamemazine tartrate in formulation by RP-HPLC with stability indicating. Asian J Pharm Clin Res. 2022 Sep 7;15(9):28-32. doi: 10.22159/ajpcr.2022.v15i9.45154.
Saini S, Sharma T, Patel A, Kaur R, Tripathi SK, Katare OP. QbD-steered development and validation of an RP-HPLC method for quantification of ferulic acid: rational application of chemometric tools. J Chromatogr B Analyt Technol Biomed Life Sci. 2020 Oct 15;1155:122300. doi: 10.1016/j.jchromb.2020.122300, PMID 32771967.
Ibrahim AM, Hendawy HA, Hassan WS, El Sayed HM, Shalaby A. Response surface and tolerance analysis approach for optimizing HPLC method. Microchem J. 2019 May 1;146:220-6. doi: 10.1016/j.microc.2019.01.007.
Alam P, Noman OM, Herqash RN, Almarfadi OM, Akhtar A, Alqahtani AS. Response surface methodology (RSM)-based optimization of ultrasound-assisted extraction of sennoside A, sennoside B, aloe-emodin, emodin, and chrysophanol from Senna alexandrina (Aerial Parts): HPLC-UV and antioxidant analysis. Molecules. 2022 Jan;27(1):298. doi: 10.3390/molecules27010298, PMID 35011528.
Prajapati P, Rana B, Pulusu VS, Mishra A. Multipurpose RP-HPLC method for simultaneous estimation of fixed dose combinations of anti-diabetic drugs: integrating green economical and robust approaches with design of experiments and white analytical chemistry. Chem Afr. 2024 Apr 1;7(3):1385-400. doi: 10.1007/s42250-023-00835-9.
Saha M, Gupta A, Shetty S, Mutalik S, Nandakumar K, Raghu Chandrashekar H. DoE-aided optimization of RP-HPLC method for simultaneous estimation of amoxicillin and tinidazole loaded mucoadhesive GRDDS formulation for the treatment of H. pylori. Chromatographia. 2024 Sep 1;87(9):533-48. doi: 10.1007/s10337-024-04346-8.
Kumar P, Mangla B, Beg S, Afzal O, Saleh Alfawaz Altamimi A, Almalki WH. Optimization and validation of stability indicating RP-HPLC method for the quantification of gefitinib in bulk drug and nanoformulations: an application towards in vitro and ex vivo performance evaluation. Arab J Chem. 2022 Dec 1;15(12):104333. doi: 10.1016/j.arabjc.2022.104333.
Imam SS, Alshehri S, Altamimi MA, Hussain A, Qamar W, Gilani SJ. Formulation of piperine chitosan-coated liposomes: characterization and in vitro cytotoxic evaluation. Molecules. 2021;26(11):3281. doi: 10.3390/molecules26113281, PMID 34072306.